Abstract
The species belonging to the genus Medicago are considered a very important genetic resource at global level both for planet’s food security and for sustainable rangelands management. The checklist of the Italian flora (2021) includes a total number of 40 Medicago species for Italy, and 27 for Campania region, with a number of doubtful records or related to species no more found in the wild. In this study, 10 Medicago species native to Campania region, and one archaeophyte (M. sativa), identified by means of morphological diagnostic characters, were analyzed in a blind test to assay the efficacy of nine microsatellite markers (five cp-SSRs and four n-SSRs). A total number of 33 individuals from 6 locations were sampled and genotyped. All markers were polymorphic, 40 alleles were obtained with n-SSRs ranging from 8–12 alleles per locus with an average of 10 alleles per marker, PIC values ranged from 0.672 to 0.847, and the most polymorphic SSR was MTIC 564. The cp-SSRs markers were highly polymorphic too; PIC values ranged from 0.644 to 0.891 with an average of 0.776, the most polymorphic cp-SSR was CCMP10. 56 alleles were obtained with cp-SSRs ranging from 7 to 17 alleles per locus with an average of 11. AMOVA analysis with n-SSR markers highlighted a great level of genetic differentiation among the 11 species, with a statistically significant fixation index (FST). UPGMA clustering and Bayesian-based population structure analysis assigned these 11 species to two main clusters, but the distribution of species within clusters was not the same for the two analyses. In conclusion, our results demonstrated that the combination of the used SSRs well distinguished the 11 Medicago species. Moreover, our results demonstrated that the use of a limited number of SSRs might be considered for further genetic studies on other Medicago species.
1. Introduction
Fabaceae, the third-largest Angiosperm family with 751 genera and 19,400 species [1], is a highly diversified plant family and features many economically important crops, ranging from food crops to fodder species. It provides about one-third of protein for human consumption and a wide range of raw materials for industries [2]. Legumes are able to improve soil fertility by fixing atmospheric nitrogen through symbiotic bacteria (Rhizobium) and have an important role in the global nitrogen cycle [3,4,5,6].
Among the six legumes subfamilies, Papilionoideae is the richest for number of species and the most studied one, embodying 476 genera and 13,860 species [2,7,8,9,10,11]. In this subfamily, the genus Medicago is arguably one of the most common in Mediterranean and warm-temperate grassland and shrubland, featuring 14 sections and 87 species, including annual and perennial species [4,12,13]. It shows a great species diversity and excellent prospects for breeding and to enhance provision of high quality winter fodder resources. In the Mediterranean basin, Medicago species can be used as useful pioneer plants for the improvement of marginal land [14,15]. In addition to producing good quality fodder [16], Medicago annual species are self-sowing and therefore very valuable in crop rotations with cereals, in low input arid farming systems. Moreover, a number of Medicago species have potential for the production of bio-pharmaceuticals, -fuel, and -plastics [4,17].
Since 1753, Carl von Linné [18] described 19 species of the genus Medicago. A first attempt at synthesis was made by Urban in 1872 [19], but in a relatively incomplete manner. In 1963, Heyn studied this genus detailing particularly the taxa of the Spirocarpos section [20] and producing a monograph on the genus listing 54 species belonging to 4 subgenera. The most important and recent enrichment of the genus arises particularly from the inclusion of 23 Trigonella species [21].
Currently, out of 87 Medicago species, 21 are perennial [4,22]. In fact, the most supported hypothesis suggests that the ancestral state of the genus Medicago is perennial allogamous, and that the annual self-pollinated species are derived from those progenitors [4,23,24]. The annual species are confined particularly to the Mediterranean basin, while the perennial species are more widely distributed, and are rather located in the East of the Mediterranean and in Central and Western Asia.
Common and rare species within the genus Medicago have been reported from different countries of the Mediterranean basin [25], being a number of species included in the European Red List of the vascular plants [26]. No comprehensive synopsis on the systematics of this group is available for Italy [27], however, in the checklist of the Italian Flora (2021), a total number of 40 Medicago species is reported, although a number of these records are doubtful or related to species no more present in the wild. According to the same source 27 Medicago species are present in the Campania region. In Sardinia, M. polymorpha and M. arabica are the most abundant followed by M. murex, M. truncatula, M. orbicularis, and M. minima [28]. In Sicily, M. polymorpha and M. orbicularis are very common and the large pod species (M. ciliaris, M. intertexta, and M. scutellata) are more frequent in non-grazed cultivated areas, while other species (M. murex, M. truncatula, M. arabica, M. minima, and M. rigidula) are more frequent in rangelands [29]. Among perennial species, Medicago falcata subsp. falcata and M. marina are native to Italy, the latter being particularly threatened by trampling and habitat modification in sand dune systems.
In addition to morphological identification and study of diagnostic traits, molecular tools can help to solve a number of taxonomic ambiguities [30]. For example, microsatellites are very valuable molecular tools in genetic diversity assessment and linkage mapping. In most Angiosperm, n-SSR markers are highly reproducible, phylogenetically significant, and with biparental inheritance, hence highly recommended for the evaluation of contemporary patterns of genetic structures. Microsatellites are available in the model plant M. truncatula [31,32]. The high level of synteny between legume genomes allowed the transferability of SSR markers developed on the genome of M. truncatula [33] (more than 500 SSR) to the other Medicago species [21,34,35,36]. Contrariwise, chloroplast genomes have lower evolutionary rate, are predominantly not recombining, maternally inherited, highly conserved across genera, and often distributed throughout noncoding regions. Polymorphic mononucleotide repeats (cp-SSR) exhibit length variation in the number of repeats akin to nuclear SSR (n-SSR), so they are powerful markers for genetic studies of ancient historical relationships. The combined analysis of biparentally and maternally inherited microsatellite markers would be expected to provide suitable complementary or sometime discordant information on the genetic diversity, structure, and differentiation of Medicago species [37,38,39,40,41,42].
The present study is a first attempt aiming to assess whether the use of a limited set of nuclear and/or chloroplast microsatellites is an effective tool for Medicago species and taxonomic sections’ differentiation, and complementary to morphological identification.
2. Materials and Method
2.1. Plant Material
During field surveys and laboratory observations, 11 Medicago species were identified based on their morphological characters of vegetative and reproductive organs. We considered a large number of characters, such as, e.g., petiole length, leaflet margin, stipule length, stipule margin, stipule shape, inflorescence length, number of flowers per inflorescence, pod length, pod width, etc. These 11 Medicago species included one perennial, one biannual, or short-lived perennial, and nine annual species. Aiming to analyze 3 individuals for each species (Table 1), 33 specimens were collected along secondary or dust road verges in the Province of Salerno (Campania region, Southern Italy, latitude 40.07–40.77°, longitude 14.78–15.55°). All collection sites were GPS georeferenced and plotted on a geographic map (Table 1, Figure 1).

Table 1.
Scientific names, sections, and subsections of the 11 Medicago species collected in Campania, with geographical coordinates of the collection sites (WGS84) [4]. The status in Campania follows the checklist of the Italian flora (2021).

Figure 1.
Map of Campania region, in southern Italy, showing the locations of the six collection sites of the eleven Medicago species investigated.
2.2. DNA Extraction and SSR Analysis
For each Medicago species, leaf samples were harvested from three individuals representative of the population thriving in the collection site, and then stored in silica-gel before DNA extraction and purification. Leaf samples were randomly numbered to perform a blind test. Afterwards, leaves were powdered in liquid nitrogen and total DNA was extracted using a cetyl-trimethyl-ammonium bromide (CTAB) buffer, following the protocol of Doyle and Doyle (1987), as modified by Harbor, Doyle and Tai [43,44,45]. DNA quantity and quality were assessed using 1.0% agarose gel electrophoresis. Genetic analysis was carried out by means of: (a) four nuclear microsatellites (n-SSR) from M. truncatula selected on the basis of their position on the genetic linkage map [46] (MTIC 503, MTIC 559, MTIC 563, MTIC 564) (Table S1); (b) five chloroplast Simple Sequence Repeat (cp-SSR) markers comprising CCMP2, CCMP4, CCMP6, CCMP7, and CCMP10, designed for Nicotiana tabacum L. [47,48] (Table S2).
2.3. N-SSR and Genetic Diversity Analysis
PCR amplifications were performed using a thermocycler (2720 thermocycler, Applied Biosystems, Italy) in 10.0 μL of a mixture solution containing 10 ng of Medicago template DNA, 2.0 μL of reverse primer (final concentration 1.0 μM, unlabeled), 1.5 μL of forward primer (final concentration 1.0 μM, unlabeled), 0.5 μL of labelled forward primer (final concentration 0.1 μM, unlabeled), and 5.0 μL of RedExtract-N-Amp PCR Ready Mix (Sigma-Aldrich, Milano, Italy), following a Touchdown PCR thermal profile of 4 min at 94 °C, 15 cycles of 30 s at 94 °C, 30 s at 62 °C with −0.5 °C decrease at each cycle plus 1.0 min at 72 °C and 30 cycles of 30 s at 94 °C, 1 min at 54 °C plus 1 min 30 s at 72 °C, succeeded by 7 min at 72 °C. PCR products were separated by agarose gel electrophoresis 1.0% in 1× TAE buffer, stained with ethidium bromide and visualized under UV light. For electrophoresis capillary, an aliquot of 1.0 µL of the PCR amplicons was diluted in 10 μL of formamide and 0.5 μL of Rox 500™ oligonucleotide ‘size ladder’ (MCLAB, South San Francisco, CA, USA) then analyzed in ABI-PRISM 310 Genetic Analyzer (Applied Biosystems®, Monza, Italy). Alleles sizes were scored using Gene Mapper 4.0 (Applied Biosystems®, Monza, Italy).
2.3.1. Genetic Diversity Analysis
Gene diversity and allele number (A) for each locus were obtained using Molecular kinships ver. 3.0. software, PIC values were calculated using the following formula for molecular markers [49]:
where PICi is the polymorphism information content of the i allele and fi is the frequency of amplification (presence of fragment) of the i allele in the analyzed individuals.
PICi = 2·fi·(1 − fi)
In order to estimate the level of genetic diversity present in the species from n-SSR data, banding profiles generated by each marker were scored on the basis of the size (bp) of amplified fragments. Deviation from Hardy–Weinberg Equilibrium (HWE) was tested at both species and locus levels and inbreeding coefficients (F) were calculated using GENEPOP software (ver. 4.7.5, Montpellier, France).
The following genetic diversity indices were calculated using GenAlEx software (ver. 6.503) [50]:
(i) The total number of alleles (Na);
(ii) The effective number of alleles (Ne);
(iii) Observed heterozygosity (Ho);
(iv) Expected heterozygosity (HE);
(v) Shannon’s information index (I);
(vi) Gene flow (Nm) was calculated using the following formula [50]:
Nm = (1 − FST) / 4FST
In order to assess the variance among and within species and to estimate genetic differentiation among Medicago species, analysis of molecular variance (AMOVA) was performed using 1000 permutations of the FST value; principal coordinates analysis (PCoA) and relationships between genetic and linear geographic distances (isolation by distances, IBD), were examined using a Mantel test [51] as implemented in GenAIEx, with 1000 permutations.
The alleles banding profiles were transformed into a binary matrix of presence (1)/absence (0) of each allele and genetic relationships were visualized using cluster analysis and the R package ‘pvclust’ [52], based on Euclidean distance, since this method has been proved to be the most appropriate for recognizing the genetic structure extractable from the analyzed dataset.
2.3.2. Genetic Structure Analysis
The genetic structure was investigated with a Bayesian approach with Structure software (ver. 2.3.4) [53], through 100,000 Monte Carlo Markov Chain (MCMC) iterations, following 25,000 burn-in length for each run. Eleven independent simulations and eight replicates were conducted for each K-value to estimate group assignments.
The analyses were conducted combining two different models (admixture/no-admixture) and two options of allele frequencies among species (correlated/independent), and the other parameters were set to default values as suggested by Pritchard et al. [54]. Structure Harvester b (v0.6.94) [55] was used to select the optimal model relying on maximum likelihood and (ΔK) values. ΔK based on the order rate of change of L(K) between successive K values, was used to identify the correct number of K [56].
2.4. Cp-SSRs and Statistical Analysis
PCR reactions were performed in 10 μL reaction mixture containing 10 ng of template DNA, 1.5 μL of forward primer (final concentration 1.0 μM, unlabeled) 0.5 μL of labeled forward primer (final concentration 0.1 μM), 2.0 μL of reverse unlabeled primer (final concentration 1.0 μM, unlabeled), 5 μL of RedExtract-N-Amp PCR Ready Mix (Sigma-Aldrich, Milan, Italy) with an initial melting temperature set at 94 °C and maintained for 3 min; 15 cycles of 94 °C for 30 s, 1 min at the annealing temperature of 62 °C with −1 °C decrease at each cycle and 25 cycles at the denaturation temperature of 94 °C for 30 s, 55 °C for 1 min, extension at 72 °C for 1 min 30 s, and then a final extension step at 72 °C for 7 min. The amplified PCR products were resolved on 1.0% agarose gel electrophoresis and visualized by ethidium bromide staining then analyzed by capillary electrophoresis with an automatic sequencer, aiming at characterizing allelic diversity and polymorphic informativeness of cp-SSRs of our Medicago species, PIC values and alleles number (A) were calculated using Molecular Kinships software (ver. 3.0), and the gene diversity (He) was calculated as follows:
where n is the number of alleles and pi the frequency of the ith allele in species. Haplotypes Diversity was calculated in the same manner with n and pi referring to haplotypes.
An unweighted pair group method with arithmetic mean (UPGMA) clustering analysis was run with NTSYS pc 2.02j software [57], using a clustering algorithm based on the Jaccard similarity index [58]. The Reliability of SSR allele clustering was assessed by bootstrapping, with 1000 permutations.
3. Results
3.1. Genetic Diversity at Nuclear Microsatellites
The four n-SSR were found to be highly polymorphic, with allele number per locus ranging from 8 (MTIC 559) to 12 (MTIC 564), as reported in Table 2. A total of 40 alleles were amplified from the DNA of the 11 Medicago species, with a mean value of 10 alleles per SSR locus. Gene diversity (He) per locus ranged from 0.695 (MTIC 563) to 0.861 (MTIC 503) with an average of 0.799. The Polymorphism Information Content (PIC) for each primer was in the range of 0.672 to 0.847 with an average of 0.780.
Table 2.
Diversity statistics of informative nuclear and chloroplast microsatellites used to study the 11 Medicago species.
The results of n-SSR (Table 2) suggested a moderate level of genetic diversity of the studied Medicago species: Na values ranged from 1.2 (POL) to 2.2 (SAT and SCU), Ne values from 1.2 (POL) to 2.2 (SCU and ORB), HO and He values ranged from 0.00 (POL) to 0.33 (SAT) and from 0.11 (POL) to 0.46 (ARA), respectively. Within the 11 species, the average number of alleles revealed by the surveyed loci was 6.3; it ranged from 3 (POL) to 8 (SAT, ARA, LIT and MRX). Although the number of migrants (Nm) ranged from −0.64 (LUP) to 0.49 (RUG).
Inbreeding indices (F) deviated from zero for almost all the species, they were in the range of −0.33 (LUP) to 1.00 (POL) and showed heterozygote deficiencies: a total loss of heterozygosity in M. polymorpha and a loss of 33% of homozygosity in M. lupulina (Table 3).
Table 3.
Genetic diversity among the 11 Medicago species investigated in this study.
The results of the overall AMOVA (Table 4) indicated that 52% of the variation was due to differences among species, while the remaining 48% was due to the variation within groups.
Table 4.
Analysis of genetic differentiation between the 11 Medicago species by AMOVA with cp-SSR and n-SSR markers. df, degrees of freedom; MS, Mean squares; FST, fixation index.
The first two axes of the PCoA (Figure 2) explained 70.65% of the total variation and clearly separated M. sativa and M. scutellata from all the other species, with an accumulated variance of 42.21% and 28.44%, respectively. Although the FST values ranged from 0.03 to 0.333 (Table S3), indicating a moderate or great genetic differentiation, the two highest differentiations were observed between M. scutellata and M. murex, and M. scutellata and M. polymorpha, whilst the lowest differentiation was found between M. minima and M. rugosa.
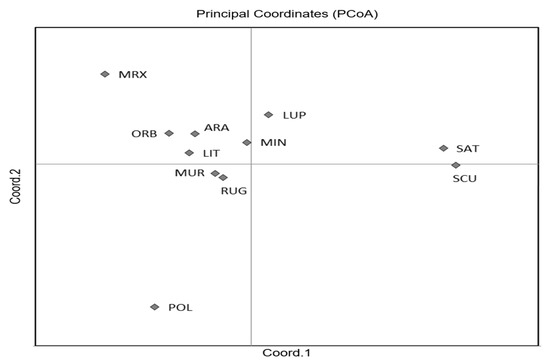
Figure 2.
Plot of Principal Coordinate Analysis (PCoA) for the 11 Medicago species. Codes are as follows: SCU, M. scutellata; SAT, M. sativa; LUP, M. lupulina; ARA, M. arabica; MUR, M. muricoleptis POL, M. polymorpha; ORB, M. orbicularis; MIN, M. minima; LIT, M. littoralis; RUG, M. rugosa; MRX, M. murex.
The clustering, based on Euclidean distances (Figure 3), showed a partition of individuals in three main groups (1–3 in Figure 3), which were separated by an Euclidean distance value of 2.75 and 2.56, respectively. In order to read these results and for a better approximation to an unbiased p-value (AU), AU values were adopted instead of BP-values [59]. Nonetheless, approximately AU values were not significant (AU < 95) for most branches. However, individuals belonging to the 3 different Medicago sections were located in different clusters.
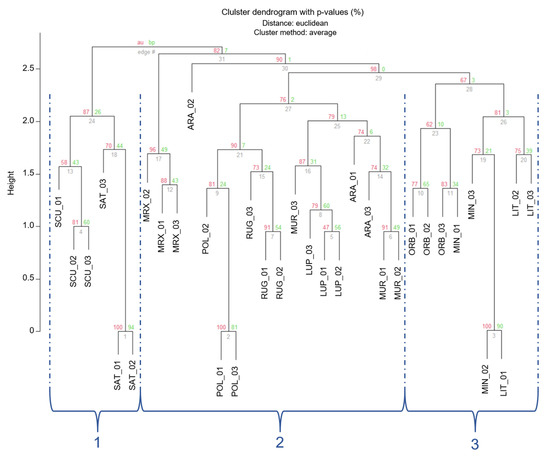
Figure 3.
Cluster dendrogram of the 33 Medicago individuals based on the Euclidean distances. Values at branches are AU p-values (red) and Bootstraps BP-values (green), based on n-SSR primers. Codes are as follows: SCU, M. scutellata; SAT, M. sativa; LUP, M. lupulina; ARA, M. arabica; MUR, M. muricoleptis POL, M. polymorpha; ORB, M. orbicularis; MIN, M. minima; LIT, M. littoralis; RUG, M. rugosa; MRX, M. murex.
The first smaller branch of cluster 1 included individuals from Medicago and Spirocarpos subsection Rotatae; the cluster 2 included individuals belonging to Orbiculares and to two Spirocarpos subsections (Pachyspirae and Spirocarpos). All the others grouped in cluster 3 and included species belonging to Spirocarpos section and a number of subsections (e.g., Rotatae, Lupularia, etc.).
The 33 individuals of 11 species were divided into almost the same groups by the UPGMA dendrogram based on the Jaccard similarity index as by the Pvclust clustering method; although well distinguished (Figure 4), M. scutellata and M. sativa formed a separate cluster (group 1); M. littoralis and M. minima (section Spirocarpos) formed the cluster number 3 together with M. orbicularis (section Orbiculares). In contrast, all other investigated species were grouped in cluster 2.
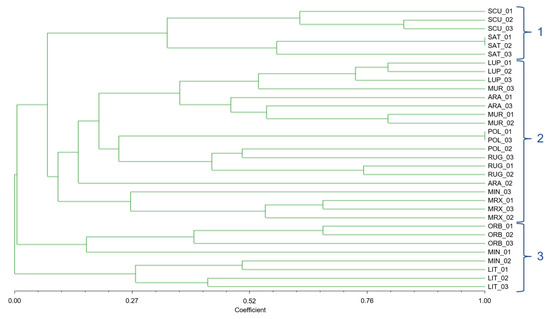
Figure 4.
Dendrogram based on Jaccard similarity indices, computed on the basis of UPGMA clustering method, of the 33 individuals of 11 Medicago species, belonging to 3 different sections, with n-SSR alleles.
3.2. Genetic Structure at Nuclear Microsatellites
To assign individuals to one or more estimated groups (K), a Bayesian Markov Chain Monte Carlo approach, implemented in Structure (ver. 2.3) [53], was applied under the no-admixture model and with the assumption of independent allele frequencies between species. At K = 2, Medicago species were assigned into groups belonging to different sections. At K = 3 (Figure 5), species belonging to the 3 sections were grouped in different subgroups: M. sativa, M. scutellata, and M. rugosa were allocated to one subgroup (cluster 1, blue); M. lupulina, M. arabica, M. muricoleptis, and M. murex in cluster 2 (green), while the cluster 3 (red) was formed by M. littoralis, M. minima, and M. orbicularis. It is worthwhile to note that M. polymorpha had the highest average ancestry coefficient (inferred proportion of membership) from the cluster 1 (0.7) then from cluster 2 (0.3). Consequently, K = 3 was recognized as the most appropriate value able to describe the genetic structure of the 11 Medicago species studied (Figure 5).
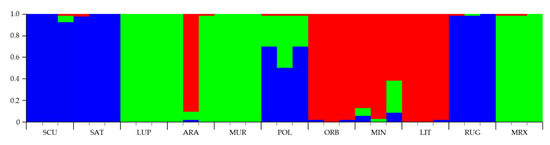
Figure 5.
Bar plot of genetic relationships among the 11 Medicago species estimated using STRUCTURE software based on the data obtained by the four n-SSR loci analyzed. Codes are as follows: SCU, M. scutellata; SAT, M. sativa; LUP, M. lupulina; ARA, M. arabica; MUR, M. muricoleptis; POL, M. polymorpha; ORB, M. orbicularis; MIN, M. minima; LIT, M. littoralis; RUG, M. rugosa; MRX, M. murex. The estimated membership probability (Q) for K = 3 is plotted on the y-axis.
3.3. Genetic Analyses by Chloroplast Microsatellites
The statistics results for the five cp-SSR markers are summarized in Table 2. The loci showed a high level of genetic diversity. In total, 56 polymorphic alleles were amplified, ranging from 7 alleles per locus in the case of CCMP6, to 17 alleles per locus in the case of CCMP10, with an average of 11. Gene diversity (He) per locus ranged from 0.694 (CCMP6) to 0.899 (CCMP10), with an average of 0.833. Meanwhile, Polymorphism Information Content (PIC) of each primer was in the range of 0.694 (CCMP6) to 0.899 (CCMP10), with an average of 0.833. These results demonstrate that the cp-SSR markers used were enough informative to justify further Medicago species genetic diversity analysis. CCMP10 was the cp-SSR showing the highest ability to distinguish among the different analyzed species.
Gene diversity (He) for the 11 species (Table 3) varied from 0.09 (MRX) to 0.58 (MIN) with an average of 0.44. Allele numbers within species varied from 5 (MRX) to 10 (SCU, ARA, MIN).
The AMOVA (Table 4) showed that genetic variation was mainly within species (94%), rather than among species (6%). Although genetic differentiation among species was found from moderate to high, the PHI-PT values for haplotypes ranged from 0.083 to 0.600, the highest differentiation was observed between M. orbicularis and M. murex.
Mantel test for isolation by distance among species did not show any significant correlation between pairwise PHI-PT and geographic distance (R2 = 0.012, p = 0.158) [60].
Unbiased cluster analysis based on cp-SSR markers was performed with the Numerical Taxonomy Multivariate Analysis System (NTSYS-PC-ver. 2.2) (Figure 6) [3]. A dendrogram was built via UPGMA and Jaccard similarity coefficients were used to reveal the similarity among the 11 Medicago species. The results of clustering analysis with pvclust based on Euclidian distances revealed the presence of two macro-clusters (A and B). These two clusters included different sub-clusters, A1, A2, B1, B2, and B3. In particular, A1 was formed by the only M. murex, its specimens were well separated from M. sativa and M. scutellata cluster (A2). In the case of the macro cluster B, the three sub-clusters B1, B2, and B3 showed that different Medicago species grouped together, even if the three clusters were well separated. However, the identified subclusters comprised all the individuals of the same species (e.g., B1 grouped all the specimens belonging to M. rugosa, B2 all those belonging to M. littoralis, B3 the ones belonging to M. lupulina). In general, the AU value was quite well supported by data obtained, in particular in the case of the subgroups (AU comprised between 53% and 99%).
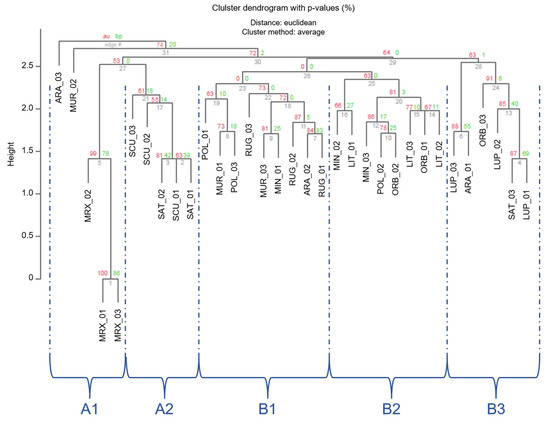
Figure 6.
Cluster dendrogram of individuals based on the Euclidean distances. Values at branches are AU p-values (red) and Bootstraps BP-values (green), based on cp-SSRs.
3.4. Genetic Similarity Analysis among Species Based on Chloroplast and Nuclear Microsatellites
3.4.1. Pvclust-R-Package
The dendrogram based on Euclidian distance calculated for the most informative microsatellite (5 chloroplast and 4 nuclear), showed three major clusters (A, B, and C; Figure 7). M. murex formed an independent cluster (A − AU = 100%), M. scutellata and M. sativa, belonging to two different sections, formed a distinct cluster (B) and their relative branches showed a high AU values (95%), which explained that those subdivisions are strongly supported by the data. The third cluster (C—Figure 7), including the large part of the samples, was divided in six subclusters able to well distinguish the Medicago species: C1 grouped M. orbicularis belonging to section Orbiculares; C2 cluster comprised the specimens belonging to M. littoralis, two belonging to M. minima and one to M. polymorpha; the subcluster C3 incorporated the samples of M. rugosa and one of M. minima; C4 was identified as the cluster including M. lupulina specimens; C5 was formed by the M. murex; C6 grouped the samples belonging to M. arabica.
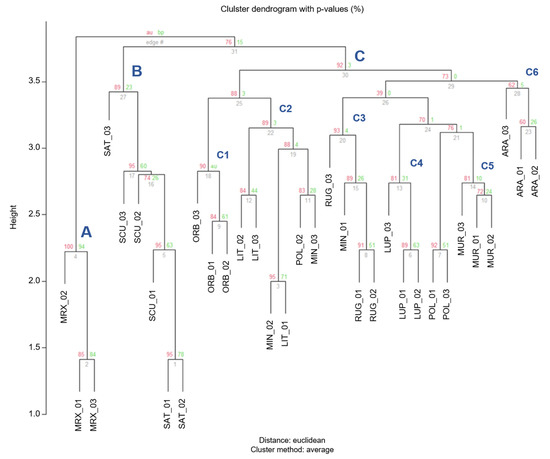
Figure 7.
Cluster dendrogram of individuals based on the Euclidean distances. Values at branches are AU p-values (red) and bootstraps BP-values (green), based on cp-SSR and n-SSR markers.
3.4.2. Unweighted Pair-Group Method with Arithmetic Averages Using NTSYS-PC Software
The dendrogram derived from Jaccard coefficient (Figure 8) based on similarity matrix of the Medicago species showed three major groups (A, B, and C), and the similarity coefficient ranged from 5 to 82%. The cluster A can be further divided into three sub-groups (A1, A2, and A3) having different degrees of similarity; the A1 was represented by M. littoralis (subsection Pachyspirae), A2 comprised M. orbicularis (section Orbiculares), whilst A3 included 2 of the 3 specimens of M. polymorpha. The group B embodied five species of the Spirocarpos section, with four sub-clusters; M. rugosa formed a separated subgroup B1; B2 included M. murex, whilst B3 and B4 were formed by M. muricoleptis and M. lupulina, respectively. However, one sample of M. arabica, included in cluster B4, showed roughly 35% of similarity with M. lupulina.
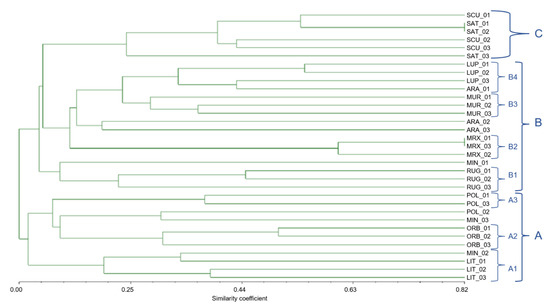
Figure 8.
Dendrogram based on Jaccard similarity coefficients, computed from UPGMA, showing relatedness among the 11 Medicago species belonging to different sections. Clustering (A, B, and C) is based on both chloroplast and nuclear SSR markers.
Finally, this dendrogram highlighted the fact that M. arabica specimens had a very high biodiversity; in fact, their Jaccard similarity index was equal to 20% between ARA2 and ARA3. Similarly, the specimens identified as M. minima showed a very low similarity index, and were wide spread among all the identified clusters.
The cluster C embodied M. scutellata and M. sativa, belonging to two different sections, (e.g., Spirocarpos and Medicago, respectively).
4. Discussion
In addition to morphological identification and study of diagnostic traits, molecular characterization can help to solve a number of taxonomic ambiguities [30]. In the present study, we assessed, for the first time, whether nuclear and/or chloroplast microsatellites may be suitable for the differentiation of 11 Medicago species (and relative sections) collected in South Italy in Campania region.
The high level of synteny between legume genomes allowed the transferability of SSR markers developed in M. truncatula [33] (more than 500 SSR) to the other Medicago species [21,34,35,36]. Contrariwise, chloroplast genomes have lower evolutionary rate, are not recombining predominantly, maternally inherited, highly conserved across genera, and often distributed throughout non-coding regions.
Compared to morphological data, molecular markers can provide highly reliable information, in fact, they are insensitive to environmental variations and, furthermore, not subject to personal interpretation. Previous studies showed that molecular markers are suitable for revealing phylogenetic relationships among different Medicago species and also to estimate the genetic diversity. In fact, different molecular markers (IRAP, REMAP, ISSR, SSR, RAPD, and AFLP) have been used to estimate the genetic diversity and evaluate the phylogenetic relatedness in Medicago species [32,48,61,62,63,64,65,66,67,68,69,70,71].
A noteworthy result obtained with the present study is that, on a quite limited surveyed area, a significant number of Medicago species were present, including the rare M. muricoleptis species, which was recorded in the Campania region for the first time only in 2019 [72]. The species richness in the study area is highly remarkable, regardless the level of anthropic pressure on the area and the intensive land uses (e.g., agricultural, industrial, tourist etc.). However, this apparent paradox is in line with the renewed tolerance to disturbance of many Medicago species [73].
4.1. Intra Species Diversity
Allele number of nuclear SSR within species varied from 3 to 10, with the highest value observed for M. scutellata, M. arabica, and M. minima, and the lowest one for M. murex.
For all of the species studied, the results show a low amount of heterozygosity (Ho varied between 0.00 and 0.33, and He between 0.11 and 0.44). The highest fixation index was found in M. muricoleptis and the lowest one in M. polymorpha. The high self-pollination detected in M. polymorpha (Ho = 0.00, He = 0.11) likely contributed to lower the overall level of the observed heterozygosity. A low heterozygosity was also observed in the case of M. lupulina, confirming the data of Yan and co-workers [67], who reported that the Ho within M. lupulina populations was 0.017, ranging between 0.00 and 0.04. Nevertheless, the limited heterozygosity cannot be due to outcrossing events, since it was found that the breeding system of M. lupulina varies from complete self-pollination to extensive outcrossing and, although honeybees show great interest for M. lupulina flowers, under natural conditions, neither pollinating insects nor wind are absolutely necessary for its fertilization [74,75].
4.2. Diversity among Species
This study included 11 Medicago species (whit a number of globally poorly studied species) and has been the first survey of this type for Campania region and Italy, so that it is not possible to compare with similar study cases or previous national investigations. Although genetic diversity has fundamental importance for species survival [76,77], few studies are available on less common and endangered species, such as the island endemic M. citrina and others [64]. In fact, at the global level, genetic studies are mainly concentrated on M. truncatula, M. polymorpha, on the M. sativa–M. falcata complex [78], and on M. truncatula, from which widely used SSR markers were identified, as reported in Diwan et al. [62]. In the same vein, Min et al. [78] found that the mean value of information content of the SSR polymorphisms detected in diverse accession of M. truncatula, was as high as 0.71. This number is usually more than 0.70 for annual medics [62,78].
Lesins and Lesins [22] and Small and co-workers [24] considered a variety of genetic and morphological traits, such as chromosome number, presence of woody tissue, or cotyledon structure that support recognition of infrageneric taxa and the delimitation of species within the genus Medicago [13]. However, results presented by Steele et al. [13] suggest that section Lupularia, containing the two species M. lupulina and M. secundiflora, should no longer be recognized. The same authors also propose considering a reduced subsection Leptospirae, with M. lupulina, M. coronata, M. disciformis, M. minima, and M. tenoreana. Interestingly, we detected a relatedness among M. lupulina and M. minima in the PCoA plot (UPGMA tree was drawn using Maximum Parsimony method). Although they are traditionally included in two different sections, PCoA plot and UPGMA dendrogram clearly highlighted a limited genetic distance between M. sativa and M. scutellata, which is thought to be a polyploid derivative of a hybrid between a 2n = 16 species and a 2n = 14 [20]. In another global study of the Medicago genus [77], although based on isoenzyme banding pattern, among fifty Medicago species, representing eight sections (Spirocarpos, Lunatae, Buceras, Medicago, Hymerocarpos, Lupularia, Orbiculares, and Heynianae sections), the dendrograms, based on cluster analysis of isozyme data, showed relatedness among them. Otherwise, population genetics studies on Medicago species in Iran have been mainly limited to M. sativa [68]. On the basis of the data produced with this study on 11 Medicago species assayed through a selection of highly informative nuclear and chloroplast markers, it is possible to conclude that, in most cases and with few exceptions, the distinction of the sections (and subsections) of the genus Medicago is supported by the detected genetic diversity.
4.3. Effectiveness of N-SSR and Cp-SSR Markers
Importantly, n-SSR were more effective than cp-SSR markers to separate Medicago species from the genetic point of view. Our n-SSR-based clustering of Medicago species chiefly agreed with the recent taxonomic classifications [4]. In fact, the species belonging to Spirocarpos section were grouped together in the same clade, and species belonging to Orbiculares section formed a distinct group. Nonetheless, for Medicago section M. sativa specimens were grouped in the same clade together with M. scutellata, and this could be due to the small number of microsatellites markers used.
Furthermore, n-SSR markers placement of the species based on Bayesian clustering analysis (which sets individuals to groups in relation with genotype), agreed with their placement based on pvclust non-Bayesian clustering approach. An unexpected clustering of M. polymorpha specimens was observed, which is not surprising and it resulted from a low level of polymorphism within species and the limited number of DNA SSR-markers used.
At the same time, the microsatellites employed in our study (both chloroplast and nuclear) may provide a useful tool for the management of germplasm repository. In fact, such an assay would be particularly relevant and effective, with a relative low cost and time spent, and for the possibility of automation. Our results confirm, once more, the potentiality and the effectiveness of the SSRs in genetic study and, in particular, it provides a successful experience in Medicago species discrimination and suitable for further studies on this genus.
5. Conclusions
This study focused on the discrimination power of n-SSR and cp-SSR for 11 Medicago species collected in a very limited area, and including M. muricoleptis, a species recorded for the first time in 2019 in Campania region. Nuclear microsatellites have proven very effective for species discrimination. Otherwise, cp-SSR resulted informative as well, being related to the common phylogenetic origin of Medicago species. Therefore, this innovative approach, which combined data from both n-SSR and cp-SSR, has been proven highly informative and allowed to distinguish Medicago species in relation to their common phylogenetic origin.
Supplementary Materials
The following are available online at https://www.mdpi.com/article/10.3390/genes13010097/s1, Table S1: Molecular and genetic information on the four nuclear microsatellites loci used in the study; Table S2: Molecular and genetic information on the five chloroplast microsatellites used in the study; Table S3: FST values among species.
Author Contributions
Conceptualization: S.C., A.C. and G.B.; methodology: S.C., F.G. and A.C.; software: I.K.D. and F.G.; validation: S.C., G.B.; A.C., F.G. and M.T.; data curation: I.K.D. and M.T.; resources: S.C. and A.C.; data curation: I.K.D., M.T, S.C. and F.G.; writing—original draft preparation: I.K.D., G.B., F.G., M.L. and M.T.; writing—review and editing: G.B., F.G., M.T., M.L. and S.C.; supervision: S.C., A.C. and G.B.; funding acquisition: S.C. All authors have read and agreed to the published version of the manuscript.
Funding
No funds specifically designated to this project were employed due to limited research investments that distinguishes Italy from many other countries in the world.
Institutional Review Board Statement
Not applicable.
Informed Consent Statement
Not applicable.
Data Availability Statement
Included in the article or Supplementary Material.
Acknowledgments
The authors gratefully thank H. Huguet (INP-ENSAT, Cedex, France) for his great assistance in providing information on SSR markers.
Conflicts of Interest
The authors declare no conflict of interest.
Abbreviations
AMOVA Analysis of molecular variance; cp-SSRs, chloroplast microsatellites markers; n-SSRs, nuclear microsatellites markers; PCoA, principal coordinates analysis; PIC, Polymorphism information content; SSR, simple sequence repeat; UPGMA, unweighted pair-group method with arithmetic averages.
References
- LPWG (Legume Phylogeny Working Group). A new subfamily classification of the Leguminosae based on a taxonomically comprehensive phylogeny. Taxon 2017, 66, 44–77. [Google Scholar] [CrossRef]
- Jones, K.; Kobayashi, H.; Davies, B.; Taga, M.E.; Walker, G.C. How rhizobial symbionts invade plants: The Sinorhizobium—Medicago model. Nat. Rev. Genet. 2007, 5, 619–633. [Google Scholar] [CrossRef]
- Mandal, S.M.; Pati, B.R.; Das, A.K.; Ghosh, A.K. Characterization of a Symbiotically Effective Rhizobium Resistant to Arsenic: Isolated from the Root Nodules of Vigna mungo (L.) Hepper Grown in an Arsenic-Contaminated Field. J. Gen. Appl. Microbiol. 2008, 99, 93–99. [Google Scholar] [CrossRef] [PubMed]
- Small, E. Alfalfa and Relatives: Evolution and Classification of Medicago; NRC Research Press: Ottawa, ON, Canada, 2011. [Google Scholar]
- Zribi, K.; Djébali, N.; Mrabet, M.; Khayat, N.; Smaoui, A.; Mlayah, A.; Aouani, M.E. Physiological responses to cadmium, copper, lead, and zinc of Sinorhizobium sp. strains nodulating Medicago sativa grown in Tunisian mining soils. Ann. Microbiol. 2012, 62, 1181–1188. [Google Scholar] [CrossRef]
- Ghnaya, T.; Mnassri, M.; Ghabriche, R.; Wali, M.; Poschenrieder, C.; Lutts, S.; Abdelly, C. Nodulation by Sinorhizobium meliloti originated from a mining soil alleviates Cd toxicity and increases Cd-phytoextraction in Medicago sativa L. Front. Plant Sci. 2015, 6, 863. [Google Scholar] [CrossRef]
- Wojciechowski, M.F.; Lavin, M.; Sanderson, M.J. A phylogeny of legumes (Leguminosae) based on analysis of the plastid mat K gene resolves many well-supported subclades within the family. Am. J. Bot. 2004, 91, 1846–1862. [Google Scholar] [CrossRef]
- Gupta, S.; Prasad, M. Development and characterization of genic SSR markers in Medicago truncatula and their transferability in leguminous and non-leguminous species. Genome 2009, 52, 761–771. [Google Scholar] [CrossRef]
- Bruneau, A.; Doyle, J.J.; Herendeen, P.; Hughes, C.E.; Kenicer, G.; Lewis, G.; Mackinder, B.; Pennington, R.T.; Sanderson, M.J.; Wojciechowski, M.F.; et al. Legume phylogeny and classification in the 21st century: Progress, prospects and lessons for other species-rich clades. Taxon 2013, 62, 217–248. [Google Scholar] [CrossRef]
- Hora, A.; Malik, C. Evaluation of Genetic Relationship between Trigonella-Melilotus complex Using CCMP Markers. Plant Tissue Cult. Biotechnol. 2013, 23, 59–66. [Google Scholar] [CrossRef][Green Version]
- Araújo, S.; Beebe, S.; Crespi, M.; Delbreil, B.; González, E.M.; Gruber, V.; Lejeune-Henaut, I.; Link, W.; Monteros, M.J.; Prats, E.; et al. Abiotic Stress Responses in Legumes: Strategies Used to Cope with Environmental Challenges. Crit. Rev. Plant Sci. 2015, 34, 237–280. [Google Scholar] [CrossRef]
- Prosperi, J.-M.; Auricht, G.; Génier, G.; Johnson, R. Medics (Medicago L.). In Expanding the Production and Use of Cool Season Food Legumes; Springer: Singapore, 2001; pp. 99–114. [Google Scholar]
- Steele, K.P.; Ickert-Bond, S.; Zarre, S.; Wojciechowski, M.F. Phylogeny and character evolution in Medicago (Leguminosae): Evidence from analyses of plastid trnK/matK and nuclear GA3ox1 sequences. Am. J. Bot. 2010, 97, 1142–1155. [Google Scholar] [CrossRef]
- Clarkson, N.M.; Mears, P.T.; Lowe, K.F.; Lloyd, D.L. Sustaining Productive Pastures in the Tropics 8. Persistence and Productivity of Temperate Legumes with Tropical Grasses. Trop. Grassl. 1991, 25, 129–136. [Google Scholar]
- Amouri, A.A. Caractérisation Moléculaire et Biochimique en Condition de Stress Salin de Medicago truncatula Gaertner. Amélioration des Plantes. Doctoral Dissertation, Université d’Oran, Oran, Algeria, 2016. [Google Scholar]
- Abdelguerfi, A.; Mefti, M. Effet Du stress hydrique sur le rendement en gousses et en graines chez trois espèces de luzernes annuelles: Medicago aculeata, Medicago orbicularis et Medicago truncatula. In Proceedings of the Série A. Séminaires Méditerranéens, Hammamet, Tunisia, 8–10 November 2001; Volume 45, pp. 163–166. [Google Scholar]
- Djafri-Bouallag, L.; Ourari, M.; Sahnoune, M. A cytogenetic and pollen study of annual Medicago species from Soummam Valley (Northeastern of Algeria). Acta Bot. Croat. 2019, 78, 82–90. [Google Scholar] [CrossRef]
- Linné, C. Salvius LarsCaroli Linnaei Species Plantarum: Exhibentes Plantas Rite Cognitas, Ad Genera Relatas, Cum Differentiis Specificis, Nominibus Trivialibus, Synonymis Selectis, Locis Natalibus, Secundum Systema Sexuale Digestas; Holmi-ae: Impensis Laurentii Salvii, 1753. Available online: https://www.gbif.org/dataset/751112f9-dacb-4aa7-b6dd-94b531bd95b7 (accessed on 3 November 2021).
- Urban, I. Prodromus Einer Monographic Der Gattung Medicago L. Verh. Bot. Ver. Brand. 1873, 15, 1–85. [Google Scholar]
- Lesins, K.A.; Lesins, I. General Key to Medicago Species. In Genus Medicago (Leguminosae); Springer: Dordrecht, The Netherlands, 1979. [Google Scholar] [CrossRef]
- Small, E.; Lassen, P.; Brookes, B.S. An Expanded Circumscription of Medicago (Leguminosae, Trifolieae) Based on Explosive Flower Tripping. Willdenowia 1987, 16, 415–437. [Google Scholar]
- Lesins, K.A.; Lesins, I. Genus Medicago (Leguminosae). In Genus Medicago (Leguminosae); Springer: Dordrecht, The Netherlands, 1979; Volume 10, pp. 978–1007. [Google Scholar] [CrossRef]
- Heyn, C.C.; Khen, K.K. The annual species of Medicago. In Scripta Hierosolymitana; Oxford University Press, Ed.; Magnes Press: London, UK, 1963; Volume XII, p. 154. [Google Scholar]
- Small, E.; Jomphe, M. A Synopsis of the Genus Medicago (Leguminosae). Can. J. Bot. 1989, 67, 3260–3294. [Google Scholar] [CrossRef]
- Al Beyrouthy, J.; Karam, N.; Al-Zein, M.S.; Yazbek, M. Ecogeographic survey and gap analysis for Medicago L.: Recommendations for in situ and ex situ conservation of Lebanese species. Genet. Resour. Crop. Evol. 2019, 66, 1009–1026. [Google Scholar] [CrossRef]
- Bilz, M.; Kell, S.P.; Maxted, N.; Lansdown, R.V. European Red List of Vascular Plants; Publications Office of the European Union: Luxembourg, 2011. [Google Scholar] [CrossRef]
- Portale Della Flora d’Italia—Portal to the Flora of Italy. Available online: http://dryades.units.it/floritaly/?procedure=simple_new&tipo=all (accessed on 7 February 2021).
- Brundu, G.; Camarda, I.; Caredda, M.; Garau, G.; Maltoni, S.; Deiana, P. A Contribution to the Study of the Distribution of Medicago-Sinorhizobium Symbiosis in Sardinia (Italy). Agric. Mediterr. Osp. 2004, 134, 33–48. [Google Scholar]
- Piano, E.; Pusceddu, S.; Spanu, F. Observations on the Distribution and Ecology of Annyual Medics and Subterranean Clovers in Sicily (Italy). In Proceedings of the IV International Rangelands Congress, Montpellier, France, 22–26 April 1991; pp. 405–409. [Google Scholar]
- Elias, M.; Condamine, F.L. Découverte et Analyse de La Biodiversité: Les Moyens Actuels. Mémoires Société Entomol. Fr. 2014, 9, 23–39. [Google Scholar]
- Thoquet, P.; Ghérardi, M.; Journet, E.-P.; Kereszt, A.; Ané, J.-M.; Prosperi, J.-M.; Huguet, T. The molecular genetic linkage map of the model legume Medicago truncatula: An essential tool for comparative legume genomics and the isolation of agronomically important genes. BMC Plant Biol. 2002, 2, 1. [Google Scholar] [CrossRef]
- Julier, B.; Flajoulot, S.; Barre, P.; Cardinet, G.; Santoni, S.; Huguet, T.; Huyghe, C. Construction of two genetic linkage maps in cultivated tetraploid alfalfa (Medicago sativa) using microsatellite and AFLP markers. BMC Plant Biol. 2003, 3, 9. [Google Scholar] [CrossRef]
- Journet, E.P.; Carreau, V.; Gouzy, J.; Thoquet, P.; Rosenberg, C.; Barker, D.; Huguet, T.; Denarie, J.; Gamas, P. The Model Legume Medicago truncatula: Recent Advances and Perspectives in Genomics. Ocl-Ol. Corps Gras Lipides 2001, 8, 478–484. [Google Scholar] [CrossRef][Green Version]
- Gutierrez, M.V.; Patto, M.C.V.; Huguet, T.; Cubero, J.I.; Moreno, M.T.; Torres, A.M. Cross-species amplification of Medicago truncatula microsatellites across three major pulse crops. Theor. Appl. Genet. 2005, 110, 1210–1217. [Google Scholar] [CrossRef]
- Badri, M.; Zitoun, A.; Soula, S.; Ilahi, H.; Huguet, T.; Aouani, M.E. Low levels of quantitative and molecular genetic differentiation among natural populations of Medicago ciliaris Kroch. (Fabaceae) of different Tunisian eco-geographical origin. Conserv. Genet. 2007, 9, 1509–1520. [Google Scholar] [CrossRef]
- Zitouna, N.; Marghali, S.; Gharbi, M.; Chennaoui-Kourda, H.; Haddioui, A.; Trifi-Farah, N. Mediterranean Hedysarum phylogeny by transferable microsatellites from Medicago. Biochem. Syst. Ecol. 2013, 50, 129–135. [Google Scholar] [CrossRef]
- Sun, Y.; Wen, X.; Huang, H. Genetic diversity and differentiation of Michelia maudiae (Magnoliaceae) revealed by nuclear and chloroplast microsatellite markers. Genetica 2011, 139, 1439–1447. [Google Scholar] [CrossRef]
- Kalia, R.K.; Rai, M.K.; Kalia, S.; Singh, R.; Dhawan, A.K. Microsatellite markers: An overview of the recent progress in plants. Euphytica 2011, 177, 309–334. [Google Scholar] [CrossRef]
- Bassil, N.; Boccacci, P.; Botta, R.; Postman, J.; Mehlenbacher, S. Nuclear and chloroplast microsatellite markers to assess genetic diversity and evolution in hazelnut species, hybrids and cultivars. Genet. Resour. Crop. Evol. 2013, 60, 543–568. [Google Scholar] [CrossRef]
- Mohammad-Panah, N.; Shabanian, N.; Khadivi, A.; Rahmani, M.-S.; Emami, A. Genetic structure of gall oak (Quercus infectoria) characterized by nuclear and chloroplast SSR markers. Tree Genet. Genomes 2017, 13, 70. [Google Scholar] [CrossRef]
- Magota, K.; Sakaguchi, S.; Akai, K.; Isagi, Y.; Murai, Y.; Setoguchi, H. Genetic Diversity of Saxifraga acerifolia and S. fortunei Based on Nuclear and Chloroplast Microsatellite Markers. Bull. Natl. Museum Nat. Sci. 2018, 44, 85–96. [Google Scholar]
- Alves-Pereira, A.; Clement, C.; Picanço-Rodrigues, D.; Veasey, E.; Dequigiovanni, G.; Ramos, S.L.F.; Pinheiro, J.B.; Zucchi, M.I. Patterns of nuclear and chloroplast genetic diversity and structure of manioc along major Brazilian Amazonian rivers. Ann. Bot. 2018, 121, 625–639. [Google Scholar] [CrossRef] [PubMed]
- Harbor, C.S.; Harbor, C.S. A Plant DNA Minipreparation: Version II. Plant Mol. Biol. 1983, 1, 19–21. [Google Scholar]
- Doyle, J.J.; Doyle, L.D. A Rapid DNA Isolation Procedure for Small Quantities of Fresh Leaf Tissue. Phytochem. Bull. 1987, 19, 11–15. [Google Scholar]
- Tai, T.H.; Tanksley, S.D. A rapid and inexpensive method for isolation of total DNA from dehydrated plant tissue. Plant Mol. Biol. Rep. 1990, 8, 297–303. [Google Scholar] [CrossRef]
- Lazrek, F.; Roussel, V.; Ronfort, J.; Cardinet, G.; Chardon, F.; Aouani, M.E.; Huguet, T. The use of neutral and non-neutral SSRs to analyse the genetic structure of a Tunisian collection of Medicago truncatula lines and to reveal associations with eco-environmental variables. Genetica 2009, 135, 391–402. [Google Scholar] [CrossRef] [PubMed]
- Weising, K.; Gardner, R.C. A set of conserved PCR primers for the analysis of simple sequence repeat polymorphisms in chloroplast genomes of dicotyledonous angiosperms. Genome 1999, 42, 9–19. [Google Scholar] [CrossRef]
- Baquerizo-Audiot, E.; Desplanque, B.; Prosperi, J.M.; Santoni, S. Characterization of microsatellite loci in the diploid legume Medicago truncatula (barrel medic). Mol. Ecol. Notes 2001, 1, 1–3. [Google Scholar] [CrossRef]
- Roldán-Ruiz, I.; Dendauw, J.; Van Bockstaele, E.; Depicker, A.; De Loose, M. AFLP markers reveal high polymorphic rates in ryegrasses (Lolium spp.). Mol. Breed. 2000, 6, 125–134. [Google Scholar] [CrossRef]
- Slatkin, M. Isolation by Distance in Equilibrium and Non-Equilibrium Populations. Evolution 1993, 47, 264–279. [Google Scholar] [CrossRef]
- Mantel, N. The detection of disease clustering and a generalized regression approach. Cancer Res. 1967, 27, 209–220. [Google Scholar] [PubMed]
- Suzuki, R.; Shimodaira, H. Pvclust: An R package for assessing the uncertainty in hierarchical clustering. Bioinformatics 2006, 22, 1540–1542. [Google Scholar] [CrossRef] [PubMed]
- Pritchard, J.K.; Stephens, M.; Donnelly, P. Inference of Population Structure Using Multilocus Genotype Data. Genet. Soc. Am. Inference 2000, 155, 945–959. [Google Scholar] [CrossRef] [PubMed]
- Jonathan, K. Pritcharda Xiaoquan Wena Daniel Falush Documentation for Structure Software: Version 2.2; Department of Statistics, University of Oxford: Oxford, UK, 2007. [Google Scholar]
- Earl, D.A.; vonHoldt, B.M. Structure harvester: A website and program for visualizing structure output and implementing the Evanno method. Conserv. Genet. Resour. 2012, 4, 359–361. [Google Scholar] [CrossRef]
- Evanno, G.; Regnaut, S.; Goudet, J. Detecting the number of clusters of individuals using the software structure: A simulation study. Mol. Ecol. 2005, 14, 2611–2620. [Google Scholar] [CrossRef]
- Rohlf, F.J. NTSYSpc: Numerical Taxonomy and Multivariate Analysis System; Applied Biostatistics: New York, NY, USA, 2000; Version 2. [Google Scholar]
- Jaccard, P. Nouvelles recherches sur la distribution florale. Bull. Soc. Vaud. Sci. Nat. 1908, 44, 223–270. [Google Scholar] [CrossRef]
- Kindt, R. Cluster Diagrams with Pvclust Ggraph and Ggplot2. 2020. Available online: https://rpubs.com/Roeland-KINDT/702542 (accessed on 3 November 2021).
- Kahilainen, A.; Puurtinen, M.; Kotiaho, J. Conservation implications of species–genetic diversity correlations. Glob. Ecol. Conserv. 2014, 2, 315–323. [Google Scholar] [CrossRef]
- Díaz, S.; Settele, J.; Brondízio, E.S.; Ngo, H.T.; Guèze, M.; Agard, J.; Arneth, A.; Balvanera, P.; Brauman, K.A.; Butchart, S.H.M.; et al. (Eds.) IPBES 2019: Summary for Policymakers of the Global Assessment Report on Biodiversity and Ecosystem Services of the Intergovernmental Science-Policy Platform on Biodiversity and Ecosystem Services; IPBES Secretariat: Bonn, Germany, 2019; 56p. [Google Scholar] [CrossRef]
- Diwan, N.; Bouton, J.H.; Cregan, P.B.; Kochert, G.A.R.Y. Mapping of Simple Sequence Repeat (SSR) DNA Markers in Diploid and Tetraploid Alfalfa. Theor. Appl. Genet. 2000, 101, 165–172. [Google Scholar] [CrossRef]
- Eujayl, I.; Sledge, M.K.; Wang, L.; May, G.D.; Chekhovskiy, K.; Zwonitzer, J.C.; Mian, M.A.R. Medicago truncatula EST-SSRs Reveal Cross-Species Genetic Markers for Medicago spp. Theor. Appl. Genet. 2004, 108, 414–422. [Google Scholar] [CrossRef]
- Juan, A.; Crespo, M.B.; Cowan, R.S.; Lexer, C.; Fay, M.F. Patterns of Variability and Gene Flow in Medicago citrina, an Endangered Endemic of Islands in the Western Mediterranean, as Revealed by Amplified Fragment Length Polymorphism (AFLP). Mol. Ecol. 2004, 13, 2679–2690. [Google Scholar] [CrossRef]
- Flajoulot, S.; Ronfort, J.; Baudouin, P.; Barre, P.; Huguet, T.; Huyghe, C.; Julier, B. Genetic Diversity among Alfalfa (Medicago sativa) Cultivars Coming from a Breeding Program, Using SSR Markers. Theor. Appl. Genet. 2005, 111, 1420–1429. [Google Scholar] [CrossRef]
- Ellwood, S.R.; D’souza, N.K.; Kamphuis, L.G.; Burgess, T.I.; Nair, R.M.; Oliver, R.P. SSR Analysis of the Medicago truncatula SARDI Core Collection Reveals Substantial Diversity and Unusual Genotype Dispersal throughout the Mediterranean Basin. Theor. Appl. Genet. 2006, 112, 977–983. [Google Scholar] [CrossRef]
- Yan, J.; Chu, H.-J.; Wang, H.-C.; Li, J.-Q.; Sang, T. Population genetic structure of two Medicago species shaped by distinct life form, mating system and seed dispersal. Ann. Bot. 2009, 103, 825–834. [Google Scholar] [CrossRef]
- Mohammadzadeh, F.; Monirifar, H.; Saba, J.; Valizadeh, M.; Haghighi, A.R.; Zanjani, B.M.; Barghi, M.; Tarhriz, V. Genetic variation among Iranian alfalfa (Medicago sativa L.) populations based on RAPD markers. Bangladesh J. Plant Taxon. 2011, 18, 93–104. [Google Scholar] [CrossRef]
- Cholastova, T.; Knotova, D. Using Morphological and Microsatellite (SSR) Markers to Assess the Genetic Diversity in Alfalfa (Medicago sativa L.). Int. J. Agric. Biosyst. Eng. 2012, 6, 781–787. [Google Scholar]
- Mandoulakani, B.A.; Sadigh, P.; Azizi, H.; Piri, Y.; Nasri, S.; Arzhangh, S. Comparative Assessment of IRAP, REMAP, ISSR, and SSR Markers for Evaluation of Genetic Diversity of Alfalfa (Medicago sativa L.). J. Agric. Sci. Technol. 2015, 17, 999–1010. [Google Scholar]
- Haddoudi, L.; Hdira, S.; Cheikh, N.B.; Mahjoub, A.; Abdelly, C.; Ludidi, N.; Badri, M. Assessment of genetic diversity in Tunisian populations of Medicago polymorpha based on SSR markers. Chil. J. Agric. Res. 2021, 81, 53–61. [Google Scholar] [CrossRef]
- Stinca, A.; Chianese, G.; D’Auria, G.; Fascetti, S.; Ravo, M.; Romano, V.A.; Salerno, G.; Astuti, G.; Bartolucci, F.; Bernardo, L.; et al. Contribution to the floristic knowledge of eastern Irpinia and Vulture-Melfese area (Campania and Basilicata, southern Italy). Ital. Bot. 2019, 8, 1–16. [Google Scholar] [CrossRef]
- Bayliss, S.L.J.; Terhorst, C.P.; Lau, J.A. Testing genotypic variation of an invasive plant species in response to soil disturbance and herbivory. Oecologia 2017, 183, 1135–1141. [Google Scholar] [CrossRef] [PubMed]
- Lammerink, J. Genetic variability in commencement of flowering in Medicago lupulina L. in the South Island of New Zealand. New Zealand J. Bot. 1968, 6, 33–42. [Google Scholar] [CrossRef]
- Marie-Victorin, F.; Rolland-Germain, F. Flore de l’Anticosti-Minganie; Presses de l’Universite de Montreal: Montréal, QC, Canada, 1969. [Google Scholar]
- Nadia, Z.; Maroua, G.; Hela, B.R.; Houda, C.-K.; Abdelmajid, H.; Neila, T.-F.; Sonia, M. Evolutionary and demographic history among Maghrebian Medicago species (Fabaceae) based on the nucleotide sequences of the chloroplast DNA barcode trnH-psbA. Biochem. Syst. Ecol. 2014, 55, 296–304. [Google Scholar] [CrossRef]
- Chandra, A.; Verma, S.; Pandey, K. Genetic similarity based on isoenzyme banding pattern among fifty species of Medicago representing eight sections (Fabaceae). Biochem. Syst. Ecol. 2011, 39, 711–717. [Google Scholar] [CrossRef]
- Min, X.; Zhang, Z.; Liu, Y.; Wei, X.; Liu, Z.; Wang, Y.; Liu, W. Genome-Wide Development of MicroRNA-Based SSR Markers in Medicago truncatula with Their Transferability Analysis and Utilization in Related Legume Species. Int. J. Mol. Sci. 2017, 18, 2440. [Google Scholar] [CrossRef] [PubMed]


Publisher’s Note: MDPI stays neutral with regard to jurisdictional claims in published maps and institutional affiliations. |
© 2021 by the authors. Licensee MDPI, Basel, Switzerland. This article is an open access article distributed under the terms and conditions of the Creative Commons Attribution (CC BY) license (https://creativecommons.org/licenses/by/4.0/).