1. Introduction
Doping is the act of using prohibited substances and/or methods in sports to enhance athletic performance and success by improving physical performance [
1]. The World Anti-Doping Agency (WADA), which was established in 1999, is involved in scientific research on doping, anti-doping education, development of anti-doping strategies, and monitoring of the World Anti-Doping Code to ensure soundness and fairness in sports worldwide [
2]. However, despite WADA’s substantial efforts, doping has not been eradicated from competitive sports.
The International Standard Prohibited List [
3] stipulated in the World Anti-Doping Code 2021 [
4], which is published with annual revisions by the WADA, describes various formulations and methods used in doping. This list includes “gene doping” as a form of abuse of gene therapy technology. Therefore, our research group has been conducting research for more than five years to establish an examination method for gene doping [
5,
6,
7].
Gene therapy has rapidly evolved as a new treatment method for single-gene hereditary diseases and acquired diseases, and these treatments have yielded many beneficial results [
8]. In fact, gene therapeutics, as represented by Collategen (AnGes, Ibaraki, Osaka, Japan) for arteriosclerosis obliterans and Buerger’s disease, Zolgensma (Novartis Gene Therapies, Chicago, IL, USA) for spinal muscular atrophy, and YESCARTA (Kite Pharma, Santa Monica, CA, USA) for relapsed/refractory large B-cell lymphomas, have been approved for the treatment of various human diseases. Recently, gene therapy technology has also been used to develop vaccines based on mRNA [
9] or adenoviral vectors [
10] against coronavirus disease 2019 (COVID-19) caused by severe acute respiratory syndrome coronavirus-2 (SARS-CoV-2). The substantial increase in research on gene therapy since the early 2000s led the WADA to raise concerns about the abuse of gene therapy technology for doping. However, the development of robust and universal methods to identify gene doping is still ongoing. Although WADA recently established laboratory guidelines for PCR methods in gene-doping tests, and the guidelines describe basic validation for the PCR methods in sufficient detail [
11], they do not include descriptions of detection methods for individual target genes or vectors. Thus, there is an urgent need to develop detailed detection methods that can detect any type of gene doping.
The erythropoietin (
EPO) gene has been identified as a target for abuse in gene doping because EPO- and EPO-related formulations have been frequently used in doping to enhance the endurance performance of athletes in cycling, boxing, athletics, and rowing [
12,
13,
14,
15,
16], and EPO and EPO-related formulations are included on the International Standard Prohibited List [
3] published by WADA. According to the Wiley database on Gene Therapy Trials Worldwide [
17], recombinant adenovirus (rAdV) is the most frequently used vector in clinical trials for gene therapy. Thus, there is a strong possibility that combinations of the
EPO gene and rAdV are being used for gene doping in human athletes, necessitating methods for detecting gene doping using this combination.
Although some previous studies have attempted to establish animal models of gene doping by using naked plasmid vectors, including the
EPO gene [
6,
18,
19], they did not evaluate the phenotypic effects of
EPO gene doping, such as changes in the number of red blood cells (RBCs), gene and protein expression of EPO, and secretion levels of EPO in the blood. For these reasons, these models showed limited utility for the development of detection methods for gene doping. Moreover, none of these reports established a gene-doping model using a combination of the
EPO gene and rAdV. On the basis of these previous studies and history, we recognized that a robust model for developing a detection method for direct or indirect proof of gene doping using rAdV and the human
EPO (h
EPO) gene (rAdV-h
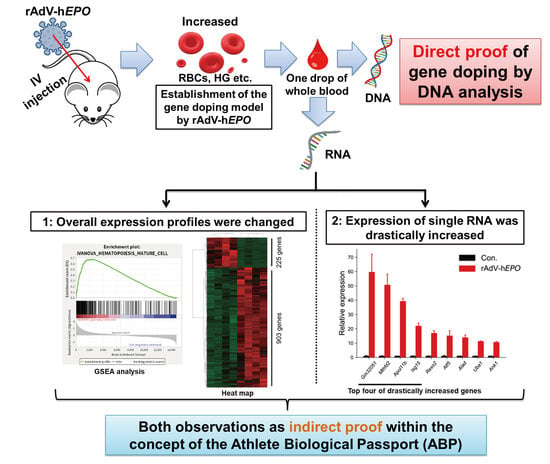
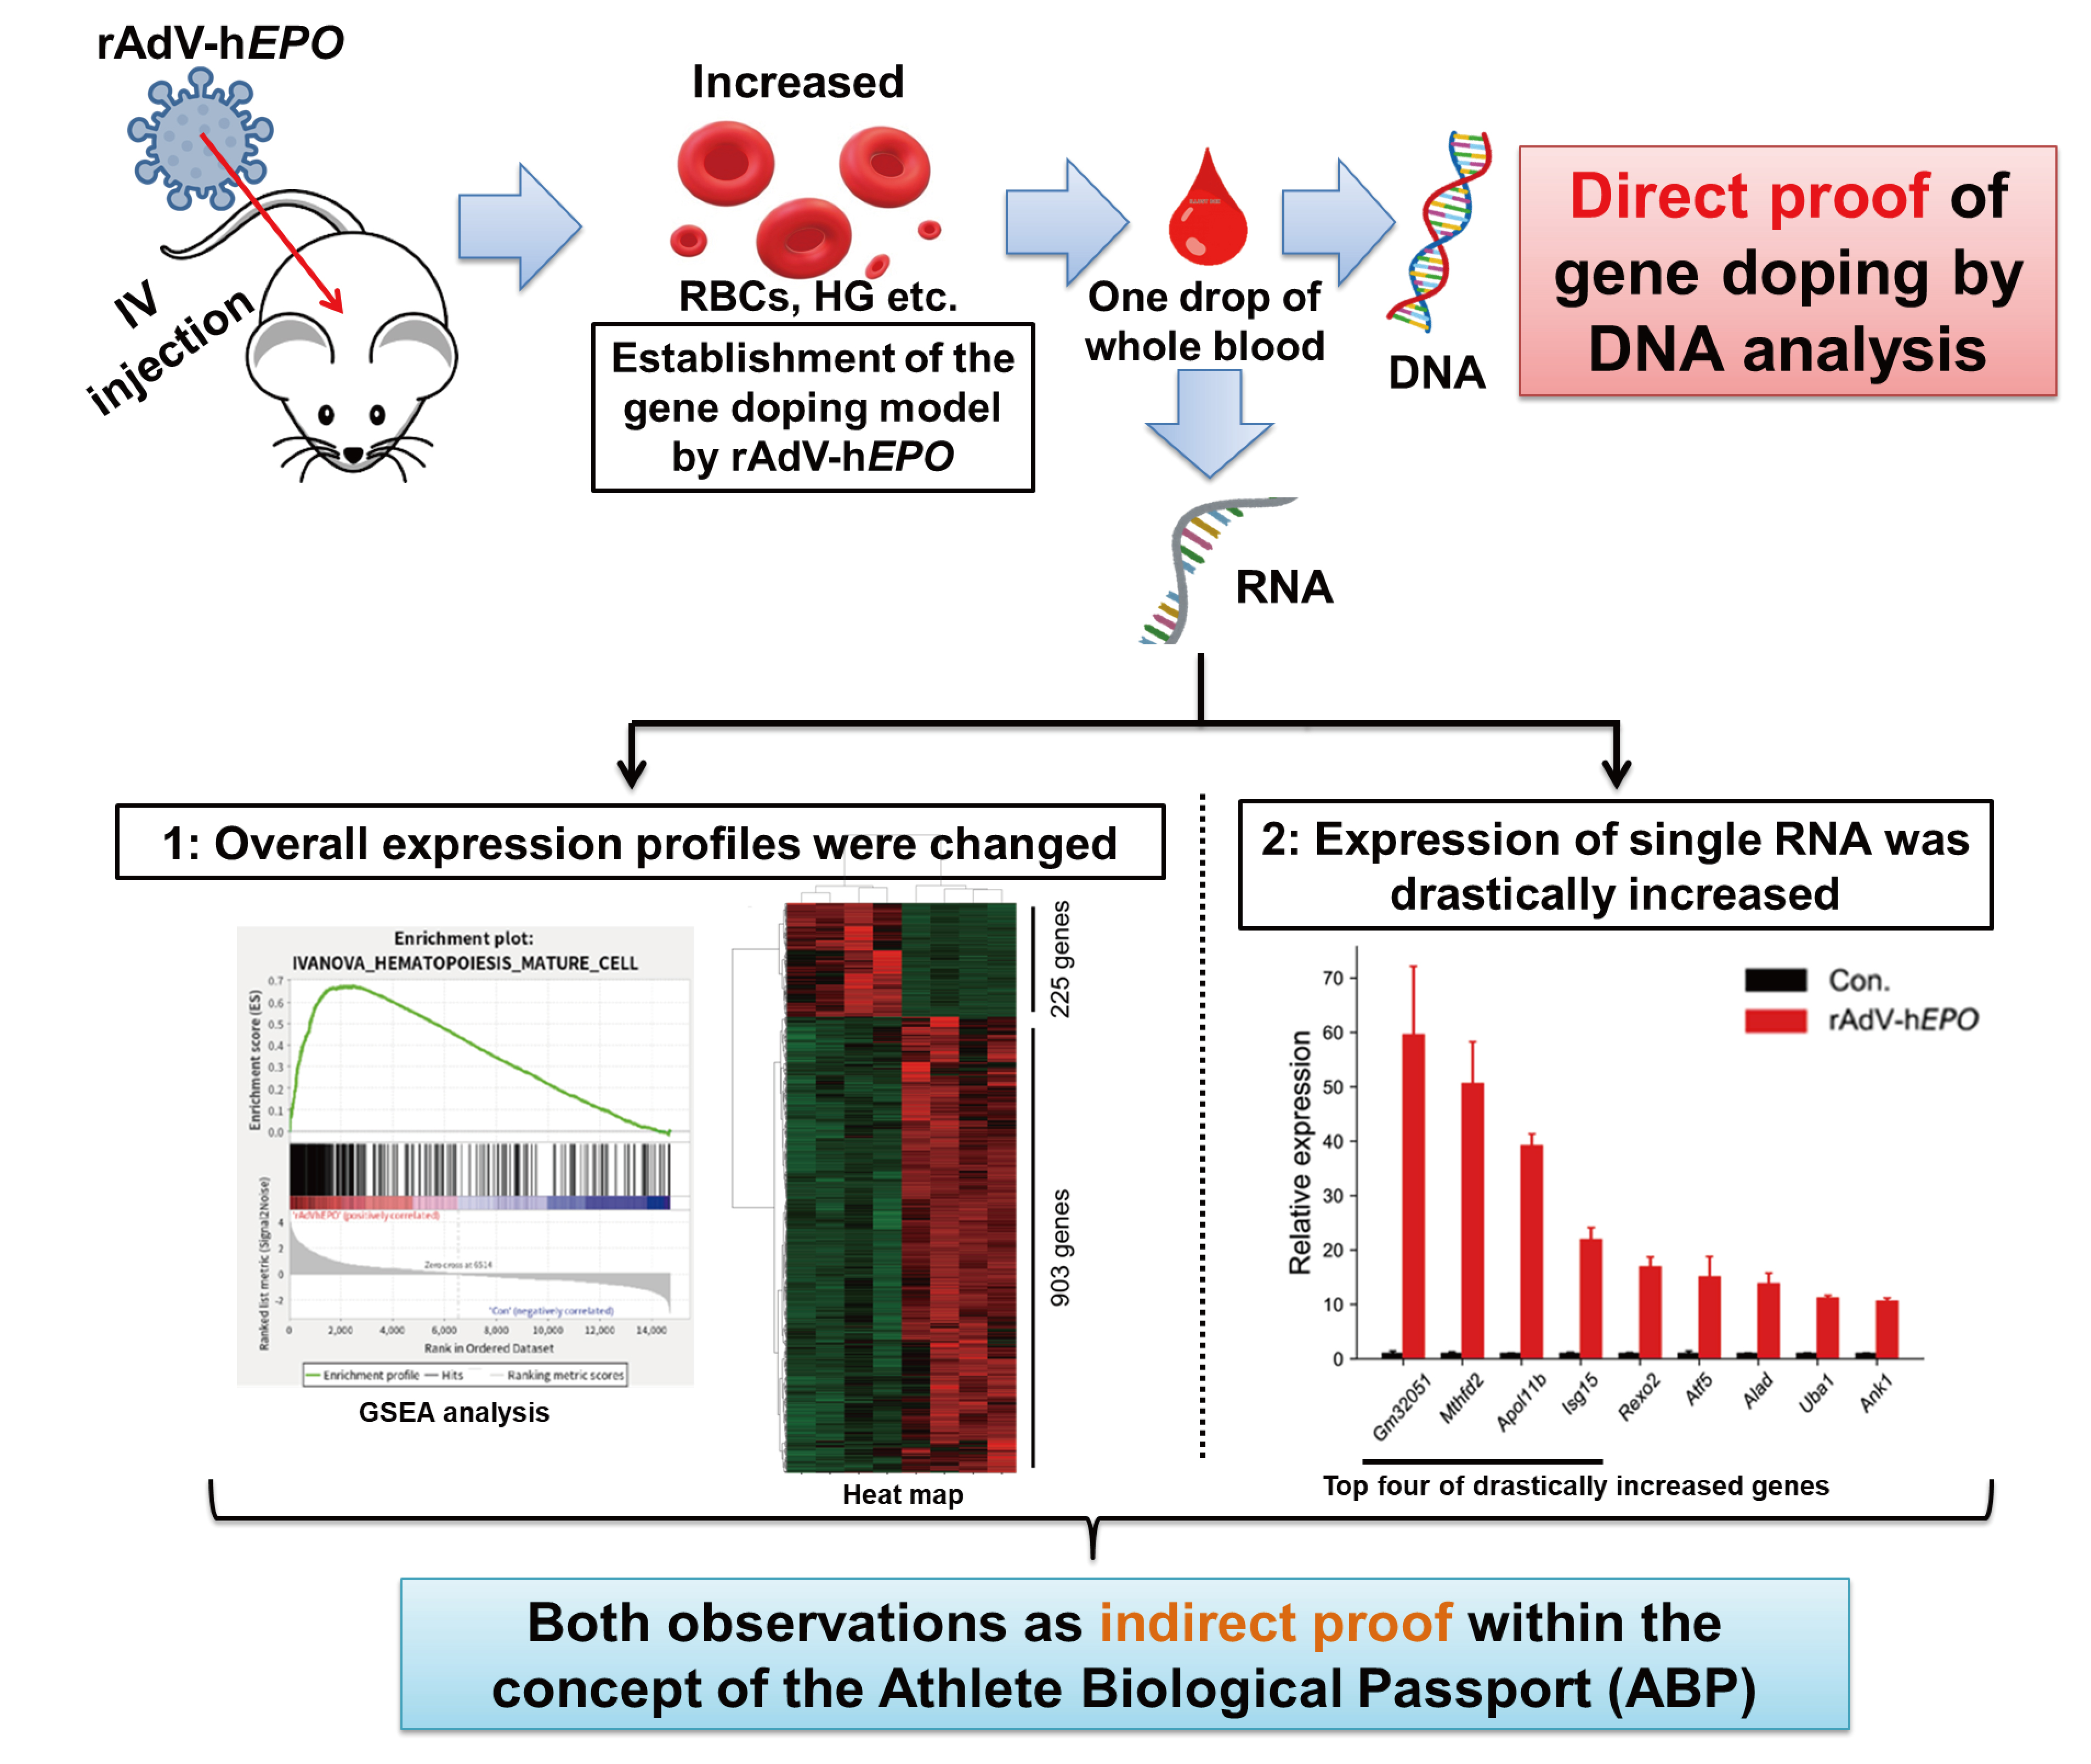
EPO) was needed. As direct proof, we considered that the detection of viral vector-specific DNA fragments by a TaqMan qPCR assay would be the most reasonable approach because the principle underlying this assay has already been successfully used in testing for SARS-CoV-2. In addition, as indirect proof, we considered that monitoring fluctuations of RNA expression in whole-blood samples could be applied to the parameters of the Athlete Biological Passport (ABP) because the fundamental principle underlying the ABP involves monitoring selected biological variables that indirectly reveal the effects of doping over time rather than attempting to detect the doping substance or method itself [
20]. Furthermore, the WADA describes that the ABP can be used to identify athletes requiring further attention through intelligent, timely interpretation of passport data and can notably be used as a complement to analytical methods to further refine and strengthen overall anti-doping strategies [
20]. In other words, the detection of indirect proof in gene-doping tests is also important to identify athletes requiring further attention and to support the findings determined using direct proof. Therefore, in this study, total RNA sequencing (RNA-seq) using whole-blood RNA from an animal model was also performed to identify RNAs as a form of novel indirect proof based on the concept of the ABP.
In summary, the primary objectives of this study were the establishment of a robust gene-doping mouse model using rAdV-hEPO, the identification of RNA as indirect proof based on the concept of the ABP, and the development of detection methods to obtain direct and indirect proof for gene doping.
2. Materials and Methods
2.1. Creation of the rAdV-hEPO Vector
To establish a robust gene-doping mouse model injected with rAdV-h
EPO, a viral vector was created using the following procedures. Three plasmids, namely, (p) h
EPO-Myc-DDK-tag (Cat# RC210775L1; ORIGENE, Rockville, MD, USA), pENTR4 (Cat# A10465; Thermo Fisher Scientific, Waltham, MA, USA), and pAd/CMV/V5-DEST (Cat# V49320; Thermo Fisher Scientific, Waltham, MA, USA; can make rAdV type 5), were used to create the rAdV-h
EPO vector. First, PCR was performed to amplify the h
EPO gene, including the myc and DDK (FLAG) tags and the restriction enzyme sites of
EcoRI/
Not I from the ph
EPO-Myc-DDK-tag by using PCR enzymes (KOD-Plus-, Cat# KOD-201; TOYOBO, Osaka, Japan). The PCR amplicon was subjected to gel electrophoresis, after which the amplicon DNA was extracted and purified from the gel. After digestion of the purified amplicon and pENTR4, a homologous recombination reaction was induced in the mixture by using an In-Fusion HD Cloning Kit (Cat# 63964; Takara Bio, Kusatsu, Shiga, Japan). The obtained plasmid (pENTR4-h
EPO) was mixed with pAd/CMV/V5-DEST, and an LR recombination reaction was induced using Gateway LR Clonase II Enzyme Mix (Cat# 11791020; Thermo Fisher Scientific, Waltham, MA, USA). Finally, the obtained plasmid (pAd/CMV/V5-DEST-h
EPO) was digested using a
Pac1 restriction enzyme (Cat# R0547; New England Biolabs, Ipswich, MA, USA) and transfected into HEK 293A cells (Cat# R70507; Thermo Fisher Scientific, Waltham, MA, USA) with a transfection reagent (PEI MAX, Cat# 24765-1; Polysciences, Warrington, PA, USA) to amplify rAdV type 5 including the h
EPO gene cassette. The amplified rAdV-h
EPO vectors were purified by CsCl density-gradient ultracentrifugation followed by gel filtration with a PD-10 Column (Cat# 17085101; Cytiva, Marlborough, MA, USA) according to the protocol described by Takeuchi et al. [
21,
22]. The viral particles (VPs) were suspended in 10% glycerol/phosphate-buffered saline (PBS), and the concentration of rAdV VPs was measured using a spectrophotometer according to the method described by Sweeney and Hennessey [
23].
2.2. Animal Experiments
All animal experiments in this study were approved by the Animal Care Committee, University of Tsukuba (approval number: 20-361). Seven-week-old male ICR mice were purchased from CREA Japan (Meguro, Tokyo, Japan) and then subjected to a 1-week acclimation period. The mice were bred and maintained in an air-conditioned animal house under specific pathogen-free conditions and subjected to a 12/12 h light/dark cycle. The mice were fed standard mice pellets and water ad libitum. At the start of the experiments, the age of the mice was 8 weeks. The animal experiments were broadly divided into short- and long-term experiments. None of the mice died during the experimental procedures described below.
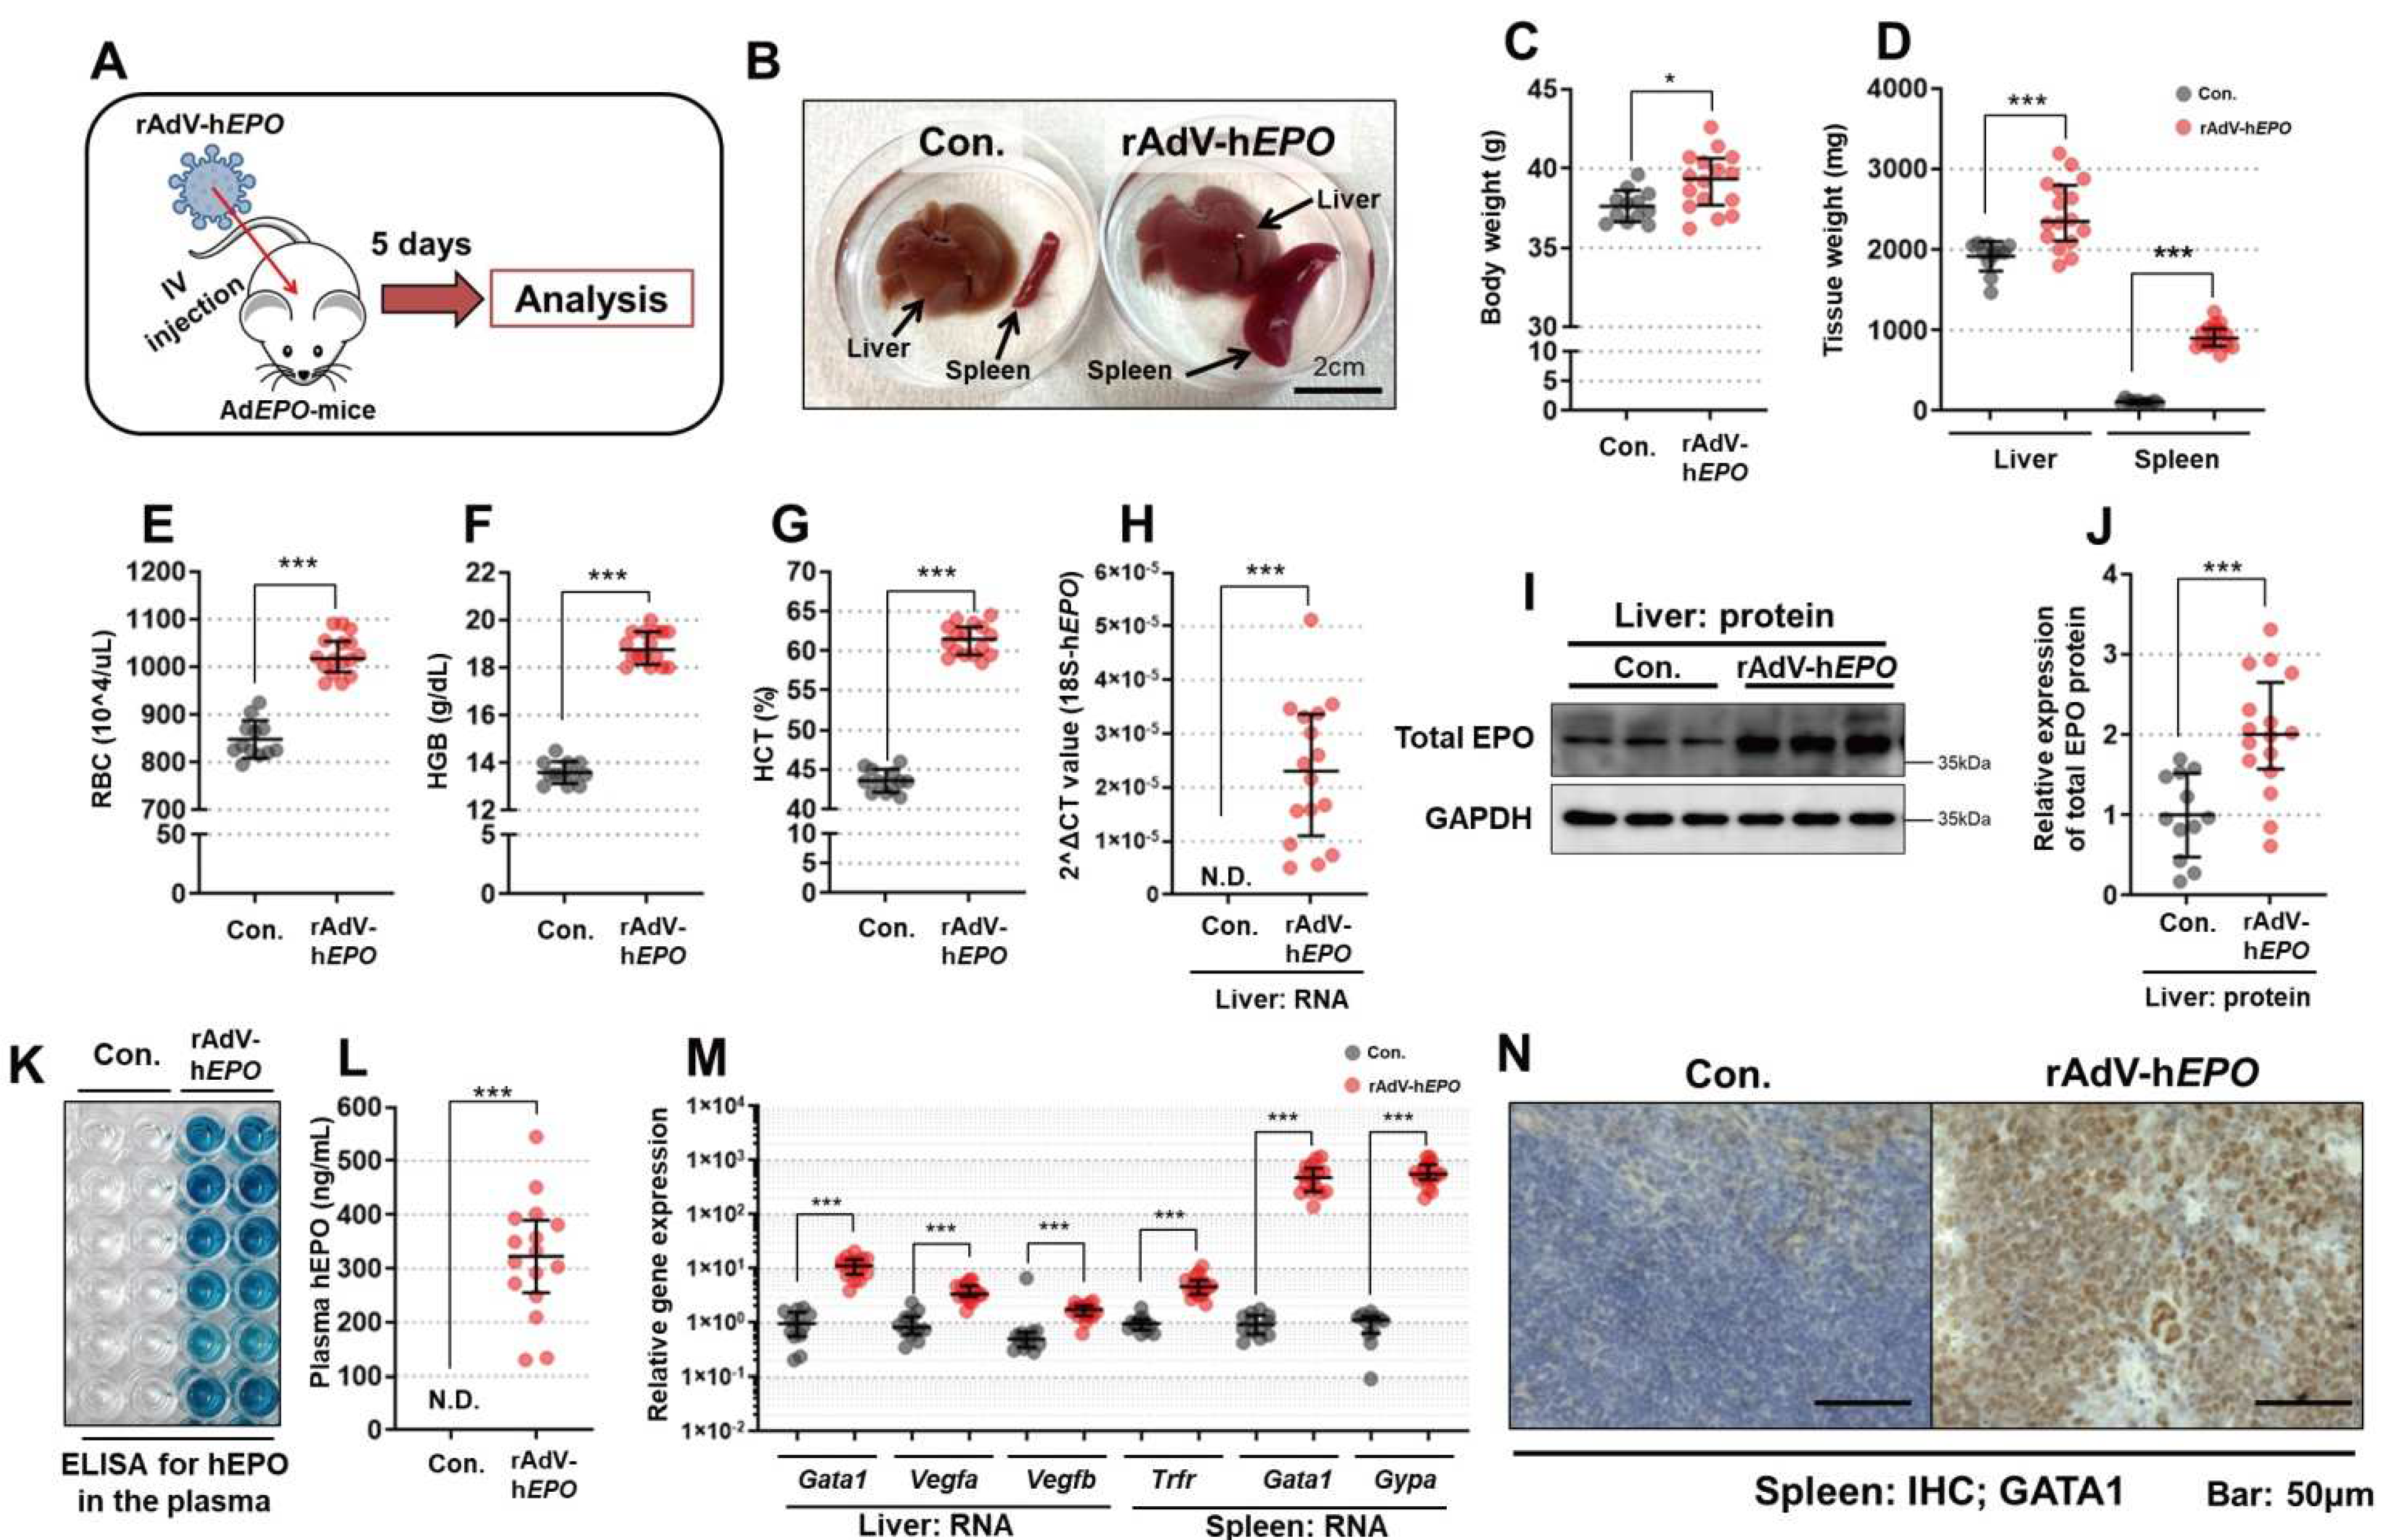
The short-term experiments were conducted to establish a gene-doping mouse model with rAdV-hEPO and to develop methods to detect direct and indirect proof of gene doping. An overview of these experiments is shown in Figure 1A. After 1 week of acclimatization, mice were randomly assigned to the control (Con.) or rAdV-hEPO groups. The mice in the rAdV-hEPO group (n = 16; named AdEPO mice) received injections of the AdV-hEPO vector (4.0 × 10¹¹ vp/100 µL/mouse) into the orbital sinus under systemic isoflurane inhalation anesthesia. The mice of the Con. group (n = 12) received injections of the 10% glycerol/PBS (100 µL/mouse) buffer used to suspend the rAdV. Five days after the injection, whole blood was obtained with EDTA-2Na as an anticoagulant from the inferior vena cava under systemic isoflurane inhalation anesthesia, after which the mice were euthanized. The collected whole blood was subjected to preprocessing for further analysis. Samples of liver and spleen were also harvested and flash-frozen in liquid nitrogen until further analysis. Other samples of spleen tissues were immersed into 10% formalin neutral buffer solution overnight to obtain paraffin block specimens. Supplementary experiments were conducted using the rAdV-ZsGreen1 (ZSG) vector to confirm the effects of hEPO-free rAdV on the phenotypes.
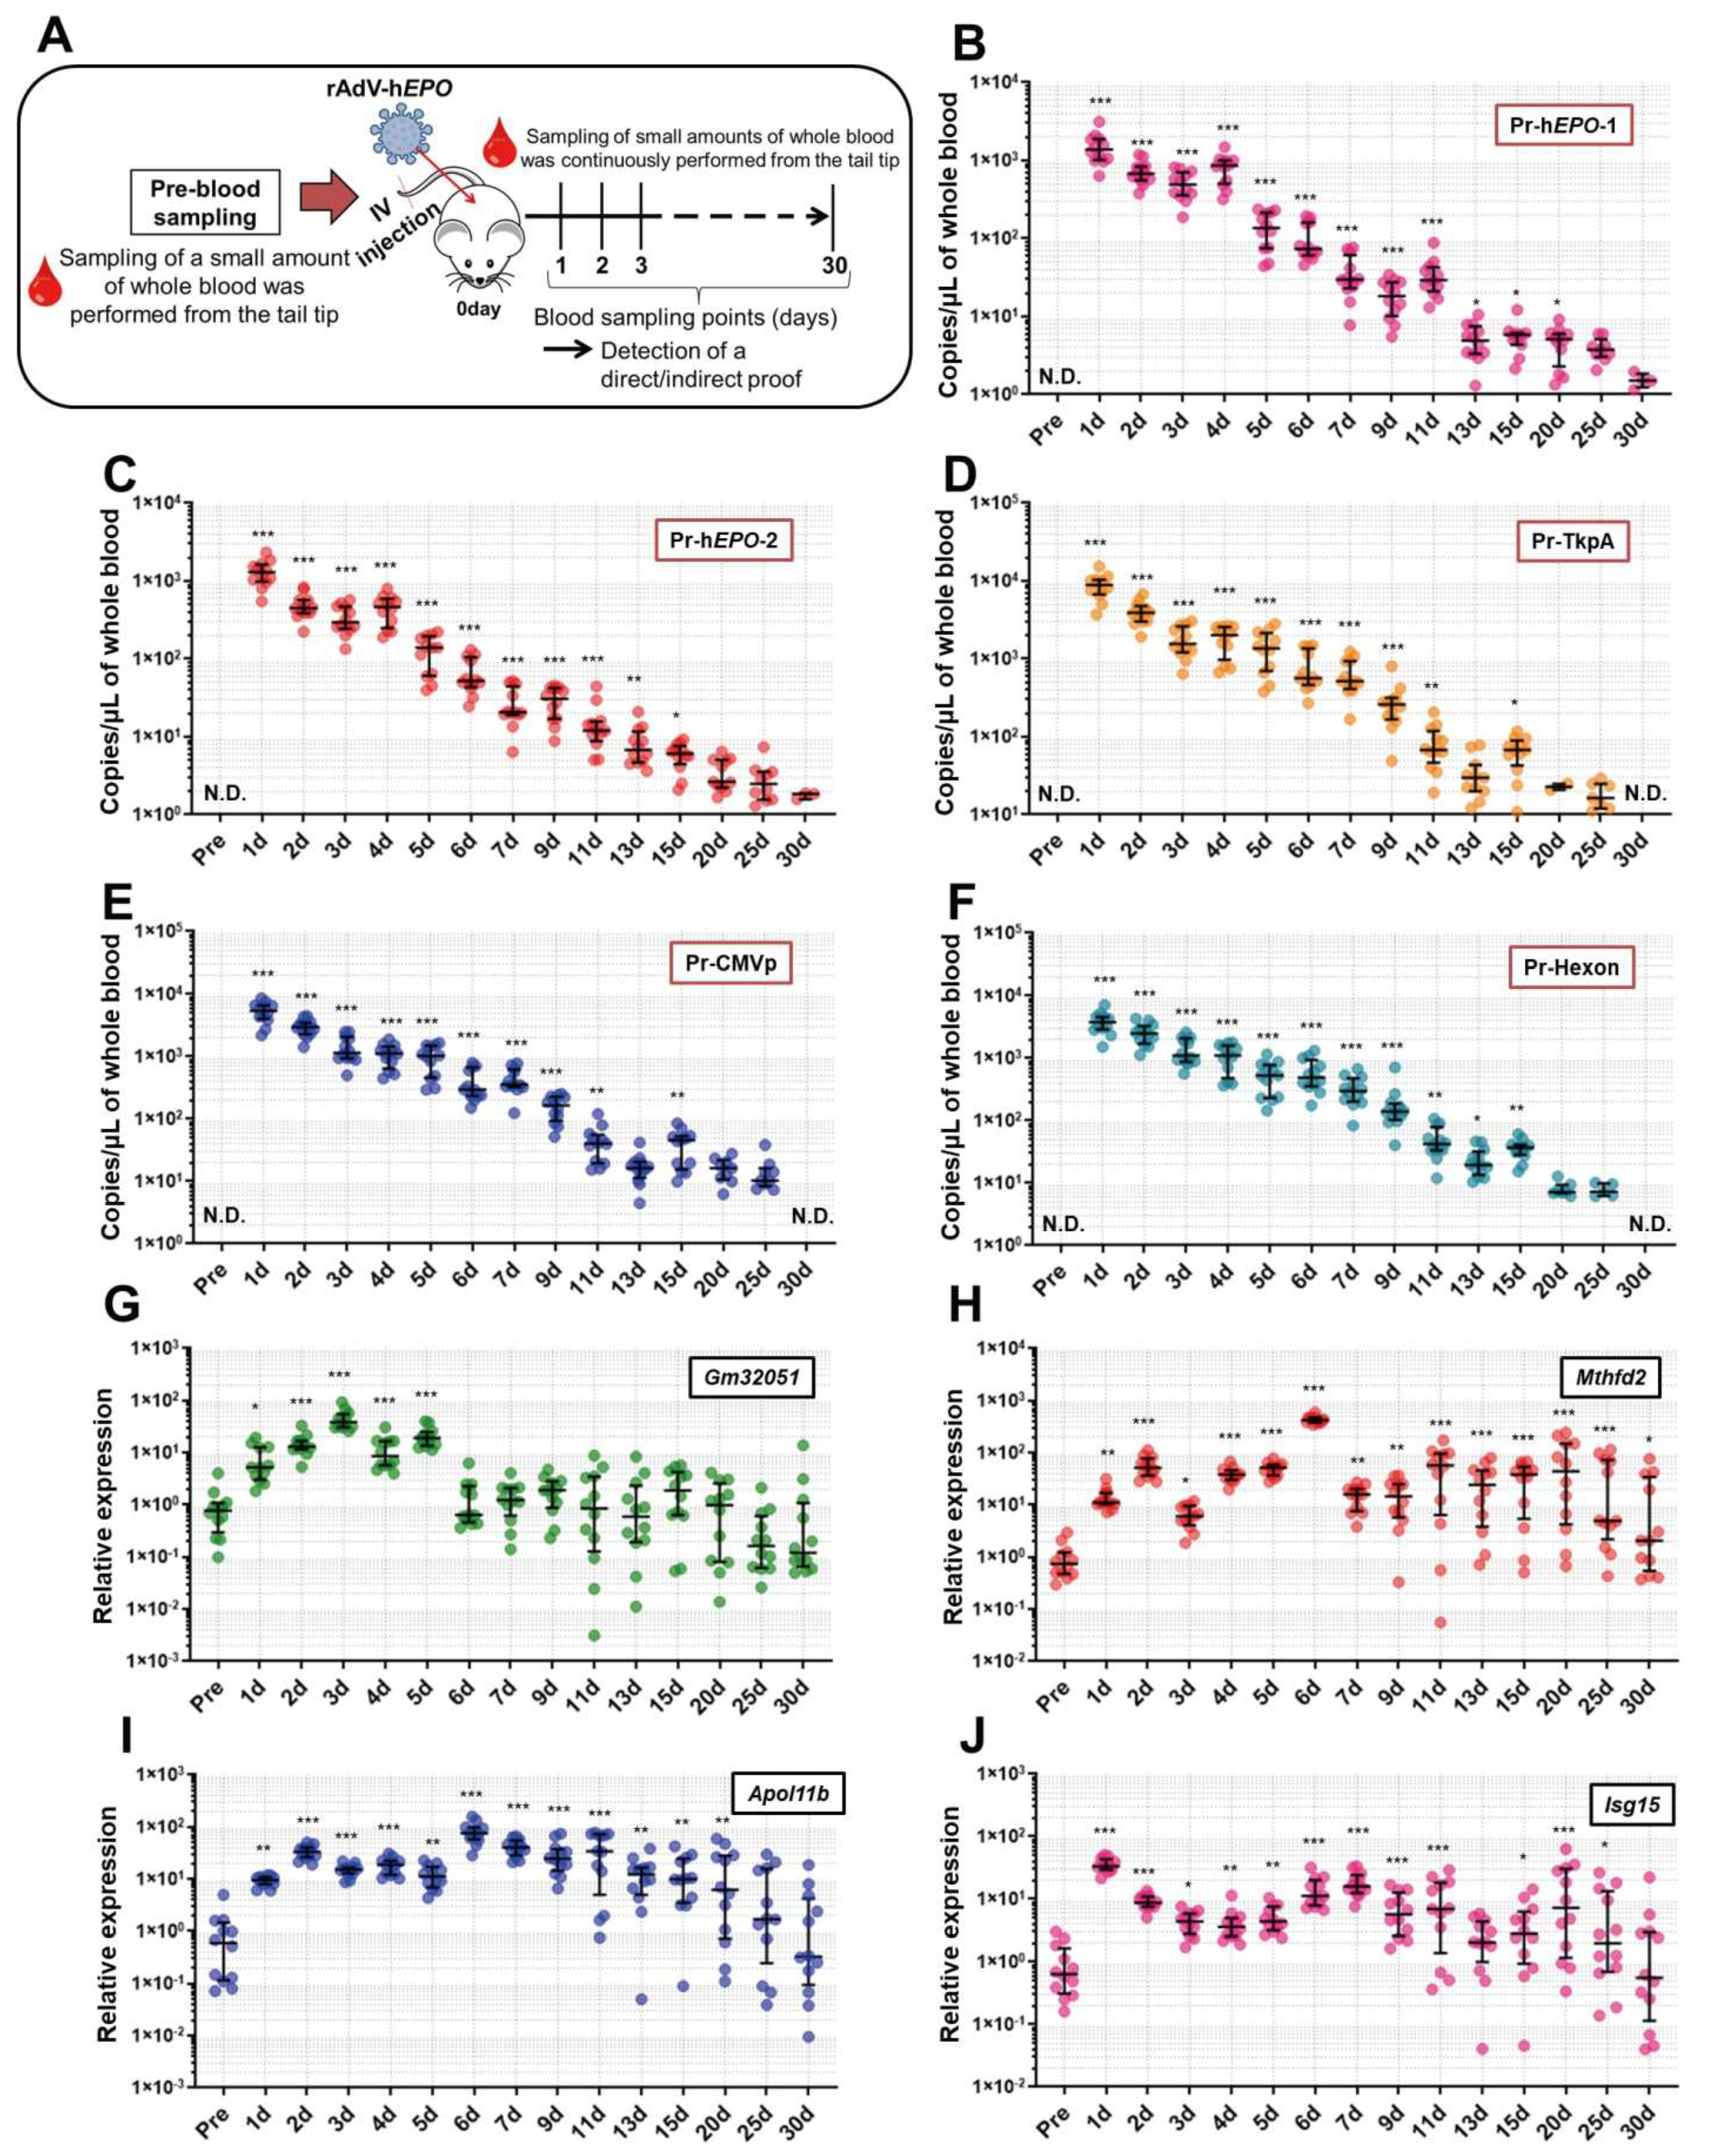
Long-term experiments were conducted to investigate how long direct and indirect proof of gene doping could be positively detected from approximately one drop of whole blood. An overview of these experiments is shown in Figure 5A. After 1 week of acclimatization, small whole-blood samples (approximately 100 µL; 2 drops) from mice (n = 12) were collected with EDTA-2Na using cuts made approximately 2 mm from the tail tip (Pre-time point). Then, the AdV-hEPO vector was injected using the methods described above. Subsequently, using the same method described above, blood samples were continually collected at the time points shown in Figure 5B–J until 30 days after the injection. In order to eliminate the adverse effects of continuous blood collection on mice (for example, anemia, hematopoietic stimulation, etc.) as much as possible, we selected a blood-collection method that only obtained small amounts (approximately 100 µL) from the tail tip. The collected blood samples were divided into two samples of approximately 50 µL each, and DNA and RNA were extracted from these samples and subjected to further analyses.
2.3. Measurements of General Hematopoietic Markers
Hematological indicators of RBCs, namely, the RBC count, hemoglobin (Hgb) level, and hematocrit (HCT) value, from the whole-blood samples obtained in the short-term experiments were measured on an automatic blood analyzer (Celltac α MEK6458; NIHON KODEN, Shinjuku, Tokyo, Japan) using 50 µL of whole blood.
2.4. Western Blotting
To confirm the expression of the hEPO protein in the liver in the short-term experiment, Western blotting (WB) was performed. To extract the total protein from the liver, liver specimens were homogenized in lysis buffer (50 mM Tris-HCl pH 7.4, 150 mM NaCl, 1% NP40, 1 mM EDTA) with a protease inhibitor cocktail (Cat# 25955-11; Nacalai Tesque, Nakagyo, Kyoto, Japan) using a bead crusher (TissueLyser LT, Cat# 85600; QIAGEN, Hilden, Germany). The homogenized liver lysate was then centrifuged at 12,000× g for 15 min, and the supernatant was collected. The concentration of total protein was measured using a BCA kit (Cat# T9300A; Takara Bio, Kusatsu, Shiga, Japan) and adjusted to 2 µg/mL. The supernatant was mixed with 2× loading buffer containing 2-mercaptoethanol and denatured at 95 °C for 5 min. Subsequently, 10 µL samples including 10 µg of protein were subjected to sodium dodecyl sulfate polyacrylamide gel electrophoresis (SDS-PAGE) using 15% gel at 140 V for 70 min, after which the separated proteins in the gel were transferred to a polyvinylidene fluoride (PVDF) membrane using the wet transfer method at 40 V overnight. This membrane was blocked with TBS-T buffer (50 mM Tris-HCl, 150 mM NaCl, 0.05% Tween-20) including 5% skim milk for 120 min and then washed with TBS-T buffer 3 times for 10 min. The membrane was incubated with the primary antibody for EPO (Cat# sc-80995; Santa Cruz Biotechnology, Dallas, TX, USA) at 100-fold overnight at 4 °C with gentle shaking and then washed with TBS-T buffer three times for 10 min. The washed membrane was incubated with anti-rabbit IgG HRP-linked antibody (Cat# 7074, 3000-fold; Cell Signaling Technology, Danvers, MA, USA) with gentle shaking for 30 min at room temperature. After washing the membranes three times for 10 min, the target protein bands were visualized with a chemiluminescence reagent (EzWestBlue; Cat# WSE-7140; ATTO, Taito, Tokyo, Japan) on ImageQuant LAS 4000 (Cytiva, Marlborough, MA, USA). The band images were exported as 16-bit TIFF images. The luminance of the bands of the TIFF images was quantified using ImageJ Fiji (ver. Java 8). The antibody for glyceraldehyde-3-phosphate dehydrogenase (GAPDH, Cat# 60004-1-Ig, 3000-fold; Proteintech, Rosemont, IL, USA) was also used as the loading control with anti-mouse IgG HRP-linked antibody (Cat# 7076, 3000-fold; Cell Signaling Technology, Danvers, MA, USA).
2.5. Enzyme-Linked Immunosorbent Assay
Enzyme-linked immunosorbent assay (ELISA) was performed to confirm the secretion of hEPO into the blood from the liver in AdEPO mice in the short-term experiment. Anti-hEPO (Cat# 500-P318; PeproTech, Cranbury, NJ, USA) was diluted to 0.5 µg/mL in PBS as a capture antibody, and 100 µL of the antibody solution was then applied into ELISA plates to obtain duplicate measurements. The plate was incubated at 4 °C overnight and then washed with PBS containing 0.05% Tween 20 (PBS-T) four times; then, 100 µL of the plasma samples diluted 10-fold with PBS were added to the wells and incubated for 1 h at room temperature. Solutions of hEPO recombinant protein (Cat# 100-64; PeproTech) in PBS were also added to generate a standard hEPO curve between 100 ng/mL and 10 pg/mL. After incubation, the plate was washed in the same way as described previously, and a 100 µL solution of a detection antibody (biotinylated anti-hEPO; Cat# 500-P318BT; PeproTech) diluted with PBS-T was applied to the wells at a concentration of 0.25 ng/µL, followed by incubation for 1 h at room temperature. After incubation, the plate was washed in the same way as described previously, and a 100 µL solution of HRP-conjugated streptavidin (Cat# SA00001-0; Proteintech, Rosemont, IL, USA) was diluted 5000-fold with PBS-T was applied to the wells. The plate was incubated at room temperature for 30 min and then washed the same way as described previously. After washing, a 100 µL mixture of coloring reagent and substrate (ELISA POD Substrate A.B.T.S Kit, Cat# 14351-80; Nacalai Tesque, Nakagyo, Kyoto, Japan) was applied and incubated for 20 min, followed by application of 100 µL of stop reagent for the coloring reaction. Finally, the absorbance at 405 nm with a reference at 600 nm was measured using a microplate reader. Using the absorbance data, a standard curve as a 4-parameter logistic of the Rodbard was created in ImageJ Fiji (Life-Line version, updated on 30 May 2017), and the concentration of hEPO in the plasma was calculated in duplicate measurements based on the standard curve (R2 = 0.99).
2.6. TB Green qPCR Assay for Tissue RNAs
To confirm the expression of hematopoietic marker genes in the liver and spleen in the short-term experiment, the TB Green qPCR assay was performed as an intercalation method. RNA extraction from the liver and spleen was performed using RNAiso Plus (Cat# 9180; Takara Bio, Kusatsu, Shiga, Japan) according to the manufacturer’s instructions. The extracted RNA solution in Milli-Q Water (Merck Millipore, Burlington, MA, USA) was diluted and adjusted to a concentration of 100 ng/µL. Then, 500 ng of RNA was used to prepare cDNAs using PrimeScript RT Master Mix (Cat# RR036A; Takara Bio) according to the manufacturer’s instructions. The cDNAs were diluted 10× using Milli-Q Water and subjected to a quantitative real-time PCR (qPCR) assay based on the intercalator-fluorescence dye. The qPCR assay was performed to quantify the gene expression of hematopoietic markers in the liver and spleen by using TB Green Premix Ex Taq II (Cat# RR820; Takara Bio) with primers from QuantStudio 5 Real-Time PCR Systems (Thermo Fisher Scientific, Waltham, MA, USA) as duplicate measurements. The targeted gene list and primer sequences are shown in
Supplementary Materials, Table S1. The template volume and primer concentrations were 2 µL and 100 nM, respectively, for a total reaction volume of 10 µL per well. Negative control wells were also established using pure water instead of the template. The conditions for thermal cycling were 95 °C for 5 min, followed by 40 cycles of 95 °C for 2 s and 60 °C for 20 s and a melt curve stage. Subsequently, the ΔΔCt method referencing
18s rRNA was used to calculate the relative gene expression values.
2.7. Immunohistochemistry
Immunohistochemistry (IHC) was performed to confirm the expression and localization of GATA1, a common hematopoietic marker, in the short-term experiment. In this experiment, 4 µm sections of the spleen on slides were deparaffinized with Lemosol A (Cat# 126-04413; FUJIFILM Wako Pure Chemical Corporation, Osaka, Japan) and rehydrated using ethanol and running water. After 3 min of rinsing with running water, the endogenous peroxidase in the tissues was removed by treatment with 3% hydrogen peroxide/methanol for 10 min. After washing with PBS for 1 min with gentle shaking, the sections were placed in 0.01 M citrate buffer and subjected to antigen activation at 121 °C for 10 min. Then, the sections were gently washed with PBS and blocked with 5% bovine serum albumin (BSA)/PBS-T for 1 h at room temperature. The primary antibody for GATA1 (Cat# 10917-AP; Proteintech, Rosemont, IL, USA), diluted 100-fold with 1% BSA/PBS-T, was applied to the sections and incubated at 4 °C overnight. On the next day, after washing the slides with PBS-T three times for 15 min, anti-rabbit IgG HRP-linked antibody (Cat# 7074; Cell Signaling Technology, Denvers, MA, USA) diluted 1:100 with 1% BSA/PBS-T was applied to the sections and incubated for 1 h at room temperature after washing with PBS. Subsequently, 3,3-diaminobenzidine tetrahydrochloride (DAB) solution in the peroxidase stain DAB Kit (Cat# 2598-50; Nacalai Tesque, Nakagyo, Kyoto, Japan) was applied to the section, and the section was incubated for 5 min at room temperature, followed by washing with PBS and counterstaining with hematoxylin. The sections were then dehydrated and mounted using Malinol (Cat# 2009-3; MUTO PURE CHEMICALS, Bunkyo, Tokyo, Japan) and observed under a microscope (BZ-X710; Keyence, Osaka, Japan).
2.8. DNA Extraction from Whole-Blood Samples
A phenol/chloroform/isoamyl alcohol solution (Cat# 25970-56; Nacalai Tesque) was used to extract total DNA from 100 µL (short-term experiment) or 50 µL (long-term experiment) of whole blood in accordance with the manufacturer’s instructions. The pellets of DNA were dissolved in 50 µL of Milli-Q Water, and the DNA solutions were subjected to the TaqMan qPCR assay to obtain direct proof of gene doping.
2.9. TaqMan qPCR Assay
Our previous studies have shown that whole-blood DNA contains high levels of viral genome DNA fragments as direct proof [
5,
6,
7]; therefore, we performed the TaqMan qPCR assay with whole-blood DNA. For detection of direct proof of gene doping in whole-blood DNA in the short- and long-term experiments using the TaqMan qPCR assays, the primers and TaqMan probes were designed to target the
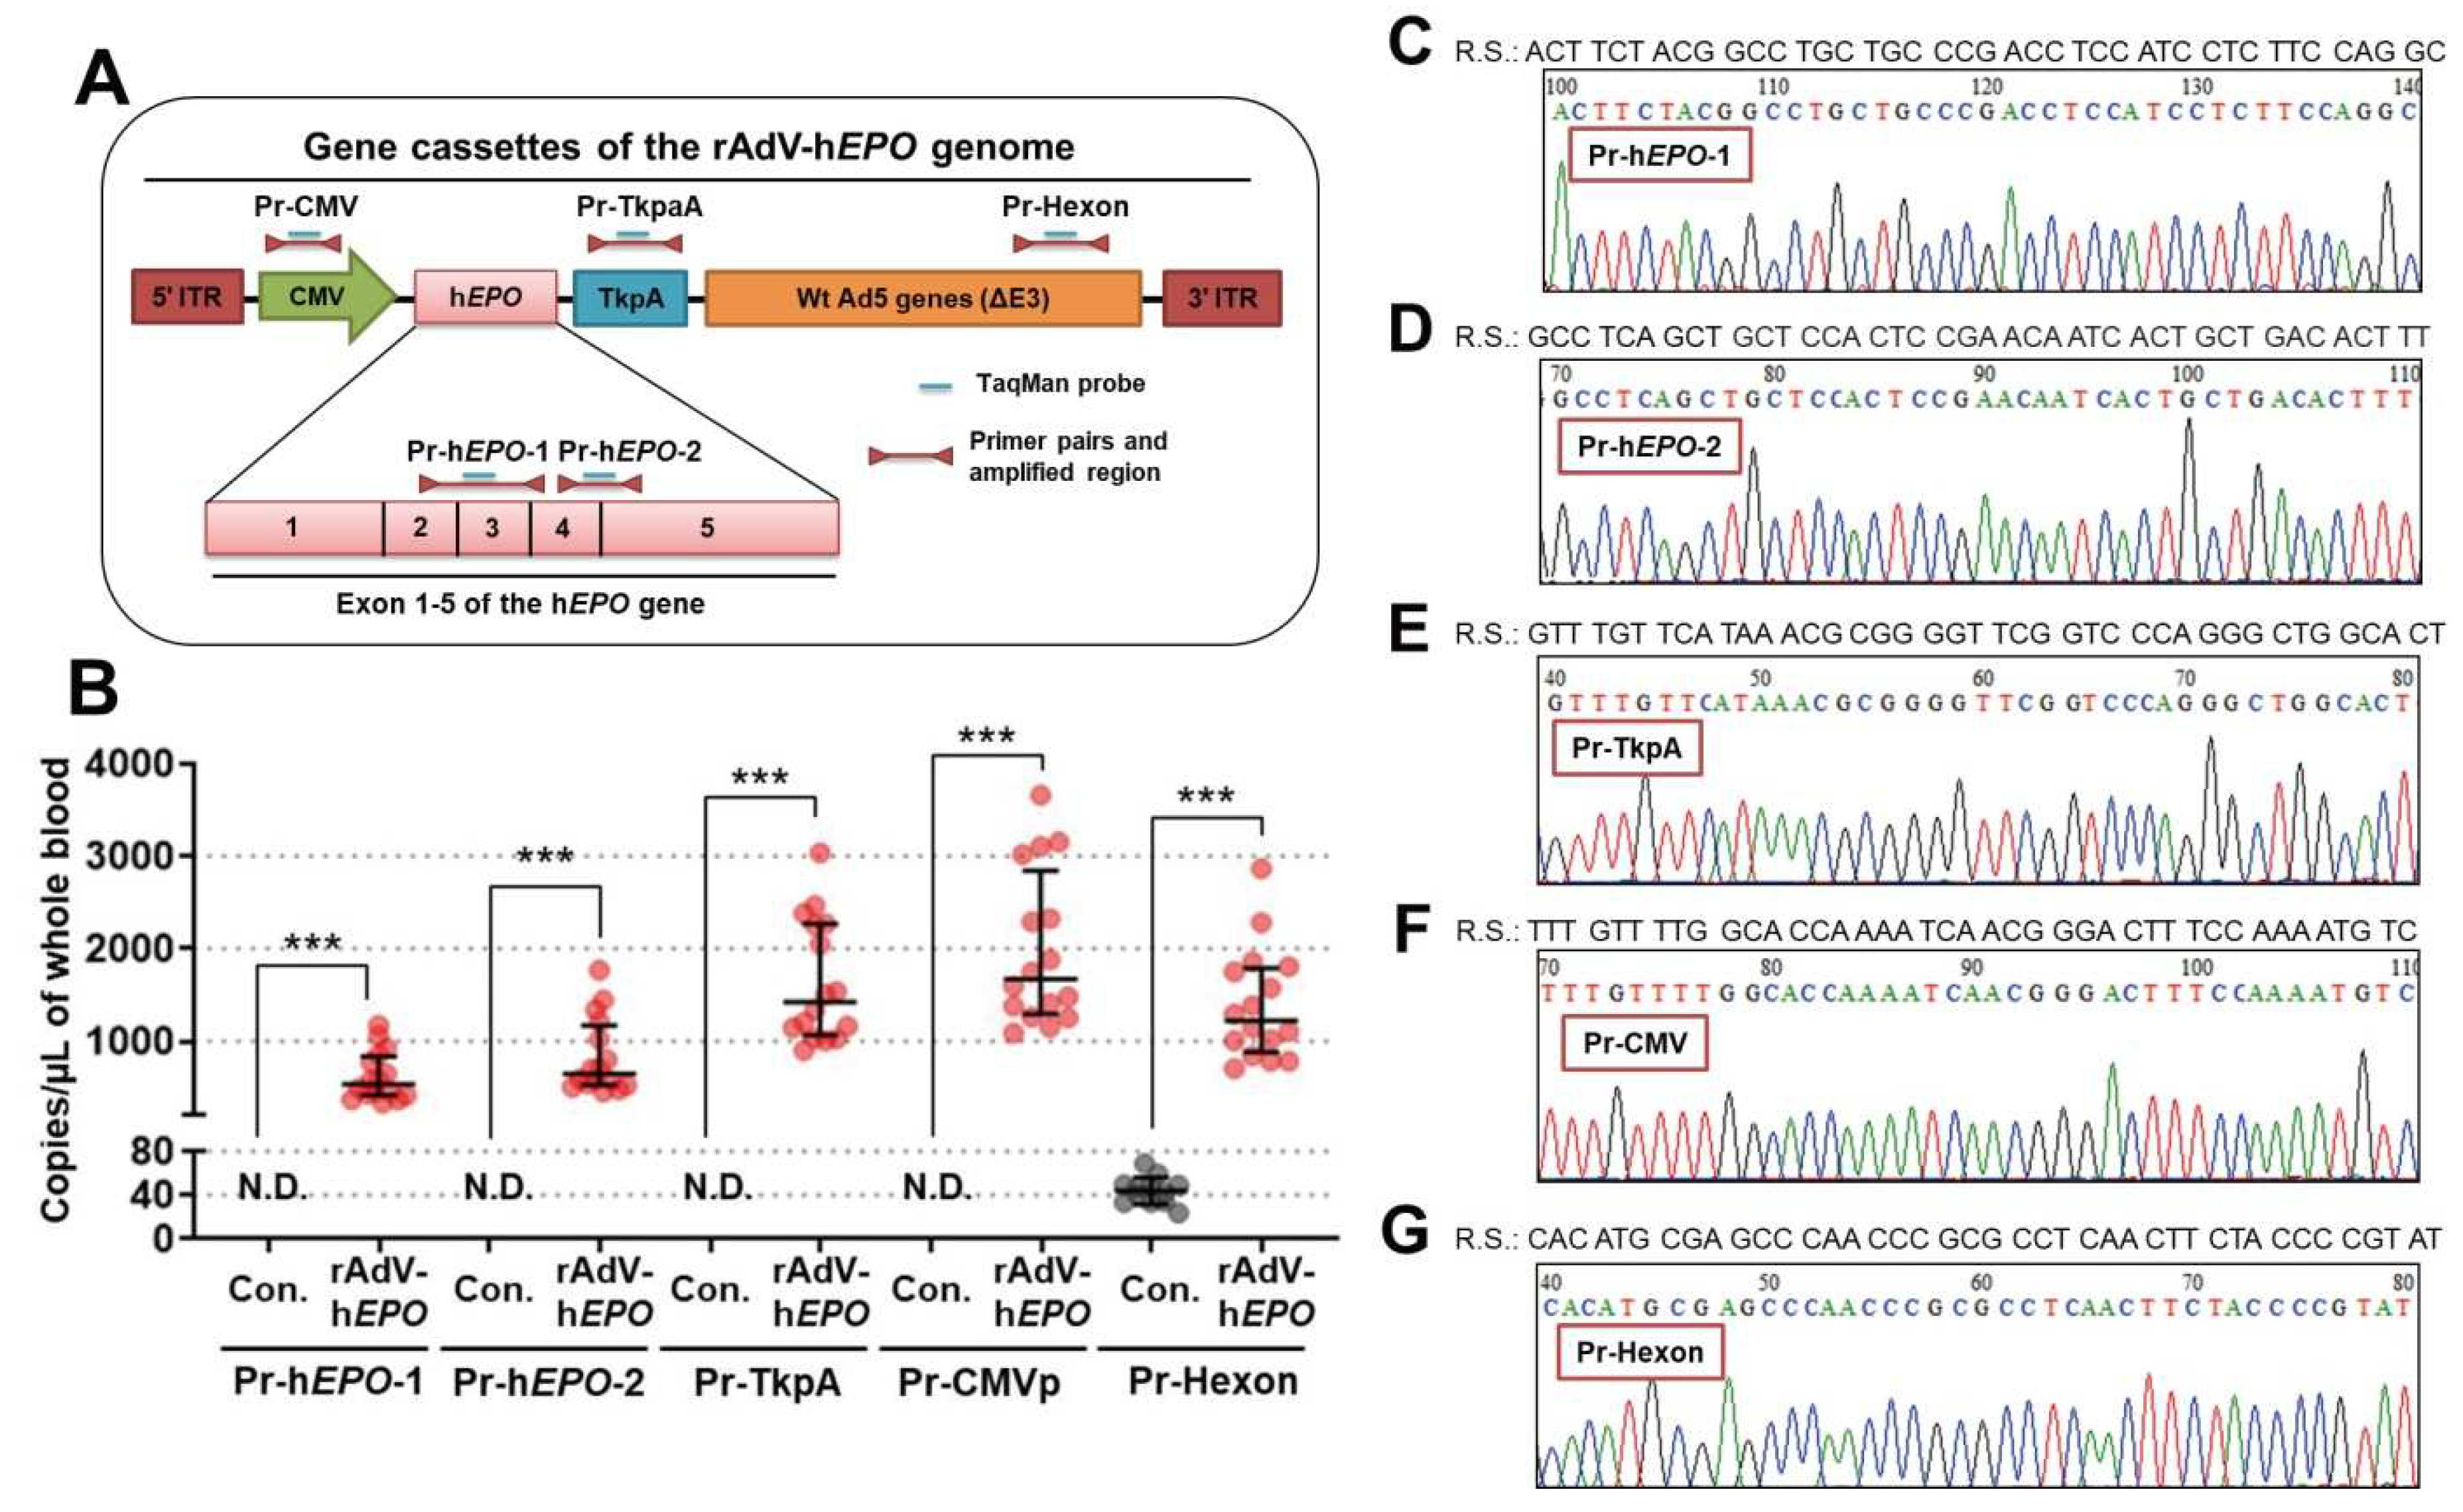
EPO gene (2 types), TkpA (thymidine kinase polyA from herpes simplex virus), hexon (major virus capsid protein from adenovirus), and CMVp (cytomegalovirus promoter) to ensure specific amplification of the rAdV-h
EPO genome using Primer-BLAST (NIH National Library of Medicine, Bethesda, MD, USA). The primers and TaqMan probes for the two types of h
EPO genes were prepared with exon-exon junctions (exons 2–4 and 4–5), which is a nonamplifying structure in the human genome [
6,
24,
25]. An overview of these design strategies is shown in Figure 2A. The primers and probes were also checked for specificity with in silico PCR using Primer-BLAST; these evaluations confirmed the absence of amplification in the human and mouse genomes. The sequences of the primers and TaqMan probes are shown in
Supplementary Table S1. The primers and probes in a double quencher system were systemized by Integrated DNA Technologies (Coralville, IA, USA). Next, the TaqMan qPCR assay was performed in duplicate to detect direct proof in whole-blood DNA by absolute quantification using PrimeTime Gene Expression Master Mix (Cat# 1055771; Integrated DNA Technologies) with the primers and TaqMan probes on QuantStudio 5 Real-Time PCR Systems (Thermo Fisher Scientific, Waltham, MA, USA). The template DNA volume was 2 µL, and the primer and probe concentrations were 200 nM and 100 nM, respectively, for a total reaction volume of 10 µL per well. Negative control wells were also established using pure water instead of a template. ph
EPO-Myc-DDK-tags including the h
EPO gene or pAd/CMV/V5-DEST including TkpA, hexon, and CMVp were used at 100 pg/μL to prepare a standard curve for absolute quantification, and the range of the standard curve was set to 1.19–19 × 10
7 copies/μL for the ph
EPO-Myc-DDK-tag and 2.53–10.1 × 10
6 copies/μL for the pAd/CMV/V5-DEST. The conditions of thermal cycling for all primer-probe pairs were 95 °C for 5 min, followed by 40 cycles of 95 °C for 2 s and 60 °C for 20 s. All standard curves had R
2 > 0.98.
2.10. Sanger Sequencing
After the TaqMan qPCR, solutions including the amplicon were pooled in a 1.5 mL microtube and then subjected to electrophoresis using a 2% agarose gel. The bands of the DNA amplicons were visualized using ethidium bromide solution. Next, the bands of desired fragment sizes were confirmed, indicating that specific amplifications of all primer-probe pairs were successful in the qPCR assay (
Supplementary Figure S7). Subsequently, the gels, including the bands, were cut and purified using a NucleoSpin Gel and PCR Clean-up kit (Cat# 740609; Takara Bio, Kusatsu, Shiga, Japan). Next, to check the sequence of the DNA amplicons, 5 ng of the purified DNA was subjected to Sanger sequencing via outsourcing to an external company (GENEWIZ, Shinagawa, Tokyo, Japan). The Sanger sequencing data were analyzed with CLC Sequence Viewer ver. 8.0 (QIAGEN, Hilden, Germany) and BioEdit ver. 7.2.5 (developer: Tom Hall, Carlsbad, CA, USA).
2.11. Total RNA-Seq
Total RNA-seq was performed to identify genes as a novel form of indirect proof based on the concept of the ABP. Total RNA of the mice in the short-term experiments was extracted from 100 µL of whole blood using RNAiso Blood (Cat# 9112; Takara Bio) according to the manufacturer’s instructions. The RNA pellets were dissolved in 30 µL of Milli-Q Water, and the RNA solutions of eight samples (Con.: n = 4 and rAdV-hEPO: n = 4) were checked for integrity using Agilent RNA 600 Nano Kit (Cat# 5067-1511; Agilent Technologies, Santa Clara, CA, USA) on a Bioanalyzer (Agilent Technologies). The RNA Integrity Number (RIN) of all samples was 8.8 or higher; thus, the RNAs of all eight samples could be subjected to library preparations for total RNA-seq. Using 300 ng of the RNAs from each sample, libraries were created using the NEBNext Ultra II RNA Library Prep Kit for Illumina and the NEBNext rRNA Depletion Kit v2 (Cat# E7770S and E7400L; New England Biolabs, Ipswich, MA, USA) according to the manufacturer’s instructions, and the final PCR cycle was 12. Concentrations and size distributions of the libraries were measured using an Agilent DNA 7500 kit (Cat#5067-1506; Agilent Technologies, Santa Clara, CA, USA) with Bioanalyzer. All samples were passed for analyses on NGS equipment.
The libraries were pooled, and the concentrations were adjusted to 1 nM. The pooled libraries were subjected to denaturation and neutralization. Subsequently, the libraries were diluted to 1.8 pM and then applied for an NGS run using NextSeq500/550 v2.5 (75 Cycles) Kits (Cat#20024906; Illumina, San Diego, CA, USA) in the NextSeq 500 System (Illumina). The sequencing was performed with paired-end reads of 36 bases. After the sequencing run, FASTQ files were exported, and the basic information of the NGS run data were checked on CLC Genomics Workbench 20.0.3 software (QIAGEN, Hilden, Germany). In the quality assessment of the reads, a PHRED score over 20 was confirmed for 99.73% of all reads, indicating the success of the run. The read number was approximately 37 to 45 million per sample as paired-end reads.
2.12. Bioinformatics Analysis
The following analysis was performed to identify genes as novel indirect proof based on the concept of the ABP using NGS run data. FASTQ files were mapped to the mouse genome (mm 10) using the CLC Genomics Workbench software (QIAGEN). A statistical differential expression test was performed by empirical analysis using the Differential Expression in Two Groups tool in the software. Differentially expressed genes (DEGs) defined by the cutoff levels were considered with a false discovery rate (FDR) < 0.01 and a 3-fold change cutoff. A principal component analysis (PCA) plot was created using the CLC software. Transcripts Per Kilobase Million (TPM) was used as an expression value for figure visualizations. The genes with low read counts were filtered by 0 in all samples. Gene Set Enrichment Analysis (GSEA) software [
26] was used to perform the enrichment analysis. Expression data sets and phenotype files were created and imported into GSEA software. On the basis of “Using RNA-seq Datasets with GSEA”, input normalized data were created with DEseq2 using TCC-GUI to perform GSEA [
27]. The GSEA process was performed with the default settings and the h.all.v7.4.symbols, C2.cgp.v7.4.symbols, C2.cp.v7.4.symbols, and C5.go.v7.4.symbols data sets. Cell-type-specific analysis (CTSA) was performed using the TissueEnrich R package with the default settings [
28] with RNA single-cell-type data from The Human Protein Atlas (
https://www.proteinatlas.org/ (accessed on 30 March 2021)) to calculate cell-type-specific gene enrichment. The names of the DEGs were matched to the corresponding human gene names with the biomaRt R package for conducting CTSA [
29]. Tissue-specific expression analysis (TSEA) was performed using the TissueEnrich web tool (
https://tissueenrich.gdcb.iastate.edu/ (accessed on 30 March 2021)) [
28] with the Mouse ENCODE Dataset to calculate tissue-specific gene enrichment. The Database for Annotation, Visualization and Integrated Discovery (DAVID version 6.8, LHRI) web tool was used to elucidate the enrichment terms with default settings [
30].
2.13. TB Green qPCR Assay for Whole-Blood RNA
To confirm whether the genes identified as indirect proof of gene doping showed reproducibility for the total RNA-seq results, a TB Green qPCR assay was performed for all samples (Con.:
n = 12, rAdV-h
EPO:
n = 15) in the short-term experiment. RNA extraction from 100 µL whole-blood samples was performed using the same methods mentioned in the “Total RNA-seq” section. Subsequently, the TB Green qPCR assay for the identified genes as indirect proof was performed using the same method described in the “TB Green qPCR assay for tissue RNAs” section. The primer sequences used in this section are shown in
Supplementary Table S1.
In addition, to investigate the period for which the identified indirect proof could be positively detected, the same qPCR assay was also performed using 50 µL whole-blood samples (n = 12) from the long-term experiment. In this experiment, cDNA concentrations were additionally measured using the QuantiFluor ssDNA System (Cat# E3190; Promega, Madison, WI, USA) according to the manufacturer’s instructions. Subsequently, the expression values of each targeted gene were normalized by their cDNA concentrations because the expression levels of the normalizer gene (18s rRNA) significantly changed according to the passage of days. In the actual experiment, we also considered the use of other normalizer genes. Gapdh and Rpl13a also showed significant changes upon rAdV injection. For this reason, we chose to normalize gene expression values to the total amount of cDNA.
2.14. Statistical Analysis
All data except the total RNA sequence data were statistically analyzed using GraphPad Prism version 9.0.2 (GraphPad, San Diego, CA, USA). All experimental data were first evaluated with the Shapiro–Wilk normality test to check the normality of the distributions. Subsequently, nonparametric tests were used for all data. For comparisons of two groups, the Mann–Whitney U test was performed. Comparisons of three or more groups were performed with Kruskal–Wallis H tests (one-way ANOVA of ranks) followed by a two-stage Benjamini, Krieger, and Yekutieli FDR procedure as a post-hoc test. A p-value less than 0.05 was considered to indicate statistical significance. All graphs without data from the bioinformatics analysis of the total RNA-seq are shown as individual plots and medians with interquartile ranges.
4. Discussion
Despite the WADA ban on gene doping [
3], the potential for
EPO-based gene doping remains high because of the rapid advancements in gene therapy. To date, several studies have developed protocols for detecting doping with the
EPO gene [
6,
18,
19,
24,
25]. Moreover, the WADA has recently established laboratory guidelines for PCR methods in gene-doping tests [
11]. Thus, large-scale gene-doping testing will be required in the future. However, despite providing detailed descriptions of validation methods for PCR analyses, the WADA guidelines [
11] include no description of detection methods for individual target genes or vectors. Moreover, animal models of gene doping using AdV-h
EPO have not been established, and no previous report has described a gene-doping test based on AdV-h
EPO. Therefore, in this study, we first attempted to develop a mouse model of gene doping using an rAdV-hEPO vector, which will facilitate the development of detection methods for individual target genes and vector-genome sequences.
The gene and protein expression of hEPO in the liver was confirmed in Ad
EPO mice, indicating that the h
EPO gene was successfully delivered to the liver. Moreover, secretion of hEPO protein as a hormone into blood was also confirmed in Ad
EPO mice. The expression of
Gata1 (regulator of hematopoietic signaling) [
31,
32],
Gypa, and
Trfr (specific markers of RBCs) [
33,
34,
35] were drastically increased in the spleens of Ad
EPO mice. Furthermore, the RBC count, Hgb level, and HCT were increased in Ad
EPO mice. We also supplementally clarified that these effects were not the result of injecting the rAdV-
ZSG vector as h
EPO-free rAdV. These results indicate that the mouse model of gene doping made with the rAdV-h
EPO vector was successfully established in this study. Moreover, the model may be useful to establish detection methods for gene doping.
Next, we aimed to develop detection methods for direct proof of gene doping by using the TaqMan qPCR assay. The primers were designed to include the exon-exon junction of the h
EPO gene, which can specifically detect transferred genes [
6,
24,
25] because if the exogenous gene is transferred to organs, the intron DNA sequences are not included. To detect robust proof of gene doping in mice, we also designed more primer-probe pairs to target DNA sequences of CMVp (cytomegalovirus promoter), hexon (major virus capsid protein from adenovirus), and TKpA (thymidine kinase polyA from herpes simplex virus), which are included in the rAdV-genome DNA sequence. These sequences are well used in genetic engineering experiments, and they are also present in wild herpes simplex viruses, adenoviruses, and cytomegaloviruses. Therefore, we thought that detection of these three DNA sequences in addition to the h
EPO gene, including the exon-exon junction, may be stronger evidence than single detection. The results showed that all of the targeted DNA fragments could be detected, and the amplicons also had accurate DNA sequences as determined by Sanger sequencing. Therefore, these primer-probe pairs and qPCR conditions can be directly used to examine whole-blood DNA from athletes. Moreover, detection of multiple DNA fragments, not just a single DNA fragment, would provide robust scientific evidence for identifying the type of viral vector and for doping trials. A wide variety of vectors can be used for gene doping, but this study highlights the possibility of estimating the vector type used for gene doping by detecting a specific sequence of the viral vector. This finding could provide strong evidence for potential doping. However, some caution is required while interpreting these findings. The gene cassettes of CMVp, hexon, and Tkpa are also applied in vectors for gene therapy [
36]. Moreover, recently, a vaccine for SARS-CoV-2 named ChAdOx1 nCoV-19 (AZD1222) may also include these gene cassettes because the vaccine was made using a replication-deficient simian adenoviral vector [
37,
38]. Therefore, individuals who have been treated with gene therapy or the vaccine may show false-positive test results, and determination of the individual’s history before conducting gene-doping tests is necessary. In particular, if gene-doping tests are performed at the 2020 Tokyo Olympics (held in July 2021), laboratories would need to confirm vaccination for SARS-CoV-2 in athletes because athletes are more likely to travel to Japan after being vaccinated because of the recent significant spread of COVID-19 worldwide.
To investigate the period for which genome-specific DNA fragments of the rAdV-h
EPO vector can be detected as proof of gene doping, the TaqMan qPCR assay was performed using DNA obtained from single-drop blood samples chronologically harvested from the mouse model. The statistical analyses showed that significant proof of gene doping could be detected until 20 days after injection of the vector. In addition, several mice showed positive results for viral fragments until 30 days, which can be used as the basis for a qualitative test. The metabolic rate of mice has been shown to be several times faster than that of humans [
39]. Hence, in humans performing gene doping with the rAdV-h
EPO vector, proof of doping may be detected in the blood for over a month, a longer time than in mice. Our previous study using droplet digital PCR reported that when the DNA extracted from one drop of whole blood from an rAdV gene-doping mouse model was diluted and adjusted to a concentration of 10 ng/uL, significant positive proof of gene doping was detected until 5 days after the injection [
5]. However, the present study showed that the use of an undiluted DNA solution could provide significant proof of gene doping for a longer time than that reported previously. These results suggest that undiluted DNA can be used to improve the sensitivity of detection, which is consistent with the WADA guidelines for PCR methods in gene-doping tests [
11]. Therefore, we also propose the use of undiluted DNA from whole-blood samples in gene-doping tests for humans.
As mentioned previously, proof of gene doping was detected using one drop of whole-blood DNA. At present, a small examination device for point-of-care testing (POCT) is frequently used with human blood samples to examine several diseases at clinical sites [
40]. With advancements in the technology underlying the current POCT devices, it may be possible to easily perform gene-doping tests with PCR using one drop of blood collected from the fingertip after puncture with a small needle. Therefore, we have begun to develop a small examination device that can be used for minimally invasive testing for gene doping on the sports field. However, there are major barriers to the development of such a device. Hgb and IgG have been reported to greatly inhibit PCRs [
41]. In addition, large amounts of protein may also decrease the sensitivity of PCRs. To develop an immediate POCT device for use in the sports field, it is necessary to resolve these issues, and we have been performing repeated trial-and-error testing in this regard. Another possibility is to consider the use of dried blood spots (DBS) for gene-doping tests. In a recent report by Marchand et al. [
42], only 20 μL of blood with plasmid including the
EPO gene as a spike was applied as DBS, and a qPCR assay using the DBS detected approximately 1000 copies of the
EPO gene fragments in the DNA. Moreover, no decrease in sensitivity was observed after storing the DBS at room temperature for one month. Since gene-doping tests using DBS offer multiple benefits, including simplification of sample collection, reduction in the burden on athletes, stabilization and reanalyzability of samples, etc., they may gain popularity in the future. Therefore, our next task is to collect a small amount of blood from the gene-doping model mouse (Ad
EPO mice) as DBS and confirm the test sensitivity.
The ABP advocated by the WADA involves constant monitoring of selected biological variables that can indirectly reveal the effects of doping rather than attempting to detect the doping agent or method itself [
20]. In other words, this concept is an attempt to detect traces of doping activity. The parameters evaluated as a part of ABP testing include general hematological parameters and steroid levels [
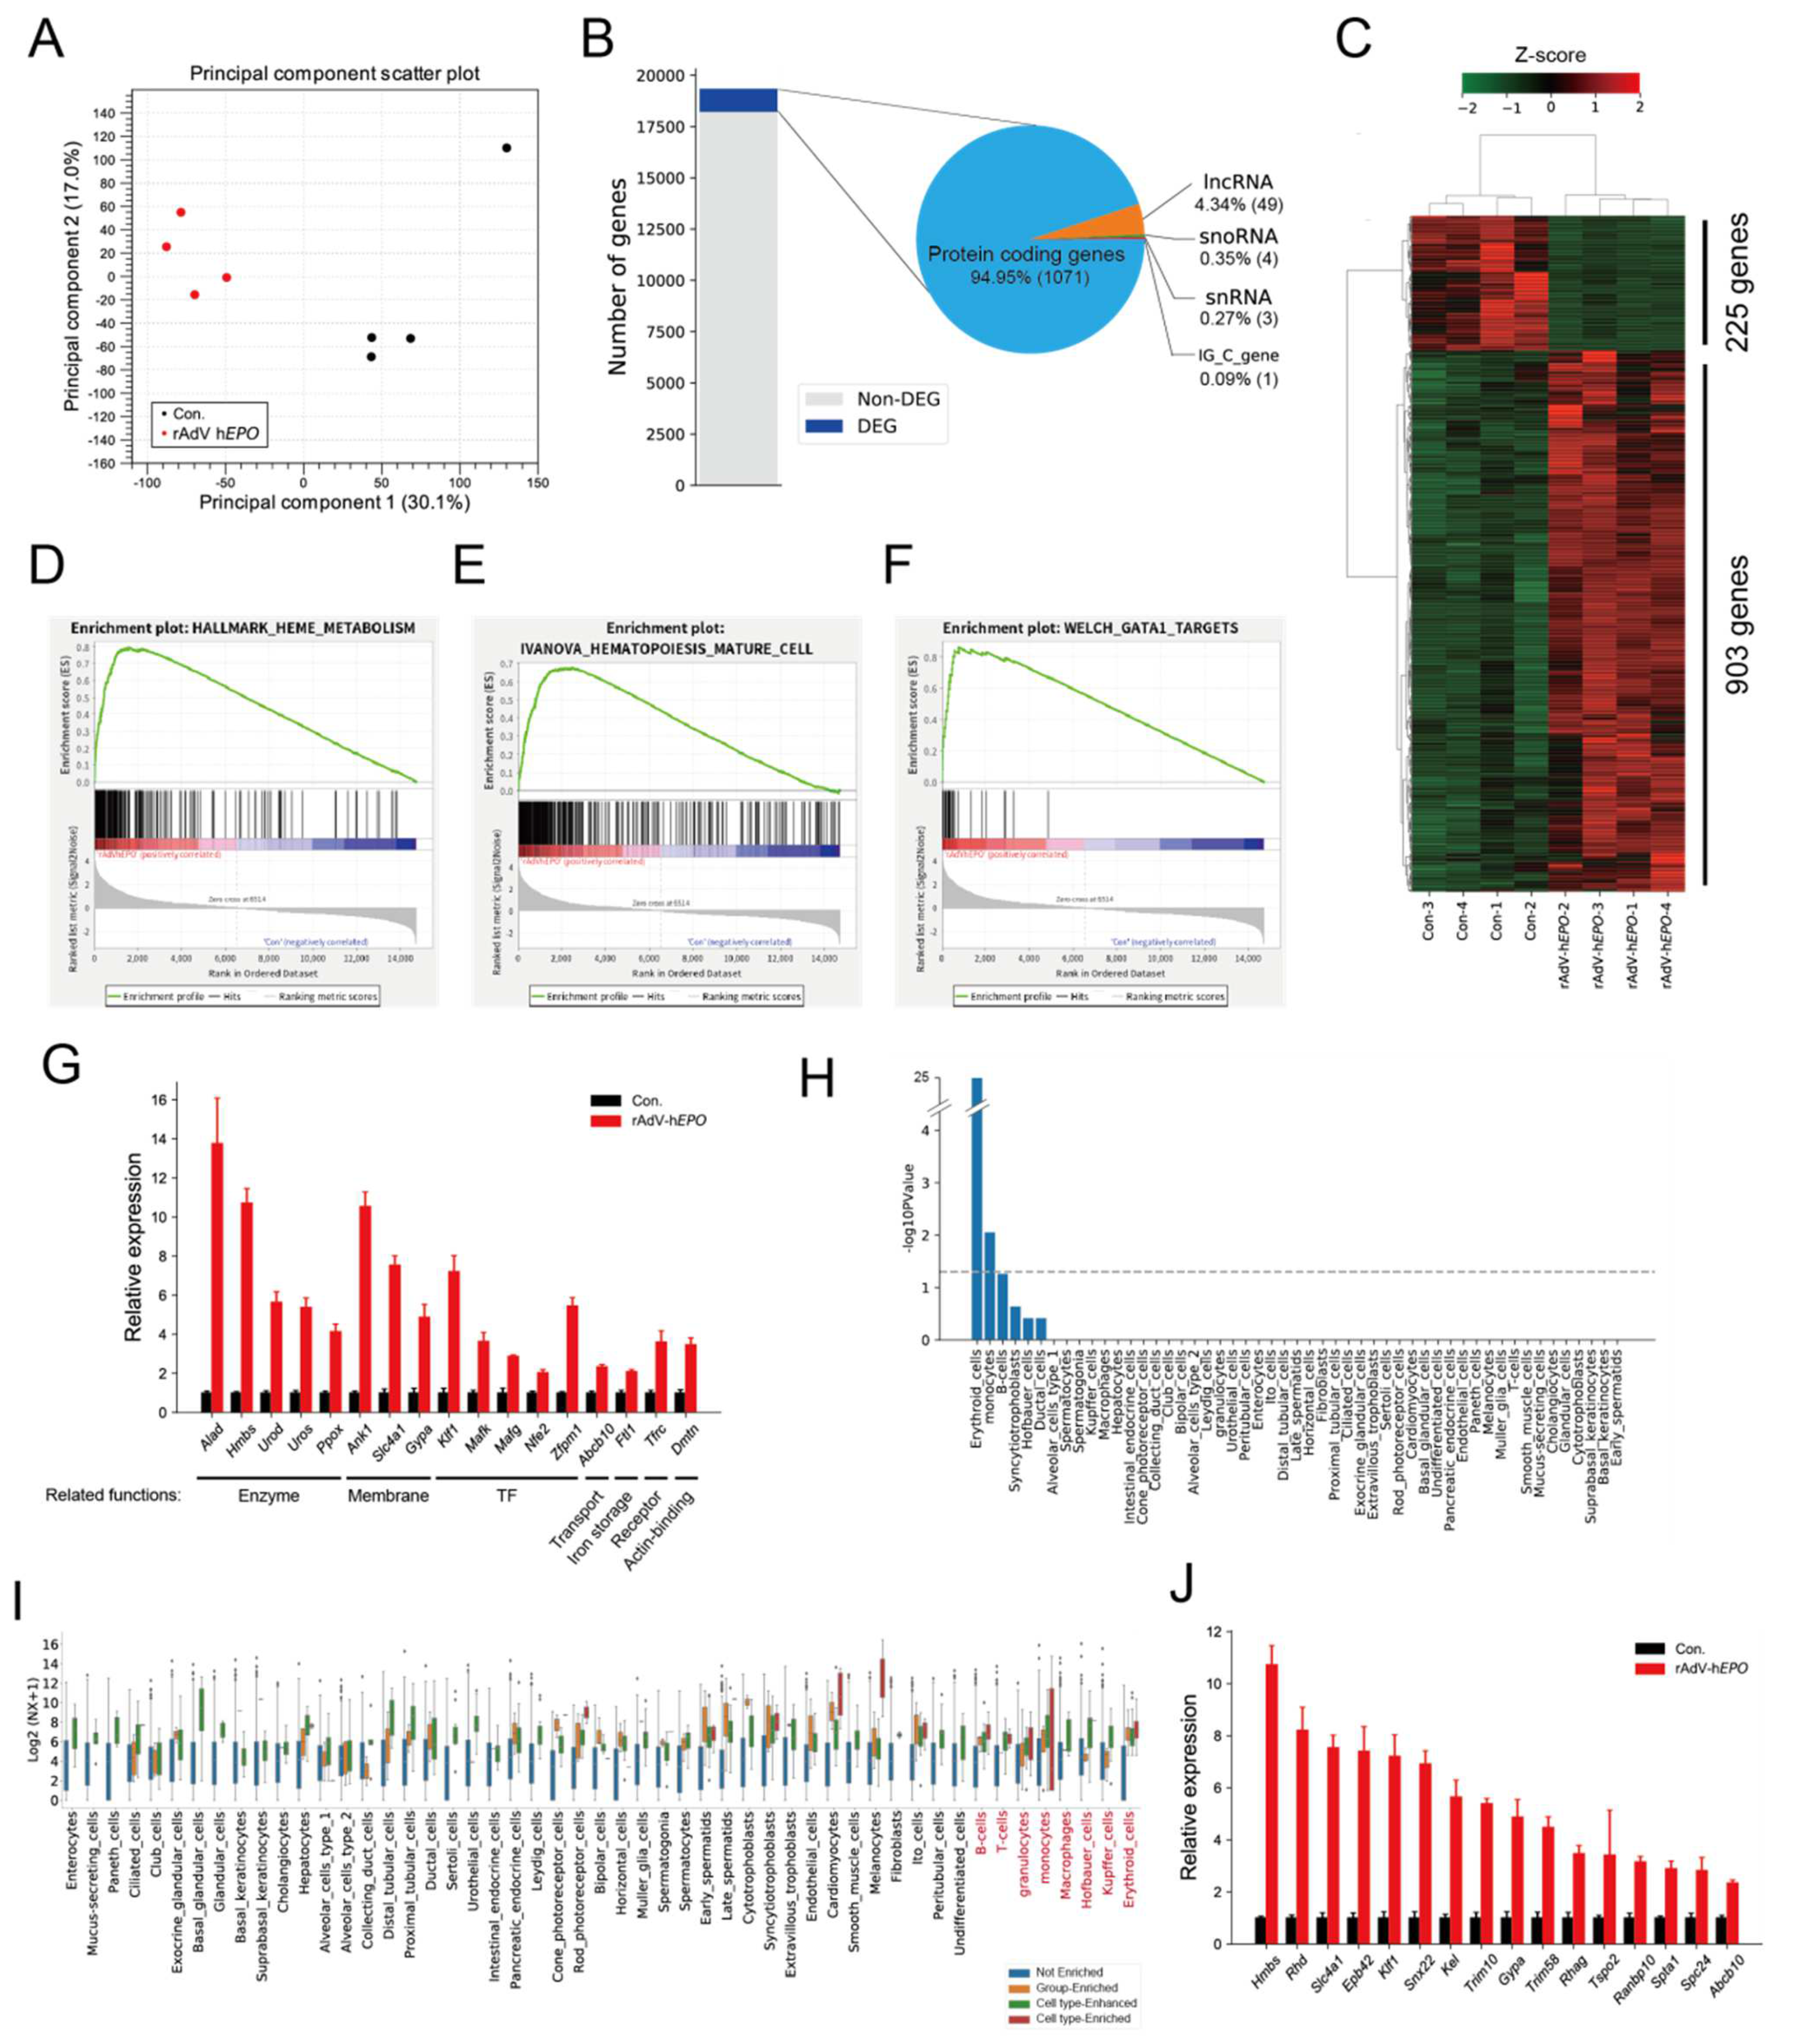
20]. However, it is unclear whether RNA expression patterns in whole blood could be used as parameters for the ABP. Here, we considered that total RNA-seq technology can be applied to identify RNAs as a novel form of indirect proof based on the concept of the ABP because the peripheral blood transcriptome may dynamically reflect the biological mechanisms associated with increased EPO secretion. Our results identified 1128 DEGs in whole blood, and most of them were upregulated in Ad
EPO mice (
Figure 3B,C). The hematopoiesis-related terms such as GATA1 targets were significantly enriched in this profile by GSEA (
Figure 3D–F). These genes, which encoded molecules such as erythrocyte surface proteins and erythroid transcription factors, are involved in erythropoiesis (
Figure 3G) [
43,
44,
45]. For example,
Tfrc encodes the transferrin receptor protein 1 (sTfR), which is used in a diagnostic test for detecting rEPO hormone misuse by athletes [
46]. In addition, we predicted that RBC-specific genes were significantly enriched (
Figure 3H) and that other blood cell-type-specific genes also were contained in DEGs (
Figure 3I). These results suggest that the expression changes, especially those in erythrocyte-specific genes, could reflect the hematopoietic effect of rAdV-h
EPO and may serve as indirect proof based on the concept of the ABP. The enrichment analysis also showed that the erythropoiesis-related terms, such as mitochondria- and metal ion homeostasis-related terms, were significantly enriched in the upregulated genes (
Supplementary Figure S4A,C,E,G). For example, the deletion of Rb caused moderate anemia, induced inhibition of mitochondrial biogenesis, decreased OXPHOS pathway activity and disturbed heme production and iron transport [
47,
48]. Thus, these results suggest that the blood transcriptome could explain and mirror the detailed hemopoietic mechanisms induced by rAdV-h
EPO injection.
We also performed TSEA to predict the tissue status using DEGs because the blood transcriptome and protein expression patterns can partly predict tissue status [
49,
50,
51]. TSEA showed enrichment of hematopoiesis-associated tissues such as E14.5 liver, bone marrow, and spleen (
Supplementary Figure S5A). We noticed that the 42 predicted E14.5 liver- and bone marrow-specific genes overlapped with each other and that these genes were associated with enriched hematopoiesis-related terms, such as porphyrin-containing compound biosynthetic process and erythrocyte development (
Supplementary Figure S5B–D). In particular,
Gata1, known as the transcription factor for erythrocyte differentiation, was upregulated in blood, consistent with the findings for tissues (
Supplementary Figure S5E,F). These results suggested that the whole-blood RNA profile may dynamically reflect the hematopoietic status in tissues injected with rAdV-h
EPO.
Considering the results obtained to date, we believe that tracking significant changes in the overall profile of whole-blood RNA expression can serve as an ABP-based measurement approach since this idea is consistent with the concept of the ABP. Therefore, we recommend that total RNA-seq be employed in the generation of ABPs for gene doping in the future. However, to achieve this idea, it is essential to unify and establish a standardized workflow that includes RNA extraction, library preparation, NGS runs, and bioinformatics analyses, thereby yielding a robust protocol with a low scope for artificial contamination during experimental operations.
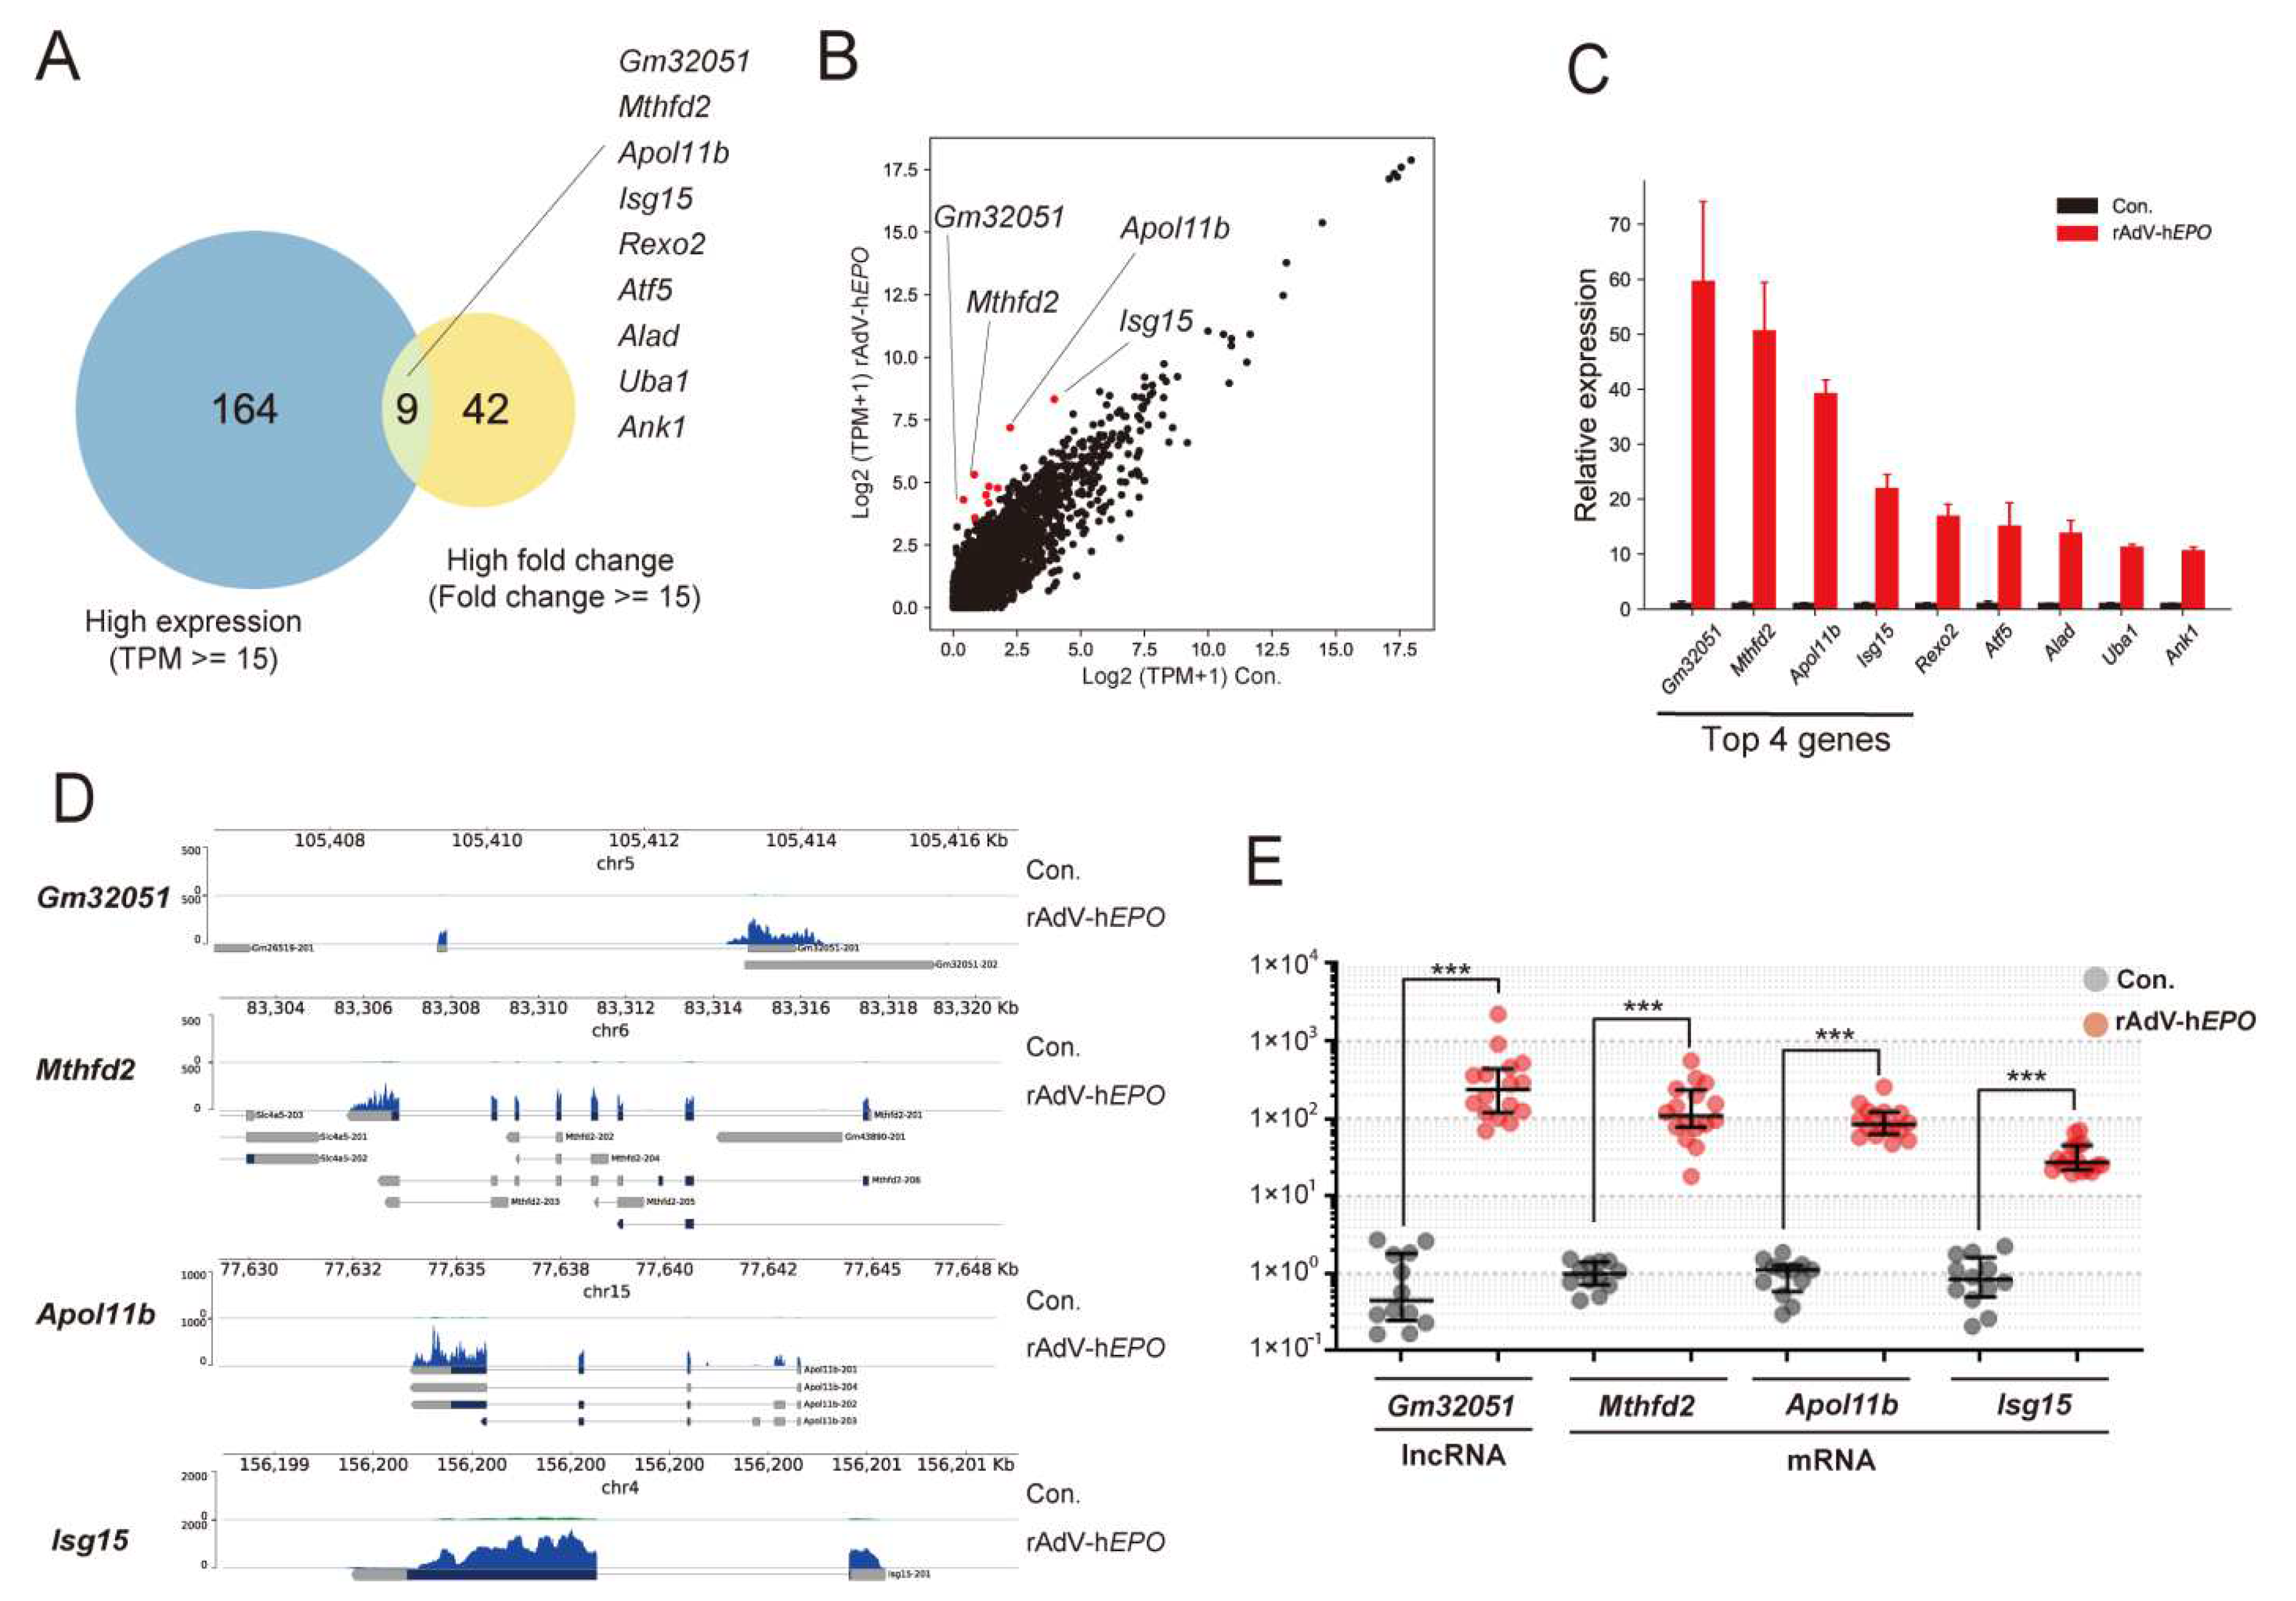
Next, to identify single RNA as novel indirect proof based on the concept of the ABP, in the gene-doping model, we screened potential single RNAs that showed high fold changes and high expression levels in the profile because the ideal genes should be measurable with high-sensitivity qPCR. Interestingly, to our knowledge, the screened genes are not known to be directly associated with EPO function. In particular, we identified several RNAs whose expression drastically increased by 80- to 100-fold or more upon injection of rAdV-h
EPO. The identified RNAs were both mRNAs and lncRNAs for genes such as
Apol11b,
Mthfd2,
Gm32051, and
Isg15 (
Figure 4).
Apol11b (
A330102K04Rik) is reported to share homology with the apolipoprotein L family of proteins in humans, indicating its involvement in alterations in the lipid composition of erythrocyte membranes during terminal differentiation [
52].
Mthfd2 is known to encode an enzyme involved in mitochondrial folate one-carbon metabolism, which is also recognized as an NAD-dependent mitochondrial methylenetetrahydrofolate dehydrogenase-cyclohydrolase (NMDMC).
Mthfd2 is reported to play a role in embryonic development and pluripotent stem cells in mice [
53,
54] and is associated with a poor prognosis in hematological and solid cancers [
55].
Isg15 is involved in modulating the development of erythroid differentiation [
56]. To our knowledge, the function of
Gm32051 remains unknown. Interestingly, the dramatically increased expression of these genes with unknown functions related to EPO may represent new parameters for the ABP.
A previous study reported the findings obtained after administration of recombinant hEPO (rhEPO) to humans and transcriptome analysis using whole-blood RNA [
57]. The RNAs of ABP parameter candidates found in that study [
57] were also investigated in detail in other studies and could be recognized as robust biomarker RNA candidates for detecting rhEPO-administered doping [
58,
59]. In this study, since the amount of circulating EPO hormone increased in our mouse model, we assumed that the RNAs in whole-blood samples from the model were showing the same fluctuations as those reported in the studies described above. The total RNA-seq results were largely consistent with the expression patterns described in previous reports [
57,
58,
59] (
Supplementary Figure S6). In particular, five genes (
Bcl2l1,
Epb42,
Slc4a1,
Tmod1, and
Trim58) that were analyzed as ABP candidate parameters in the previous study by Wang et al. [
58] showed a clear increase of about 2–4 times the average value, which was statistically significant (
Supplementary Figure S6). These results suggest that our mouse model partially mimics the physiologic mechanism of rhEPO doping in humans and that the model may be useful for the development of several gene-doping methods. In addition, as mentioned earlier, we found four dramatically upregulated genes (
Apol11b,
Mthfd2,
Gm32051, and
Isg15) in this model. Since these genes have not been listed in the previous studies [
57], they may be genes that specifically increase when AdV-h
EPO is injected. Because these genes show a drastic increase, they can be considered as better parameters for the ABP; however, these findings should be validated in human studies using AdV-h
EPO.
We also conducted long-term measurements of the RNAs identified as indirect proof, and the results showed that the expression levels of these RNAs significantly fluctuated for 15 to 30 days after injection of rAdV-hEPO. Therefore, these RNAs may be sensitive to the injection of the rAdV-hEPO vector and could be used as novel parameters for the ABP. However, it is unclear whether the same results would be obtained in humans. Therefore, future studies should aim to conduct similar experiments on human participants. In addition, since it is also unclear why these RNAs sensitively responded to the rAdV-hEPO injection, an additional line of research should aim to elucidate the molecular-level biological mechanisms in tissues and blood after injection of rAdV-hEPO.
Currently, automation of inspections is being actively pursued in the medical field. Automation reduces human error, making testing more accurate. On the other hand, in this study, even though the control and Ad
EPO mice were completely separated during the experimental process, fragments of the hexon region were detected in the blood of the control mice. This form of artificial cross-contamination can influence the results and must be avoided when conducting tests for humans. To avoid the abovementioned cross-contamination, we tried to apply an automation system such as Maholo, which uses an experimental robot similar to LabDroids [
60] for gene-doping testing. An automation system can perform its programmed contents with high precision in a clean environment free from artificial contamination. Therefore, an automatic system is expected to be effective in preventing deception on the part of the inspector, yielding a more rigorous inspection system.
This study had some limitations. First, our results identified vector fragments and multiple potential RNA markers as proof of gene doping in the mice model. However, these findings can only be adapted within the mice model. In particular, it is unknown whether the four genes discovered in the RNA-seq under the ABP concept show similar changes in human athletes. The hematopoiesis-related functions of these four genes in humans and mice are also unknown. If these four RNA markers are to be applied to gene-doping tests on human athletes, these tests should be able to avoid the effects of confounding factors that increase hematopoiesis, such as hypoxia, bleeding, and chemical stimulation. Nevertheless, our findings have the potential to expand the research on gene-doping tests. In particular, the animal model developed in this study may be useful to develop several gene-doping tests. This is because the dynamics of nucleic acids can be reflected by the metabolic actions of the living body. In addition, the primer-probe sets and PCR conditions developed in this study would be directly applicable to human testing for gene doping. If research proceeds using this model and humans in the future, quantifying the DNA fragments and RNA expressions that provide proof for gene doping could help identify the date and time on which gene doping was performed by athletes. Thus, despite the multiple limitations associated with the application of the findings of this study to the testing of athletes, the results may be of great significance for the further development of gene-doping tests. Second, evaluation of the hematological parameters influenced by rAdV-hEPO until day 30 was not performed. According to our results, because the viral DNA fragments and potential RNA markers serving as proof of gene doping were detected even on day 30 in some mice, it is possible that hematopoiesis was also upregulated over 30 days in the mice. If the characteristics of the long-term hematopoietic effects in the model mice are revealed, the results would facilitate the development of gene-doping tests.


 ,
, 