
Genome-Wide Association Study Identifies 12 Loci Associated with Body Weight at Age 8 Weeks in Korean Native Chickens

 , ,
, ,
Abstract
:1. Introduction
2. Materials and Methods
2.1. Animals and Phenotypes
2.2. Genotyping and Quality Control
2.3. Principal Component Analysis (PCA)
2.4. Genome-Wide Association Analysis, Heritability, and Variance Component Estimation
2.5. SNP Annotation and Gene Set Enrichment Analysis
3. Results
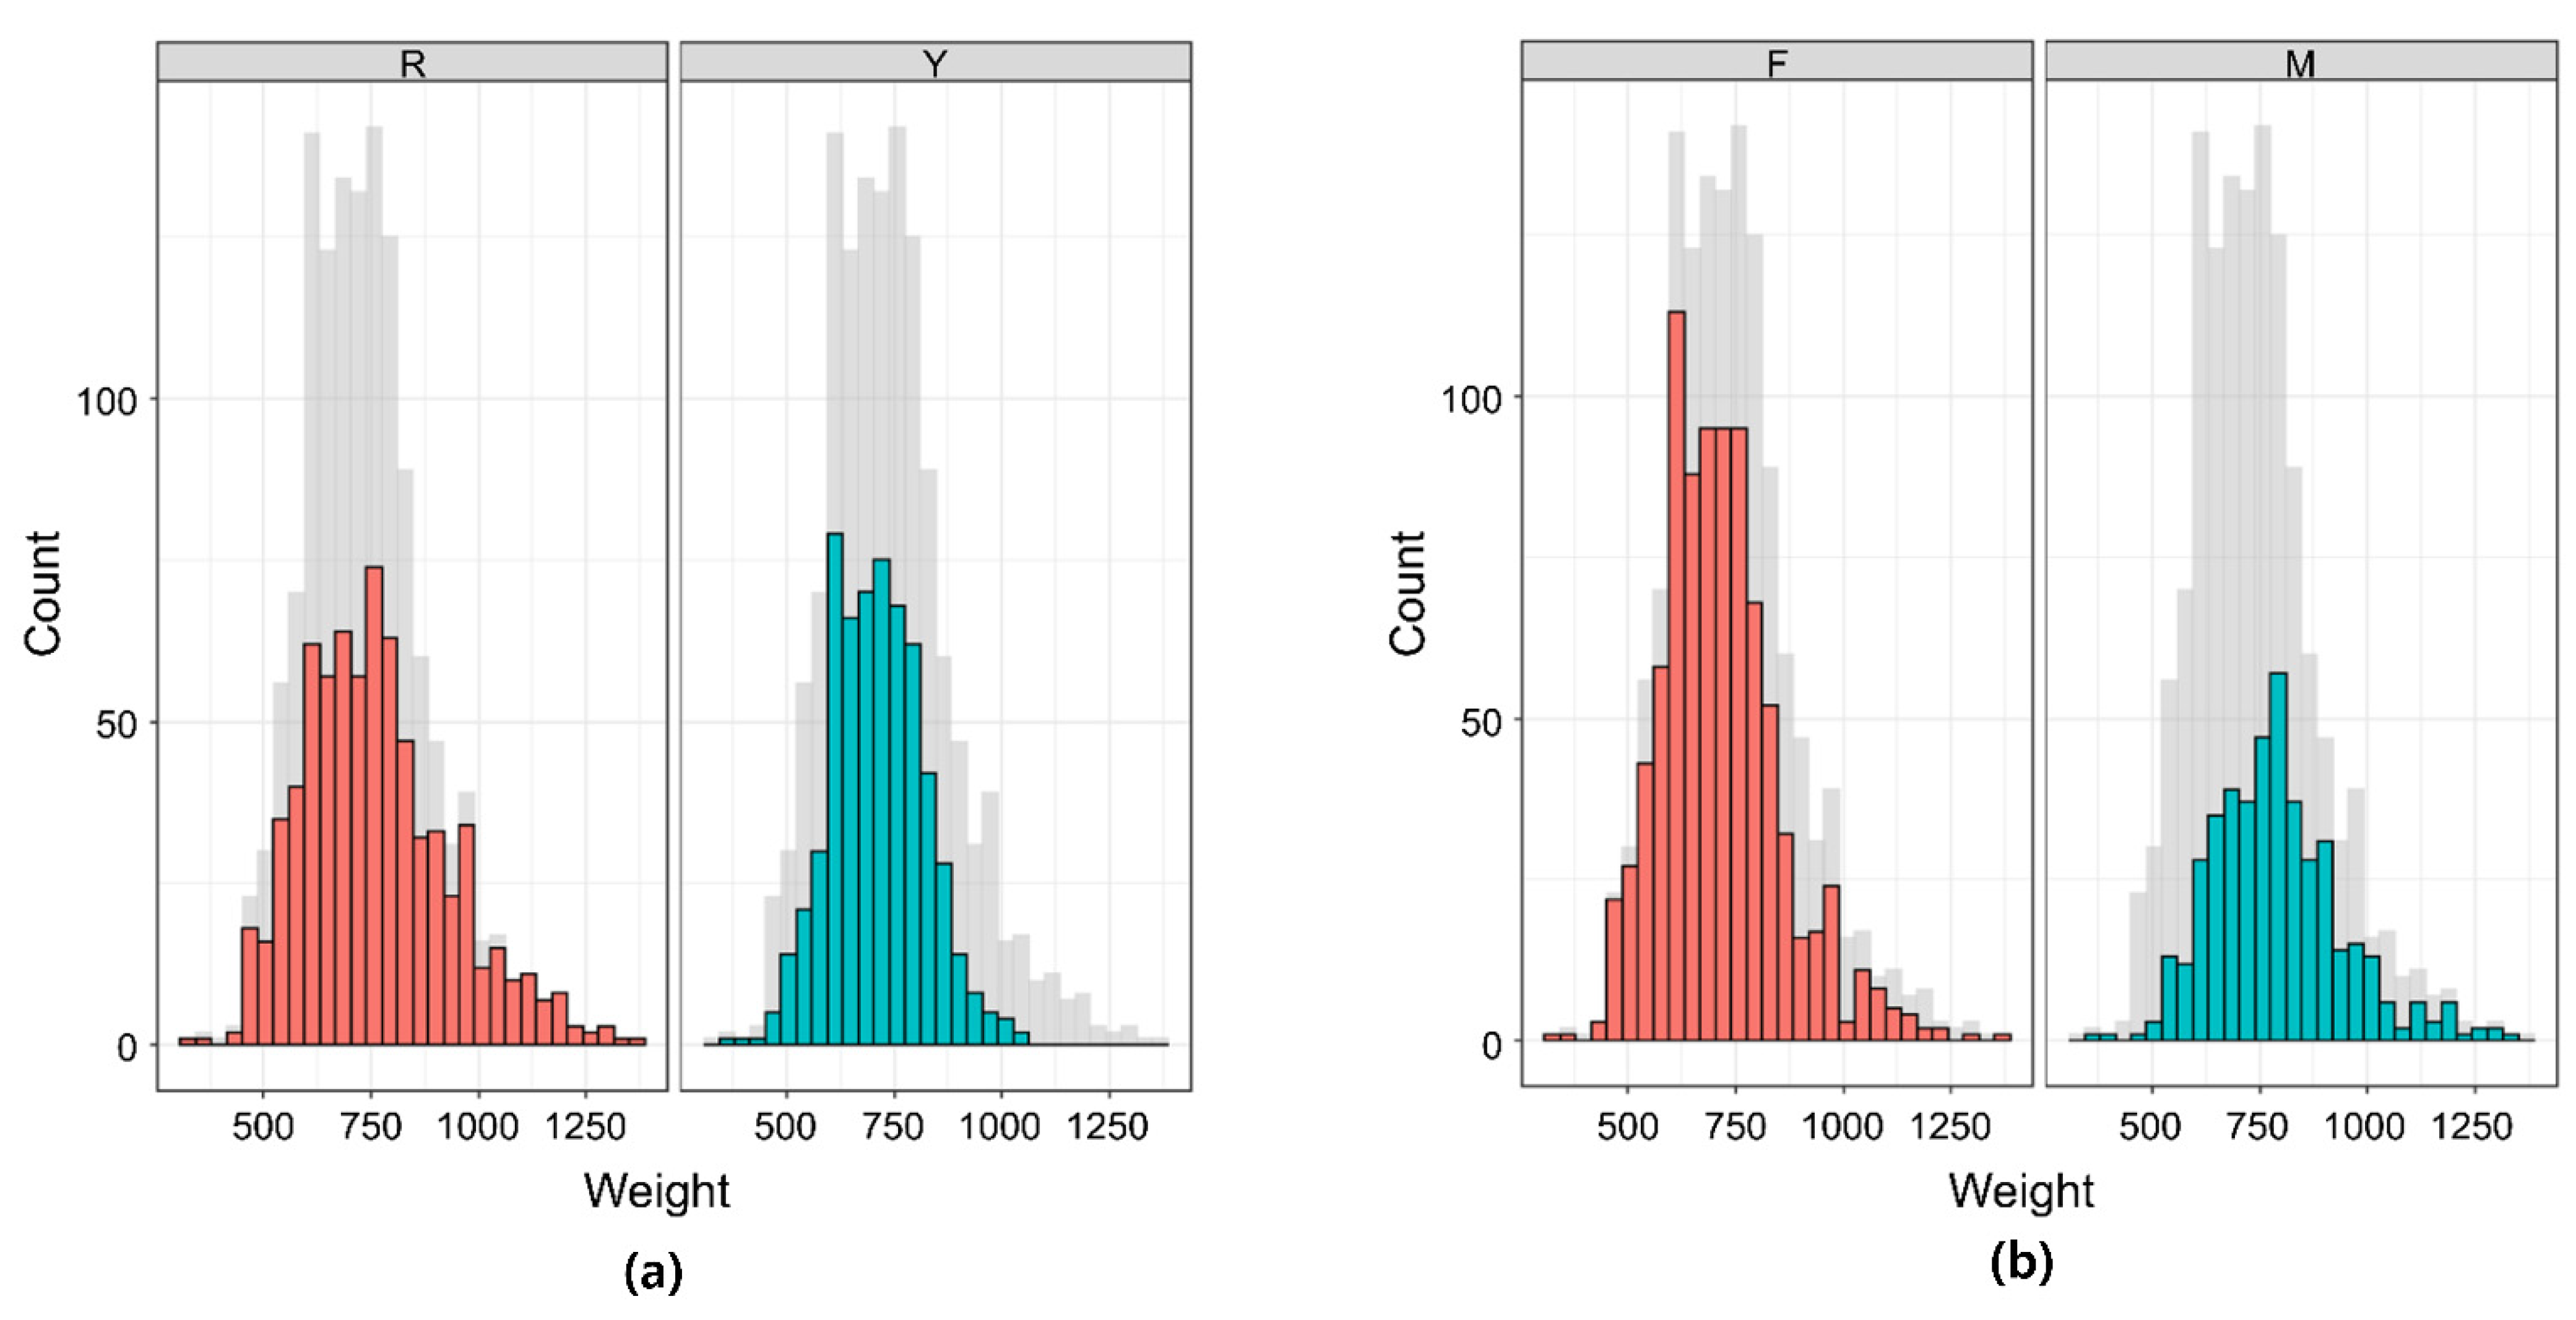
3.1. Descriptive Statistics of Phenotype and Heritability
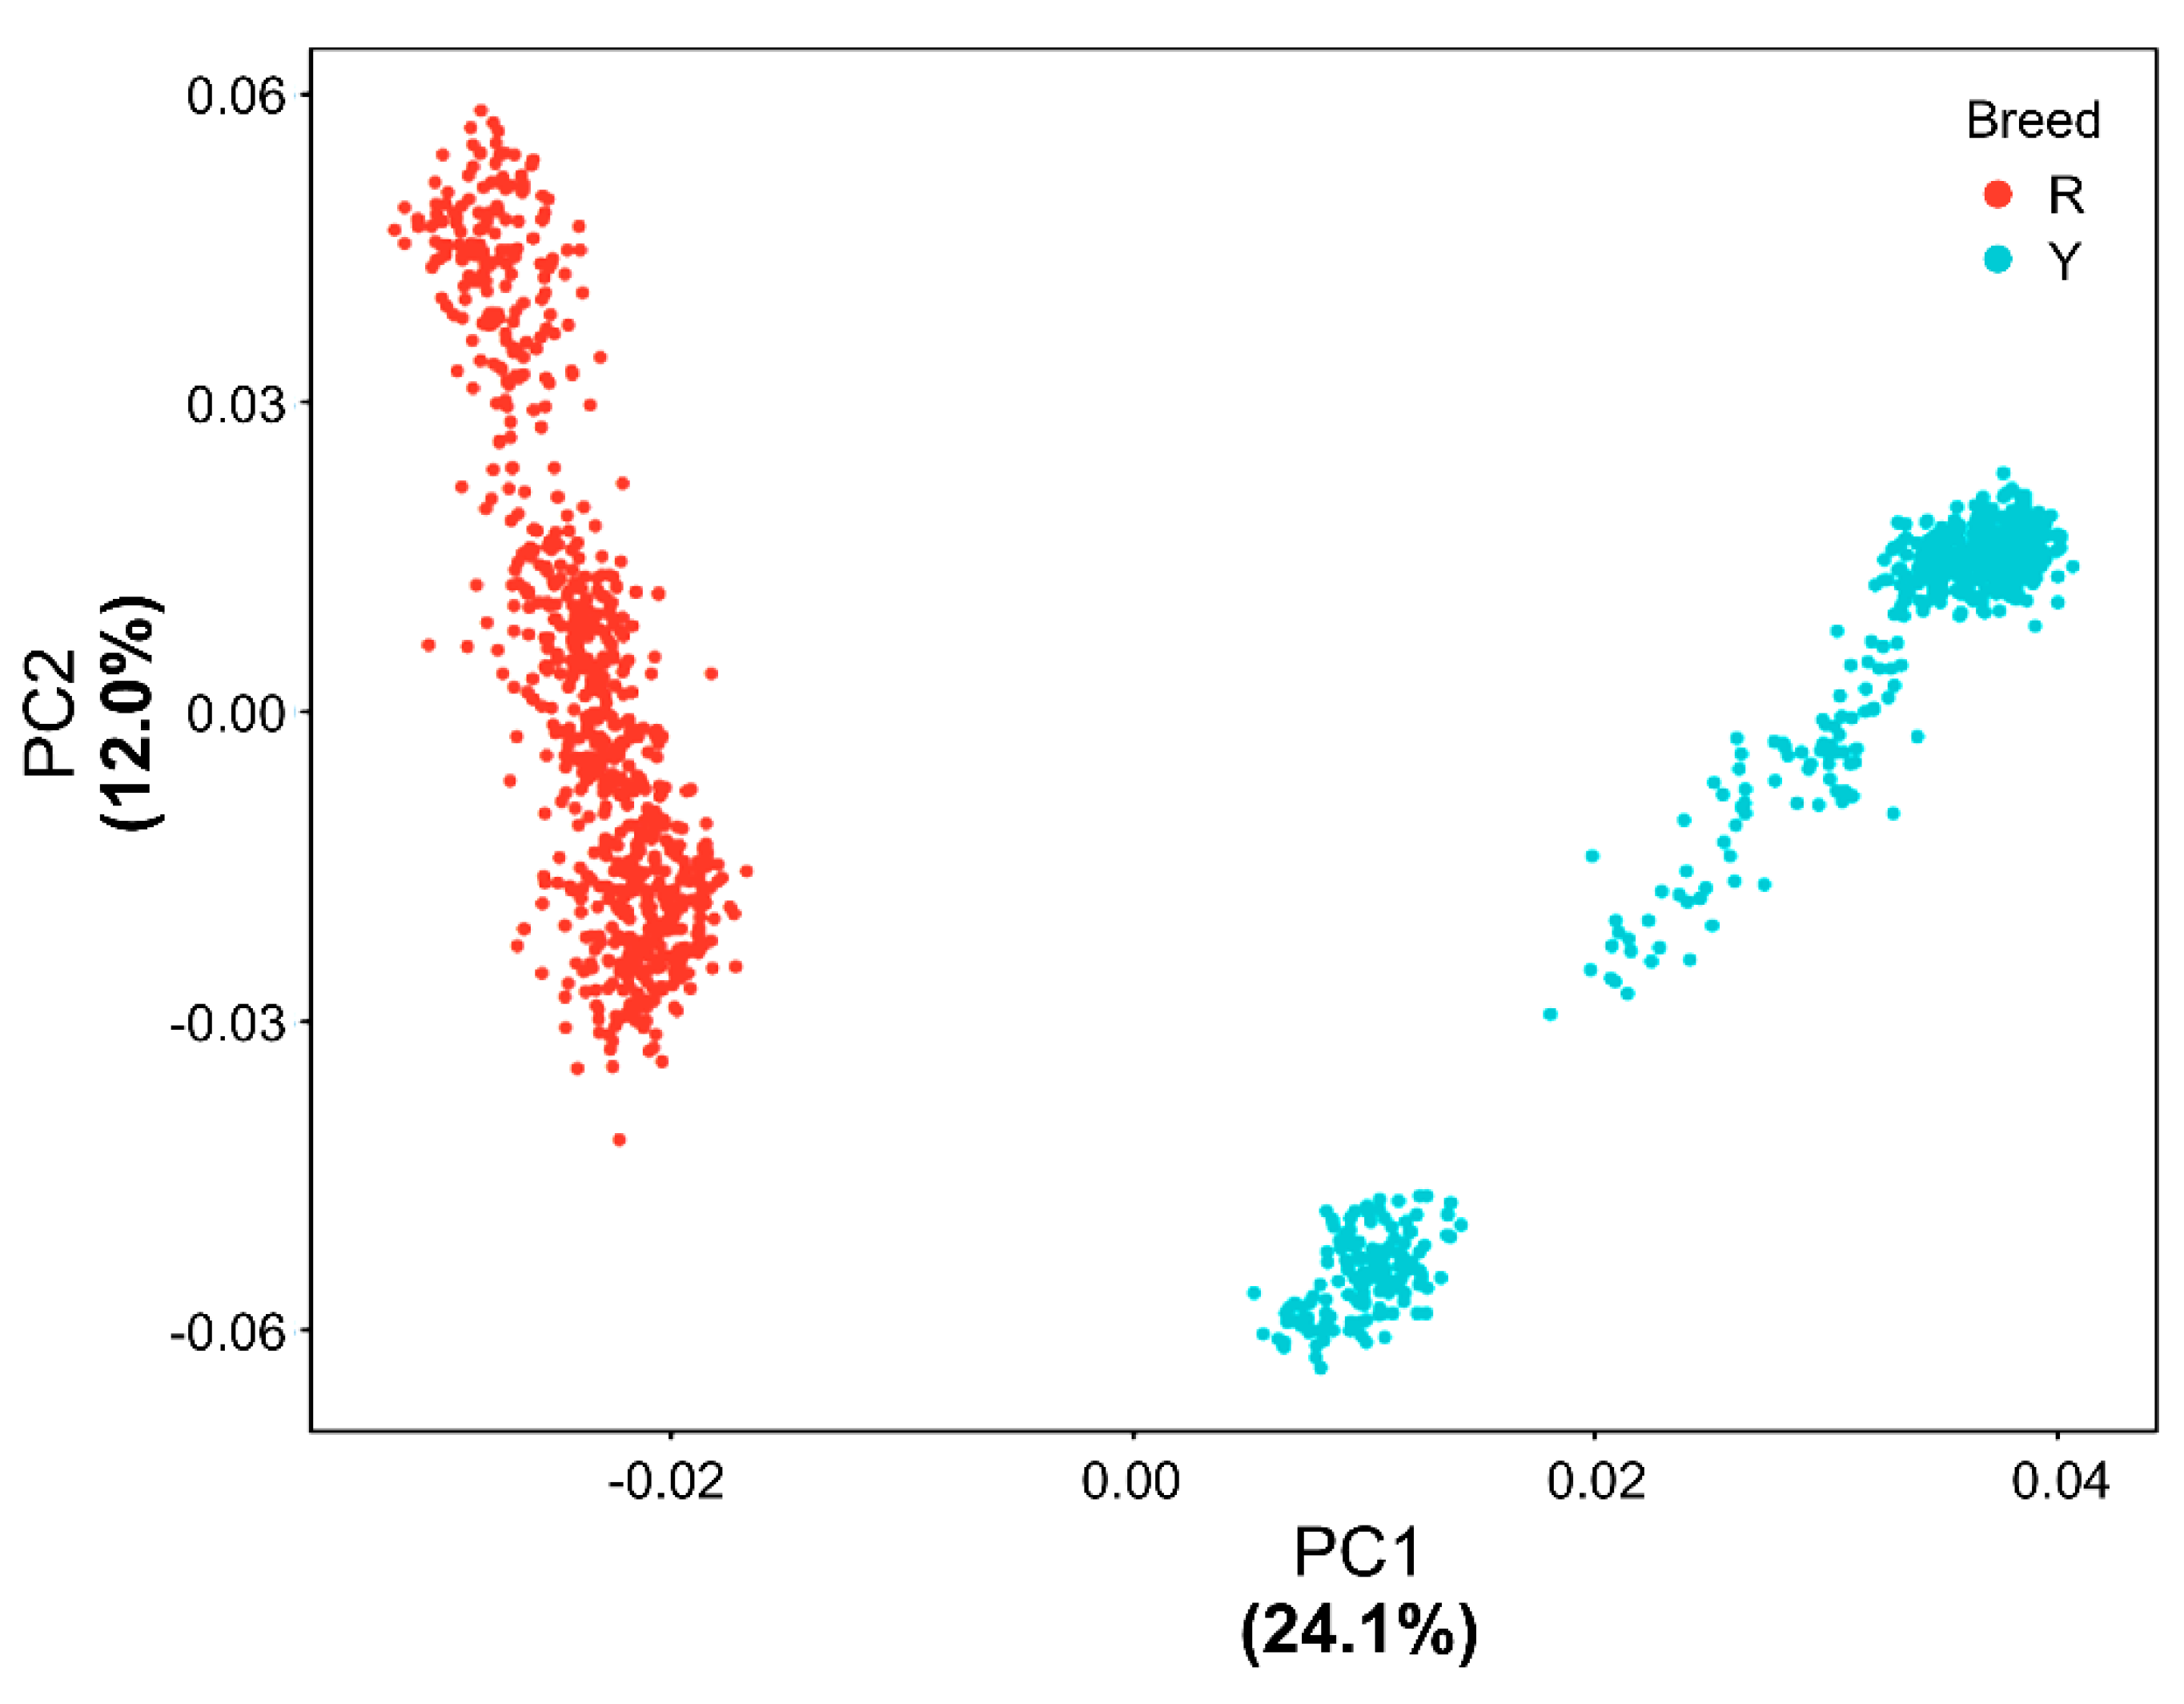
3.2. PCA
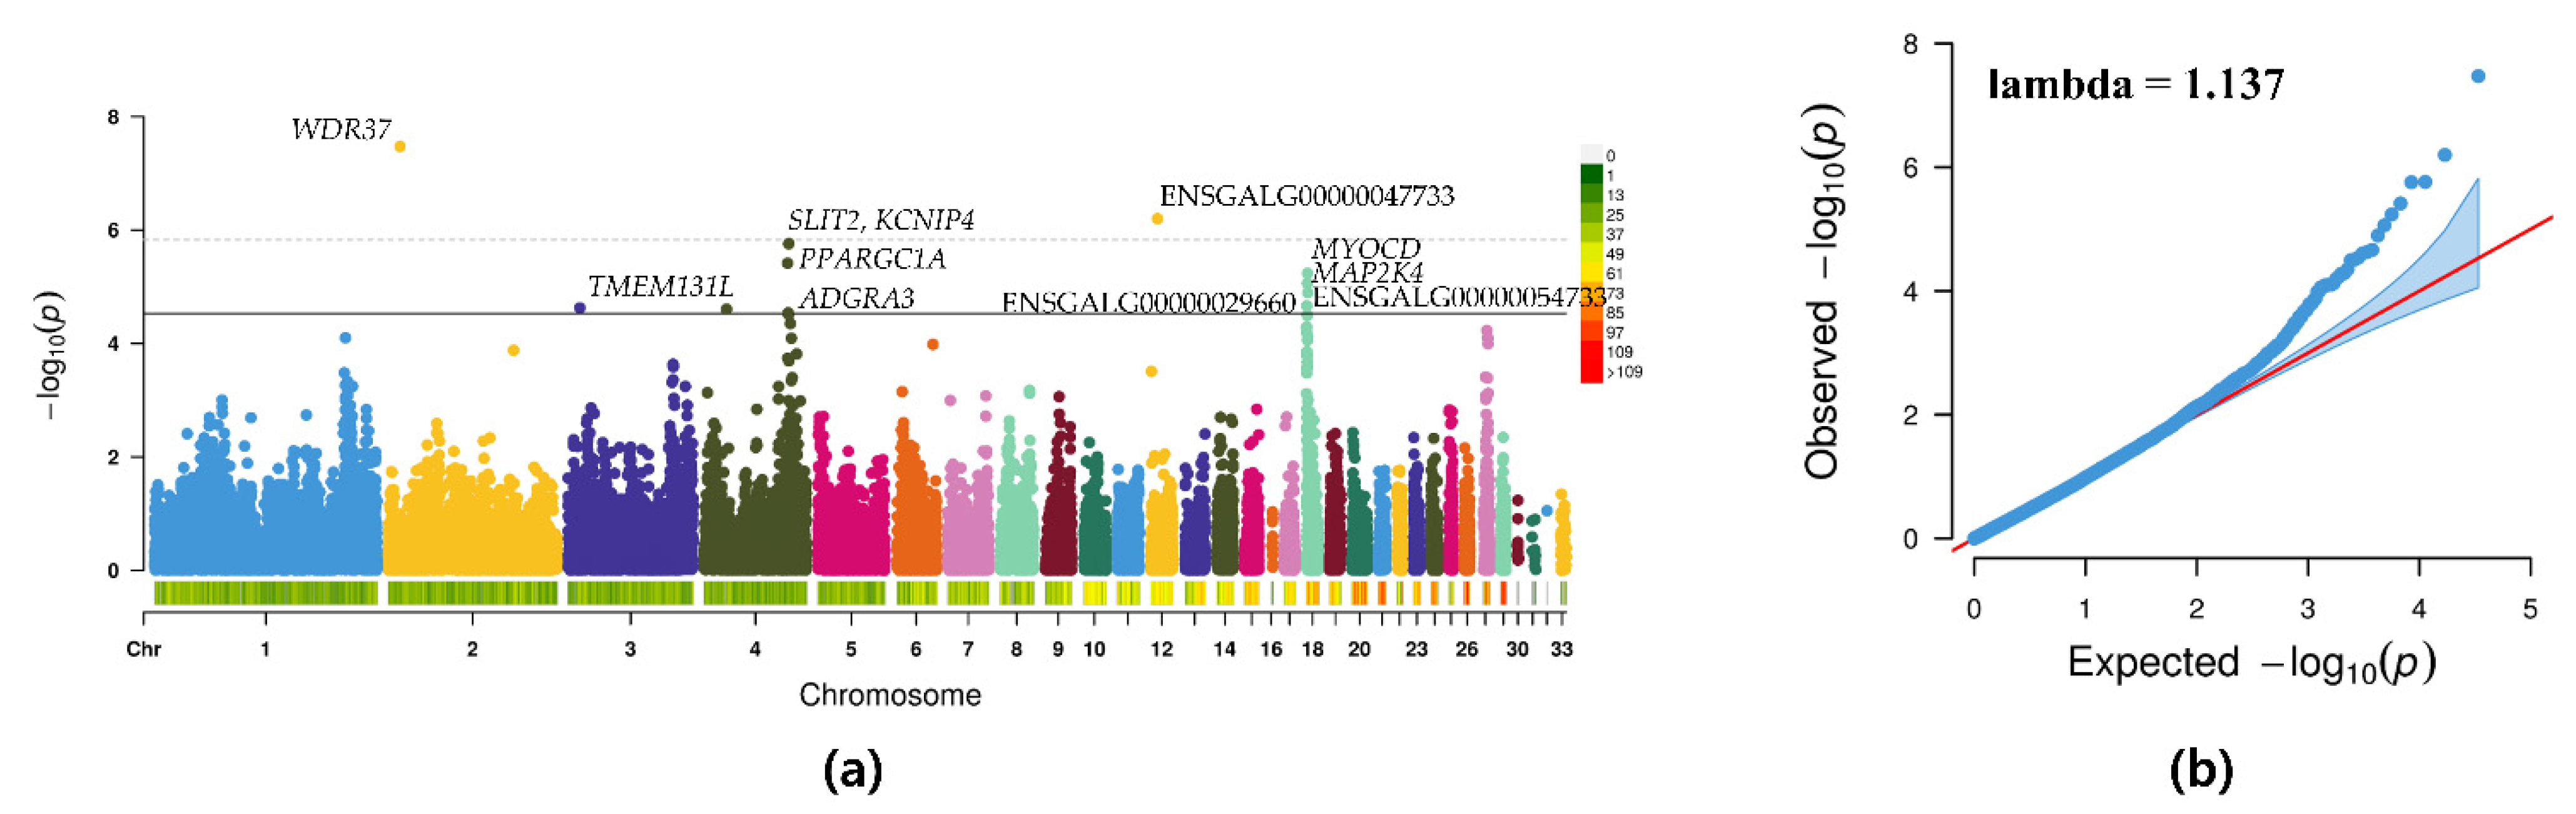
3.3. GWAS
3.4. Gene Set Enrichment Analysis
4. Discussion
5. Conclusions
Supplementary Materials
Author Contributions
Funding
Institutional Review Board Statement
Data Availability Statement
Conflicts of Interest
References
- Lonergan, S.M.; Topel, D.G.; Marple, D.N. The Science of Animal Growth and Meat Technology; Academic Press: Cambridge, MA, USA, 2018. [Google Scholar]
- Zhang, Y.; Wang, Y.; Li, Y.; Wu, J.; Wang, X.; Bian, C.; Tian, Y.; Sun, G.; Han, R.; Liu, X. Genome-wide association study reveals the genetic determinism of growth traits in a Gushi-Anka F 2 chicken population. Heredity 2021, 126, 293–307. [Google Scholar] [CrossRef]
- Jin, S.; Park, H.; Seo, D. Association of MCR1 genotype with shank color traits in Korean native chicken. Livest. Sci. 2014, 170, 1–7. [Google Scholar] [CrossRef]
- Jeon, H.-J.; Choe, J.-H.; Jung, Y.-K.; Kruk, Z.A.; Lim, D.-G.; Jo, C.-R. Comparison of the chemical composition, textural characteristics, and sensory properties of North and South Korean native chickens and commercial broilers. Food Sci. Anim. Resour. 2010, 30, 171–178. [Google Scholar] [CrossRef] [Green Version]
- Cahyadi, M.; Park, H.-B.; Seo, D.-W.; Jin, S.; Choi, N.; Heo, K.-N.; Kang, B.-S.; Jo, C.; Lee, J.-H. Genetic parameters for growth-related traits in Korean native chicken. Korean J. Poult. Sci. 2015, 42, 285–289. [Google Scholar] [CrossRef] [Green Version]
- Zhang, H.; Wang, Z.; Wang, S.; Li, H. Progress of genome wide association study in domestic animals. J. Anim. Sci. Biotechnol. 2012, 3, 26. [Google Scholar] [CrossRef] [Green Version]
- Xie, L.; Luo, C.; Zhang, C.; Zhang, R.; Tang, J.; Nie, Q.; Ma, L.; Hu, X.; Li, N.; Da, Y. Genome-wide association study identified a narrow chromosome 1 region associated with chicken growth traits. PLoS ONE 2012, 7, e30910. [Google Scholar] [CrossRef] [PubMed] [Green Version]
- Liu, R.; Sun, Y.; Zhao, G.; Wang, F.; Wu, D.; Zheng, M.; Chen, J.; Zhang, L.; Hu, Y.; Wen, J. Genome-wide association study identifies loci and candidate genes for body composition and meat quality traits in Beijing-You chickens. PLoS ONE 2013, 8, e61172. [Google Scholar] [CrossRef] [PubMed]
- Sheng, Z.; Pettersson, M.E.; Hu, X.; Luo, C.; Qu, H.; Shu, D.; Shen, X.; Carlborg, Ö.; Li, N. Genetic dissection of growth traits in a Chinese indigenous× commercial broiler chicken cross. BMC Genom. 2013, 14, 151. [Google Scholar] [CrossRef] [Green Version]
- Wang, W.; Zhang, T.; Wang, J.; Zhang, G.; Wang, Y.; Zhang, Y.; Zhang, J.; Li, G.; Xue, Q.; Han, K. Genome-wide association study of 8 carcass traits in Jinghai Yellow chickens using specific-locus amplified fragment sequencing technology. Poult. Sci. 2016, 95, 500–506. [Google Scholar] [CrossRef]
- Seo, D.; Park, H.; Jung, S.; Cahyadi, M.; Choi, N.; Jin, S.; Heo, K.; Jo, C.; Lee, J. QTL analyses of general compound, color, and pH traits in breast and thigh muscles in Korean native chicken. Livest. Sci. 2015, 182, 145–150. [Google Scholar] [CrossRef]
- Cahyadi, M.; Park, H.-B.; Seo, D.-W.; Jin, S.; Choi, N.; Heo, K.-N.; Kang, B.-S.; Jo, C.; Lee, J.-H. Variance component quantitative trait locus analysis for body weight traits in purebred Korean native chicken. Asian Australas. J. Anim. Sci. 2016, 29, 43. [Google Scholar] [CrossRef] [Green Version]
- Kim, K.G.; Choi, E.S.; Kwon, J.H.; Sohn, S.H. The effect of early chick weight on market-weight in Korean native chickens. Korean J. Poult. Sci. 2017, 44, 259–265. [Google Scholar] [CrossRef] [Green Version]
- Purcell, S.; Neale, B.; Todd-Brown, K.; Thomas, L.; Ferreira, M.A.; Bender, D.; Maller, J.; Sklar, P.; De Bakker, P.I.; Daly, M.J. PLINK: A tool set for whole-genome association and population-based linkage analyses. Am. J. Hum. Genet. 2007, 81, 559–575. [Google Scholar] [CrossRef] [PubMed] [Green Version]
- Yang, J.; Lee, S.H.; Goddard, M.E.; Visscher, P.M. GCTA: A tool for genome-wide complex trait analysis. Am. J. Hum. Genet. 2011, 88, 76–82. [Google Scholar] [CrossRef] [Green Version]
- Yin, L. CMplot: Circle Manhattan Plot. 2018. Available online: https://cran.r-project.org/web/packages/CMplot/index.html (accessed on 13 April 2020).
- Cingolani, P.; Platts, A.; Wang, L.L.; Coon, M.; Nguyen, T.; Wang, L.; Land, S.J.; Lu, X.; Ruden, D.M. A program for annotating and predicting the effects of single nucleotide polymorphisms, SnpEff: SNPs in the genome of Drosophila melanogaster strain w1118; iso-2; iso-3. Fly 2012, 6, 80–92. [Google Scholar] [CrossRef] [Green Version]
- Dadousis, C.; Pegolo, S.; Rosa, G.J.; Bittante, G.; Cecchinato, A. Genome-wide association and pathway-based analysis using latent variables related to milk protein composition and cheesemaking traits in dairy cattle. J. Dairy Sci. 2017, 100, 9085–9102. [Google Scholar] [CrossRef] [PubMed]
- Wang, J.; Zhu, B.; Wen, J.; Li, Q.; Zhao, G. Genome-Wide Association Study and Pathway Analysis for Heterophil/Lymphocyte (H/L) Ratio in Chicken. Genes 2020, 11, 1005. [Google Scholar] [CrossRef]
- Sheet, S.; Krishnamoorthy, S.; Park, W.; Lim, D.; Park, J.-E.; Ko, M.; Choi, B.-H. Mechanistic insight into the progressive retinal atrophy disease in dogs via pathway-based genome-wide association analysis. J. Anim. Sci. Technol. 2020, 62, 765. [Google Scholar] [CrossRef]
- Lu, Z.; Yue, Y.; Yuan, C.; Liu, J.; Chen, Z.; Niu, C.; Sun, X.; Zhu, S.; Zhao, H.; Guo, T. Genome-wide association study of body weight traits in chinese fine-wool sheep. Animals 2020, 10, 170. [Google Scholar] [CrossRef] [Green Version]
- Dadousis, C.; Pegolo, S.; Rosa, G.; Gianola, D.; Bittante, G.; Cecchinato, A. Pathway-based genome-wide association analysis of milk coagulation properties, curd firmness, cheese yield, and curd nutrient recovery in dairy cattle. J. Dairy Sci. 2017, 100, 1223–1231. [Google Scholar] [CrossRef]
- Sheet, S.; Krishnamoorthy, S.; Cha, J.; Choi, S.; Choi, B.-H. Identification of Candidate Genes and Pathways Associated with Obesity-Related Traits in Canines via Gene-Set Enrichment and Pathway-Based GWAS Analysis. Animals 2020, 10, 2071. [Google Scholar] [CrossRef]
- Srikanth, K.; Lee, S.-H.; Chung, K.-Y.; Park, J.-E.; Jang, G.-W.; Park, M.-R.; Kim, N.Y.; Kim, T.-H.; Chai, H.-H.; Park, W.C. A gene-set enrichment and protein–protein interaction network-based GWAS with regulatory SNPs identifies candidate genes and pathways associated with carcass traits in hanwoo cattle. Genes 2020, 11, 316. [Google Scholar] [CrossRef] [Green Version]
- Huang, D.W.; Sherman, B.T.; Lempicki, R.A. Bioinformatics enrichment tools: Paths toward the comprehensive functional analysis of large gene lists. Nucleic Acids Res. 2009, 37, 1–13. [Google Scholar] [CrossRef] [Green Version]
- Sherman, B.T.; Lempicki, R.A. Systematic and integrative analysis of large gene lists using DAVID bioinformatics resources. Nat. Protoc. 2009, 4, 44. [Google Scholar]
- Hosack, D.A.; Dennis, G.; Sherman, B.T.; Lane, H.C.; Lempicki, R.A. Identifying biological themes within lists of genes with EASE. Genome Biol. 2003, 4, 1–8. [Google Scholar] [CrossRef] [PubMed]
- Gu, X.; Feng, C.; Ma, L.; Song, C.; Wang, Y.; Da, Y.; Li, H.; Chen, K.; Ye, S.; Ge, C. Genome-wide association study of body weight in chicken F2 resource population. PLoS ONE 2011, 6, e21872. [Google Scholar] [CrossRef] [PubMed] [Green Version]
- Ekka, R.; Behura, N.; Samal, L.; Nayak, G.; Pati, P.; Mishra, P. Growth performance and linear body measurements of Hansli, CSML and Hansli× CSML cross under intensive system of rearing. J. Livest. Sci. 2016, 7, 114–121. [Google Scholar]
- Emrani, H.; Torshizi, R.V.; Masoudi, A.A.; Ehsani, A. Identification of new loci for body weight traits in F2 chicken population using genome-wide association study. Livest. Sci. 2017, 206, 125–131. [Google Scholar] [CrossRef]
- Wattanachant, S.; Benjakul, S.; Ledward, D.A. Composition, color, and texture of Thai indigenous and broiler chicken muscles. Poult. Sci. 2004, 83, 123–128. [Google Scholar] [CrossRef]
- Khatri, B. Genomic Approaches to Identify Important Traits in Avian Species. Ph.D. Thesis, University of Arkansas, Fayetteville, NC, USA, August 2018. [Google Scholar]
- Brandt, M.; Ahsan, M.; Honaker, C.F.; Siegel, P.B.; Carlborg, Ö. Imputation-based fine-mapping suggests that most QTL in an outbred chicken advanced intercross body weight line are due to multiple, linked loci. Genes Genomes Genet. 2017, 7, 119–128. [Google Scholar] [CrossRef] [Green Version]
- Jin, C.; Chen, Y.; Yang, Z.; Shi, K.; Chen, C. A genome-wide association study of growth trait-related single nucleotide polymorphisms in Chinese Yancheng chickens. Genet. Mol. Res. 2015, 14, 15783–15792. [Google Scholar] [CrossRef]
- Li, F.; Han, H.; Lei, Q.; Gao, J.; Liu, J.; Liu, W.; Zhou, Y.; Li, H.; Cao, D. Genome-wide association study of body weight in Wenshang Barred chicken based on the SLAF-seq technology. J. Appl. Genet. 2018, 59, 305–312. [Google Scholar] [CrossRef] [PubMed]
- Holmes, G.; Niswander, L. Expression of slit-2 and slit-3 during chick development. Dev. Dyn. 2001, 222, 301–307. [Google Scholar] [CrossRef] [PubMed]
- Pértille, F.; Zanella, R.; Felício, A.; Ledur, M.; Peixoto, J.d.O.; Coutinho, L.L. Identification of polymorphisms associated with production traits on chicken (Gallus gallus) chromosome 4. Genet. Mol. Res. 2015, 14, 10717–10728. [Google Scholar] [CrossRef]
- Liu, R.; Sun, Y.; Zhao, G.; Wang, H.; Zheng, M.; Li, P.; Liu, L.; Wen, J. Identification of loci and genes for growth related traits from a genome-wide association study in a slow-× fast-growing broiler chicken cross. Genes Genom. 2015, 37, 829–836. [Google Scholar] [CrossRef]
- Chen, P.; Zhao, H.; Wu, M.; He, S.; Yuan, T.; Yi, X.; Liu, S.; Pan, Y.; Li, Q.; Wang, S. A novel 17 bp InDel polymorphism within the PPARGC1A gene is significantly associated with growth traits in sheep. Anim. Biotechnol. 2020, 1–9. [Google Scholar] [CrossRef]
- Larkina, T.; Sazanova, A.; Fomichev, K.; Barkova, O.Y.; Sazanov, A.; Malewski, T.; Jaszczak, K. Expression profiling of candidate genes for abdominal fat mass in domestic chicken Gallus gallus. Genetika 2011, 47, 1012. [Google Scholar] [CrossRef]
- Wu, G.; Deng, X.; Li, J.; Li, N.; Yang, N. A potential molecular marker for selection against abdominal fatness in chickens. Poult. Sci. 2006, 85, 1896–1899. [Google Scholar] [CrossRef]
- Monk, K.R.; Hamann, J.; Langenhan, T.; Nijmeijer, S.; Schöneberg, T.; Liebscher, I. Adhesion G protein–coupled receptors: From in vitro pharmacology to in vivo mechanisms. Mol. Pharmacol. 2015, 88, 617–623. [Google Scholar] [CrossRef] [Green Version]
- Knierim, A.B.; Röthe, J.; Çakir, M.V.; Lede, V.; Wilde, C.; Liebscher, I.; Thor, D.; Schöneberg, T. Genetic basis of functional variability in adhesion G protein-coupled receptors. Sci. Rep. 2019, 9, 1–15. [Google Scholar] [CrossRef]
- Lyu, S.; Arends, D.; Nassar, M.; Brockmann, G. Fine mapping of a distal chromosome 4 QTL affecting growth and muscle mass in a chicken advanced intercross line. Anim. Genet. 2017, 48, 295–302. [Google Scholar] [CrossRef] [PubMed]
- Long, X.; Creemers, E.E.; Wang, D.-Z.; Olson, E.N.; Miano, J.M. Myocardin is a bifunctional switch for smooth versus skeletal muscle differentiation. Proc. Natl. Acad. Sci. USA 2007, 104, 16570–16575. [Google Scholar] [CrossRef] [Green Version]
- Chang, L.; Karin, M. Mammalian MAP kinase signalling cascades. Nature 2001, 410, 37–40. [Google Scholar] [CrossRef]
- Lee, J. Molecular Basis of Feed Efficiency in Meat-Type Chickens; University of Georgia: Athens, GA, USA, 2012. [Google Scholar]
- Bottje, W.; Kong, B.-W.; Song, J.; Lee, J.; Hargis, B.; Lassiter, K.; Wing, T.; Hardiman, J. Gene expression in breast muscle associated with feed efficiency in a single male broiler line using a chicken 44K microarray. II. Differentially expressed focus genes. Poult. Sci. 2012, 91, 2576–2587. [Google Scholar] [CrossRef] [PubMed]
- Butler, J.E.; Kadonaga, J.T. The RNA polymerase II core promoter: A key component in the regulation of gene expression. Genes Dev. 2002, 16, 2583–2592. [Google Scholar] [CrossRef] [Green Version]
- Pampouille, E.; Berri, C.; Boitard, S.; Hennequet-Antier, C.; Beauclercq, S.A.; Godet, E.; Praud, C.; Jégo, Y.; Le Bihan-Duval, E. Mapping QTL for white striping in relation to breast muscle yield and meat quality traits in broiler chickens. BMC Genom. 2018, 19, 1–14. [Google Scholar] [CrossRef]
- Keren, A.; Tamir, Y.; Bengal, E. The p38 MAPK signaling pathway: A major regulator of skeletal muscle development. Mol. Cell. Endocrinol. 2006, 252, 224–230. [Google Scholar] [CrossRef]
- Nebreda, A.R.; Porras, A. p38 MAP kinases: Beyond the stress response. Trends Biochem. Sci. 2000, 25, 257–260. [Google Scholar] [CrossRef]
- Lluís, F.; Perdiguero, E.; Nebreda, A.R.; Muñoz-Cánoves, P. Regulation of skeletal muscle gene expression by p38 MAP kinases. Trends Cell Biol. 2006, 16, 36–44. [Google Scholar] [CrossRef]
- Díaz-Coránguez, M.; Liu, X.; Antonetti, D.A. Tight junctions in cell proliferation. Int. J. Mol. Sci. 2019, 20, 5972. [Google Scholar] [CrossRef] [PubMed] [Green Version]
- Balda, M.S.; Matter, K. Tight junctions and the regulation of gene expression. Biochim. Et Biophys. Acta Biomembr. 2009, 1788, 761–767. [Google Scholar] [CrossRef] [PubMed] [Green Version]


| Breed | Number of | Record of (g) | |||||
|---|---|---|---|---|---|---|---|
| Total | Males | Females | Max | Min | Mean | SD | |
| 1328 | 441 | 887 | 1380 | 335 | 738.22 | 150.11 | |
| Red KNC | 732 | 234 | 498 | 1380 | 335 | 761.99 | 173.66 |
| Yellow KNC | 596 | 207 | 389 | 1050 | 370 | 709.05 | 108.05 |
| Source | Variance | SE |
|---|---|---|
| Vg | 5842.90 | 768.40 |
| Ve | 6625.94 | 401.97 |
| Vp | 12,468.84 | 645.38 |
| Vg/Vp | 0.47 | 0.04 |
| SNP ID | Chr | Position | Minor Allele | Major Allele | MAF | p-Value | SNP Effect | Gene | Location |
|---|---|---|---|---|---|---|---|---|---|
| Gga_rs15062501 | 2 | 10469206 | G | A | 0.28 | 3.37 × 10⁻⁸ | 33.67 | WDR37 | Intron |
| GGaluGA083256 | 12 | 6388108 | C | A | 0.23 | 6.33 × 10⁻⁷ | −28.50 | ENSGALG00000047733 | Intron |
| Gga_rs14490865 | 4 | 75155441 | G | A | 0.21 | 1.73 × 10⁻⁶ | 33.42 | SLIT2 | Intron |
| GGaluGA265847 | 4 | 74925016 | G | A | 0.14 | 1.75 × 10⁻⁶ | 40.33 | KCNIP4 | Intron |
| GGaluGA265650 | 4 | 74010712 | A | G | 0.09 | 3.85 × 10⁻⁶ | 46.22 | PPARGC1A | Intragenic |
| Gga_rs14105952 | 18 | 893043 | G | A | 0.34 | 5.80 × 10⁻⁶ | 27.70 | MYOCD | Intragenic |
| Gga_rs13506093 | 18 | 804322 | A | G | 0.47 | 8.70 × 10⁻⁶ | −25.80 | MAP2K4 | Downstream |
| Gga_rs13506254 | 18 | 1185022 | C | A | 0.28 | 1.27 × 10⁻⁵ | 26.63 | ENSGALG00000054733 | Intron |
| Gga_rs15809279 | 18 | 353546 | G | A | 0.46 | 2.17 × 10⁻⁵ | −22.30 | ENSGALG00000029660 | Intron |
| Gga_rs13503427 | 3 | 10517429 | G | A | 0.32 | 2.35 × 10⁻⁵ | 24.12 | − | Intergenic |
| Gga_rs15508929 | 4 | 19924807 | G | A | 0.05 | 2.48 × 10⁻⁵ | −40.57 | TMEM131L | Upstream |
| GGaluGA265746 | 4 | 74486766 | A | G | 0.14 | 2.89 × 10⁻⁵ | 33.16 | ADGRA3 | Downstream |
| Category | Term_ID | Term | Count | % | p-Value | Genes |
|---|---|---|---|---|---|---|
| KEGG_PATHWAY | gga04010 | MAPK signaling pathway | 21 | 3.0043 | 0.00 | MAP2K3, MAP2K4, MAP3K3, TGFB2, IL1R1, BDNF, NFATC3, MAPK8IP3, TGFBR1, MAPK8IP1, PPP3CA, FGF7, TAOK1, GNA12, MKNK2, RAC2, MAPT, SOS1, SOS2, MAP4K3, MAP4K4 |
| KEGG_PATHWAY | gga04530 | Tight junction | 9 | 1.2876 | 0.03 | PPP2R2B, MYH1E, MYH1F, MYH1D, PPP2R2A, MYH1A, MYH1B, AMOTL1, MYH10 |
| GOTERM_MF_DIRECT | GO:0003774 | Motor activity | 6 | 0.8584 | 0.01 | MYH1E, MYH1F, MYH1A, MYH1B, MYH10, MYO1F |
| GOTERM_MF_DIRECT | GO:0001077 | Transcriptional activator activity, RNA polymerase II core promoter proximal region sequence-specific binding | 13 | 1.8598 | 0.02 | ARNT2, MYOCD, PLAG1, NFATC3, EBF2, NRF1, HIF1A, MEOX1, ELF1, NFIA, TBX20, TP63, ZNF750 |
| GOTERM_MF_DIRECT | GO:0004702 | Receptor signaling protein serine/threonine kinase activity | 7 | 1.0014 | 0.02 | MAP3K3, MAP2K4, TGFB2, BMPR2, TAOK1, TGFBR1, MAP4K4 |
| GOTERM_BP_DIRECT | GO:0045944 | Positive regulation of transcription from RNA polymerase II promoter | 34 | 4.8641 | 0.01 | RB1, RNASEL, BMPR2, PID1, KDM1A, TNKS, PLAG1, GATA4, TCF20, LDB2, MYSM1, HIF1A, NPAS2, ABRA, SPIC, PPP3CA, EPCAM, CREB3L1, TBX20, CYTL1, PPARGC1A, E2F7, TP63, NCOA1, XRCC6, AUTS2, LMO4, DAB2IP, ARNT, EBF2, ASH1L, BMP5, NFIA, CDH13 |
| GOTERM_BP_DIRECT | GO:2001235 | Positive regulation of apoptotic signaling pathway | 5 | 0.7153 | 0.01 | DAB2IP, PTEN, CASP2, TP63, TGFBR1 |
Publisher’s Note: MDPI stays neutral with regard to jurisdictional claims in published maps and institutional affiliations. |
© 2021 by the authors. Licensee MDPI, Basel, Switzerland. This article is an open access article distributed under the terms and conditions of the Creative Commons Attribution (CC BY) license (https://creativecommons.org/licenses/by/4.0/).
Share and Cite
Cha, J.; Choo, H.; Srikanth, K.; Lee, S.-H.; Son, J.-W.; Park, M.-R.; Kim, N.; Jang, G.W.; Park, J.-E. Genome-Wide Association Study Identifies 12 Loci Associated with Body Weight at Age 8 Weeks in Korean Native Chickens. Genes 2021, 12, 1170. https://doi.org/10.3390/genes12081170
Cha J, Choo H, Srikanth K, Lee S-H, Son J-W, Park M-R, Kim N, Jang GW, Park J-E. Genome-Wide Association Study Identifies 12 Loci Associated with Body Weight at Age 8 Weeks in Korean Native Chickens. Genes. 2021; 12(8):1170. https://doi.org/10.3390/genes12081170
Chicago/Turabian StyleCha, Jihye, Hyojun Choo, Krishnamoorthy Srikanth, Seung-Hwan Lee, Ju-Whan Son, Mi-Rim Park, Nayeon Kim, Gul Won Jang, and Jong-Eun Park. 2021. "Genome-Wide Association Study Identifies 12 Loci Associated with Body Weight at Age 8 Weeks in Korean Native Chickens" Genes 12, no. 8: 1170. https://doi.org/10.3390/genes12081170
APA StyleCha, J., Choo, H., Srikanth, K., Lee, S.-H., Son, J.-W., Park, M.-R., Kim, N., Jang, G. W., & Park, J.-E. (2021). Genome-Wide Association Study Identifies 12 Loci Associated with Body Weight at Age 8 Weeks in Korean Native Chickens. Genes, 12(8), 1170. https://doi.org/10.3390/genes12081170