
Signatures of Selection and Genomic Diversity of Muskellunge (Esox masquinongy) from Two Populations in North America

 ,
,
Abstract
:1. Introduction
2. Materials and Methods
2.1. Individuals and Sequencing
2.2. Bioinformatics Pipeline
2.3. Population Stratification Analyses
2.4. Pooled Heterozygosity and Fst
2.5. Inbreeding and Runs of Homozygosity (ROH)
3. Results
3.1. Whole-Genome Sequencing and Variant Calling
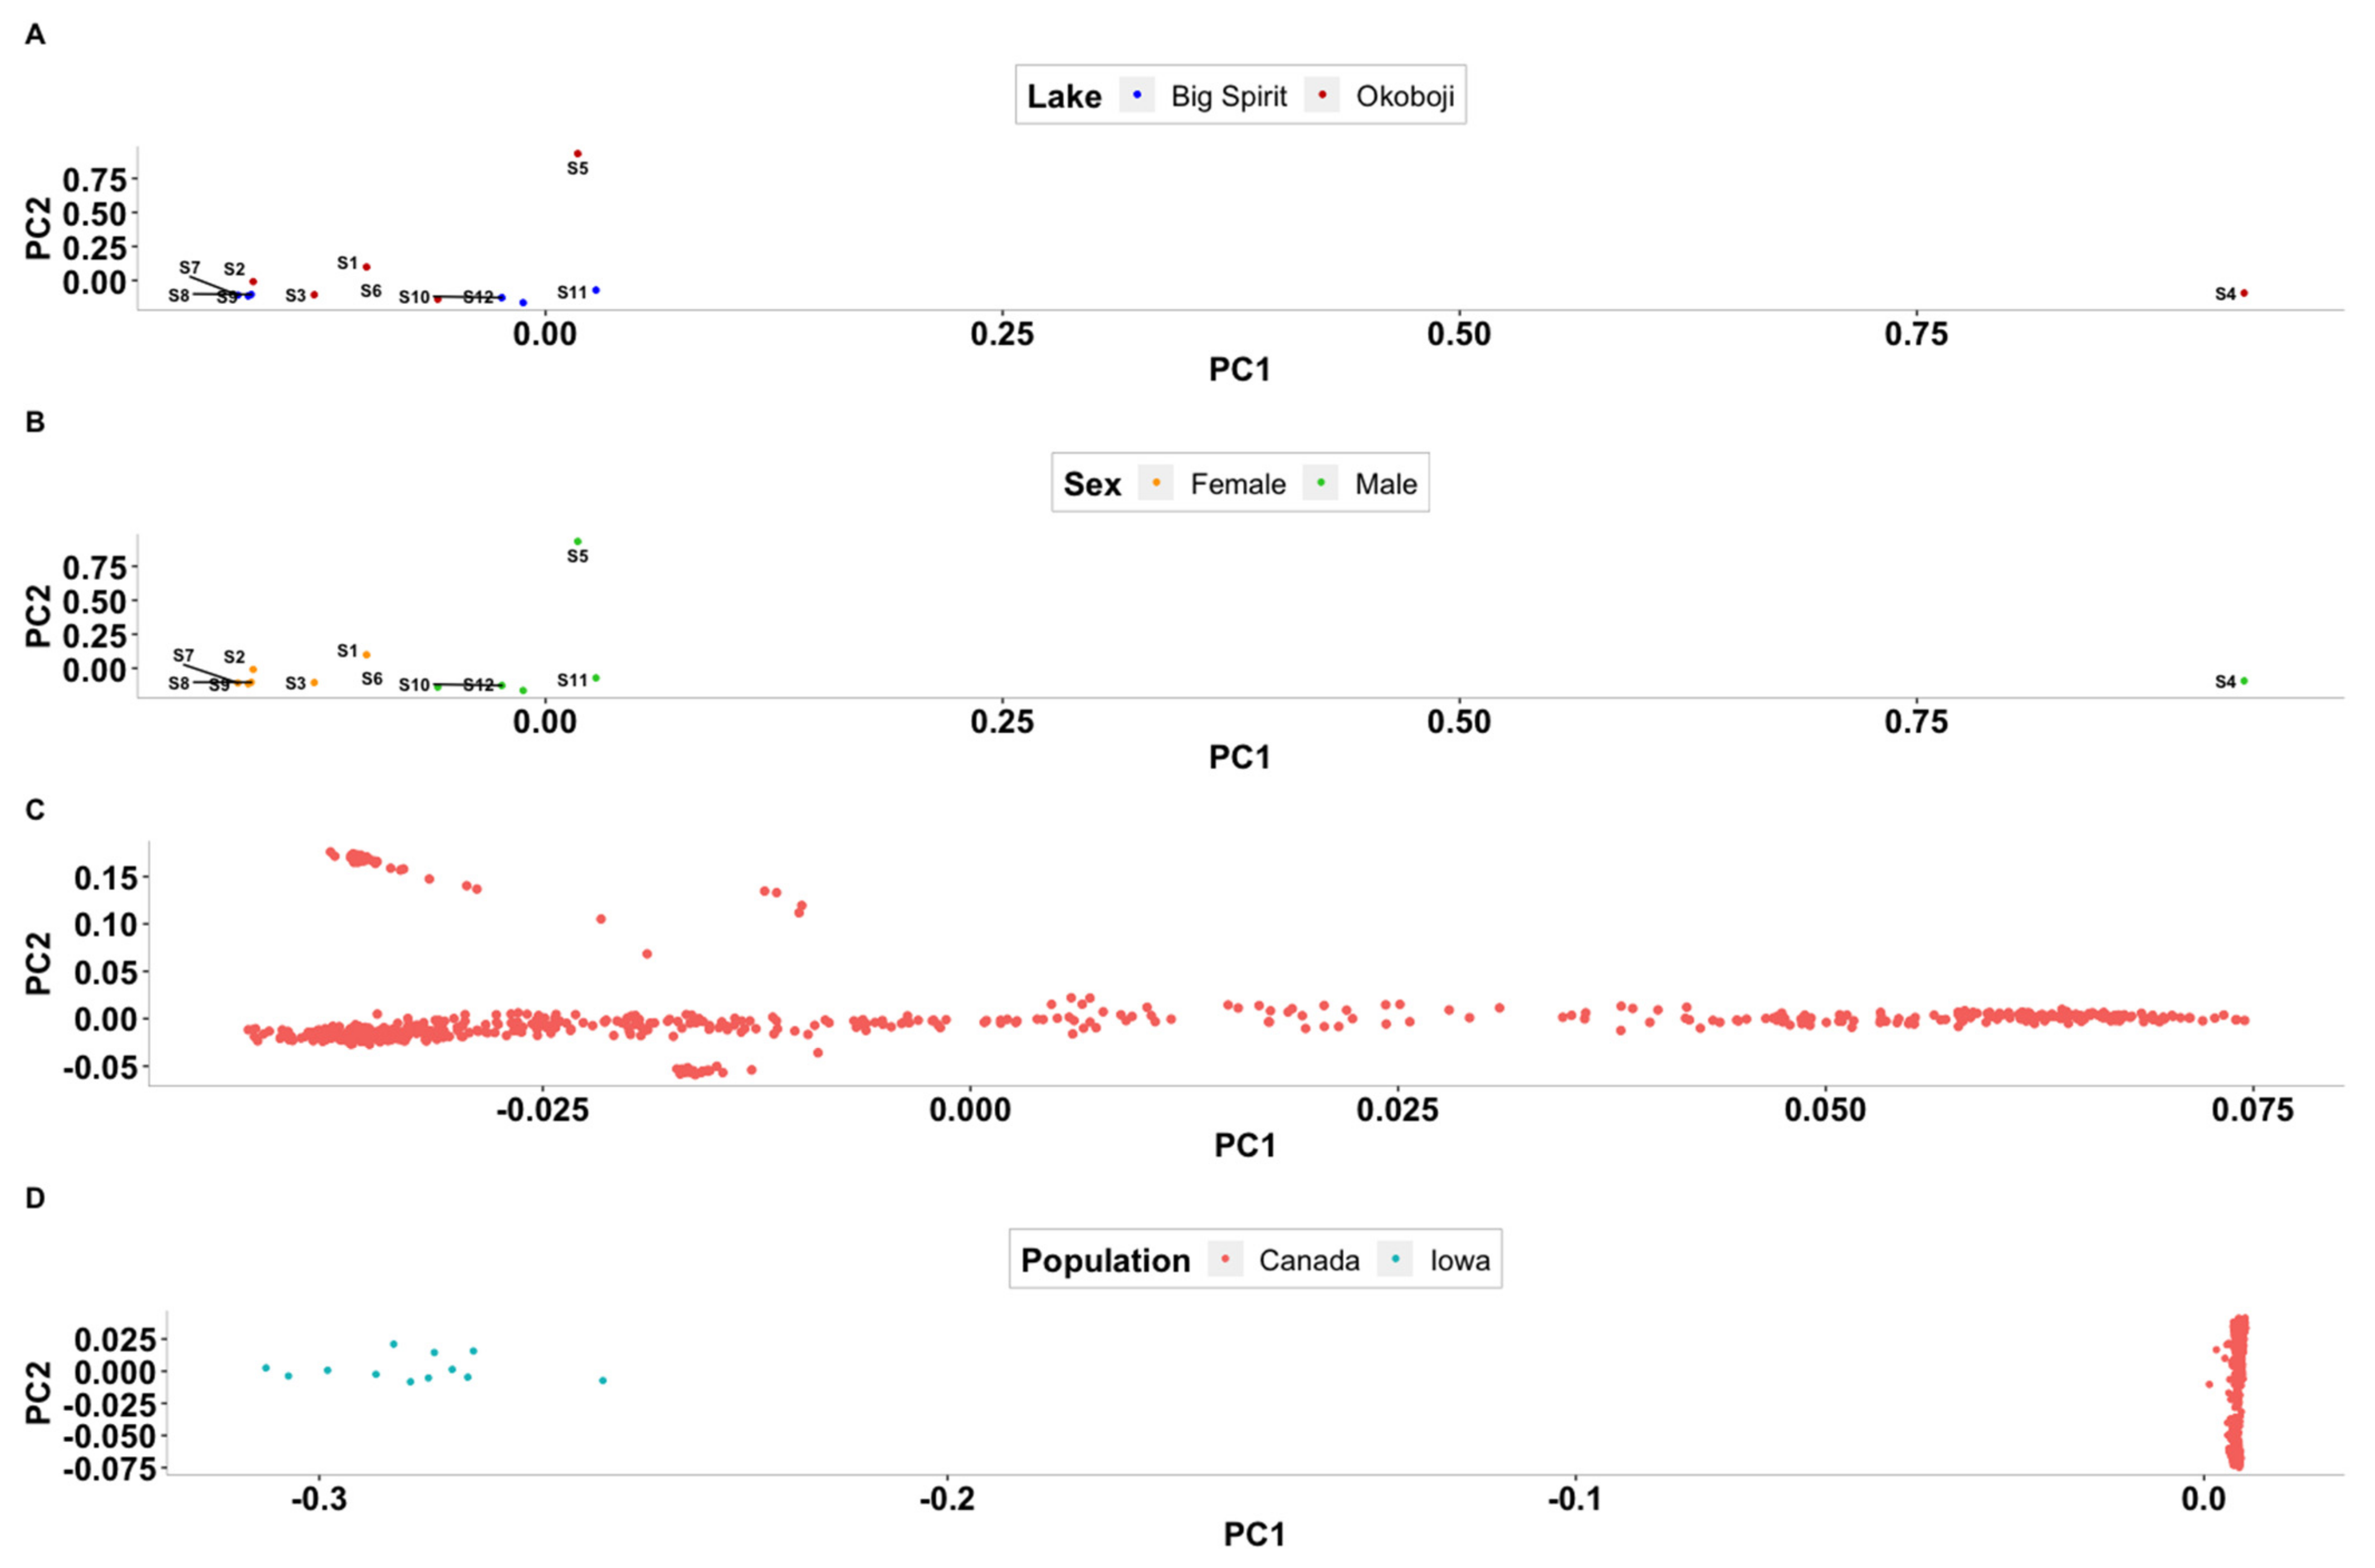
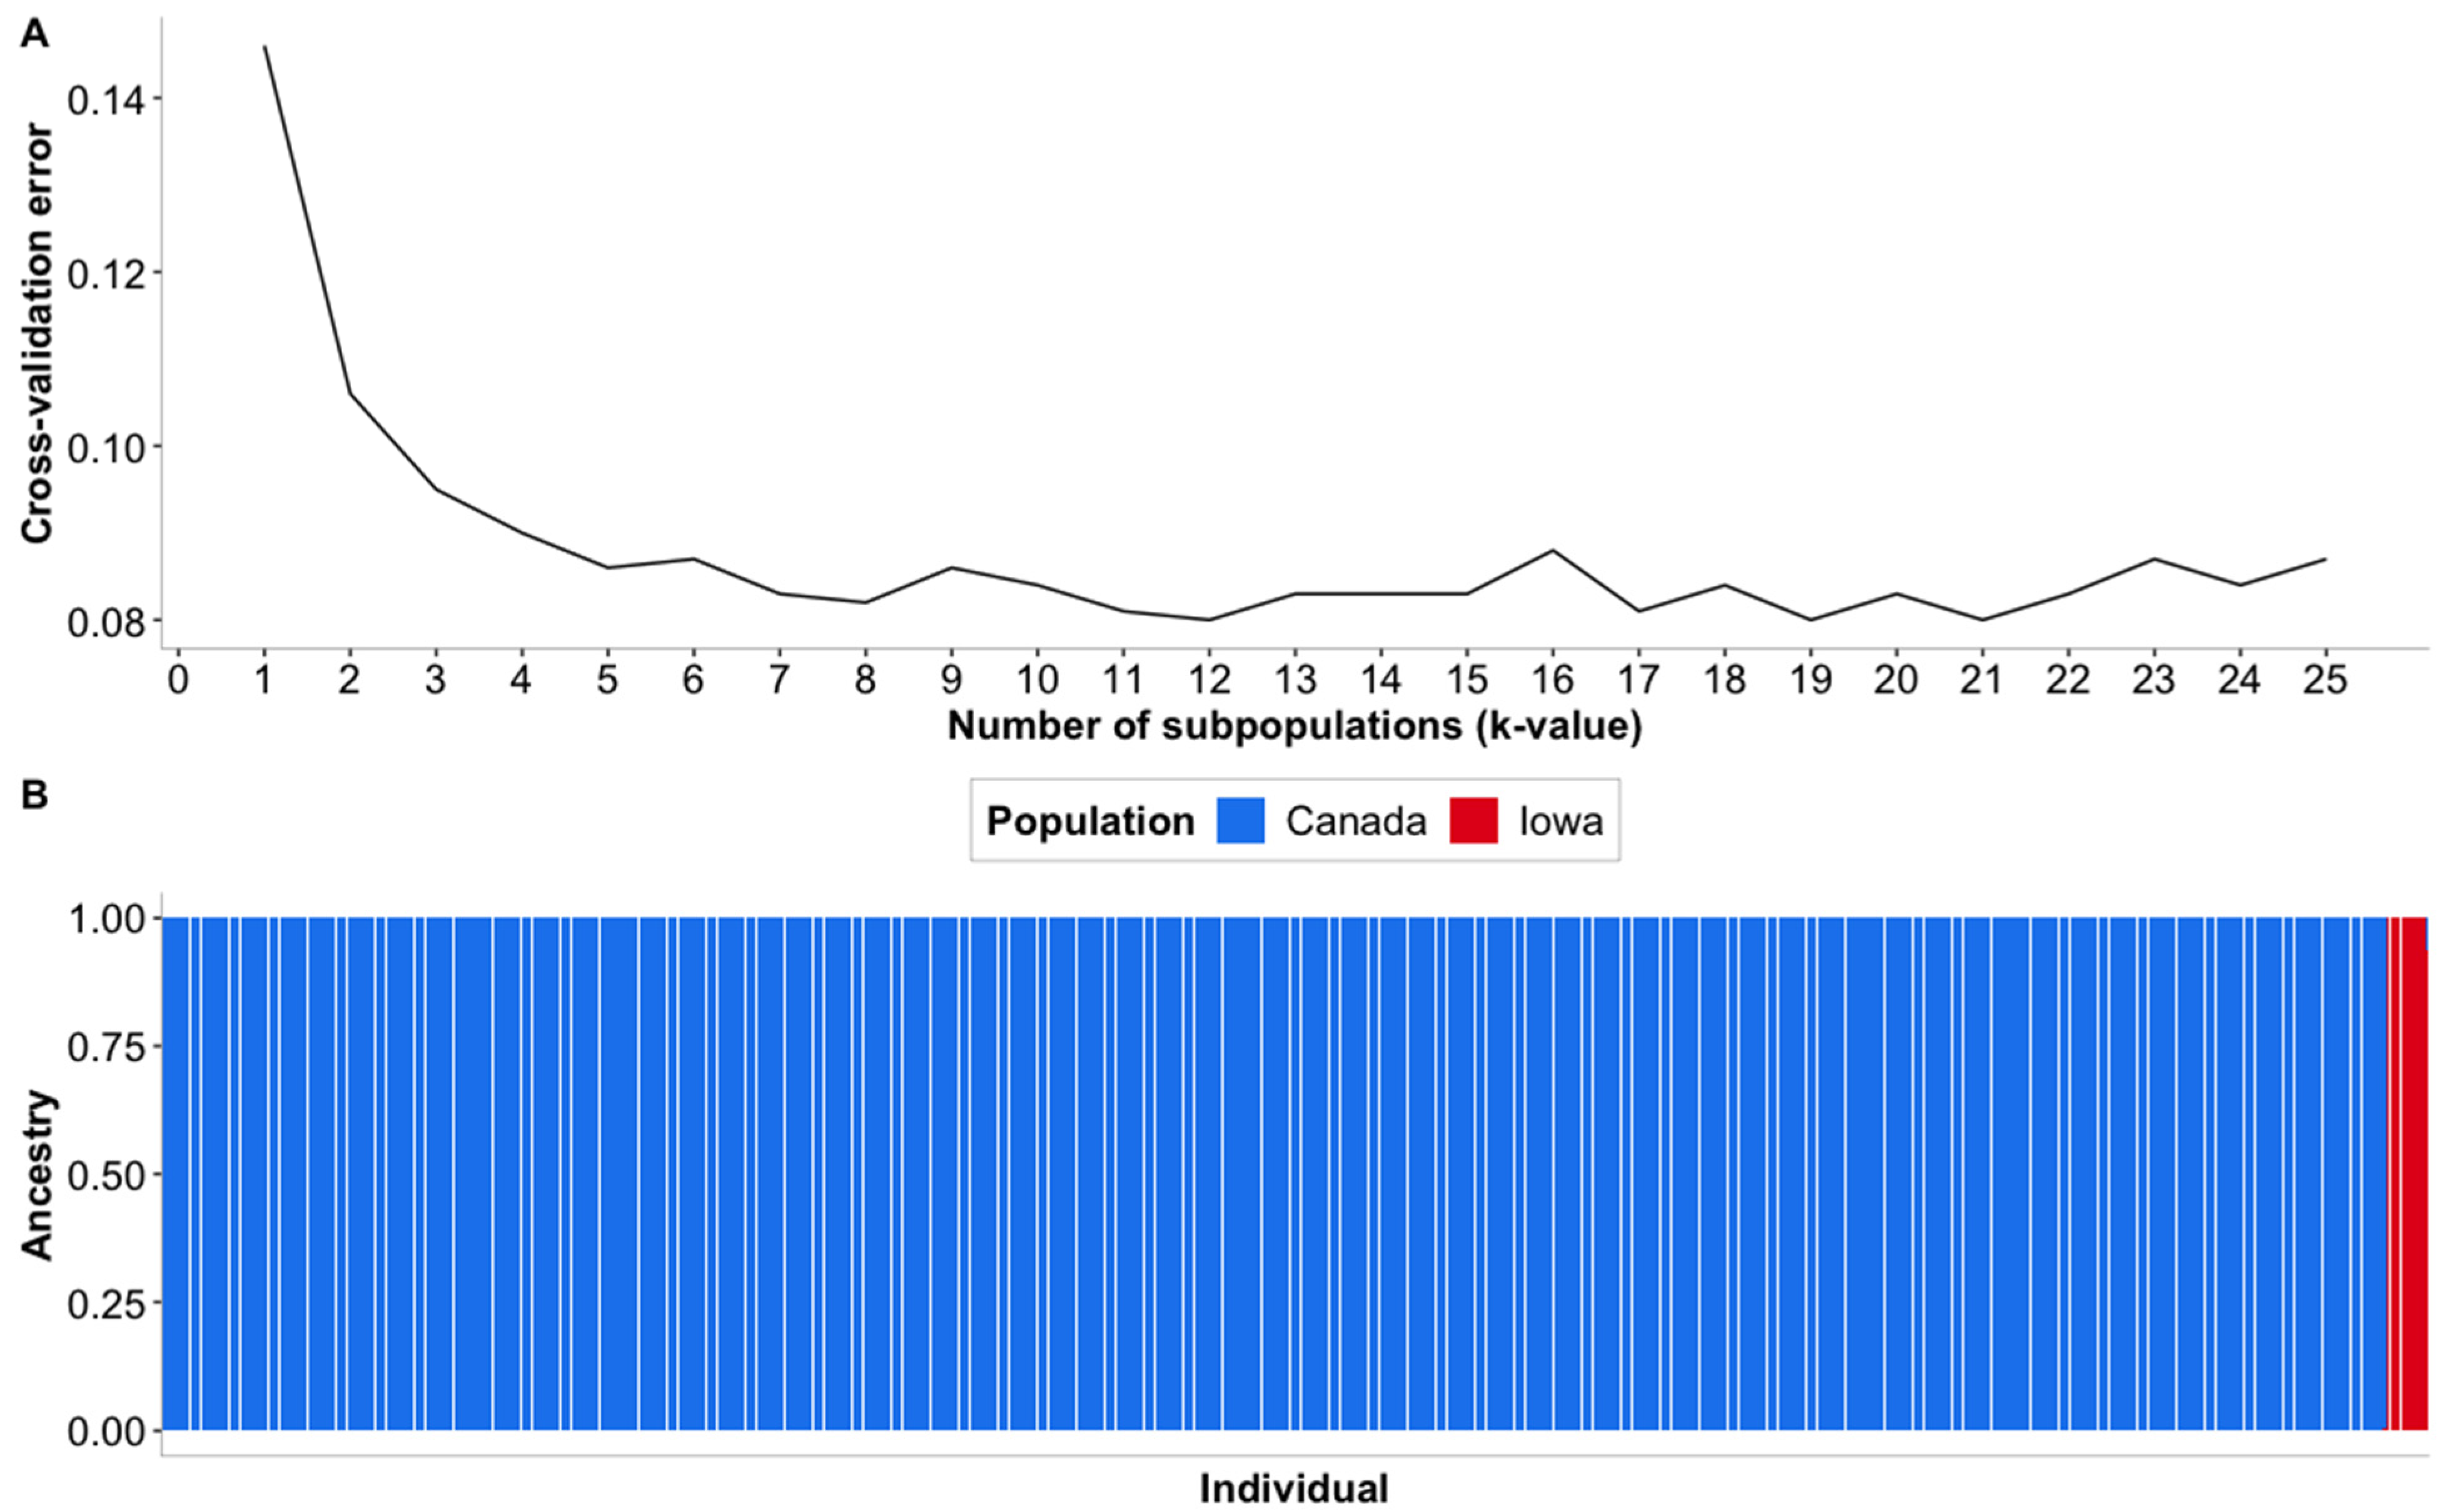
3.2. Population Stratification Analyses
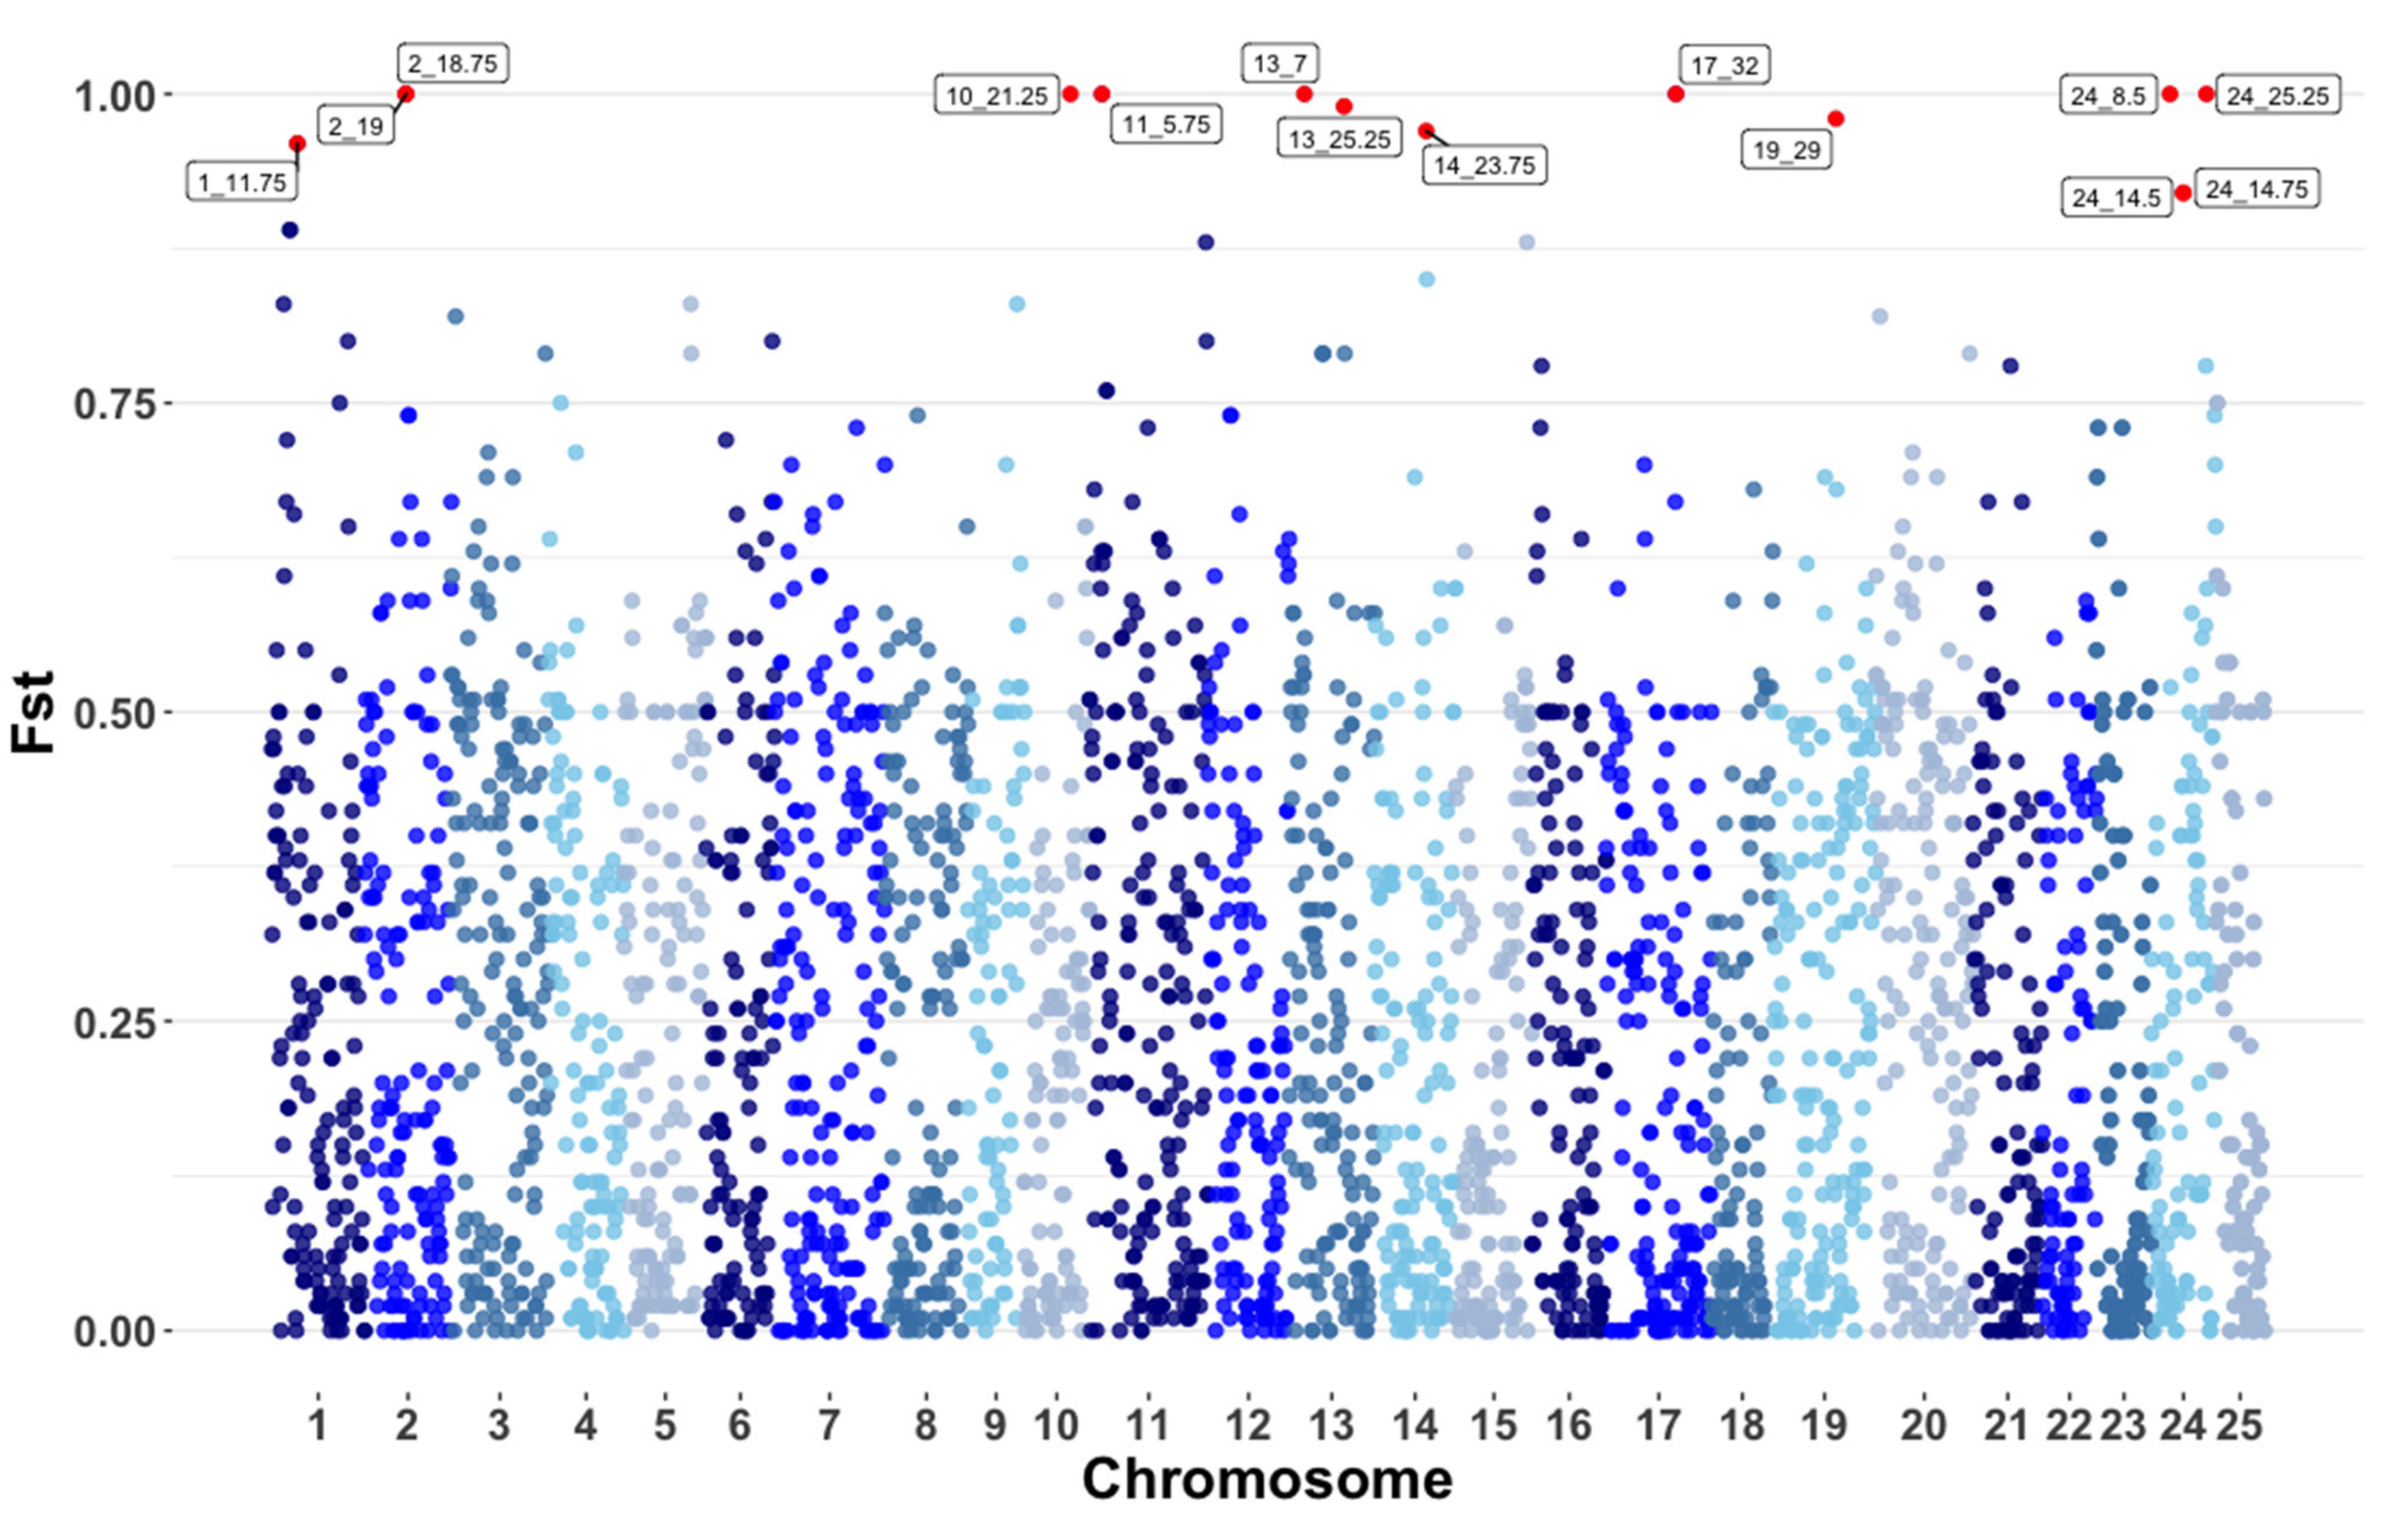
3.3. Pooled Heterozygosity and Genome Wide Fst
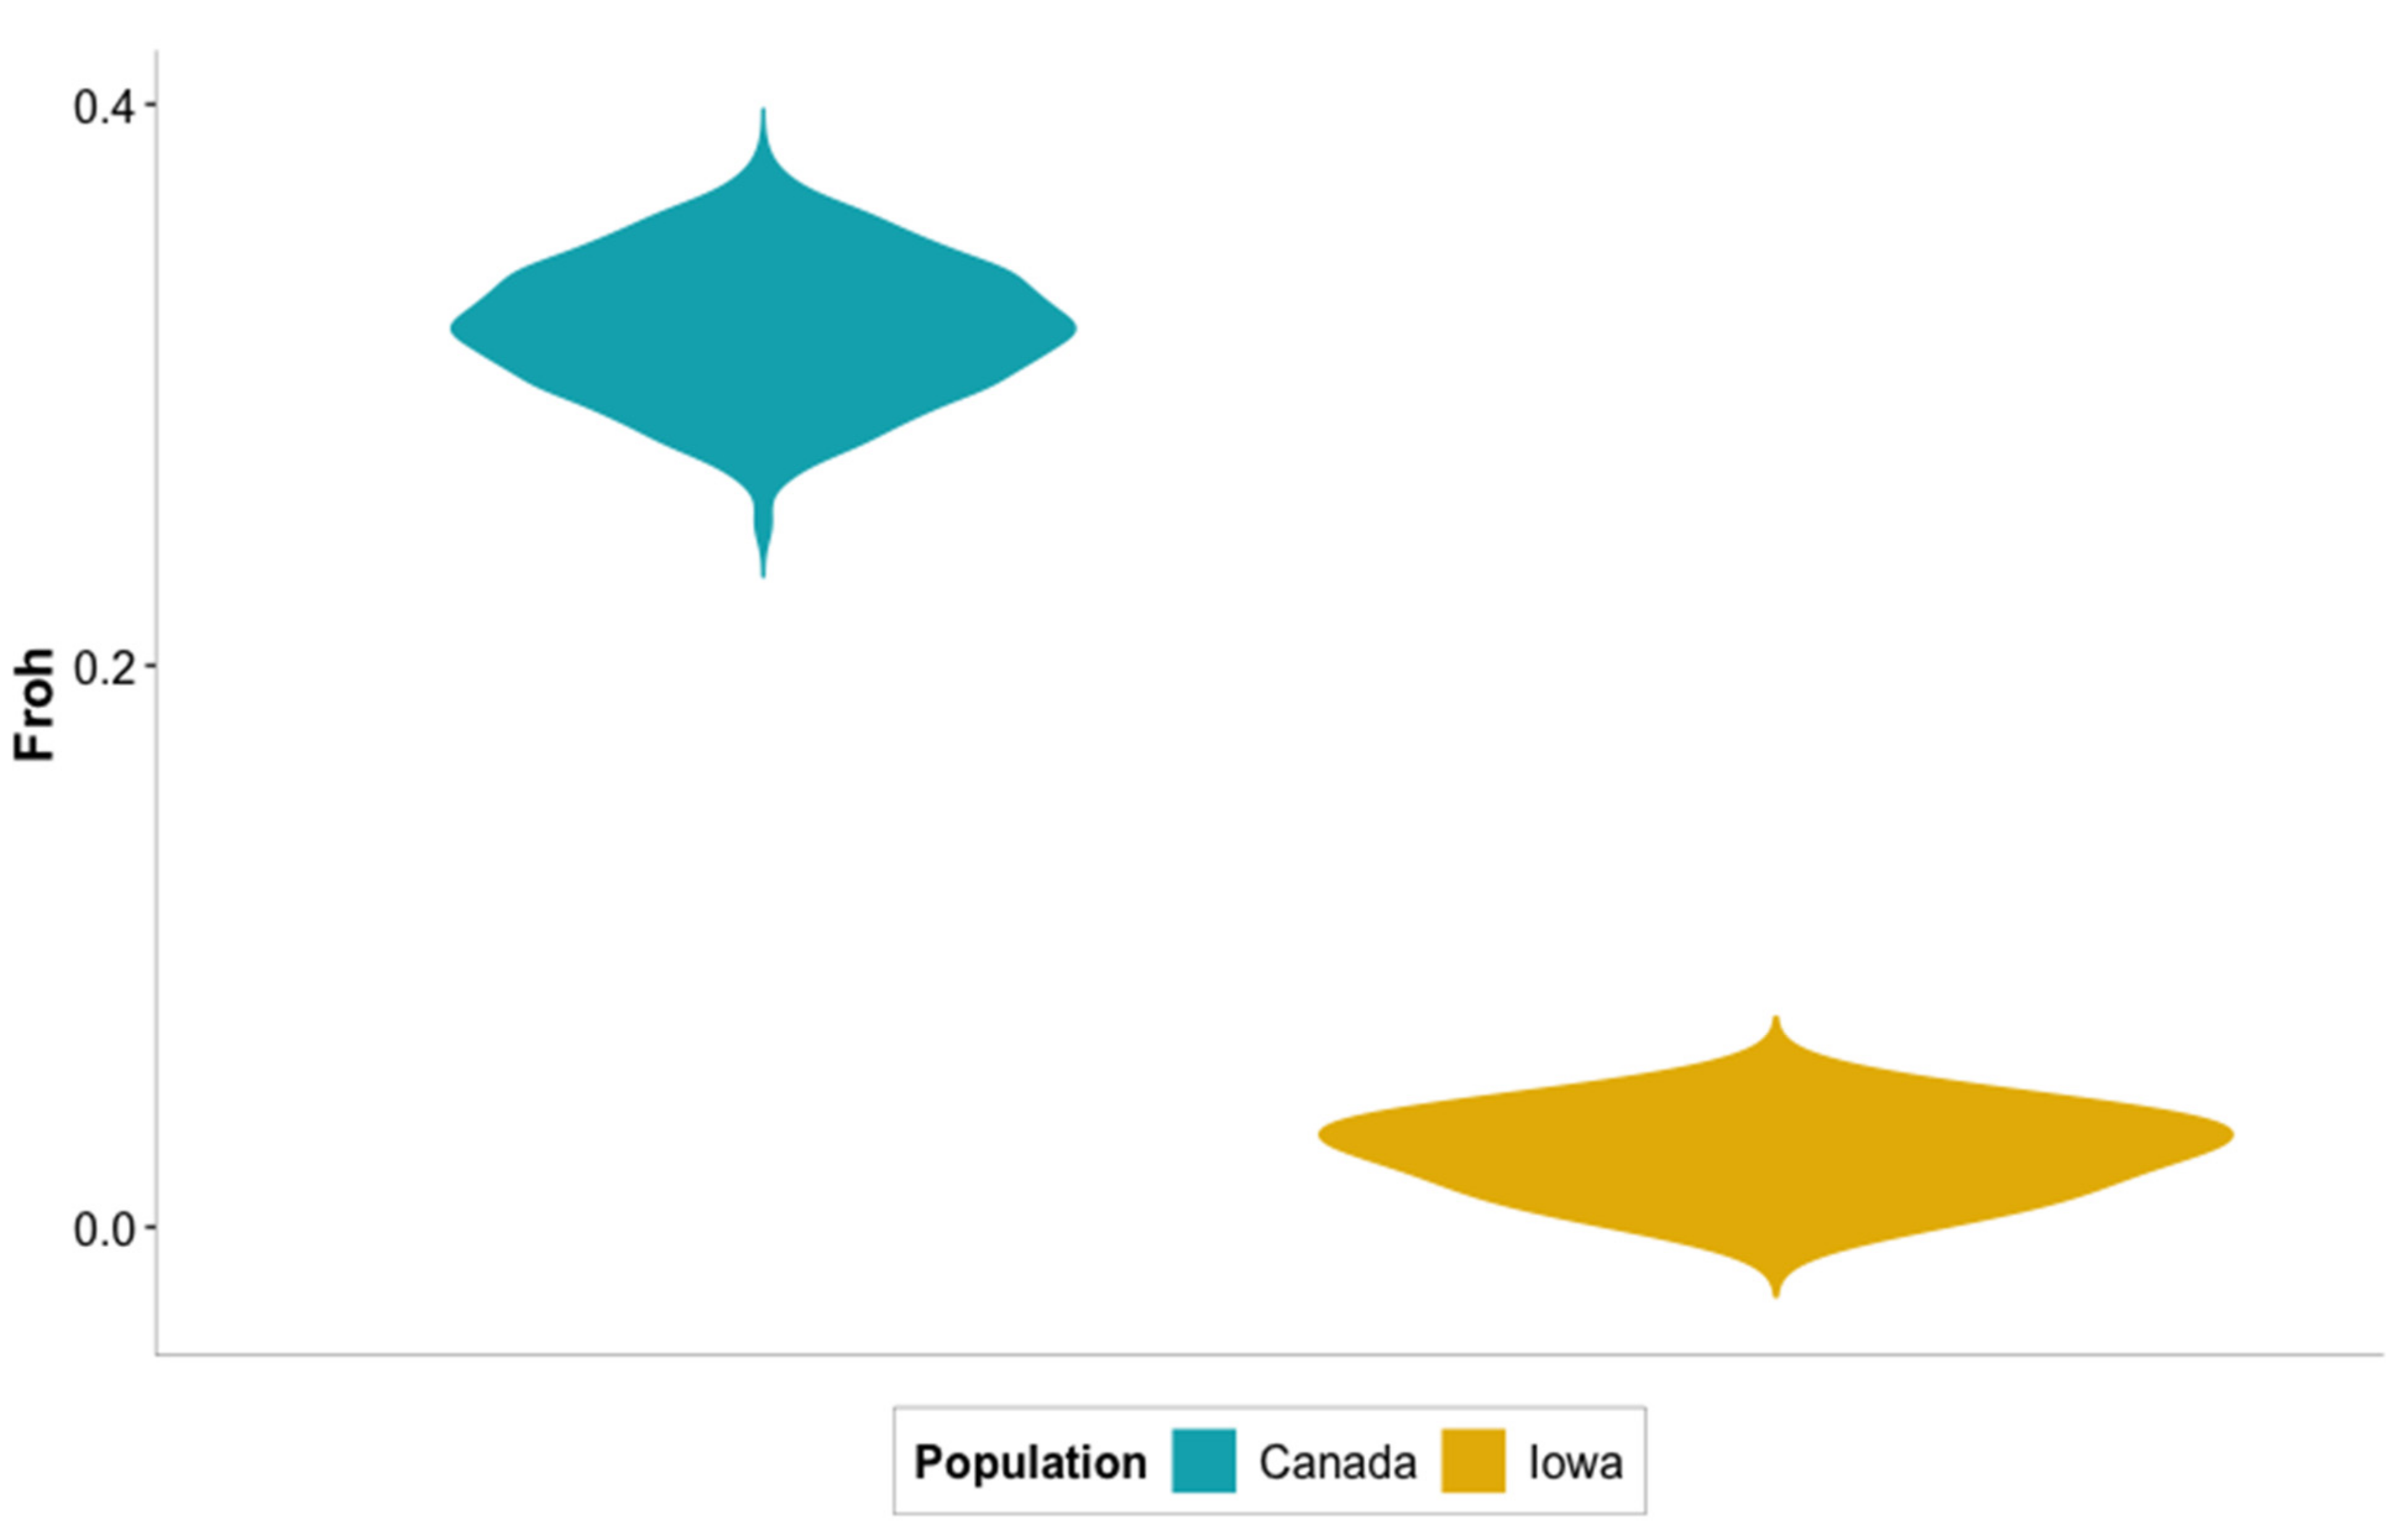
3.4. Inbreeding and Runs of Homozygosity (ROH)
4. Discussion
4.1. Whole-Genome Sequencing, Alignment to Northern Pike Genome and Variant Calling
4.2. Population Stratification
4.3. Signatures of Selection and Inbreeding
5. Conclusions
- Despite genetic differentiation based on sex, no major locus has been detected.
- Muskellunge from Canada and Iowa represent two clearly distinct populations with different estimated rates of inbreeding.
- Inbreeding does not seem to be an immediate concern for Muskellunge in Iowa.
- Apparent isolation of subpopulations has caused levels of homozygosity to be higher in the Canadian Muskellunge population.
Supplementary Materials
Author Contributions
Funding
Institutional Review Board Statement
Informed Consent Statement
Data Availability Statement
Acknowledgments
Conflicts of Interest
References
- Meerbeek, J. Iowa’s Muskellunge management plan. Iowa Dep. Nat. Resour. Des Moines 2014. [Google Scholar] [CrossRef]
- Crossman, E.J. Taxonomy and distribution of North American esocids. Fish Soc. Spec. Publ. 1978, 11, 13–26. [Google Scholar]
- Miller, L.M.; Farrell, J.M.; KapuscinsKi, K.L.; Scribner, K.; Sloss, B.L.; Turnquist, K.; Wilson, C.C. A Review of Muskellunge Population Genetics: Implications for Management and Future Research Needs. Am. Fish Soc. 2017, 85, 385–414. [Google Scholar]
- Kerr, S.J. Distribution and Management of Muskellunge in North America: An Overview; Canadian Ministry of Natural Resources: Bancroft, ON, Canada, 2011. [Google Scholar]
- Madden, K.; Lynch, A. Notes on the First Rearing and Introduction of Esox masquinongy in Iowa Waters. Proc. Iowa Acad. Sci. 1962, 69. Available online: https://scholarworks.uni.edu/pias/vol69/iss1/45 (accessed on 6 January 2021).
- Jennings, M.J.; Sloss, B.L.; Hatzenbeler, G.R.; Kampa, J.M.; Simonson, T.D.; Avelallemant, S.P.; Lindenberger, G.A.; Underwood, B.D. Implementation of Genetic Conservation Practices in a Muskellunge Propagation and Stocking Program. Fisheries 2010, 35, 388–395. [Google Scholar] [CrossRef]
- Whitlock, M.C.; Bürger, R. Fixation of New Mutations in Small Populations; Cambridge University Press: Cambridge, UK, 2004. [Google Scholar]
- Bataillon, T.; Kirkpatrick, M. Inbreeding depression due to mildly deleterious mutations in finite populations: Size does matter. Genet. Res. 2000, 75, 75–81. [Google Scholar] [CrossRef]
- Rougemont, Q.; Carrier, A.; Le Luyer, J.; Ferchaud, A.-L.; Farrell, J.M.; Hatin, D.; Brodeur, P.; Bernatchez, L. Combining population genomics and forward simulations to investigate stocking impacts: A case study of Muskellunge (Esox masquinongy) from the St. Lawrence River basin. Evol. Appl. 2019, 12, 902–922. [Google Scholar] [CrossRef] [Green Version]
- Ryman, N.; Laikre, L. Effects of Supportive Breeding on the Genetically Effective Population Size. Conserv. Biol. 1991, 5, 325–329. [Google Scholar] [CrossRef]
- Laikre, L.; Ryman, N. Effects on intraspecific biodiversity from harvesting and enhancing natural populations. Ambio 1996, 25, 504–509. [Google Scholar]
- Rondeau, E.B.; Minkley, D.R.; Leong, J.; Messmer, A.M.; Jantzen, J.R.; Von Schalburg, K.R.; Lemon, C.; Bird, N.H.; Koop, B.F. The genome and linkage map of the Northern Pike (Esox lucius): Conserved synteny revealed between the salmonid sister group and the neoteleostei. PLoS ONE 2014, 9, e102089. [Google Scholar] [CrossRef] [Green Version]
- Davisson, M.T. Karyotypes of the Teleost Family Esocidae. J. Fish. Res. Board Can. 1972, 29, 579–582. [Google Scholar] [CrossRef]
- Craig, J.F. A short review of pike ecology. Hydrobiologia 2008, 601, 5–16. [Google Scholar] [CrossRef]
- Forsman, A.; Tibblin, P.; Berggren, H.; Nordahl, O.; Koch-Schmidt, P.; Larsson, P.T. Pike Esox lucius as an emerging model organism for studies in ecology and evolutionary biology: A review. J. Fish Biol. 2015, 87, 472–479. [Google Scholar] [CrossRef] [Green Version]
- Rougemont, Q.; Carrier, A.; Le Luyer, J.; Ferchaud, A.-L.; Farrell, J.M.; Hatin, D.; Brodeur, P.; Bernatchez, L. Esox Masquinongy (Accession: PRJNA512459 ID 512459)—BioProject—NCBI. Available online: https://www.ncbi.nlm.nih.gov/bioproject/?term=PRJNA512459 (accessed on 9 January 2021).
- Nazareno, A.G.; Bemmels, J.B.; Dick, C.W.; Lohmann, L.G. Minimum sample sizes for population genomics: An empirical study from an Amazonian plant species. Mol. Ecol. Resour. 2017, 17, 1136–1147. [Google Scholar] [CrossRef]
- Andrews, S. FastQC: A Quality Control Tool for High Throughput Sequence Data. 2010. Available online: https://qubeshub.org/resources/fastqc (accessed on 3 February 2021).
- Bolger, A.M.; Lohse, M.; Usadel, B. Trimmomatic: A flexible trimmer for Illumina sequence data. Bioinformatics 2014, 30, 2114–2120. [Google Scholar] [CrossRef] [Green Version]
- Li, H.; Durbin, R. Fast and accurate long-read alignment with Burrows–Wheeler transform. Bioinformatics 2010, 26, 589–595. [Google Scholar] [CrossRef] [Green Version]
- Alexander, D.H.; Lange, K. Enhancements to the ADMIXTURE algorithm for individual ancestry estimation. BMC Bioinform. 2011, 12, 246. [Google Scholar] [CrossRef] [Green Version]
- Purcell, S.; Neale, B.; Todd-Brown, K.; Thomas, L.; Ferreira, M.A.; Bender, D.; Maller, J.; Sklar, P.; de Bakker, P.I.W.; Daly, M.J.; et al. PLINK: A tool set for whole-genome association and population-based linkage analyses. Am. J. Hum. Genet. 2007, 81, 559–575. [Google Scholar] [CrossRef] [Green Version]
- Rubin, C.-J.; Zody, M.C.; Eriksson, J.; Meadows, J.R.S.; Sherwood, E.; Webster, M.T.; Jiang, L.; Ingman, M.; Sharpe, T.; Ka, S.; et al. Whole-genome resequencing reveals loci under selection during chicken domestication. Nature 2010, 464, 587–591. [Google Scholar] [CrossRef] [Green Version]
- Bertolini, F.; Geraci, C.; Schiavo, G.; Sardina, M.T.; Chiofalo, V.; Fontanesi, L. Whole genome semiconductor based sequencing of farmed European sea bass (Dicentrarchus labrax) Mediterranean genetic stocks using a DNA pooling approach. Mar. Genom. 2016, 28, 63–70. [Google Scholar] [CrossRef] [Green Version]
- Bertolini, F.; Ribani, A.; Capoccioni, F.; Buttazzoni, L.; Utzeri, V.J.; Bovo, S.; Schiavo, G.; Caggiano, M.; Fontanesi, L.; Rothschild, M.F. Identification of a major locus determining a pigmentation defect in cultivated gilthead seabream (Sparus aurata). Anim. Genet. 2020, 51, 319–323. [Google Scholar] [CrossRef] [PubMed]
- Chen, E.Y.; Tan, C.M.; Kou, Y.; Duan, Q.; Wang, Z.; Meirelles, G.V.; Clark, N.R.; Ma’Ayan, A. Enrichr: Interactive and collaborative HTML5 gene list enrichment analysis tool. BMC Bioinform. 2013, 14, 128. [Google Scholar] [CrossRef] [PubMed] [Green Version]
- Kuleshov, M.V.; Jones, M.R.; Rouillard, A.; Fernandez, N.F.; Duan, Q.; Wang, Z.; Koplev, S.; Jenkins, S.L.; Jagodnik, K.M.; Lachmann, A.; et al. Enrichr: A comprehensive gene set enrichment analysis web server 2016 update. Nucleic Acids Res. 2016, 44, W90–W97. [Google Scholar] [CrossRef] [PubMed] [Green Version]
- Sumreddee, P.; Toghiani, S.; Hay, E.H.; Roberts, A.; Aggrey, S.E.; Rekaya, R. Runs of homozygosity and analysis of inbreeding depression. J. Anim. Sci. 2020, 98. [Google Scholar] [CrossRef] [PubMed]
- Giani, A.M.; Gallo, G.R.; Gianfranceschi, L.; Formenti, G. Long walk to genomics: History and current approaches to genome sequencing and assembly. Comput. Struct. Biotechnol. J. 2020, 18, 9–19. [Google Scholar] [CrossRef]
- Bertolini, F.; Scimone, C.; Geraci, C.; Schiavo, G.; Utzeri, V.J.; Chiofalo, V.; Fontanesi, L. Next generation semiconductor based sequencing of the donkey (Equus asinus) genome provided comparative sequence data against the horse genome and a few millions of single nucleotide polymorphisms. PLoS ONE 2015, 10, e0131925. [Google Scholar] [CrossRef] [Green Version]
- Fromer, M.; Moran, J.L.; Chambert, K.; Banks, E.; Bergen, S.; Ruderfer, D.M.; Handsaker, R.; McCarroll, S.A.; O’Donovan, M.; Owen, M.J.; et al. Discovery and statistical genotyping of copy-number variation from whole-exome sequencing depth. Am. J. Hum. Genet. 2012, 91, 597–607. [Google Scholar] [CrossRef] [Green Version]
- Depristo, M.A.; Banks, E.; Poplin, R.; Garimella, K.V.; Maguire, J.R.; Hartl, C.; Philippakis, A.A.; Del Angel, G.; Rivas, M.A.; Hanna, M.; et al. A framework for variation discovery and genotyping using next-generation DNA sequencing data. Nat. Genet. 2011, 43, 491–498. [Google Scholar] [CrossRef]
- Lucentini, L.; Puletti, M.E.; Ricciolini, C.; Gigliarelli, L.; Fontaneto, D.; Lanfaloni, L.; Bilò, F.; Natali, M.; Panara, F. Molecular and phenotypic evidence of a new species of genus Esox (Esocidae, Esociformes, Actinopterygii): The Southern Pike, Esox flaviae. PLoS ONE 2011, 6, e25218. [Google Scholar] [CrossRef]
- Smith, C.T.; Elfstrom, C.M.; Seeb, L.W.; Eeb, J.E.S. Use of sequence data from Rainbow trout and Atlantic salmon for SNP detection in Pacific Salmon. Mol. Ecol. 2005, 14, 4193–4203. [Google Scholar] [CrossRef]
- McKay, S.J.; Devlin, R.H.; Smith, M.J. Phylogeny of Pacific Salmon and Trout based on growth hormone type-2 and mitochondrial NADH dehydrogenase subunit 3 DNA sequences. Can. J. Fish. Aquat. Sci. 1996, 53, 1165–1176. [Google Scholar] [CrossRef]
- Turnquist, K.N.; Larson, W.A.; Farrell, J.M.; Hanchin, P.A.; Kapuscinski, K.L.; Miller, L.M.; Scribner, K.T.; Wilson, C.; Sloss, B.L. Genetic structure of muskellunge in the Great Lakes region and the effects of supplementation on genetic integrity of wild populations. J. Great Lakes Res. 2017, 43, 1141–1152. [Google Scholar] [CrossRef]
- Sandra, G.-E.; Norma, M.-M. Sexual determination and differentiation in teleost fish. Rev. Fish Biol. Fish. 2009, 20, 101–121. [Google Scholar] [CrossRef]
- Pan, Q.; Feron, R.; Yano, A.; Guyomard, R.; Jouanno, E.; Vigouroux, E.; Wen, M.; Busnel, J.-M.; Bobe, J.; Concordet, J.-P.; et al. Identification of the master sex determining gene in Northern pike (Esox lucius) reveals restricted sex chromosome differentiation. PLoS Genet. 2019, 15, e1008013. [Google Scholar] [CrossRef] [Green Version]
- Jennings, M.J.; Hatzenbeler, G.R.; Kampa, J.M. Spring Capture Site Fidelity of Adult Muskellunge in Inland Lakes. N. Am. J. Fish. Manag. 2011, 31, 461–467. [Google Scholar] [CrossRef]
- Bosworth, A.; Farrell, J.M. Genetic Divergence among Northern Pike from Spawning Locations in the Upper St. Lawrence River. N. Am. J. Fish. Manag. 2006, 26, 676–684. [Google Scholar] [CrossRef]
- Miller, L.M.; Kallemeyn, L.; Senanan, W. Spawning-Site and Natal-Site Fidelity by Northern Pike in a Large Lake: Mark–Recapture and Genetic Evidence. Trans. Am. Fish. Soc. 2001, 130, 307–316. [Google Scholar] [CrossRef]
- Li, Y.; Yagi, H.; Onuoha, E.O.; Damerla, R.R.; Francis, R.; Furutani, Y.; Tariq, M.; King, S.M.; Hendricks, G.; Cui, C.; et al. DNAH6 and Its Interactions with PCD Genes in Heterotaxy and Primary Ciliary Dyskinesia. PLoS Genet. 2016, 12, e1005821. [Google Scholar] [CrossRef] [Green Version]
- Ota, T.; Suzuki, Y.; Nishikawa, T.; Otsuki, T.; Sugiyama, T.; Irie, R.; Wakamatsu, A.; Hayashi, K.; Sato, H.; Nagai, K.; et al. Complete sequencing and characterization of 21,243 full-length human cDNAs. Nat. Genet. 2003, 36, 40–45. [Google Scholar] [CrossRef]
- Sánchez, E.; Azcona, L.J.; Paisán-Ruiz, C. Pla2g6 Deficiency in Zebrafish Leads to Dopaminergic Cell Death, Axonal Degeneration, Increased β-Synuclein Expression, and Defects in Brain Functions and Pathways. Mol. Neurobiol. 2018, 55, 6734–6754. [Google Scholar] [CrossRef]
- Klee, E.W.; Schneider, H.; Clark, K.J.; Cousin, M.A.; Ebbert, J.O.; Hooten, W.M.; Karpyak, V.; Warner, D.O.; Ekker, S.C. Zebrafish: A model for the study of addiction genetics. Qual. Life Res. 2011, 131, 977–1008. [Google Scholar] [CrossRef] [Green Version]
- Thompson, M.J.; Lai, W.S.; Taylor, G.A.; Blackshear, P.J. Cloning and characterization of two yeast genes encoding members of the CCCH class of zinc finger proteins: Zinc finger-mediated impairment of cell growth. Gene 1996, 174, 225–233. [Google Scholar] [CrossRef]
- Meyermans, R.; Gorssen, W.; Buys, N.; Janssens, S. How to study runs of homozygosity using plink? A guide for analyzing medium density SNP data in livestock and pet species. BMC Genom. 2020, 21, 94. [Google Scholar] [CrossRef]
- Kapuscinski, K.L.; Sloss, B.L.; Farrell, J.M. Genetic Population Structure of Muskellunge in the Great Lakes. Trans. Am. Fish. Soc. 2013, 142, 1075–1089. [Google Scholar] [CrossRef]
- Wilson, C.C.; Liskauskas, A.P.; Wozney, K.M. Pronounced Genetic Structure and Site Fidelity among Native Muskellunge Populations in Lake Huron and Georgian Bay. Trans. Am. Fish. Soc. 2016, 145, 1290–1302. [Google Scholar] [CrossRef]
- Falconer, D.S.; Mackay, T.F.C. Introduction to Quantitative Genetics, 4th ed.; Longman Group Limited: Essex, UK, 1996. [Google Scholar]


| Sample # | Sex | Lake | Sequenced Reads (#) 1 | Aligned Reads (%) | High-Quality Reads (%) 2 | Depth (×) 3 |
|---|---|---|---|---|---|---|
| 1 | Female | Okoboji | 203,824,613 | 86.34 | 96.85 | 16.23 |
| 2 | Female | Okoboji | 315,700,163 | 86.16 | 96.78 | 24.93 |
| 3 | Female | Okoboji | 306,850,333 | 86.04 | 96.99 | 24.34 |
| 4 | Male | Okoboji | 99,981,043 | 87.30 | 96.22 | 8.26 |
| 5 | Male | Okoboji | 150,029,226 | 86.38 | 96.75 | 12.12 |
| 6 | Male | Okoboji | 538,733,400 | 87.32 | 96.44 | 41.53 |
| 7 | Female | Big Spirit | 438,773,328 | 86.29 | 95.68 | 49.98 |
| 8 | Female | Big Spirit | 538,733,400 | 85.62 | 95.29 | 47.41 |
| 9 | Female | Big Spirit | 510,088,829 | 85.62 | 94.77 | 47.41 |
| 10 | Male | Big Spirit | 157,555,467 | 86.76 | 96.56 | 14.34 |
| 11 | Male | Big Spirit | 140,430,988 | 86.73 | 96.41 | 12.81 |
| 12 | Male | Big Spirit | 177,235,006 | 85.92 | 96.56 | 15.8 |
| Iowa Average | --- | --- | 217,503,897 | 86.37 | 96.27 | 26.26 |
| Canada Average | --- | --- | 1,022,373 | 63.11 | 86.15 | 11.44 4 |
| Depth Threshold | Bases above Threshold (#) | Percentage (%) |
|---|---|---|
| >0× | 735,465,012 | 80.05 |
| 10× | 607,490,936 | 66.12 |
| 20× | 539,961,789 | 58.77 |
| 50× | 21,395,310 | 2.33 |
| 100× | 7,981,231 | 0.87 |
| 1000× | 260,029 | 0.03 |
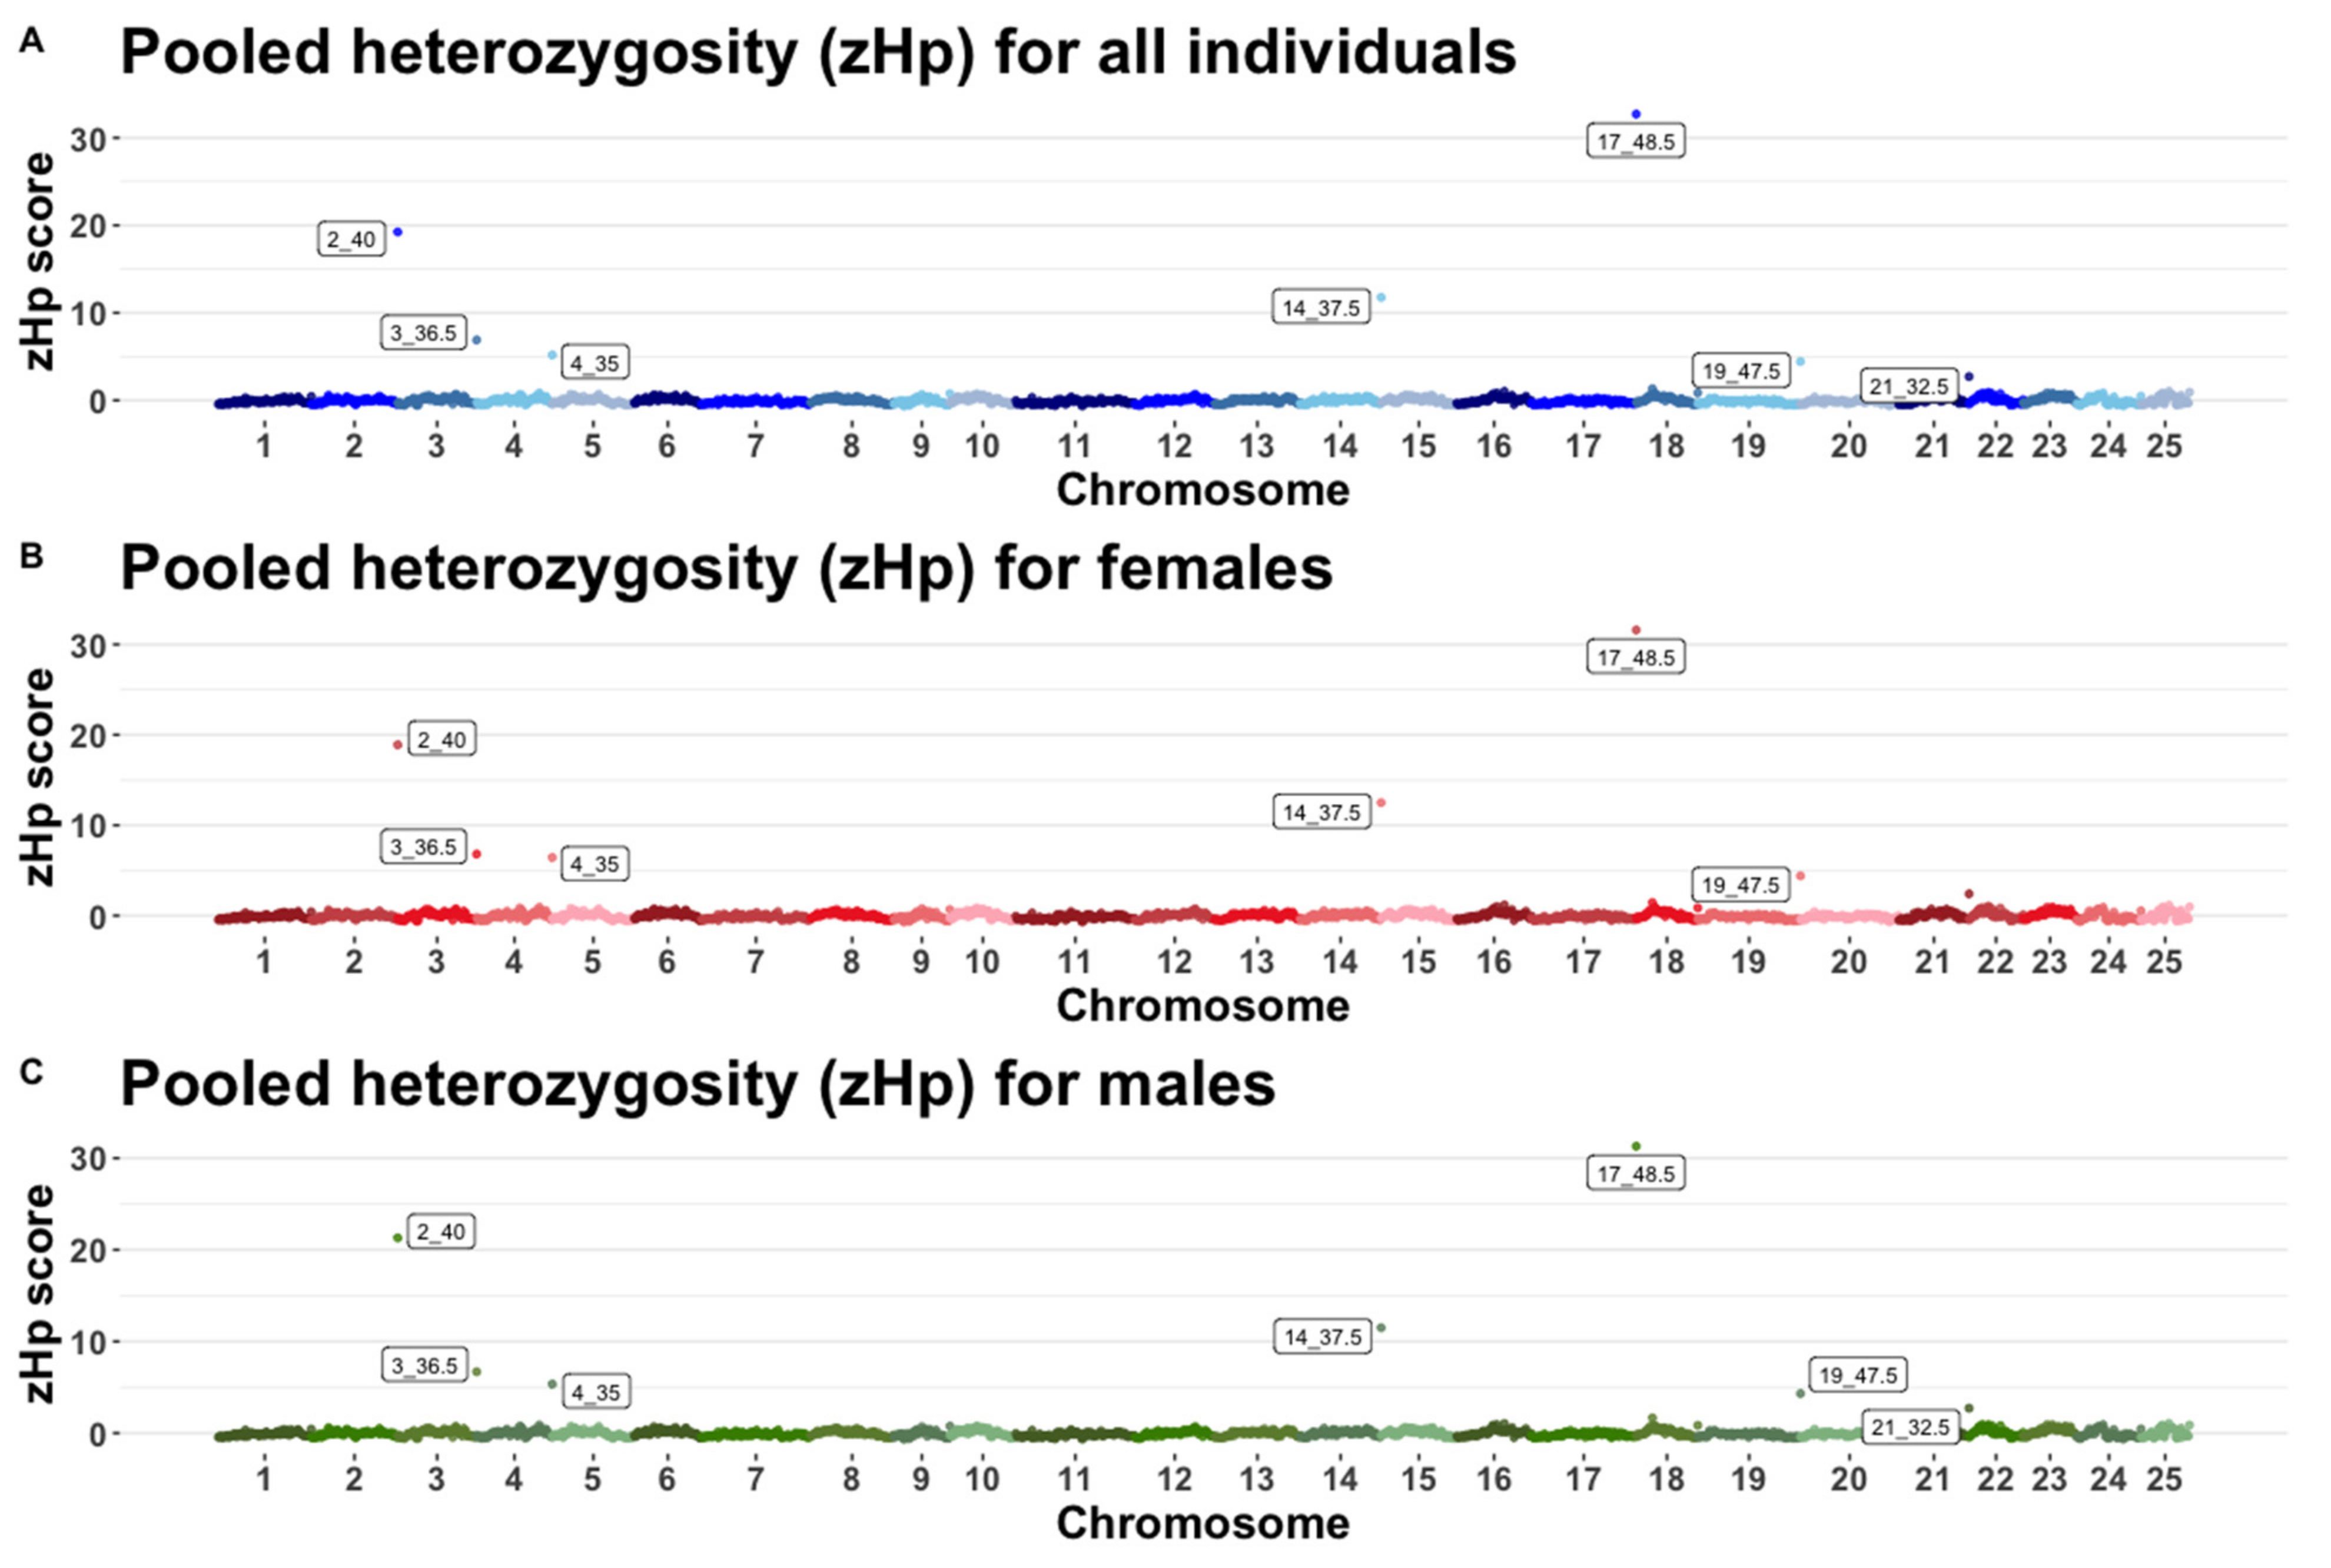
| Chromosome | Megabase 1 | Minor Allele Counts 2 | Major Allele Counts | Hp 3 | ZHp 4 |
|---|---|---|---|---|---|
| 17 | 48.5 | 746 | 1366 | 0.0009 | 32.71 |
| 2 | 40.0 | 826 | 2702 | 0.0006 | 19.24 |
| 14 | 37.5 | 1622 | 3994 | 0.0004 | 11.77 |
| 3 | 36.5 | 2954 | 6190 | 0.0002 | 6.90 |
| 4 | 35.0 | 2605 | 9131 | 0.0002 | 5.19 |
| 19 | 47.5 | 4486 | 8906 | 0.0001 | 4.44 |
| Marker Position in Chromosome 8 (bp) | Female Genotype 1. | Male Phenotype 2. |
|---|---|---|
| 12874481 | GG | CG |
| 12874504 | TT | CT |
| 12874507 | CC | TC |
| 12874514 | CC | TC |
| 12874526 | CC | AC |
| 12874527 | TT | AT |
| 12874533 | CC | TC |
| 12874566 | AA | TA |
| 12874586 | GG | AG |
| 12874588 | CC | TC |
| 12874615 | AA | CA |
| 12874618 | AA | GA |
| 12874754 | CC | GC |
| 12874758 | CC | TC |
| 12874767 | GG | AG |
| 12874789 | TT | CT |
| 12874791 | AA | GA |
| 12874806 | AA | CA |
| 12874809 | TT | CT |
| 12874836 | GG | AG |
| 12874848 | GG | CG |
| 12874854 | CC | TC |
| 12874858 | CC | TC |
| 12874860 | GG | AG |
| 12874865 | TT | CT |
| 12874882 | AA | TA |
| 12874913 | TT | AT |
| 12874914 | GG | AG |
| 12874937 | CC | TC |
| 12875043 | AA | GA |
| 12875046 | CC | AC |
| 12875056 | CC | TC |
| 12875960 | AA | GA |
| 12875988 | TT | GT |
| 12875992 | TT | GT |
| 12876003 | CC | TC |
| 12876008 | CC | TC |
| 12876021 | TT | AT |
| 12876022 | CC | TC |
| 12876024 | CC | AC |
| 12876026 | TT | AT |
| 12876049 | CC | AC |
| 12876056 | TT | AT |
| 12876057 | CC | TC |
| 12876063 | CC | GC |
| 12876066 | AA | TA |
| 12876083 | TT | GT |
| ID | Sex | Lake | # ROH 1 | Total Kb | Av. length (Kb) 2 | Froh |
|---|---|---|---|---|---|---|
| S1 | Female | Okoboji | 0 | 0.00 | 0.00 | 0.00 |
| S2 | Female | Okoboji | 2 | 12,622.20 | 6311.08 | 0.01 |
| S3 | Female | Okoboji | 3 | 23,042.30 | 7680.75 | 0.03 |
| S4 | Male | Okoboji | 2 | 12,730.70 | 6365.36 | 0.01 |
| S5 | Male | Okoboji | 2 | 15,358.40 | 7679.21 | 0.02 |
| S6 | Male | Okoboji | 4 | 24,561.20 | 6140.30 | 0.03 |
| S7 | Female | Big Spirit | 5 | 36,351.40 | 7270.28 | 0.04 |
| S8 | Female | Big Spirit | 5 | 36,499.60 | 7299.91 | 0.04 |
| S9 | Female | Big Spirit | 7 | 50,042.80 | 7148.97 | 0.05 |
| S10 | Male | Big Spirit | 4 | 31,859.10 | 7964.77 | 0.03 |
| S11 | Male | Big Spirit | 3 | 21,129.30 | 7043.11 | 0.02 |
| S12 | Male | Big Spirit | 5 | 36,699.20 | 7339.84 | 0.04 |
| Canada average 3 | -- | -- | 46 | 294,087.37 | 6446.51 | 0.32 |
Publisher’s Note: MDPI stays neutral with regard to jurisdictional claims in published maps and institutional affiliations. |
© 2021 by the authors. Licensee MDPI, Basel, Switzerland. This article is an open access article distributed under the terms and conditions of the Creative Commons Attribution (CC BY) license (https://creativecommons.org/licenses/by/4.0/).
Share and Cite
Chinchilla-Vargas, J.; Meerbeek, J.R.; Rothschild, M.F.; Bertolini, F. Signatures of Selection and Genomic Diversity of Muskellunge (Esox masquinongy) from Two Populations in North America. Genes 2021, 12, 1021. https://doi.org/10.3390/genes12071021
Chinchilla-Vargas J, Meerbeek JR, Rothschild MF, Bertolini F. Signatures of Selection and Genomic Diversity of Muskellunge (Esox masquinongy) from Two Populations in North America. Genes. 2021; 12(7):1021. https://doi.org/10.3390/genes12071021
Chicago/Turabian StyleChinchilla-Vargas, Josue, Jonathan R. Meerbeek, Max F. Rothschild, and Francesca Bertolini. 2021. "Signatures of Selection and Genomic Diversity of Muskellunge (Esox masquinongy) from Two Populations in North America" Genes 12, no. 7: 1021. https://doi.org/10.3390/genes12071021
APA StyleChinchilla-Vargas, J., Meerbeek, J. R., Rothschild, M. F., & Bertolini, F. (2021). Signatures of Selection and Genomic Diversity of Muskellunge (Esox masquinongy) from Two Populations in North America. Genes, 12(7), 1021. https://doi.org/10.3390/genes12071021