Abstract
Several studies have linked disruptions of protein stability and its normal functions to disease. Therefore, during the last few decades, many tools have been developed to predict the free energy changes upon protein residue variations. Most of these methods require both sequence and structure information to obtain reliable predictions. However, the lower number of protein structures available with respect to their sequences, due to experimental issues, drastically limits the application of these tools. In addition, current methodologies ignore the antisymmetric property characterizing the thermodynamics of the protein stability: a variation from wild-type to a mutated form of the protein structure () and its reverse process () must have opposite values of the free energy difference (). Here we propose ACDC-NN-Seq, a deep neural network system that exploits the sequence information and is able to incorporate into its architecture the antisymmetry property. To our knowledge, this is the first convolutional neural network to predict protein stability changes relying solely on the protein sequence. We show that ACDC-NN-Seq compares favorably with the existing sequence-based methods.
1. Introduction
Predicting protein stability changes upon genetic variations is still an open challenge. It is essential to understand the impact of the alterations in the amino acid sequence, mainly due to non-synonymous (or missense) DNA variations leading to the disruption or the enhancement of the protein activity, on human health and disease [1,2,3,4]. In particular, protein stability perturbations have already been associated to pathogenic missense variants [5] and they were shown to contribute to the loss of function in haploinsufficient genes [6].
The protein stability changes upon variations of the amino acid sequence is usually expressed as the Gibbs free energy of unfolding (), which is defined as the difference between the energy of the mutated structure of the protein and its wild-type form (). Thermodynamics imposes an antisymmetry relationship on that can be summarized as follows: given the wild-type (W) and mutated (M) protein structures, differing by one residue in position X, the quantity represents the change in the protein stability caused by the amino acid substitution . Similarly, given the symmetry between the two molecular systems M and W, for the reverse variation the corresponding change in Gibbs free energy has the opposite sign:
Since experimental measurement of is a time-consuming and complex task, during the last decades several computational tools have been developed to predict values. Some methods are structure-based, requiring the knowledge of the protein tertiary structure [7,8,9,10,11,12], others are sequence-based, either relying only on protein sequences [13,14,15] or optionally taking advantage of the protein structure when available [16,17]. However, most of these methods violate the antisymmetry property and suffer from high biases in predicting reverse variations [10,18,19,20,21,22,23]. To address this problem we recently introduced ACDC-NN, a novel structure-based method that satisfies the physical property of antisymmetry, while reaching comparable performance to the state-of-the-art methods [24]. However, the experimental structure determination and characterization of protein thermodynamical features are still limited [18], while a dramatic increase in protein sequence databases has occurred as genomic and metagenomic sequencing efforts have expanded in the last years. The latest release of UniProtKB/TrEMBL protein database contains 214,406,399 sequence entries in all, including 175,817 human proteins, while the Protein Data Bank contains 177,655 entries, 52,485 of them human. Hence, computational approaches able to predict the impact of genetic variations on the protein stability using only sequence information are needed. To this aim, we created ACDC-NN-Seq, a sequence-based version of ACDC-NN that, like its predecessor, achieves accurate predictions satisfying the antisymmetry property, without the need for tertiary protein structures. Here we show that ACDC-NN-Seq compares well with both sequence-based and structure-based methods. We tested the antisymmetry of the predictions on an unbiased dataset and the accuracy on three clinically relevant proteins, avoiding overfitting by filtering out sequence similarities greater than 25%.
2. Materials and Methods
2.1. Datasets and Cross-Validation
Since the application of a deep learning technique requires a large amount of data to achieve the best performance, we pre-trained ACDC-NN-Seq using the predictions of another method, DDGun3D, which has shown to achieve antisymmetry with good performance. DDGun3D was not trained on experimental data, but it is based on evolutionary information and statistical potentials [14]. The pre-training phase was performed on an artificial set of variants created from the Ivankov dataset [21], that we named IvankovDDGun. The values for this dataset were calculated using DDGun3D and the obtained scores were learnt by ACDC-NN-Seq.
For training/testing the network we considered the observed experimental variants reported by some of the most widely used datasets extracted from Protherm [25] database, already cleaned for redundancies and inaccuracies that are known to affect this database, which are: S2648 [26] and Varibench [27]. The ACDC-NN-Seq performance was tested on the following datsets: Ssym [26], p53 [28], myoglobin [29] and frataxin mutants from the CAGI5 challenge [30]. The datasets are summarized in Table 1 and a complete description can be found in our previous study [24].

Table 1.
Brief description of the datasets used. The table reports the number of variants available on each dataset, their usage in this study and whether or not the experimental values are available. DDGun3D was used for the estimation of s when they are not available.
Since these datasets often contain proteins with a high degree of sequence similarity between them, we avoided the related overfitting issues by filtering out similarities above 25%, as done in ACDC-NN; we generated cross-validation folds with blastclust algorithm [31] to create clusters of protein with sequence identity lower than 25% (command blasclust -i infile.fasta -o out.custers -p T -L 0.5 -b F -S 25).
2.2. Sequence Profiles
ACDC-NN-Seq uses the evolutionary information derived from multiple sequence alignments. Through the alignment it is possible to obtain a profile, i.e., an N × 20 matrix, where each entry Prof(i,j) corresponds to the frequency of the j-th residue in the i-th sequence position. N represents the protein length and 20 are the different aminoacids residues. Multiple sequence alignments were computed using the Uniprot database (release 2016) by the hhblits tool [32] with default parameters.
2.3. ACDC-NN-Seq Architecture
The ACDC-NN-Seq architecture is the sequence-based counterpart of the 3D version, already published [24]. Here, we report only the relevant points, leaving out some mathematical details.
ACDC-NN-Seq is an Antisymmetric Convolutional Differential Concatenated Neural Network (ACDC-NN) that takes as inputs both direct and reverse variations, processes them by convolution operations and then uses the extracted features as input for two siamese neural networks [33,34]. Specifically, each of the two ACDC-NN-Seq inputs consists of 160 elements to code variation and sequence evolutionary information:
- Variation (V): 20 features (one for each amino acid) coding for the variation by setting all the entries to 0 with the exception of the wild-type and the variant residue positions set to and 1, respectively. This input corresponds to a one-dimensional matrix ;
- Sequence (S or 1D-input): 140 features representing protein profile information of the variation neighbourhood. Considering i as the variant position in the sequence, we used a window of 3 residues, i.e., , so to obtain elements, with the profile information of these 7 positions. This input then corresponds to a sequence of 7 vectors taken from the protein profile.
A 2D Convolutional layer was applied on the S matrix using a kernel equal to and stride (reported as Keras-style parameters [35]) and generating a filter matrix . After the convolution, a dot product was performed between the variant vector V and the resulting 2D convolution matrix, obtaining 7 processed features, computed for both the direct variation and its reverse. These features were then concatenated with the variant vector V and used as input to a Differential Siamese Networks [33,34]. Finally, their outputs were combined in two Lambda layers of “difference/2” and average. To incorporate the antisymmetric property into the network structure, we designed a specific loss function that minimizes both the absolute value of the average output and the distance between the difference output and the true values. The ACDC-NN-Seq architecture is displayed in Figure 1 and Figure 2.
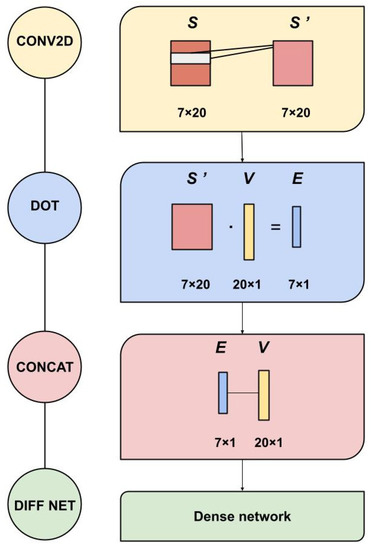
Figure 1.
Constituent modules of ACDC-NN-Seq. CONV2D: a 2D-convolution operation applied to S (1D inputs) with 20 filters with kernel and stride ; DOT: dot product is applied to S’ processed information with the variation encoding vector V; CONCAT: all the 27 features are concatenated and used as input in a Dense Network (DIFF NET).
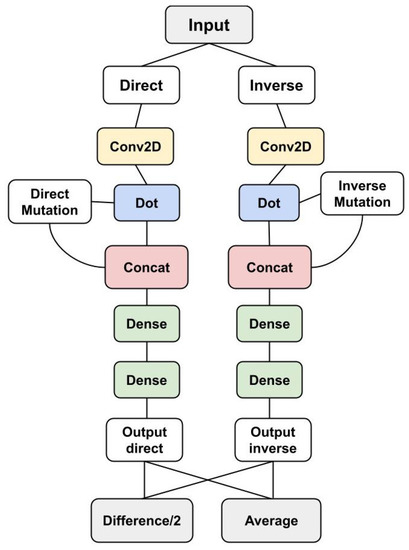
Figure 2.
Complete ACDC-NN-Seq architecture. The module displayed in Figure 1 is used for both direct and reverse variations. Given a variation, we provide to the network its coding to the left, and the coding to the reverse variation to the right. A final layer takes the average and the difference between the two outputs. The difference computes /2, which in case of perfect antisymmetry is exactly equal to . The average computes /2, which in case of perfect antisymmetry is equal to 0. The ACDC-NN-Seq outputs are estimations of the target learned during the training phase. The two Siamese networks have shared weights, both in the convolutional and the dense parts of the network.
The choice of an input window of 7 residues, three for each side of the position of interest, was made to learn the DDGun3D mapping (in the pre-training phase) since we adopted the same DDGun3D sequence neighborhood. Although we experimented with some other input window sizes, there was not much difference up to 11 residues, where we found a performance decrease.
2.4. Pre-Training Phase
Due to the lack of experimental data to train a network from scratch, we first pre-trained the model on an artificial dataset and then performed transfer learning on real datasets. The pre-training phase was performed on the unlabeled artificial dataset IvankovDDGun, which includes all the possible direct and reverse variations in every sequence position. We chose to perform the predictions on the IvankovDDGun dataset with a 3D method to internally encode 3D information from the sequence; DDGun3D was selected among the other predictors for its near-perfect antisymmetry. The training, validation and test sets used by DDGun3D include 400,000, 100,000 and 100,000 protein variants, respectively. The Differential Siamese Network consists of two hidden layers with 128 and 64 units (complete description in Table 2).
Table 2.
The final architectures of the Differential Siamese Network before and after transfer learning. The optimal parameters were selected on a validation set without intersections with the training set.
2.5. Transfer Learning on Experimental Data
After the pre-training phase, we applied transfer learning using S2648 [26] and Varibench [27] datasets of experimental values, splitting the data and removing the sequence similarity among training, validation and test sets. Specifically, the weights of the Convolutional layer were fixed while the Differential Siamese network part was re-trained selecting the best parameters. To increase the size of the training set, the unlabeled Ivankov2000 dataset with DDGun3D predictions was also considered. The complete description of the optimal sets of parameters is shown in Table 2.
2.6. Performance Evaluation
Pearson correlation (indicated by r) and root mean square error (RMSE) were estimated between the predicted and observed values to evaluate the performance of the methods. Two scoring indices were adopted to assess the antisymmetric property of predictors: and . is the Pearson correlation coefficient between the direct and the corresponding reverse variations:
where is the covariance and is the standard deviation. is the average bias quantifying the prediction shift:
A perfectly antisymmetric method should have equal to −1 and equal to 0.
3. Results
3.1. Learning 3D Properties on Artificial Data
A proper training of a neural network requires a huge amount of experimental values that are not currently available; we addressed this problem by performing a pre-training phase on the artificial dataset IvankovDDGun and then applying a transfer learning on the experimental datasets S2648 and Varibench, as described in the Materials and Methods section.
In Table 3, we show the results on the IvankovDDGun test set. It is worth noticing that the DDGun3D values were computed using the protein structures, while the ACDC-NN-Seq predictions are only based on sequence information. Thus, this approach obtained a sequence-based method capable of internally encoding the 3D statistical potentials that maintain the antisymmetric property.
Table 3.
Results on the IvankovDDGun test set: The performance of ACDC-NN-Seq in learning DDGun3D was measured in terms of Pearson correlation coefficient (r) and root mean square error (RMSE). The antisymmetry property was assessed in terms of Pearson correlation coefficient () and the bias () between the predicted values. RMSE and are expressed in kcal/mol. IvankovDDGun (Test) is the test set extracted from the IvankovDDGun artificial dataset.
3.2. Prediction of the Experimental Values
After training ACDC-NN-Seq on the IvankovDDGun set, we fine-tuned the network by retraining the last layers on the experimentally-derived values from S2648 and Varibench through 10-fold cross-validation. In Figure 3 we showed the experimental values versus the ACDC-NN-Seq predicted ones on Varibench and S2648 datasets both combined and alone, and for both direct and reverse variations. These results were obtained in cross-validation as explained in Benevenuta et al. [24]. ADCD-NN-Seq achieved both consistent performance with the state-of-the-art methods (measured in terms of r and ) and perfect antisymmetry ( and ).
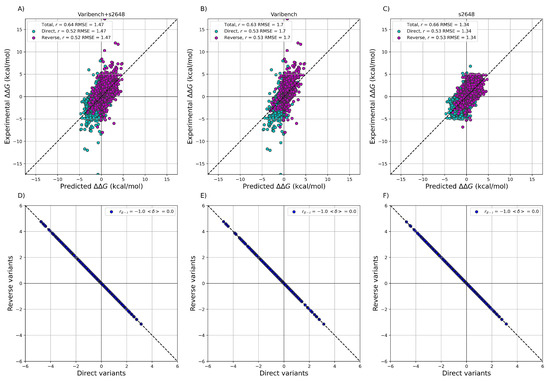
Figure 3.
Performance of ACDC-NN-Seq on predicting for the direct and reverse variations on: (A) Varibench and S2648 (, kcal/mol); (B) Varibench alone (, kcal/mol); (C) S2648 alone (, kcal/mol). Direct versus reverse values of (D) Varibench and S2648 variations, (E) Varibench variations alone, (F) S2648 variations alone, predicted by ACDC-NN-Seq, with a Pearson correlation of and kcal/mol for all three datasets. All the predictions reported in this figure were obtained through a 10-fold cross-validation with sequence identity <25% among all folds.
We also compared the predictions of both ACDC-NN-Seq and DDGun with their corresponding stucture-based versions, i.e., ACDC-NN and DDGun3D. Figure 4 reports the comparison performance (in cross-validation for ACDC-NN and ACDC-NN-Seq) on the Ssym dataset [10], which was specifically built to assess the antisymmetry and it contains experimental values for direct and reverse variants. The performance of ACDC-NN-Seq is balanced and close to those obtained using the protein structures. This makes ADCD-NN-Seq ideal for genome variant analyses.
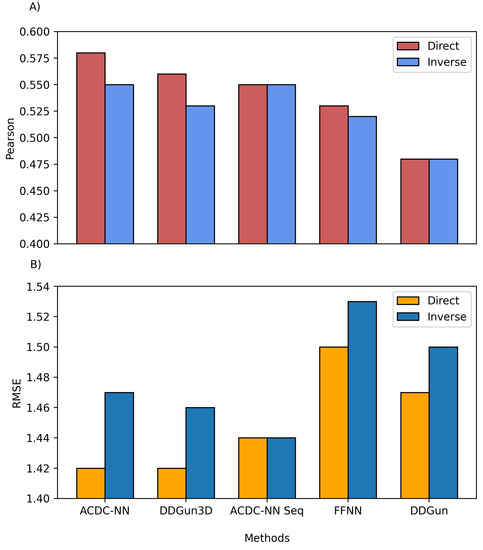
Figure 4.
Comparison between the structure and sequence-based versions of ACDC-NN, DDGun and a Feed-Forward Neural Network (FFNN) on the Ssym dataset. (A) Pearson correlation coefficient (r), where higher is better and (B) root mean squared error (RMSE), where lower is better.
In order to evaluate the effect of the neural network design, we compared ACDC-NN-Seq with a feed-forward neural network (FFNN) trained and optimized in the same conditions. The structure of the optimized FFNN consists of an input layer of 140 input neurons (window of 7 residues coded with 20-element vector profiles), a sequence of hidden layers consisting of (128,64,32,16) neurons, and an output neuron coding for the value. Thus the main difference is due to the anty-symmetric construction of ACDC-NN-Seq (FFNN Figure 4). FFNN performance is quite good, and the neural networks learned most of the antisymmetry from the data provided (direct and reverse variations). However, ACDC-NN-Seq outperforms FFNN both in the prediction task and antisymmetry reconstructions.
Regarding the results presented in Figure 3 and Figure 4, it is worth noticing that the maximum achievable Pearson’s correlation is not necessarily equal to 1, as usually thought. It may be far lower depending on the experimental uncertainty and the distributions [36,37]. In particular, when considering the different experiments on the same variants included in the Protherm database or in manually-cleaned datasets, the expected Pearson upper bound is in the range of 0.70–0.85 [36]. Significantly higher Pearson correlations can be obtained in small sets or might be indicative of overfitting issues [36].
3.3. Comparison with Other Sequence-Based Machine-Learning Methods
As mentioned above, few available methods can predict the effect of the variants on the protein stability starting from sequence only. We therefore compared ACDC-NN-Seq on three datasets with the following sequence-based methods: DDGun [14], INPS [13], I-Mutant2.0 [16], MUpro [17] and the recent SAAFEC-SEQ [15].
The obtained results are reported in Table 4; ACDC-NN-Seq predicts equally well both direct and reverse variants with nearly perfect antisymmetry (). ACDC-NN-Seq performance is higher than the one obtained by INPS, which is the only machine-learning method proven to be antisymmetric in past tests [22,38].
Table 4.
Results on Ssym: The performance on both direct and reverse variants was measured in terms of Pearson correlation coefficient (r) and root mean square error (RMSE). The antisymmetry was assessed using the correlation coefficient (2) and the bias (3). RMSE and are expressed in kcal/mol. The results of INPS were taken from Montanucci et al. [14] and Fariselli et al. [13]; the results of SAAFEC-SEQ and I-mutant2.0 were obtained using their stand-alone code, those of MUpro were obtained using the webserver available. Only Inps-NoSeqId and ACDN-NN-Seq were trained in cross-validation addressing the sequence identity issue (sequence similarity <25%).
I-Mutant2.0 and MUpro do not respect the antisymmetry property since this issue was not properly addressed or known at the time the two models were created. However, it must be noted that both I-Mutant2.0 and MUpro do not use evolutionary information making them extremely fast predictors, as compared to ACDC-NN-Seq, which requires a multiple sequence alignment.
Another significant point is that, looking at all the methods reported in Table 4, Table 5 and Table 6, only Inps-NoSeqId and all the versions of ACDN-NN were trained in cross-validation removing the sequence identity (i.e., sequence similarity <25%).
Table 5.
Results on myoglobin: Comparison on myoglobin. The INPS, SAAFEC-SEQ and I-mutant2.0 results were obtained using their stand alone code, those of MUpro were obtained using the webserver available.
Table 6.
Results on p53: Comparison on p53. The INPS, SAAFEC-SEQ and I-mutant2.0 results were obtained using their stand alone code, those of MUpro were obtained using the webserver available.
3.4. Frataxin CAGI 5 Challenge
The Critical Assessment of Genome Interpretation (CAGI) is a community experiment aimed at fairly assessing the computational methods for genome interpretation [30]. In CAGI 5, data providers measured unfolding free energy of a set of variants with far-UV circular dichroism and intrinsic fluorescence spectra on Frataxin (FXN), a highly conserved protein fundamental for the cellular iron homeostasis in both prokaryotes and eukaryotes. These measurements were used to calculate the change in unfolding free energy between the variant and wild-type proteins at zero denaturant concentrations (). In addition, the experimental dataset [39], including eight amino acid substitutions, was used to evaluate the performance of the web-only tools, based on protein structure information, for predicting the value of the associated [40]. Here we compare the available machine-learning sequence-based predictors on the dataset (Table 7), showing the consistency of the prediction performance of ACDC-NN-Seq.
Table 7.
Results on Frataxin Challenge in CAGI5 [30]. The INPS, SAAFEC-SEQ and I-mutant2.0 results were obtained using their stand alone code, those of MUpro were obtained using the webserver available.
4. Discussion
Few sequence-based methods are currently available to predict the and only some of them satisfy the principle of antisymmetry imposed by thermodynamics. Given the huge amount of sequencing data currently available and their possible applications, we have proposed a reliable sequence-based predictor that could be applied to a wide range of biological problems, even when the crystallized protein structures are not available. Moreover, ACDC-NN-Seq addresses the antisymmetry physical property by exploiting a specifically-designed loss function which minimizes the absolute difference between the direct and reverse predictions [24]. We showed that ACDC-NN-Seq compares well with with the other state-of-the-art sequence-based machine-learning predictors and with some of the structure-based ones, as shown in Table 4, Table 5, Table 6 and Table 7. To avoid overfitting issues due to sequence similarity, the correct procedure to assess the performance of a method on any dataset should use variants in proteins which are not similar to those used for the training [18]. Specifically, this means to remove proteins with a sequence identity >25% between the training and testing data. In this study, we followed this procedure and we divided all the datasets used into 10 non-similar subsets during cross-validation. In conclusion, ACDC-NN-Seq is a sequence-based tool able to show comparable or better performance with respect to the state-of-the-art methods while preserving perfect thermodynamic antisymmetry. In future studies, this method can be extended to predict the s of multiple site variations.
Author Contributions
Conceptualization, P.F. and T.S.; methodology, P.F., C.P., S.B. and V.R.; software, G.B., S.B., C.P., V.R. and E.C.; formal analysis and investigation, V.R., S.B. and C.P. Writing: original draft preparation, C.P., S.B. and V.R.; Writing: Review and editing, P.F., T.S., G.B. and V.R.; visualization, C.P. and S.B.; supervision, P.F.; funding acquisition, P.F. All authors have read and agreed to the published version of the manuscript.
Funding
This research received no external funding.
Institutional Review Board Statement
Not applicable.
Informed Consent Statement
Not applicable.
Data Availability Statement
The data presented in this study and the code to reproduce the results are freely available in https://github.com/compbiomed-unito/acdc-nn (accessed on 11 June 2021).
Acknowledgments
We thank the Italian Ministry for Education, University and Research for the program “Dipartimenti di Eccellenza 20182022D15D18000410001” and for MIUR-PRIN-201744NR8S.
Conflicts of Interest
The authors declare no conflict of interest.
Abbreviations
The following abbreviations are used in this manuscript:
| ACDC-NN | Antisymmetric Convolutional Differential Concatenated - Neural Network |
| NGS | Next Generation Sequencing |
References
- Hartl, F.U. Protein misfolding diseases. Annu. Rev. Biochem. 2017, 86, 21–26. [Google Scholar] [CrossRef]
- Martelli, P.L.; Fariselli, P.; Savojardo, C.; Babbi, G.; Aggazio, F.; Casadio, R. Large scale analysis of protein stability in OMIM disease related human protein variants. BMC Genom. 2016, 17, 239–247. [Google Scholar] [CrossRef]
- Cheng, T.M.; Lu, Y.E.; Vendruscolo, M.; Blundell, T.L. Prediction by graph theoretic measures of structural effects in proteins arising from non-synonymous single nucleotide polymorphisms. PLoS Comput. Biol. 2008, 4, e1000135. [Google Scholar] [CrossRef]
- Compiani, M.; Capriotti, E. Computational and theoretical methods for protein folding. Biochemistry 2013, 52, 8601–8624. [Google Scholar] [CrossRef]
- Casadio, R.; Vassura, M.; Tiwari, S.; Fariselli, P.; Luigi Martelli, P. Correlating disease-related mutations to their effect on protein stability: A large-scale analysis of the human proteome. Hum. Mutat. 2011, 32, 1161–1170. [Google Scholar] [CrossRef]
- Birolo, G.; Benevenuta, S.; Fariselli, P.; Capriotti, E.; Giorgio, E.; Sanavia, T. Protein Stability Perturbation Contributes to the Loss of Function in Haploinsufficient Genes. Front. Mol. Biosci. 2021, 8, 10. [Google Scholar] [CrossRef]
- Schymkowitz, J.; Borg, J.; Stricher, F.; Nys, R.; Rousseau, F.; Serrano, L. The FoldX web server: An online force field. Nucleic Acids Res. 2005, 33, W382–W388. [Google Scholar] [CrossRef]
- Wainreb, G.; Wolf, L.; Ashkenazy, H.; Dehouck, Y.; Ben-Tal, N. Protein stability: A single recorded mutation aids in predicting the effects of other mutations in the same amino acid site. Bioinformatics 2011, 27, 3286–3292. [Google Scholar] [CrossRef] [PubMed]
- Parthiban, V.; Gromiha, M.M.; Schomburg, D. CUPSAT: Prediction of protein stability upon point mutations. Nucleic Acids Res. 2006, 34, W239–W242. [Google Scholar] [CrossRef] [PubMed]
- Pucci, F.; Bernaerts, K.V.; Kwasigroch, J.M.; Rooman, M. Quantification of biases in predictions of protein stability changes upon mutations. Bioinformatics 2018, 34, 3659–3665. [Google Scholar] [CrossRef]
- Li, B.; Yang, Y.T.; Capra, J.A.; Gerstein, M.B. Predicting changes in protein thermodynamic stability upon point mutation with deep 3D convolutional neural networks. PLOS Comput. Biol. 2020, 16, e1008291. [Google Scholar] [CrossRef]
- Kellogg, E.H.; Leaver-Fay, A.; Baker, D. Role of conformational sampling in computing mutation-induced changes in protein structure and stability. Proteins Struct. Funct. Bioinform. 2011, 79, 830–838. [Google Scholar] [CrossRef]
- Fariselli, P.; Martelli, P.L.; Savojardo, C.; Casadio, R. INPS: Predicting the impact of non-synonymous variations on protein stability from sequence. Bioinformatics 2015, 31, 2816–2821. [Google Scholar] [CrossRef] [PubMed]
- Montanucci, L.; Capriotti, E.; Frank, Y.; Ben-Tal, N.; Fariselli, P. DDGun: An untrained method for the prediction of protein stability changes upon single and multiple point variations. BMC Bioinform. 2019, 20, 335. [Google Scholar] [CrossRef]
- Li, G.; Panday, S.K.; Alexov, E. SAAFEC-SEQ: A Sequence-Based Method for Predicting the Effect of Single Point Mutations on Protein Thermodynamic Stability. Int. J. Mol. Sci. 2021, 22, 606. [Google Scholar] [CrossRef]
- Capriotti, E.; Fariselli, P.; Casadio, R. I-Mutant2. 0: Predicting stability changes upon mutation from the protein sequence or structure. Nucleic Acids Res. 2005, 33, W306–W310. [Google Scholar] [CrossRef]
- Cheng, J.; Randall, A.; Baldi, P. Prediction of protein stability changes for single-site mutations using support vector machines. Proteins Struct. Funct. Bioinform. 2006, 62, 1125–1132. [Google Scholar] [CrossRef]
- Sanavia, T.; Birolo, G.; Montanucci, L.; Turina, P.; Capriotti, E.; Fariselli, P. Limitations and challenges in protein stability prediction upon genome variations: Towards future applications in precision medicine. Comput. Struct. Biotechnol. J. 2020. [Google Scholar] [CrossRef]
- Savojardo, C.; Fariselli, P.; Martelli, P.L.; Casadio, R. INPS-MD: A web server to predict stability of protein variants from sequence and structure. Bioinformatics 2016, 32, 2542–2544. [Google Scholar] [CrossRef]
- Fang, J. A critical review of five machine learning-based algorithms for predicting protein stability changes upon mutation. Brief. Bioinform. 2020, 21, 1285–1292. [Google Scholar] [CrossRef]
- Usmanova, D.R.; Bogatyreva, N.S.; Ariño Bernad, J.; Eremina, A.A.; Gorshkova, A.A.; Kanevskiy, G.M.; Lonishin, L.R.; Meister, A.V.; Yakupova, A.G.; Kondrashov, F.A.; et al. Self-consistency test reveals systematic bias in programs for prediction change of stability upon mutation. Bioinformatics 2018, 34, 3653–3658. [Google Scholar] [CrossRef] [PubMed]
- Montanucci, L.; Savojardo, C.; Martelli, P.L.; Casadio, R.; Fariselli, P. On the biases in predictions of protein stability changes upon variations: The INPS test case. Bioinformatics 2019, 35, 2525–2527. [Google Scholar] [CrossRef] [PubMed]
- Capriotti, E.; Fariselli, P.; Rossi, I.; Casadio, R. A three-state prediction of single point mutations on protein stability changes. BMC Bioinform. 2008, 9, 1–9. [Google Scholar] [CrossRef]
- Benevenuta, S.; Pancotti, C.; Fariselli, P.; Birolo, G.; Sanavia, T. An antisymmetric neural network to predict free energy changes in protein variants. J. Phys. D Appl. Phys. 2021, 54, 245403. [Google Scholar] [CrossRef]
- Kumar, M.D.; Bava, K.A.; Gromiha, M.M.; Prabakaran, P.; Kitajima, K.; Uedaira, H.; Sarai, A. ProTherm and ProNIT: Thermodynamic databases for proteins and protein-nucleic acid interactions. Nucleic Acids Res. 2006, 34, D204–D206. [Google Scholar] [CrossRef]
- Dehouck, Y.; Kwasigroch, J.M.; Gilis, D.; Rooman, M. PoPMuSiC 2.1: A web server for the estimation of protein stability changes upon mutation and sequence optimality. BMC Bioinform. 2011, 12, 1–12. [Google Scholar] [CrossRef]
- Nair, P.S.; Vihinen, M. V ari B ench: A benchmark database for variations. Hum. Mutat. 2013, 34, 42–49. [Google Scholar] [CrossRef]
- Pires, D.E.; Ascher, D.B.; Blundell, T.L. mCSM: Predicting the effects of mutations in proteins using graph-based signatures. Bioinformatics 2014, 30, 335–342. [Google Scholar] [CrossRef] [PubMed]
- Kepp, K.P. Towards a “Golden Standard” for computing globin stability: Stability and structure sensitivity of myoglobin mutants. Biochim. Biophys. Acta 2015, 1854, 1239–1248. [Google Scholar] [CrossRef] [PubMed]
- Andreoletti, G.; Pal, L.R.; Moult, J.; Brenner, S.E. Reports from the fifth edition of CAGI: The Critical Assessment of Genome Interpretation. Hum. Mutat. 2019, 40, 1197–1201. [Google Scholar] [CrossRef] [PubMed]
- Aggarwal, A. BlastClust. 2013. Available online: http://ftp.gen-info.osaka-u.ac.jp/biosoft/blast/executables/release/2.2.14/ (accessed on 10 June 2021).
- Zimmermann, L.; Stephens, A.; Nam, S.Z.; Rau, D.; Kübler, J.; Lozajic, M.; Gabler, F.; Söding, J.; Lupas, A.N.; Alva, V. A Completely Reimplemented MPI Bioinformatics Toolkit with a New HHpred Server at its Core. J. Mol. Biol. 2018, 430, 2237–2243. [Google Scholar] [CrossRef]
- Bromley, J.; Guyon, I.; LeCun, Y.; Säckinger, E.; Shah, R. Signature verification using a “siamese” time delay neural network. Adv. Neural Inf. Process. Syst. 1993, 6, 737–744. [Google Scholar] [CrossRef]
- Chopra, S.; Hadsell, R.; LeCun, Y. Learning a similarity metric discriminatively, with application to face verification. In Proceedings of the 2005 IEEE Computer Society Conference on Computer Vision and Pattern Recognition (CVPR’05), San Diego, CA, USA, 20–25 June 2005; Volume 1, pp. 539–546. [Google Scholar]
- Chollet, F. Keras. 2015. Available online: https://keras.io (accessed on 10 June 2021).
- Montanucci, L.; Martelli, P.L.; Ben-Tal, N.; Fariselli, P. A natural upper bound to the accuracy of predicting protein stability changes upon mutations. Bioinformatics 2019, 35, 1513–1517. [Google Scholar] [CrossRef] [PubMed]
- Benevenuta, S.; Fariselli, P. On the Upper Bounds of the Real-Valued Predictions. Bioinform. Biol. Insights 2019, 13, 1177932219871263. [Google Scholar] [CrossRef] [PubMed]
- Savojardo, C.; Martelli, P.L.; Casadio, R.; Fariselli, P. On the critical review of five machine learning-based algorithms for predicting protein stability changes upon mutation. Brief. Bioinform. 2019, 21, 1285–1292. [Google Scholar] [CrossRef] [PubMed]
- Petrosino, M.; Pasquo, A.; Novak, L.; Toto, A.; Gianni, S.; Mantuano, E.; Veneziano, L.; Minicozzi, V.; Pastore, A.; Puglisi, R.; et al. Characterization of human frataxin missense variants in cancer tissues. Hum. Mutat. 2019, 40, 1400–1413. [Google Scholar] [CrossRef]
- Savojardo, C.; Petrosino, M.; Babbi, G.; Bovo, S.; Corbi-Verge, C.; Casadio, R.; Fariselli, P.; Folkman, L.; Garg, A.; Karimi, M.; et al. Evaluating the predictions of the protein stability change upon single amino acid substitutions for the FXN CAGI5 challenge. Hum. Mutat. 2019, 40, 1392–1399. [Google Scholar] [CrossRef] [PubMed]
Publisher’s Note: MDPI stays neutral with regard to jurisdictional claims in published maps and institutional affiliations. |
© 2021 by the authors. Licensee MDPI, Basel, Switzerland. This article is an open access article distributed under the terms and conditions of the Creative Commons Attribution (CC BY) license (https://creativecommons.org/licenses/by/4.0/).