Article

Genome Size, Chromosome Number and Morphological Data Reveal Unexpected Infraspecific Variability in Festuca (Poaceae)

1
Department of Botany, Ecology and Plant Physiology, Rabanales Campus, University of Cordoba, 14071 Cordoba, Spain
2
Centre for Functional Ecology, Department of Life Sciences, University of Coimbra, Calçada Martim de Freitas, 3000-456 Coimbra, Portugal
3
Botanical Garden of the University of Coimbra, Calçada Martim de Freitas, 3000-456 Coimbra, Portugal
*
Author to whom correspondence should be addressed.
Genes 2021, 12(6), 906; https://doi.org/10.3390/genes12060906
Submission received: 12 May 2021 / Revised: 8 June 2021 / Accepted: 9 June 2021 / Published: 11 June 2021

Abstract

:
Polyploidy has played an important evolutionary role in the genus Festuca (Poaceae), and several ploidy levels (ranging from 2n = 2x = 14 to 2n = 12x = 84) have been detected to date. This study aimed to estimate the genome size and ploidy level of two subspecies belonging to the F. yvesii polyploid complex by flow cytometry and chromosome counting. The phenotypic variation of the cytotypes was also explored, based on herbarium material. The genome size of F. yvesii subsp. lagascae has been estimated for the first time. Nuclear 2C DNA content of F. yvesii subsp. summilusitana ranged from 21.44 to 31.91 pg, while that of F. yvesii subsp. lagascae was from 13.60 to 22.31 pg. We report the highest ploidy level detected for Festuca (2n = 14x = 98) and previously unknown cytotypes. A positive correlation between holoploid genome size and chromosome number counts shown herein was confirmed. The morphometric approach showed a slight trend towards an increase in the size of some organs consistent with the variation in the ploidy level. Differences in characters were usually significant only among the most extreme cytotypes of each subspecies, but, even in this case, the high overlapping ranges prevent their distinction.

1. Introduction

Polyploidy, or whole-genome duplication (WGD), has long been recognised as a major force in angiosperm evolution [1]. This phenomenon is known to have potential effects on certain life-history traits involving genome structure, gene expression, biochemistry, reproductive development, ecophysiology, competitive ability, growth rates and phenotype [2,3]. The most visible and widespread immediate effect is undoubtedly the increase in cell size [4]. In this respect, several studies have indicated that the polyploidy can induce detectable morphology variation in both microcharacters (e.g., stomata and pollen size) and the dimensions of vegetative (e.g., culm and leaf lengths) and reproductive organs (spikelet, lemma, anther and seed sizes, among others) or in generative features (e.g., flowers number per spikelet or inflorescences per plant) [5,6,7].
Grasses are one of the best models with which to study polyploidy and its effects on genome evolution, as they are more than 80% polyploid or palepolyploid [8]. Festuca L. is one of the largest genera of the Poaceae family, with more than 500 perennial species distributed mostly in the temperate regions of the world [9,10]. About 70% of the fescue taxa have undergone at least a whole-genome duplication event during their evolutionary history [11]. A wide range of ploidy levels ranging from diploid (2n = 2x = 14) to dodecaploid (2n = 12x = 84), with basic chromosome number x = 7, have been reported to date [11,12]. The taxonomic difficulties of the genus are well known, including many polyploidy groups with hardly distinguishable species.
Festuca yvesii Sennen & Pau (Festuca sect. Festuca) is a highly variable species comprising several cytotypes (Table 1). According to the most recent taxonomic treatment, F. yvesii includes four subspecies widely distributed throughout the Iberian Peninsula [13,14]. The subsp. yvesii (2n = 42, 56) and the subsp. altopyrenaica (Fuente & Ortúñez) Mart.-Sagarra & Devesa (2n = 28) have an eminently Pyrenean distribution, while the subsp. summilusitana (Franco & Rocha Afonso) Mart.-Sagarra & Devesa and the subsp. lagascae (Cebolla & Rivas Ponce) Mart.-Sagarra & Devesa, on which this study focuses, are found in the centre, west and north of the Iberian Peninsula. The subsp. summilusitana (2n = 42, 70, 84) is highly polymorphic, and its taxonomy has changed in recent years [15,16], with this being closely related to the detection of different chromosome numbers (Table 1), type of substrate and its geographical distribution [12,17]. However, Devesa et al. [13] showed that the diagnostic features employed in order to differentiate the segregated entities are highly variable and are blurred when the overall material is analysed, being practically impossible to assign specimens to an entity without knowing other nontaxonomic data. The subsp. lagascae grows in the easternmost part of the Central System and in disjunct populations of northern Spain, and all of them are hexaploids (2n = 42) [17,18]. The octoploid level (2n = 56) has been mentioned exceptionally on the basis of the chromosome counts obtained for the conflictive populations from the Cantabrian Mountains [13,17] (Table 1). This taxon has undergone several changes in its nomenclature, and differs morphologically from the subsp. summilusitana by having smaller sizes in certain characters (culm, lemma and panicle, among others). However, the distinction between both subspecies is sometimes difficult owing to the overlap in the range of diagnostic characters, with some transitional populations [13].
Our understanding of ploidy diversity has greatly improved over the last two decades owing to the usage of flow cytometry (FCM). This valuable method makes it possible to not only estimate the genome size (or the nuclear DNA content) in a large number of individuals and populations quickly and accurately but also infer the ploidy levels, irrespective of the number of chromosomes [21,22]. Moreover, the determination of DNA-ploidy level from herbarium and silica-gel-dried material using flow cytometry has been successful for several species, including some fescues [23,24,25,26]. The use of FCM has uncovered an overlooked heterogeneity of cytotypes at an intraspecific level in many genera of vascular plants [22,27,28,29]. It has, therefore, been used as an exploratory tool in studies focused on resolving or identifying taxonomically challenging plant groups [30,31,32,33,34,35,36,37,38]. Data on the amounts of nuclear DNA in plants are growing rapidly [39]. In the genus Festuca, several works have satisfactorily evaluated the genome size using FCM [12,40,41,42] and have revealed the occurrence of positive correlations between 2C nuclear DNA contents and chromosome number, at least in closely related species [12]. Some recent studies concerning Festuca have also relied on this technique in order to assess whether the size of organs increases with both chromosome number and DNA nuclear content, even within the same species [43,44].
Taking into account the complexity of F. yvesii in terms of the diversity of cytotypes and phenotypic variability, the aims of the present study were: (1) to estimate the genome size of F. yvesii subsp. summilusitana and F. yvesii subsp. lagascae using flow cytometry analysis; (2) to test whether the inferred ploidy levels are correlated with the chromosome counts obtained in this study; (3) to explore the morphological variation of the cytotypes and detect differences between them.

2. Materials and Methods

2.1. Plant Material and Geographical Origin

Individuals of F. yvesii subsp. summilusitana and F. yvesii subsp. lagascae were collected throughout their range (Iberian Peninsula) in order to carry out karyological, genome size and morphological analyses (Figure 1). Field sampling was specifically carried out in several populations from the Sierra da Estrela (S1–S3), the Sierra de Gredos and Candelario (S4–S6), the Sierra de la Demanda and Cebollera (L1–L3), the Sierra de Guadarrama (L4–L7), the Cantabrian Mountains (L8) and in some mountains in the northwest (S7–S9) (Figure 1). The species were identified according to Devesa et al. [13].
Genome size (2C values) and DNA-ploidy levels were estimated by flow cytometry (FCM). A total of 94 individuals from 13 populations were analysed (Figure 1). Fresh leaves were selected from each of the individuals and stored in individual plastic bags at 4 °C for 3–5 days until use. Additionally, seven silica-gel-dried samples obtained from four populations were also analysed as a proxy for the validation of DNA-ploidy levels. With regard to the karyological study, we revisited those conflictive populations in which substantial differences were found between DNA-ploidy level and the number of chromosomes reported in the literature (i.e., populations S4–S6 from the Sierra de Gredos and Candelario and populations L4–L7 from the Sierra de Guadarrama; see Figure 1). The seeds of numerous individuals were collected from these seven selected populations during the fruiting period (late July–August) and stored in paper bags for their later use in chromosome counting and morphometric analyses. More than 200 root tips per population were analysed in order to obtain good metaphases plates. Finally, a total of 135 specimens from these populations were examined to explore the morphological variability between cytotypes. Voucher specimens of the populations studied were deposited in the Herbarium at the University of Cordoba (COFC), Spain.

2.2. Flow Cytometric Analyses

Genome size was quantified following the method described by Galbraith et al. [45]. Nuclei were released by chopping approximately 50 mg of fresh leaf material from each Festuca individual mixed with 50 mg of an internal reference standard, using a razor blade in a Petri dish containing 1 mL of a nuclear isolation buffer (Woody Plant Buffer, WPB [46]). The nuclear suspension was filtered through a 50 µm nylon filter, after which 50 µg/mL of propidium iodide (PI) and 50 µg/mL of RNAse were added. Pisum sativum ‘Ctirad’ (2C = 9.09 pg of DNA [47]) and Vicia faba ‘Inovec’ (2C = 26.90 pg of DNA [48]) were used as the internal reference standard for the F. yvesii subsp. summilusitana and F. yvesii subsp. lagascae samples, respectively.
The samples were analysed using a CyFlow Space flow cytometer (Sysmex-Partec GmbH., Görlitz, Germany; equipped with a 532 nm green solid-state laser). At least 5000 particles were analysed per sample. Only coefficient of variation values (CV) < 5% were accepted for the 2C peaks in fresh samples and up to 8% in dry material. The holoploid genome size (in picograms) was calculated according to the following formula: (sample G1 peak mean/standard G1 peak mean) × 2C DNA content of standard (pg). DNA-ploidy level was inferred by comparing the sample peaks with those of individuals with a known chromosome number and genome size [21].

2.3. Chromosome Counts

Seeds were germinated in Petri dishes on wet filter paper at 20 °C. Seedlings (5–10 days old) were pretreated with 2 mM 8-hydroxyquinoline for 24 h at 4 °C in the dark, fixed in a solution of absolute ethanol and glacial acetic acid (3:1, v/v) for at least 24 h and stored at 4 °C until use. Root tips were hydrolysed for 2 min in 1N HCl at 60 °C, washed with distilled water and then stained with alcoholic acetic carmine for 24–72 h at room temperature. Finally, stained meristems were squashed in 45% acetic acid [49]. Mitotic metaphases were identified and photographed using light microscopy (Leica DM500).

2.4. Morphometric Analyses

Sixteen macrocharacters were chosen and measured when available: culm length, leaf length, leaf diameter, auricle length, spikelet length, number of flowers, upper glume length, lemma length, awn length, anther length, inflorescence length, length of the first node of the inflorescence, number of nodes and branches per inflorescence, first branch length and seed length. Between 2 and 5 measurements were made for each character, with the exception of the seeds. A total of 356 seeds from the populations where the chromosome count was made were measured (35–75 seeds per population). Reproductive and vegetative characters were measured under a 6.3–40× Leica stereomicroscope (model S6 D).

2.5. Statistical Analyses

Descriptive statistics of the genome size estimations were calculated for each taxon (mean, maximum and minimum values and standard deviation). After carrying out a normality test (Shapiro-Wilk test), holoploid genome size differences among populations were analysed using a one-way ANOVA with a post hoc Tukey HSD test (p < 0.05). The linear regression and Spearman rank correlation between the holoploid genome size (2C values) and chromosome number detected here were performed. Summary statistics of the morphological characters studied were also provided in order to explore variability among cytotypes. Differences among ploidy levels and all 16 character measurements included in our study were analysed by following the same approach as above. In those cases in which the data could not be transformed in order to obtain a normal distribution, nonparametric tests were applied (Kruskal–Wallis followed by Dunn’s post hoc tests, p < 0.05; or Wilcoxon–Mann–Whitney test). Correlations between ploidy level and morphological traits were estimated with the Spearman rank correlation. All statistical analyses were carried out using R version 4.0.3.

3. Results

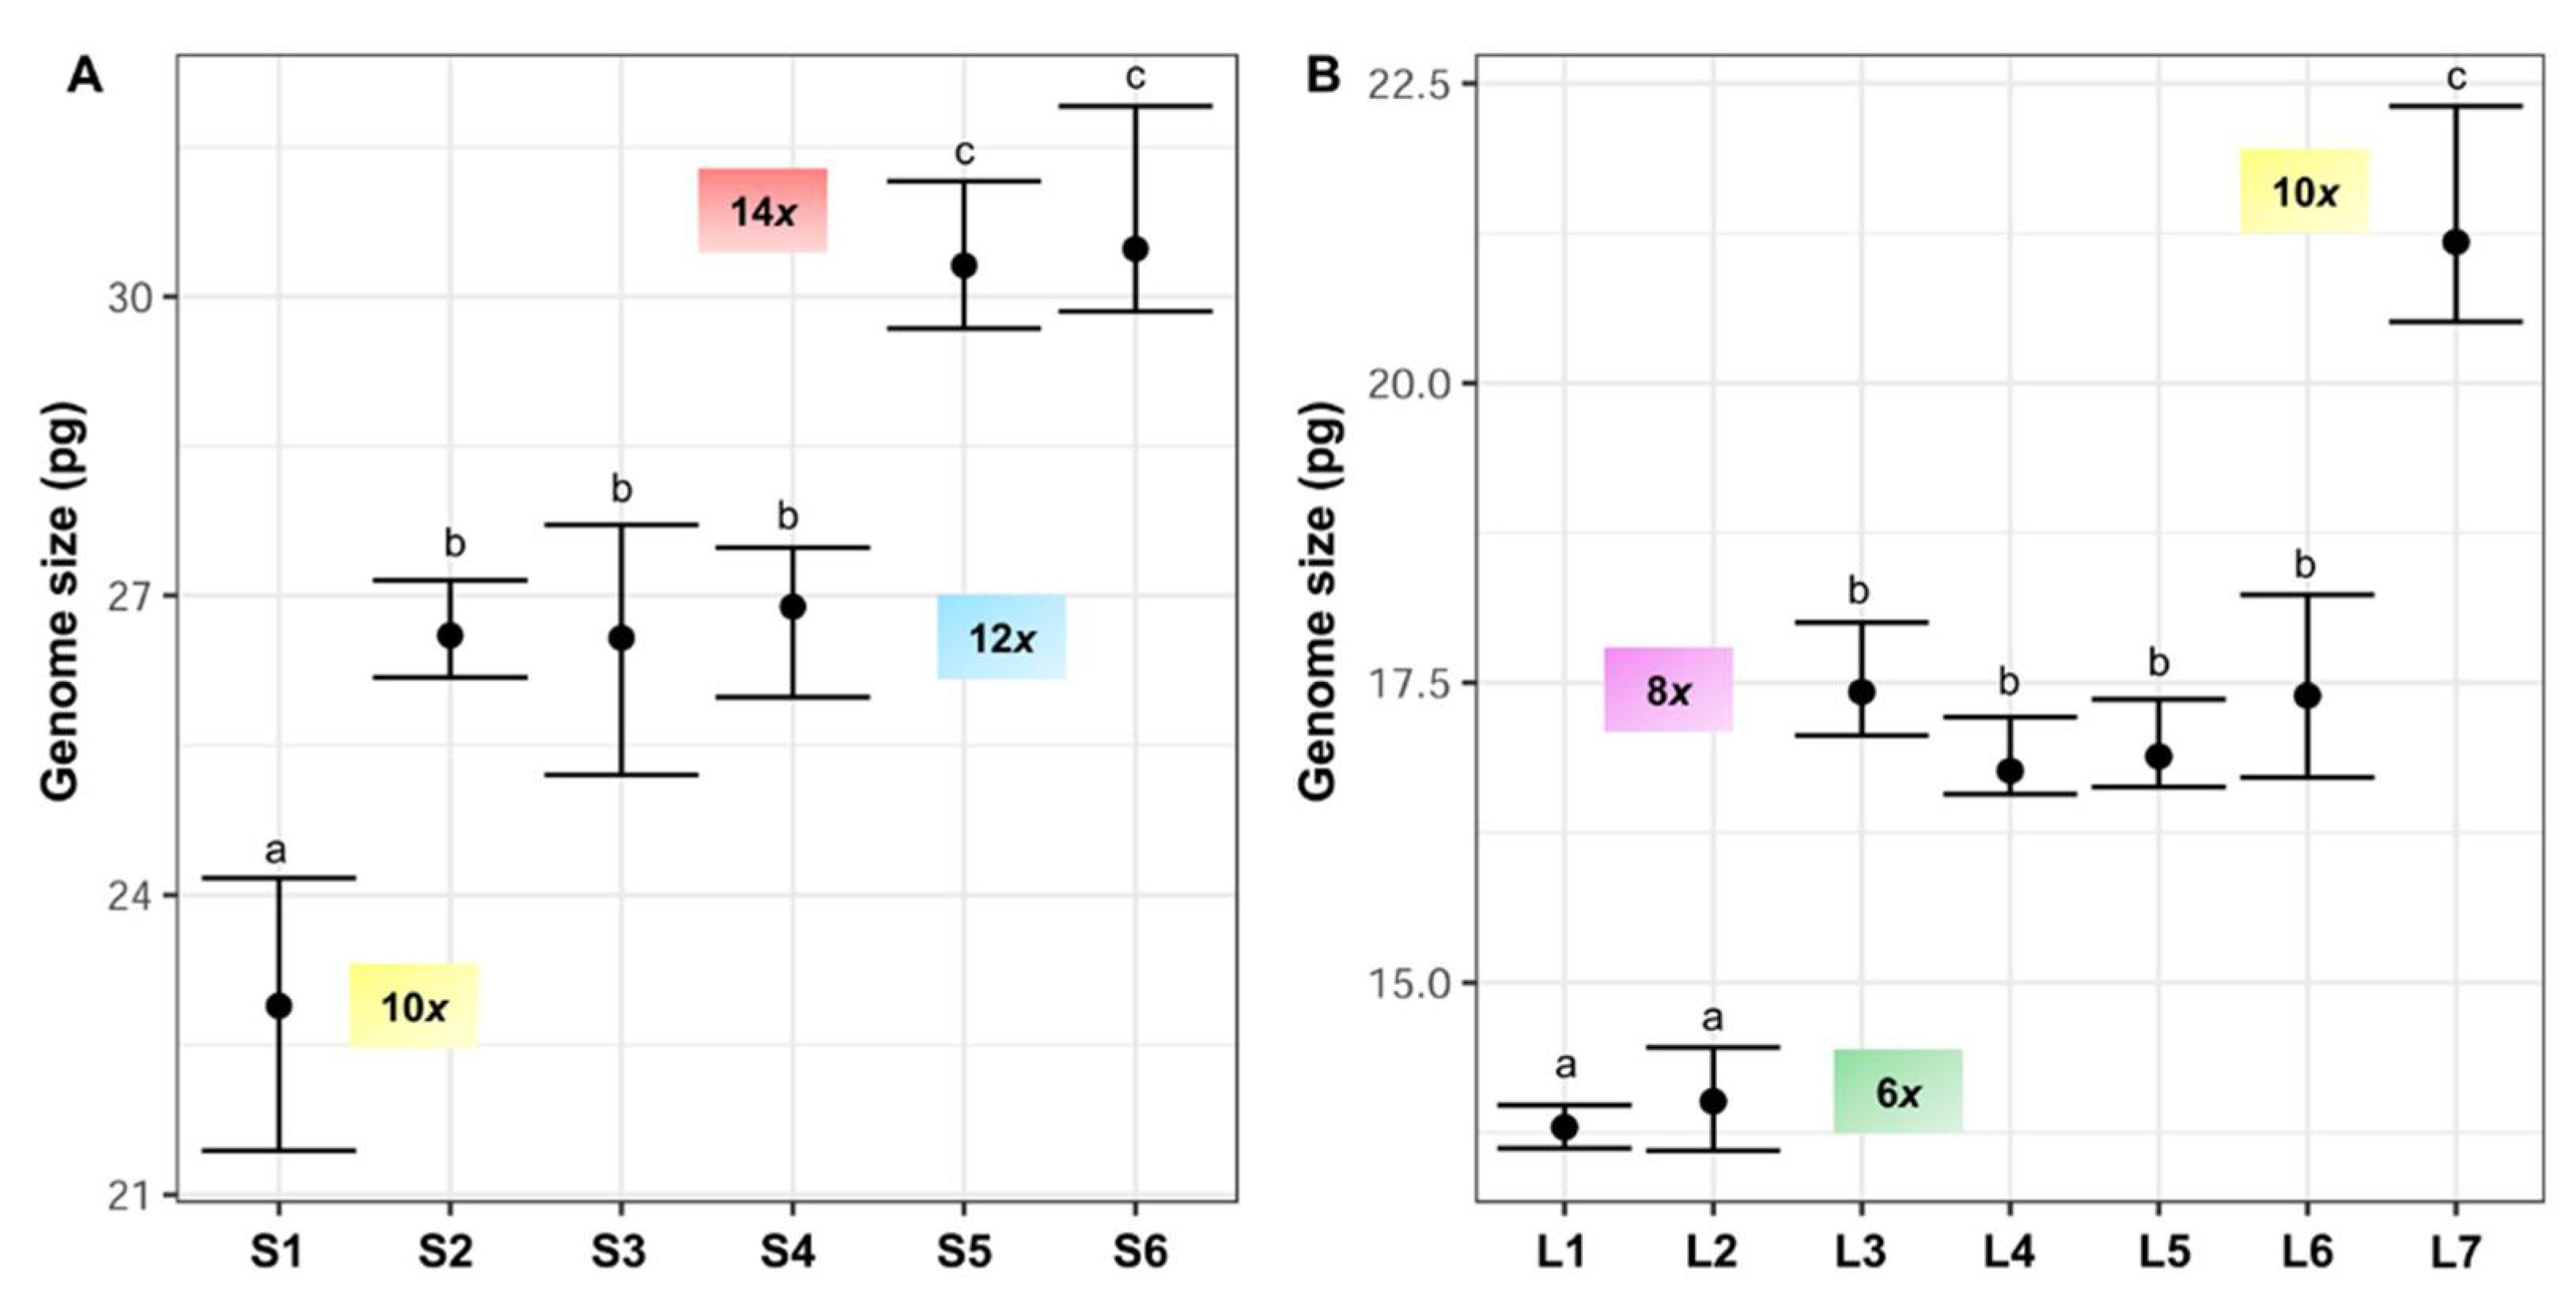
3.1. Genome Size and DNA-Ploidy Level Variation

Fluorescence histograms of relative nuclear DNA content showed high-quality G1 peaks. The coefficients of variation (CVs) for fresh fescue samples were all within the normal range, below 5.0% (mean CVs = 3.48%), indicating reliable estimations (Figure 2A–E and Figure 3A–E). Genome size data for each subspecies and population are shown in Table 2.
Nuclear 2C DNA content has been estimated for the first time in F. yvesii subsp. lagascae. The holoploid genome size estimates obtained were significantly different (up to 2.35-fold) for the two subspecies studied. The lowest 2C values were observed for Festuca yvesii subsp. lagascae, ranging from 13.60 to 22.31 pg, while the highest 2C values were found in the F. yvesii subsp. summilusitana individuals, ranging from 21.44 to 31.91 pg (Table 2, Figure 4). The analysis of variance (ANOVA) revealed significant differences between the 2C values (F12,81 = 837.8, p < 0.0001) at the subspecies level. Variability in genome size was found among the populations studied, with a maximum variation of 1.33-fold in the subsp. summilusitana (S1 vs. S6) and 1.54-fold in the subsp. lagascae (L1 vs. L7) (Table 2). Nevertheless, genome size estimates were homogeneous among individuals, with an average variation of 5.9%.
Specifically, F. yvesii subsp. summilusitana individuals fell within ploidy levels of 10x (S1), 12x (S2, S3 and S4) and 14x (S5 and S6) (Figure 1 and Figure 4A), while individuals of F. yvesii subsp. lagascae had nuclear DNA contents that fell within ploidy levels of 6x (L1 and L2), 8x (L3, L4, L5 and L6) and 10x (L7) (Figure 1 and Figure 4B). Noticeably, the DNA content of dodecaploids was slightly less than twice that of hexaploids (Table 2).
Variation in DNA content was not continuous and five nonoverlapping DNA-ploidy levels were identified (Figure 4): hexaploids (2C = 13.60–14.46 pg), octoploids (2C = 16.57–18.23 pg), decaploids (2C = 20.51–24.17 pg), dodecaploids (2C = 25.20–27.71 pg) and tetradecaploids (2C = 29.68–31.91 pg).
The silica-gel-dried leaves yielded peaks of sufficient quality to assign DNA-ploidy level, although CVs were often higher (mean CVs = 4.9%). The preliminary estimates of dry individuals from northwestern populations of F. yvesii subsp. summilusitana (2C = 23.01–25.84 pg; S7, S8 and S9) fell within the same DNA content group as populations inferred as 10x, and those of F. yvesii subsp. lagascae (L8) were within the 8x range (Figure 1, Table 2). It should be noted that the dry samples always showed genome size estimates larger than the fresh samples with the same ploidy level, with a difference of up to 1.93 pg for the subsp. summilusitana (S1 vs. S9) and up to 2.55 pg for the subsp. lagascae (L4 vs. L8) (Table 2).

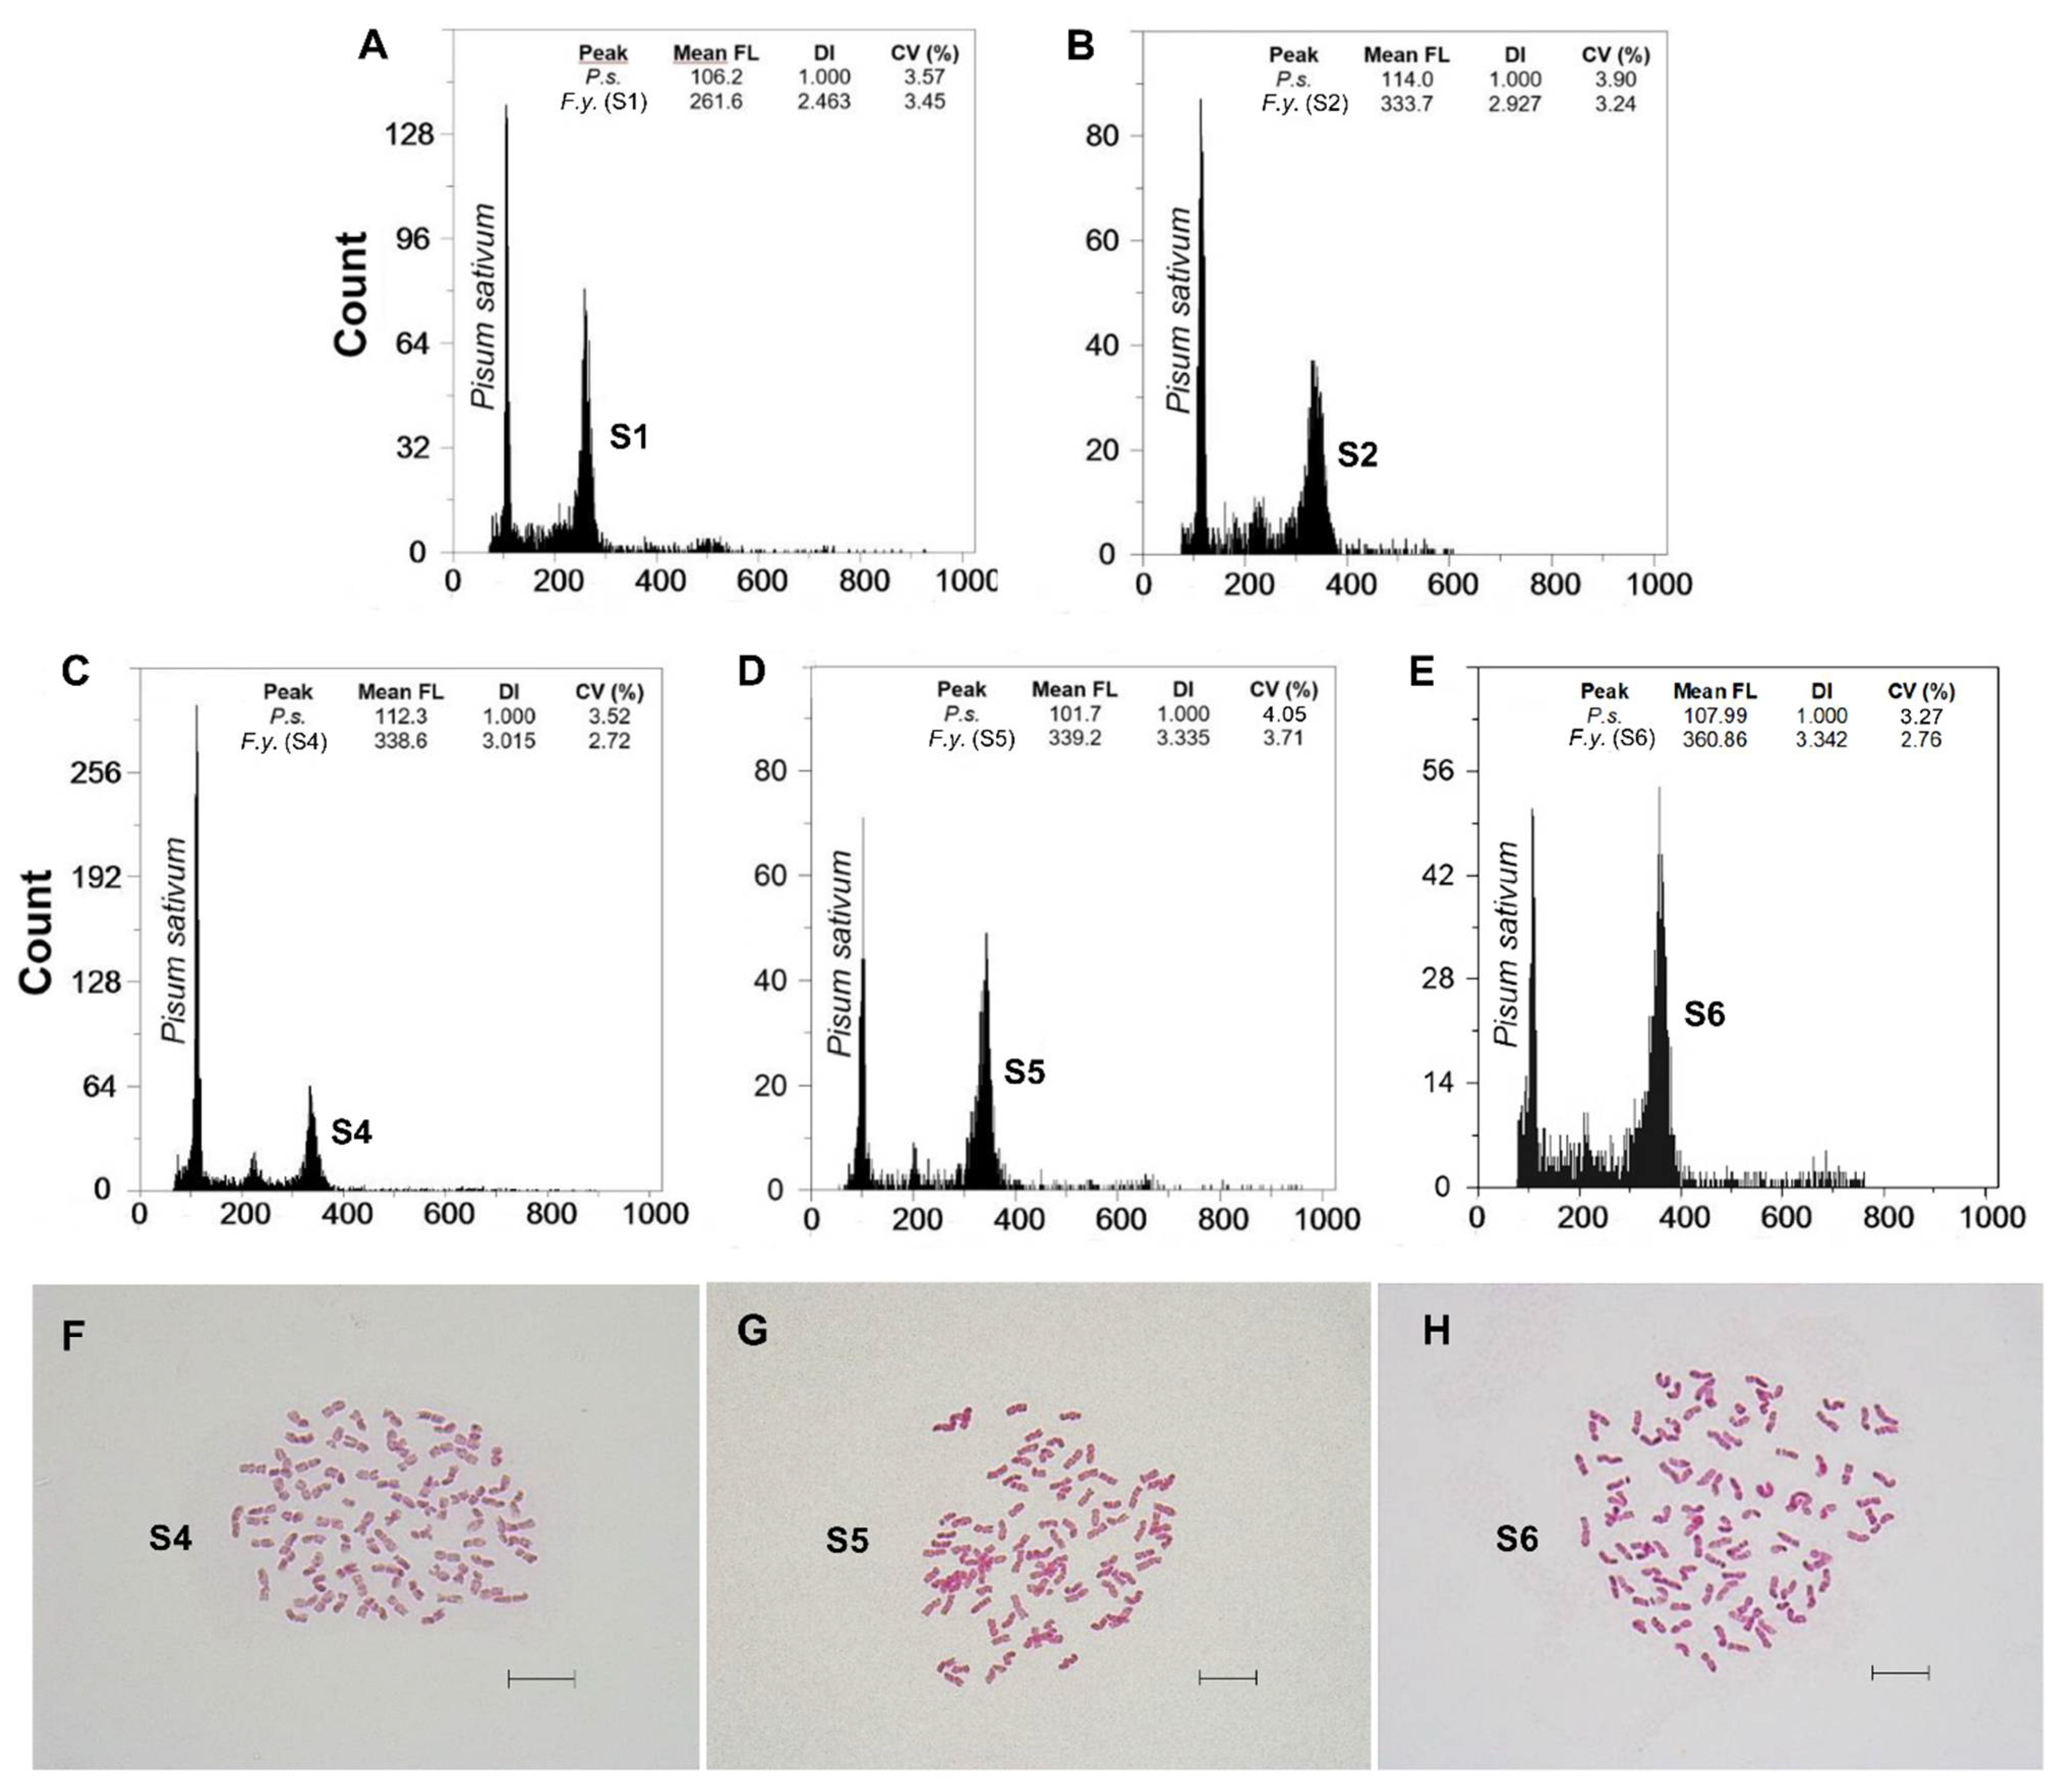
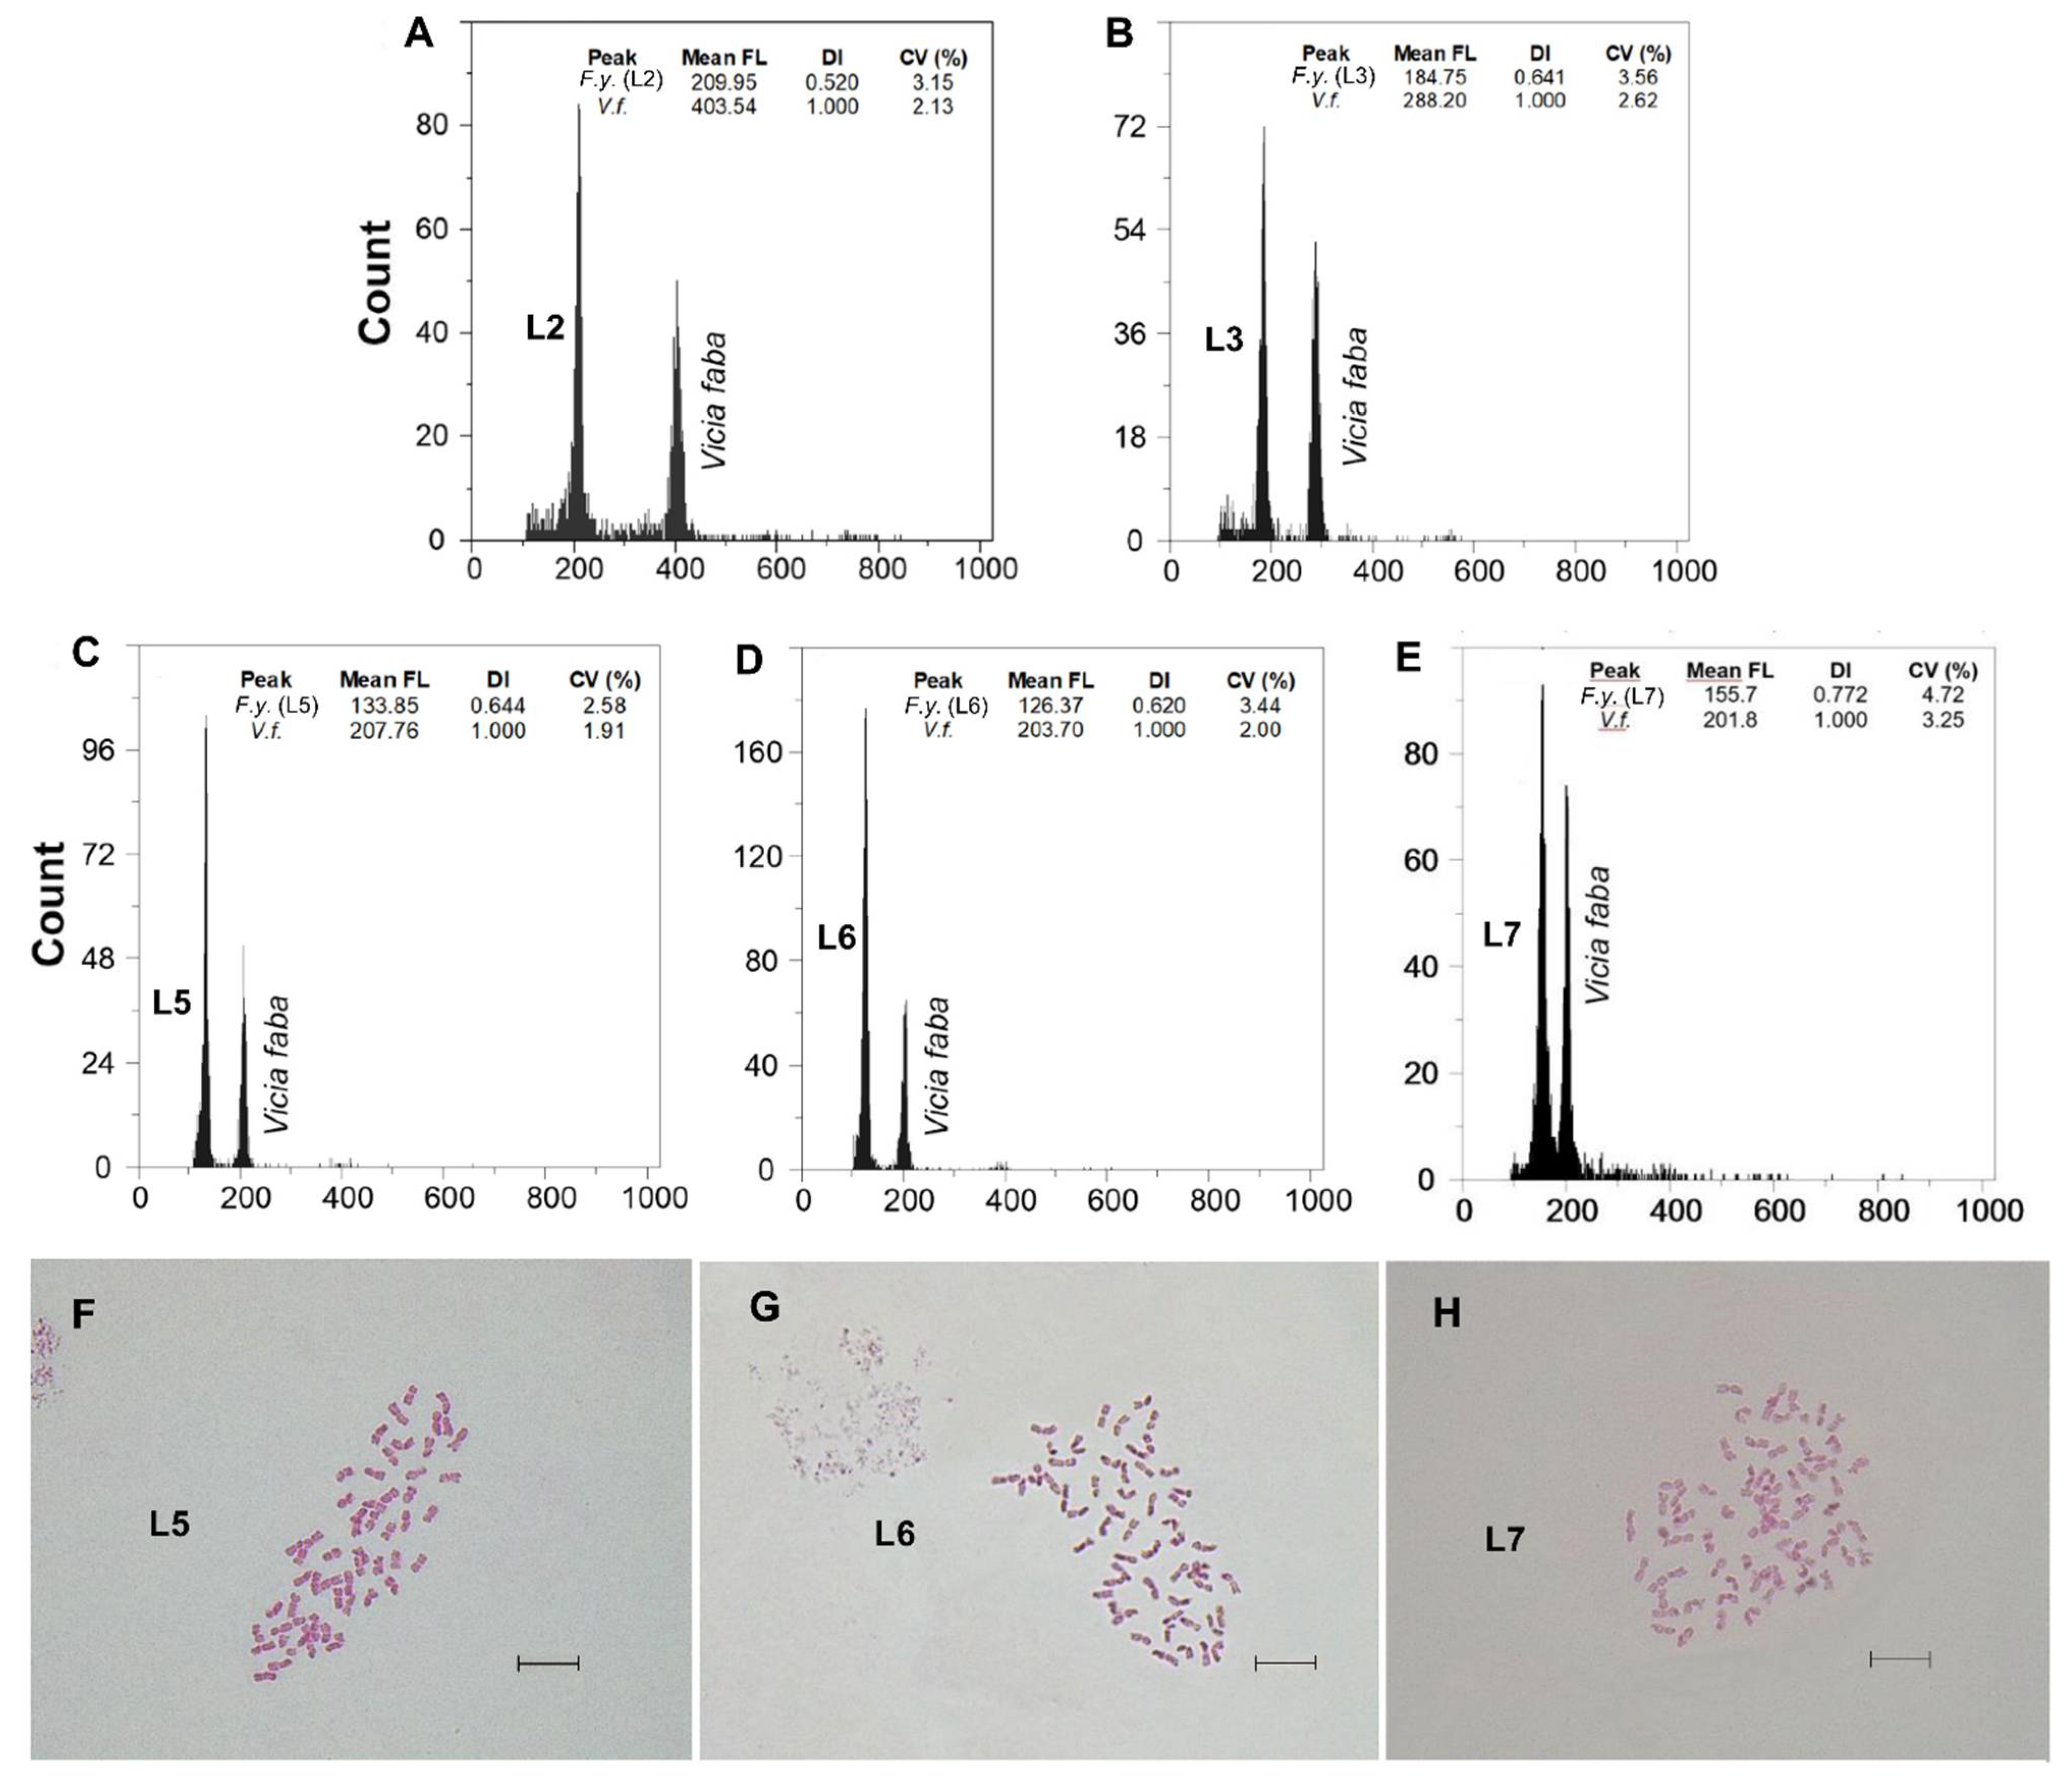
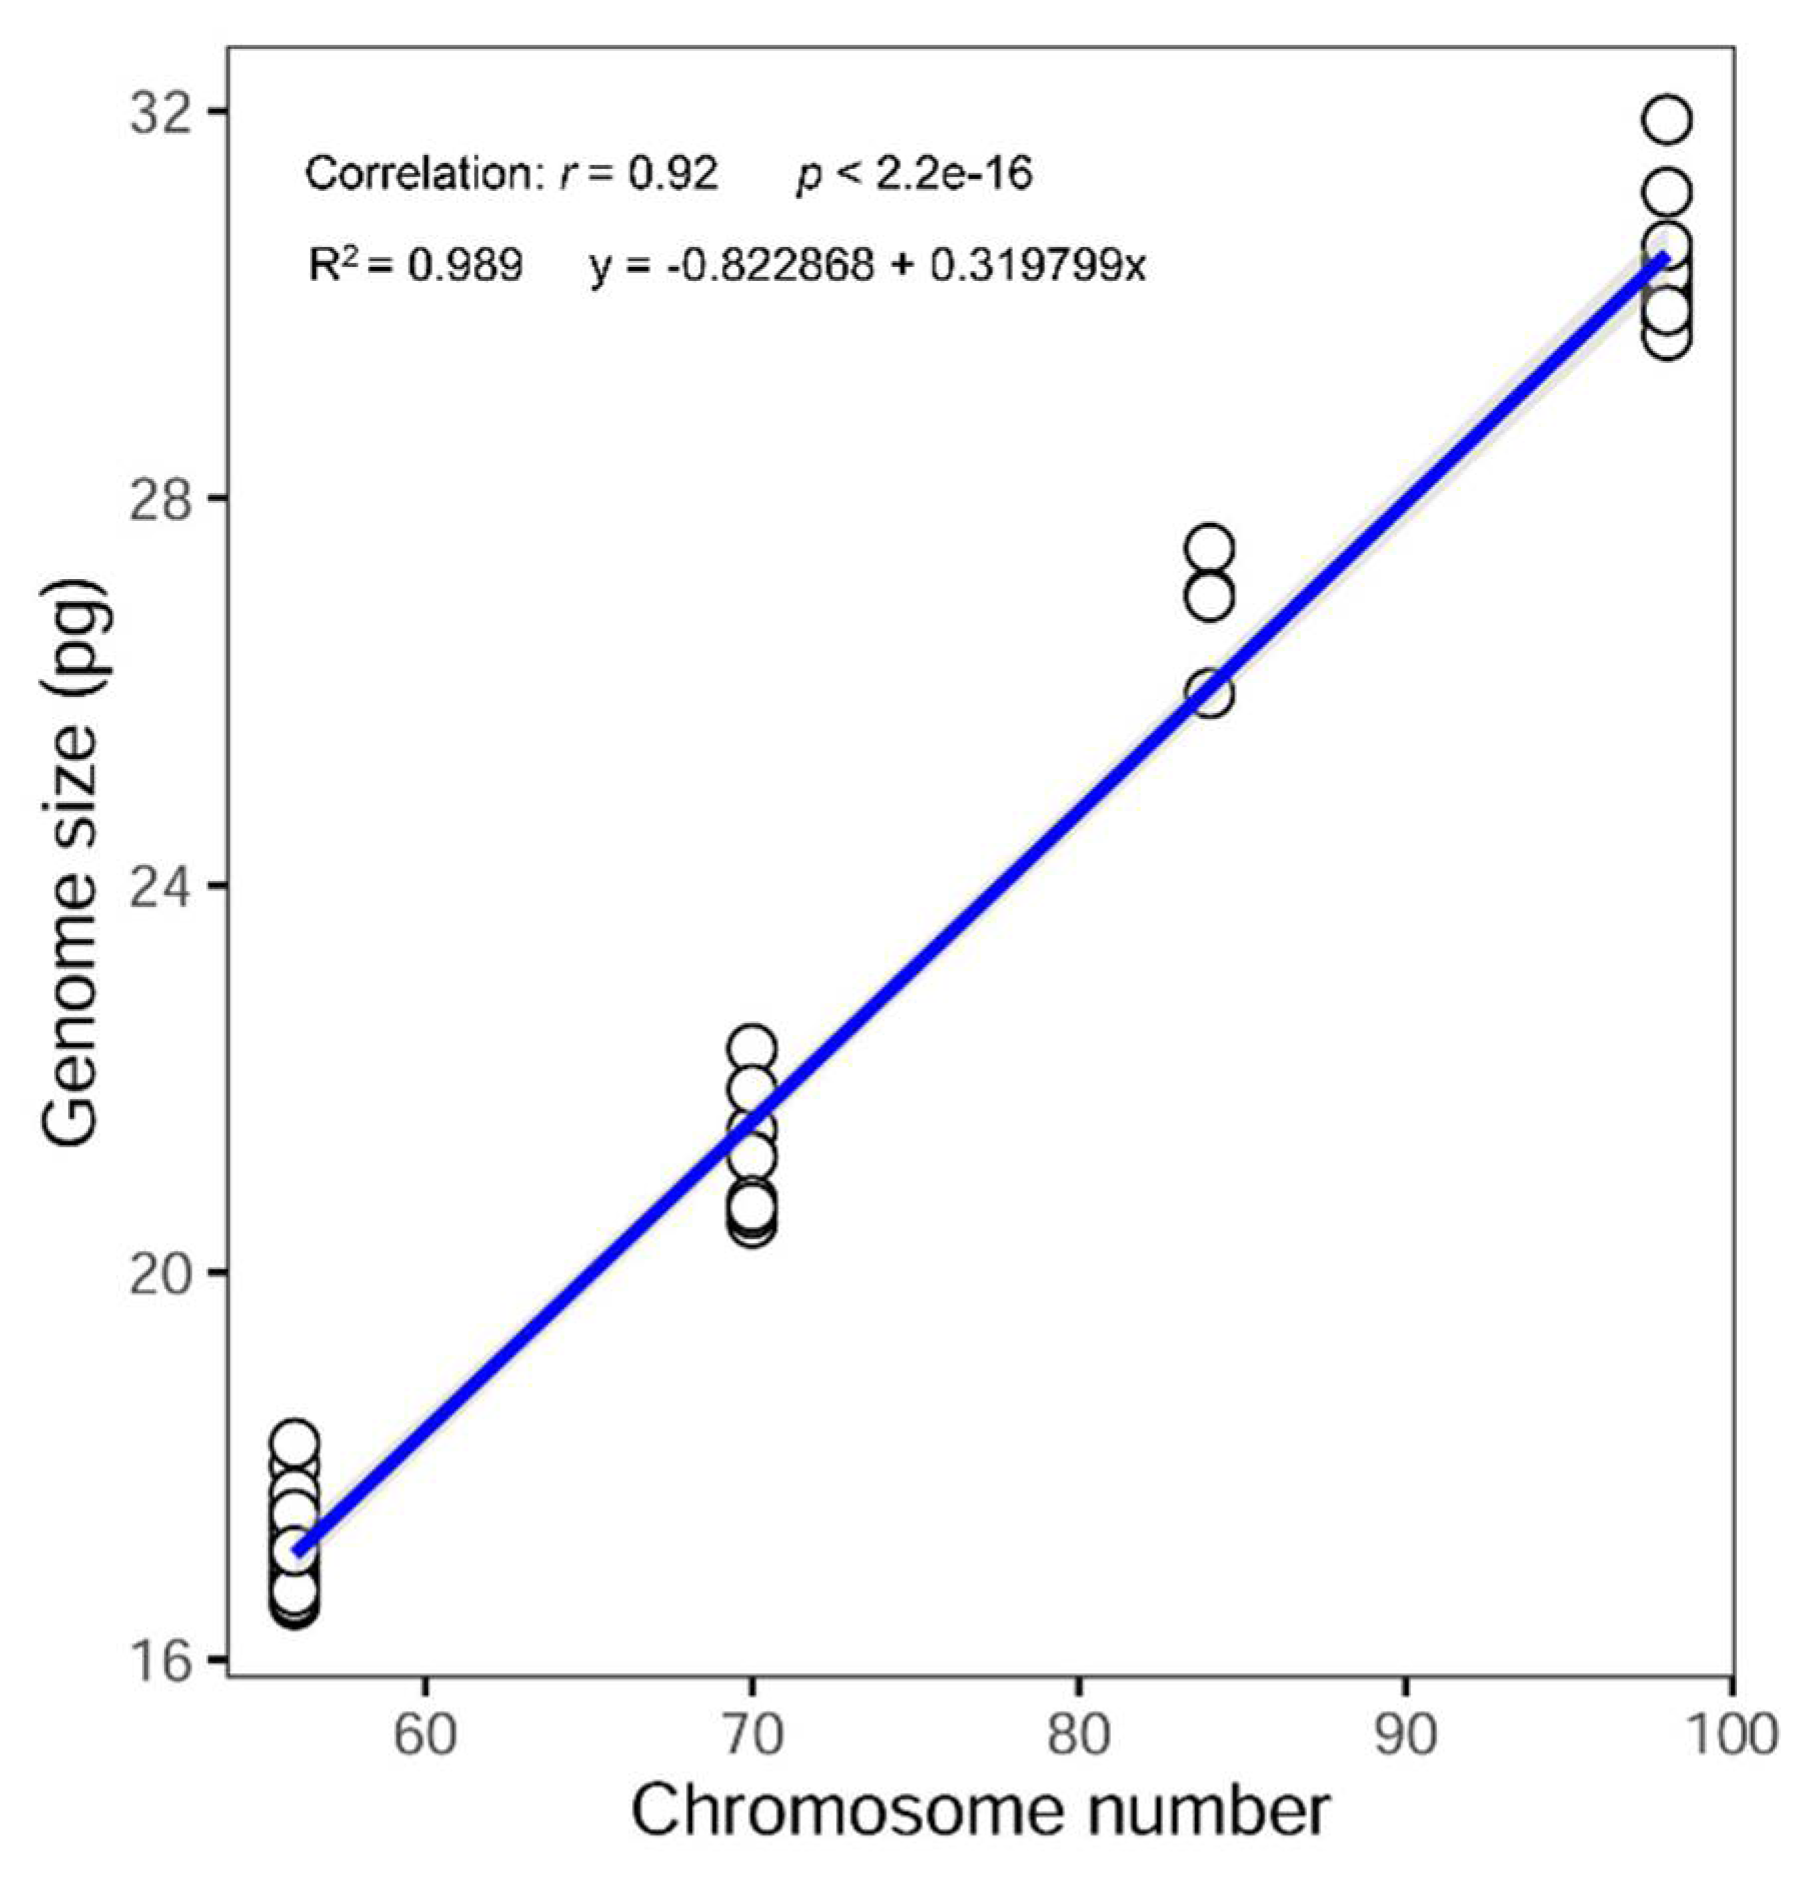
3.2. Chromosome Numbers

A noticeable chromosomal diversity was found for both taxa, and new cytotypes were detected on the basic chromosome number (x = 7). The karyological screenings carried out confirmed the ploidy level detected by FCM (Table 2, Figure 2F–H and Figure 3F–H). The Spearman rank correlation showed a strong positive correlation between 2C nuclear DNA content and the chromosome number observed (Spearman’s rho = 0.92; p < 0.001) (Figure 5). Unexpectedly high ploidy levels were detected for the F. yvesii subsp. summilusitana populations from the centre-west of the Iberian Peninsula (Table 2): Puerto del Pico population (S4) was dodecaploid (2n = 12x = 84; Figure 2F), while Plataforma de Gredos (S5) and La Covatilla (S6) were tetradecaploid (2n = 14x = 98; Figure 2G,H), the highest chromosome number reported in the Festuca genus to date.
Two new somatic numbers were found for F. yvesii subsp. lagascae: 2n = 56 in the individuals from Puerto de Guadarrama (L4), Puerto de Navacerrada (L5; Figure 3F) and Puerto de Morcuera (L6; Figure 3G), and 2n = 70 in those from Puerto de Canencia (L7; Figure 3H), i.e., octoploid and decaploid, respectively (Table 2). In line with the FCM analyses, non-mixed-ploidy populations were detected. A linear regression analysis was performed in order to check the ploidy level of those populations for which no chromosome counts were carried out (R2 = 0.989; y = −0.822868 + 0.319799x) (Figure 5). The subsp. summilusitana populations from the Serra da Estrela, therefore, fit in 10x (S1) and 12x levels (S2 and S3), while populations of the subsp. lagascae from northern Iberian coincide with the 6x (L1 and L2) and 8x levels (L3) (Table 2).

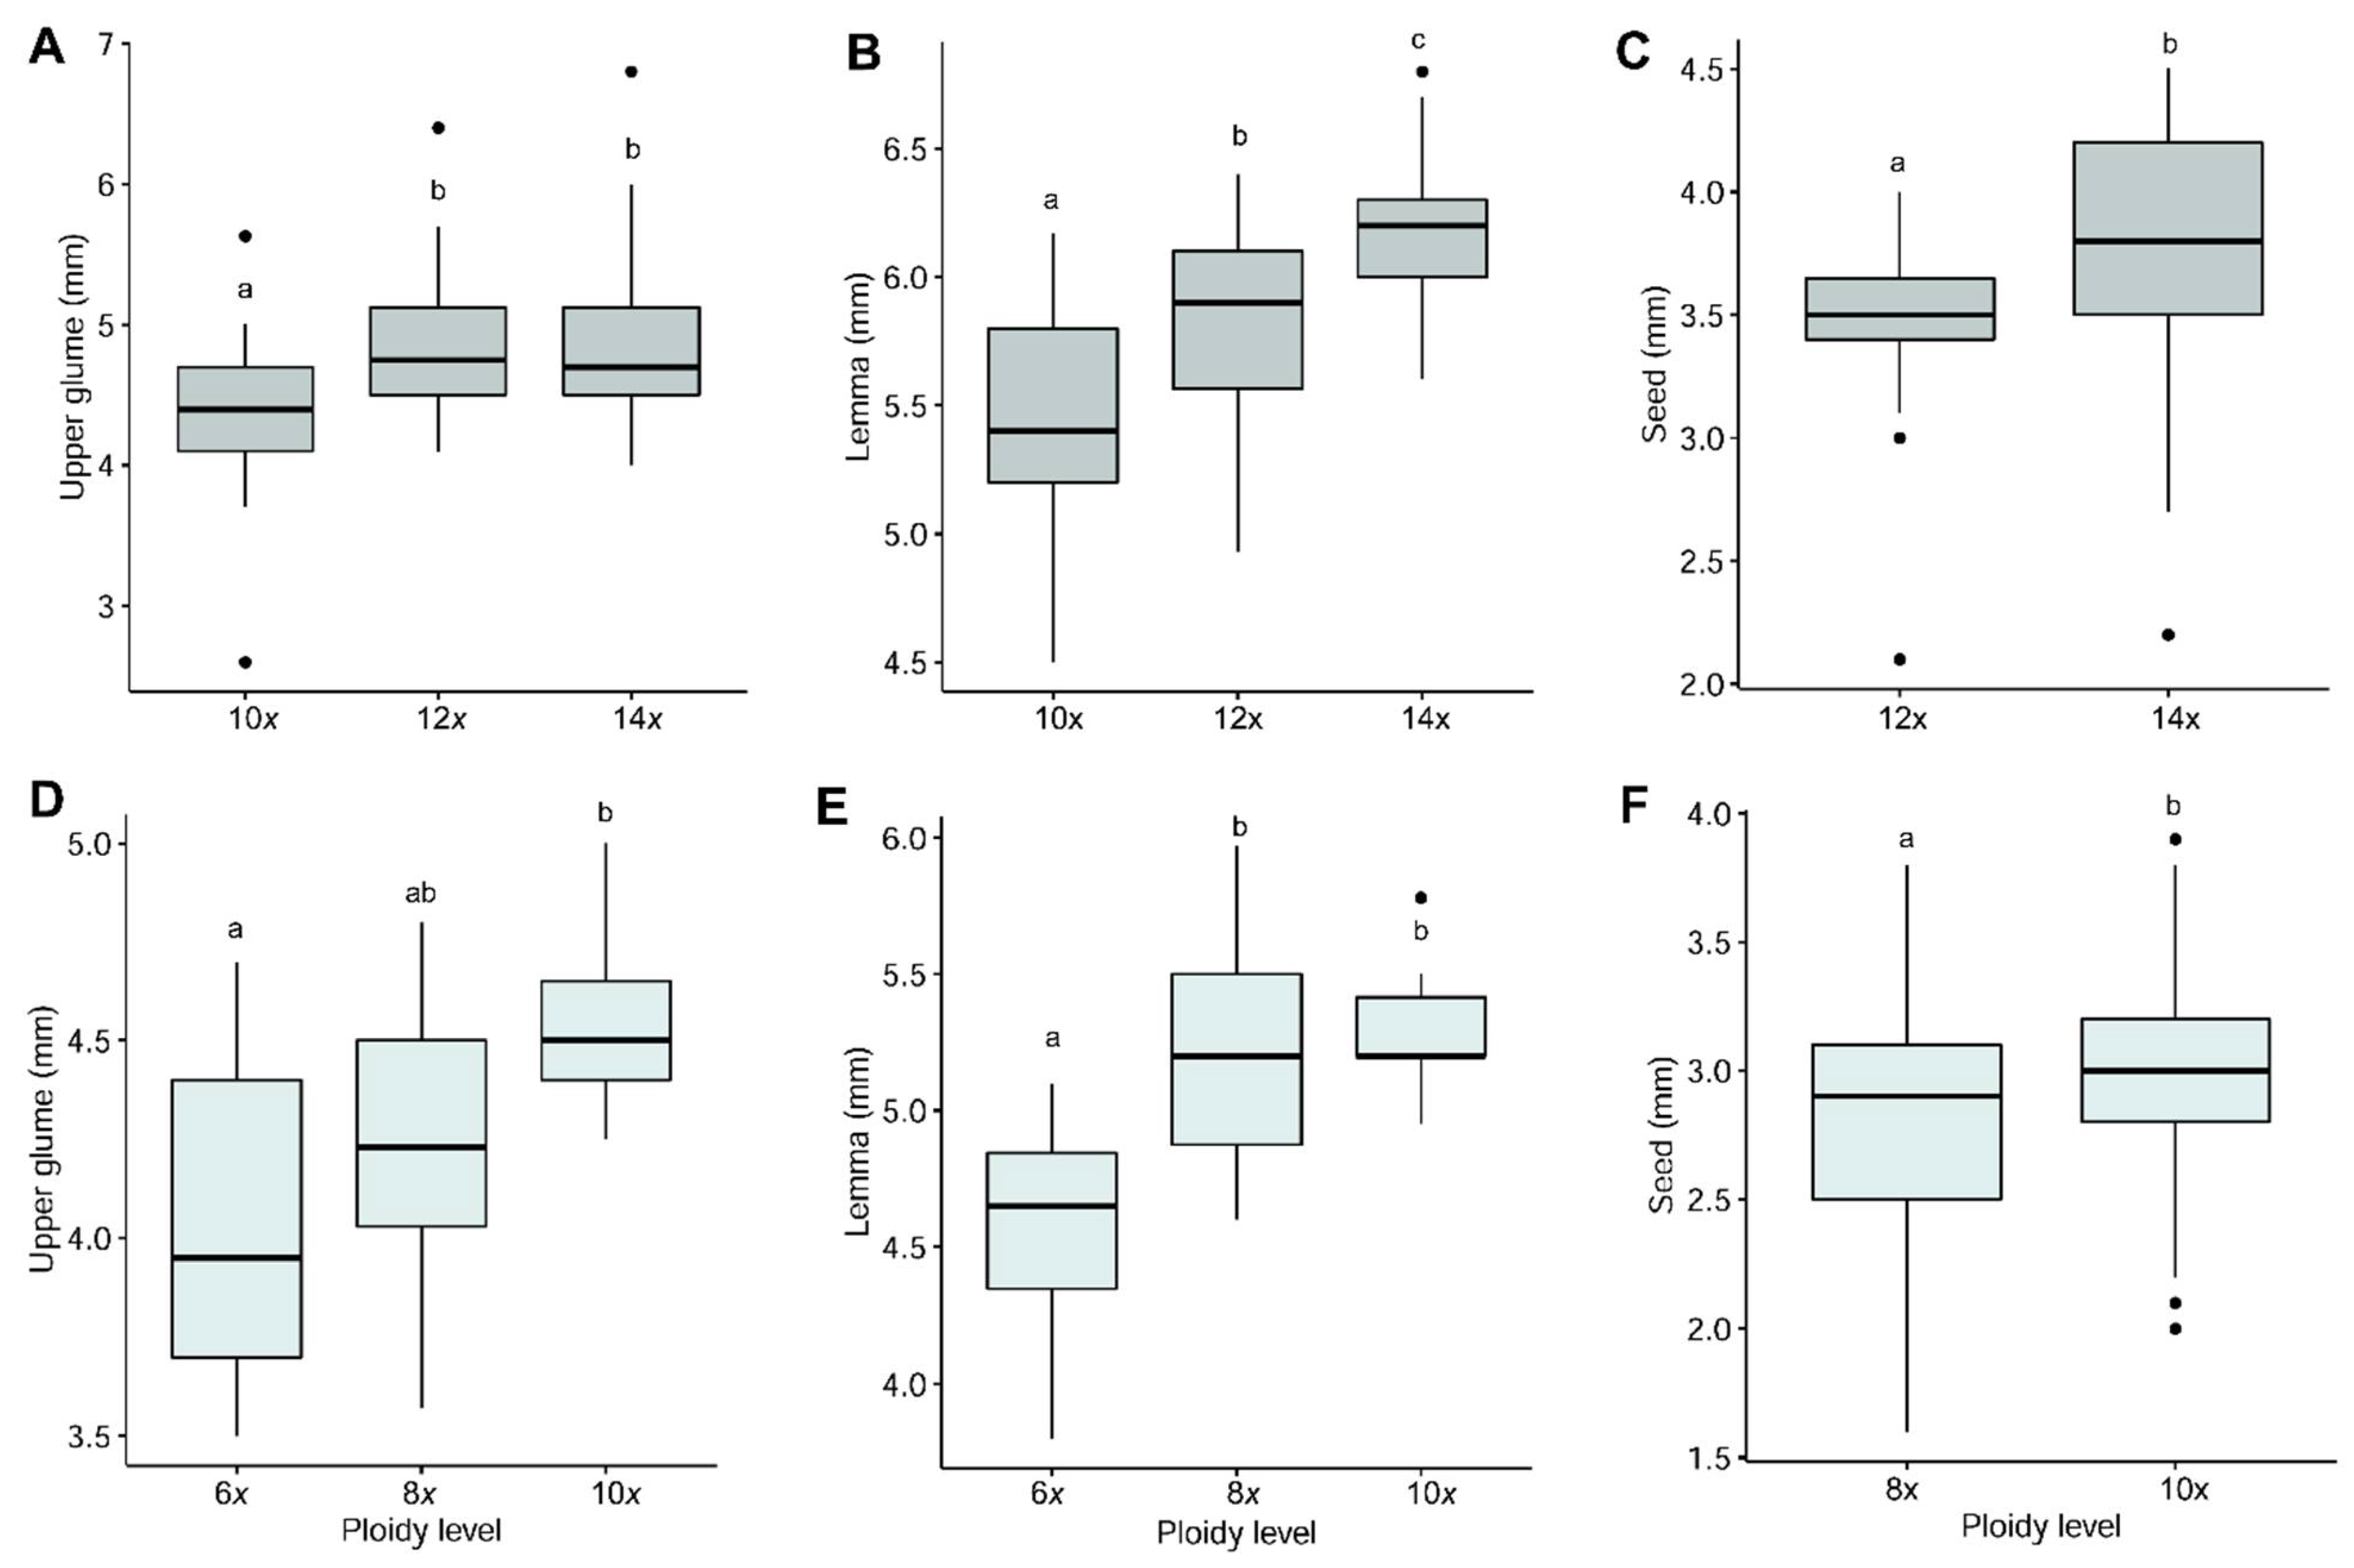
3.3. Morphological Variation

In general, the largest sizes for all the characters were found in the subsp. summilusitana (Figure 6), with the exception of the auricle and awn lengths. A detailed summary of the morphological variation observed is provided in Supplementary Table S1. In both subspecies, most of the morphological traits increased in size with increasing ploidy; however, no significant differences were observed with respect to all ploidy levels (Figure 6, Supplementary Table S1). Moreover, statistical differences between cytotypes were not found for the same characters in both taxa, except for the lemma, upper glume and seed lengths (Figure 6).
The tetradecaploids of F. yvesii subsp. summilusitana were significantly larger than the decaploids for the upper glume (ranging between 4.00–6.80 mm and 2.60–5.63 mm; Figure 6A), lemma (ranging between 5.60–6.80 mm and 4.50–6.17 mm; Figure 6B) and anther lengths (ranging between 2.50–3.80 mm and 2.20–3.20 mm; Supplementary Table S1). The dodecaploids and tetradecaploids had a similar morphological pattern as regards almost all the characters (Figure 6A,B; Supplementary Table S1); differences were only found in the length of the seed (Figure 6C). The only character that was significantly different for all the cytotypes was lemma length (p < 0.001), although the ranges of variation showed a high overlap (Figure 6B). In the case of F. yvesii subsp. lagascae, the hexaploids were significantly smaller than the octoploid and decaploid plants as regards the vegetative and reproductive characters studied (with the exception of the awn and anther length, number of flowers per spikelet, number of branches and nodes per inflorescence; Supplementary Table S1), while the octoploid and decaploids plants were morphologically indistinguishable (Figure 6D,E). As in the previous species, the differences between both cytotypes were only observed in the length of the seed (Figure 6F). Significant positive Spearman’s correlations between ploidy level and some reproductive traits such as lemma (r = 0.62, p < 0.001; r = 0.56, p < 0.001), upper glume (r = 0.28, p = 0.009; r = 0.36, p = 0.002), spikelet (r = 0.27, p = 0.02; r = 0.46, p < 0.001) and seed lengths (r = 0.36, p < 0.001; r = 0.22, p = 0.002) were detected for both the subsp. summilusitana and the subsp. lagascae, respectively.
The highest coefficients of variation (mean values for each subspecies ranging from 23% to 42%) were observed for several vegetative characters, such as the culm, leaf and auricle lengths, and those related to the panicle (e.g., the number of branches), while the lowest CVs were observed for the spikelet (from 6.72% to 12.51%) and the floral pieces, particularly as regards the lemma length (from 5.08% to 8.50%) (Supplementary Table S1).

4. Discussion

4.1. Cytogenetic Variation

Whole-genome duplication is common in Festuca, for which a variation in genome size (2C values) from 3.89 to 25.67 pg has been reported in the literature. These extreme values correspond to the diploid and dodecaploid levels [12,42]. Our FCM data obtained provided clear evidence of unexpectedly high cytogenetic variation in F. yvesii subsp. summilusitana and F. yvesii subsp. lagascae. The discrete genome size variation reported in this study is fully correlated with chromosome number counts and corresponds to five ploidy levels (from 2n = 6x = 42 to 14x = 98). The genome size range (2C values) obtained for each ploidy level is consistent with that estimated previously for phylogenetically related species (data available for up to the dodecaploid level [39]). This supports the FCM is a reliable technique with which to infer the ploidy level in Festuca, as other authors have already pointed out [12,24,25,44].
Of the taxa studied, only genome size estimates for F. yvesii subsp. summilusitana from the Sierra da Estrela populations had been gathered to date. The 2C values obtained for these populations (S1–S3) are compatible with previous data and, according to Loureiro et al. [12], correspond to decaploid (2n = 70 chromosomes; 2C = 22.69 pg) and dodecaploid (2n = 84 chromosomes; 2C = 25.67 pg) levels. The exploratory genome size estimates attained for the northwestern Iberian populations using dry material (S7–S8) coincide with the decaploid level documented by means of chromosome counting [17] and with the increase in genome size registered using dry material with respect to fresh material [50]. However, the hexaploid level previously documented for the centre-west populations (Gredos and the surrounding mountains; S4–S6), which led to the segregation and recognition of these plants as F. gredensis [17,18], was not observed in the current study. Contrary to expectations, we detected a ploidy level that was twice as high in the Puerto del Pico population (S4), which corresponded to a dodecaploid level (2n = 84 chromosomes), with genome size estimates similar to those obtained in populations from the Serra da Estrela (S2 and S3). Even more surprising was the very high chromosome number detected in Plataforma de Gredos (S5) and La Covatilla (S6), which correspond with an unknown tetradecaploid level (2n = 98 chromosomes). This is the first record of such a high level of ploidy for the whole genus and, therefore, also the largest genome size recorded (average 2C values ranging from 30.31 to 30.48 pg). These data suggest that high ploidy levels might be more represented in Festuca sect. Festuca species than previously assumed. It is interesting to note that the mean DNA content increased with ploidy level, but not proportionally. The mean genome size obtained in the dodecaploids (S2, S3 and S4) was, therefore, slightly lower than the theoretical double mean DNA content of related hexaploids (L5 and L6). This decrease in the monoploid genome size (i.e., in the DNA content divided by the ploidy level) observed at the highest ploidy levels would appear to be a general trend in angiosperms. Genome downsizing with polyploidy has been reported in Festuca and other Poaceae genera [12,27,51,52] and could result from genomic changes focused on reducing the negative effect of increased DNA content [53].
Although a mosaic of ploidy levels was found throughout the distribution area of F. yvesii subsp. summilusitana, the variation among individuals was usually low in the majority of populations. Notwithstanding, in the absence of changes in ploidy, some within-population variations in genome size (up to 12%) could be attributed to the presence of B-chromosomes and/or to a variation in the amount of noncoding DNA and in the activity of transposable elements [54,55]. Both phenomenons are relatively common in Poaceae and have been repeatedly documented for this taxon [17] and other fescues species such as F. rupicola Heuff., F. vaginata Willd., F. polesica Zapal. and F. pallens Host [24,54].
The genome size estimations obtained for F. yvesii subsp. lagascae are provided here for the first time. The predominant hexaploid level previously reported for this taxon [17,18] partially coincided with our results. The FCM measurements indicated that only in two northern populations (Valdezcaray and Trigaza, L1 and L2) did the genome size values fit within the expected range for the hexaploid species of Festuca sect. Festuca (2C values varying from 12.30 to 14.22 pg) [42]. By contrast, DNA content in the remaining populations coincided with that obtained in other related octoploid species such as F. brigantina (2C = 17.08 pg) [12] or F. laevigata (2C = 18.60 pg) [42], or it was similar to that found in decaploid populations of the subsp. summilusitana. Both levels are new in the Sierra de Guadarrama populations, where only hexaploids had been detected previously [17]. Our approach with dry material for the most northwestern population of this subspecies (Puerto de San Glorio, L8) fits with the octoploid level previously reported for nearby populations [17].
Although the presence of more than one cytotype has also been reported for several Iberian fescues species (e.g., F. ampla, 2n = 4x and 6x; F. iberica, 2n = 4x and 6x) or even in subspecies (e.g., F. vasconcensis subsp. vasconcensis, 2n = 6x and 8x, F. rubra subsp. juncea 2n = 6x and 8x) [12,13,17], none of them appear to have reached the variation found for the F. yvesii subspecies. With regard to the Festuca sect. Festuca species, the episodes of genome duplication have been suggested to operate in independent evolutionary processes within each mountain range, most probably originating from one common ancestor. However, the current data make it very difficult to discern whether the cytological variability observed in nature results from auto- or allopolyploidisation processes, despite the fact that the latter is believed to have played a major role in the evolution of the genus [56]. The divergence and radiation of the Festuca sect. Festuca taxa occurred relatively recently, in the Pleistocene (c. 1.9 Ma) [57], coinciding with the colonisation of mountain systems in the Iberian Peninsula during glaciation periods [58,59]. In this context, genome duplications could have constituted a success mechanism of adaptation and range expansion, along with speciation, in changing climatic conditions [8,60,61,62]. Phylogenetic analyses based on nuclear and chloroplast markers have detected polytomies or weakly supported relationships among Festuca yvesii subspecies [63]. This unresolved phylogeny may be substantially influenced by the intricate history of past and recent hybridisation and polyploidisation [56].

4.2. Morphological Variation

Genome duplications have, owing to their effects on cell size and gene expression, been postulated to mediate morphological and physiological shifts in new cytogenetic entities [8]. Moreover, genome size variation may itself be a source of phenotypic instability [64]. Festuca yvesii is a polyploid complex with low morphoanatomical differentiation across subspecies. Despite the heterogeneity in the morphological traits and the high range of overlap found among the cytotypes of each taxon, interesting morphological trends appear with regard to the ploidy-level variation detected here.
According to these results, the lemma, upper glume and seed lengths in particular responded significantly to changes in ploidy in both subspecies, similar to what was observed in other taxa [43,44]. These traits also had low phenotypic plasticity, which would indicate that they are genetically fixed. We expected to find the same pattern for the anther and spikelet lengths in both subspecies, but differences for the anther length were detected only between cytotypes of F. yvesii subsp. summilusitana, while differences in spikelets were observed only in the subsp. lagascae. This could respond to an insufficient number of anthers measured in the subsp. lagascae owing to the state of conservation of the material. In the case of the spikelet, the variations in the spikelets are related to the number of flowers of which they are formed. Despite the above, the differences observed in the arithmetic mean obtained for most of the characters are significant only among the most extreme cytotypes of each subspecies, and even in these cases, the ranges of variation overlap. In fact, these cytotypes connect morphologically in such a way that no clear lines of distinction can be drawn between them. In this sense, the relationship between cytotype and the size of morphological features does not necessarily have to be allometric and is often subject to intricate genetic and epigenetic regulatory networks [2,65]. As occurred with our results, Rewicz et al. [43] found differences between the organ size of the diploid and tetraploid of F. amethystina (sect. Aulaxyper), although these were not sufficient to clearly distinguish both cytotypes on the basis of the measurements themselves. In contrast, most of the vegetative characters (e.g., culm and leaf), along with the panicle length and the traits associated with them, were highly variable and could be closely related to adaptation to certain abiotic conditions (e.g., the availability of nutrients, exposure and drought) and/or biotic interactions (e.g., herbivory). The differences found among the cytotypes of the subsp. lagascae as regards culm, leaf and panicle lengths should, therefore, be examined under the same garden growing conditions. Several studies focused on unravelling the taxonomic relationships among cytotypes have experienced difficulties in separating them morphologically and recognising them as entities owing to the lack of reliable diagnostic characters, their heterogeneity and the overlap in the range of variation, especially in groups with complex chromosomal diversity [13,34,66], as has also been detected in the subspecies studied.

5. Conclusions

Our data provide new insights into the cytogenetic complexity of F. yvesii regarding the great variation in genome size and chromosome number diversity. Flow cytometric analyses complemented with chromosome counts suggest an intricate polyploid series at the subspecies level, with cytotypes not previously detected. We have additionally found the highest chromosome number (2n = 14x = 98) and the largest genome size estimates reported for the genus. Likewise, our morphological data, although exploratory, revealed a certain trend in the morphological pattern related to cytogenetic variation, especially in the lemma, but this was clearly insufficient for the morphological distinction of the cytotypes owing to their wide overlap. This study opens up the possibility of further research with which to explore cytogenetic diversity in fescue species with complex morphological pattern variation, by considering the advantages of the flow cytometric method in the ploidy check at the population level.

Supplementary Materials

The following are available online at https://www.mdpi.com/article/10.3390/genes12060906/s1, Table S1: Summary of morphological variation in Festuca yvesii subsp. summilusitana and F. yvesii subsp. lagascae according to ploidy level.

Author Contributions

Conceptualization, G.M.-S. and J.A.D.; methodology, G.M.-S., S.C., L.M., J.L. and J.A.D.; formal analysis, G.M.-S. and S.C.; investigation, G.M.-S. and J.A.D.; resources, G.M.-S., S.C., J.L. and J.A.D.; writing—original draft preparation, G.M.-S. and J.A.D.; writing—review and editing, G.M.-S., S.C., L.M., J.L. and J.A.D.; funding acquisition, J.A.D. All authors have read and agreed to the published version of the manuscript.

Funding

This research was funded by the Ministerio de Economía y Competitividad through the projects Flora Iberica CGL2011-28613-C03-02, CGL2014-52787-C3-3-P and CGL2017-85204-C3-3-P, and FEDER. The work of SC was financed by the Portuguese Foundation for Science and Technology with POPH/FSE funds (IF/01267/2013).

Institutional Review Board Statement

Not applicable.

Informed Consent Statement

Not applicable.

Data Availability Statement

All data generated or analysed during this study are available from the corresponding author on reasonable request.

Acknowledgments

We thank the staff members of COFC Herbarium for assistance in the preparation of specimens and two anonymous reviewers for their helpful comments on the manuscript.

Conflicts of Interest

The authors declare no conflict of interest.

References

  1. Soltis, D.E.; Soltis, P.S. Polyploidy: Recurrent formation and genome evolution. Trends Ecol. Evol. 1999, 14, 348–352. [Google Scholar] [CrossRef]
  2. Otto, S.P.; Whitton, J. Polyploidy incidence and evolution. Annu. Rev. Genet. 2000, 34, 401–437. [Google Scholar] [CrossRef] [Green Version]
  3. Soltis, D.E.; Visger, C.J.; Marchant, D.B.; Soltis, P.S. Polyploidy: Pitfalls and paths to a paradigm. Am. J. Bot. 2016, 103, 1146–1166. [Google Scholar] [CrossRef] [PubMed] [Green Version]
  4. Stebbins, G.L. Chromosomal Evolution in Higher Plants; Edward Arnold: London, UK, 1971; pp. 1–216. [Google Scholar]
  5. Beaulieu, J.M.; Leitch, I.J.; Patel, S.; Pendharkar, A.; Knight, C.A. Genome size is a strong predictor of cell size and stomatal density in angiosperms. New Phytol. 2008, 179, 975–986. [Google Scholar] [CrossRef] [Green Version]
  6. Balao, F.; Herrera, J.; Talavera, S. Phenotypic consequences of polyploidy and genome size at the microevolutionary scale: A multivariate morphological approach. New Phytol. 2011, 192, 256–265. [Google Scholar] [CrossRef] [PubMed]
  7. Rios, E.F.; Kenworthy, K.E.; Munoz, P.R. Association of phenotypic traits with ploidy and genome size in annual ryegrass. Crop Sci. 2015, 55, 2078–2090. [Google Scholar] [CrossRef]
  8. Levy, A.A.; Feldman, M. The impact of polyploidy on grass genome evolution. Plant Physiol. 2002, 130, 1587–1593. [Google Scholar] [CrossRef] [Green Version]
  9. Watson, L.; Dallwitz, M.J. The Grass Genera of the World; CAB International: Wallingford, UK, 1992; pp. 1–1038. [Google Scholar]
  10. Clayton, W.D.; Vorontsova, M.S.; Harman, K.T.; Williamson, H. GrassBase—The Online World Grass Flora 2006 onwards. Available online: http://www.kew.org/data/grasses-db.html (accessed on 14 April 2021).
  11. Malik, C.P.; Thomas, P.T. Karyotypic studies in some Lolium and Festuca species. Caryologia 1966, 19, 167–196. [Google Scholar] [CrossRef] [Green Version]
  12. Loureiro, J.; Kopecký, D.; Castro, S.; Santos, C.; Silveira, P. Flow cytometric and cytogenetic analices of Iberian Peninsula Festuca spp. Plant Syst. Evol. 2007, 269, 89–105. [Google Scholar] [CrossRef]
  13. Devesa, J.A.; Martínez-Sagarra, G.; López Nieto, E.; Muñoz Rodríguez, A.; Cebolla, C.; Ortúñez, E. Festuca L. In Flora Iberica; Devesa, J.A., Romero Zarco, C., Buira, A., Quintanar, A., Aedo, C., Eds.; Real Jardín Botánico, CSIC: Madrid, Spain, 2020; Volume 19, pp. 200–373. [Google Scholar]
  14. Martínez Sagarra, G.; Devesa, J.A. Sobre el nombre Festuca yvesii subsp. graniticola (Kerguélen & Morla) Mart.-Sagarra & Devesa. Acta Bot. Malac. 2021, 46. [Google Scholar] [CrossRef]
  15. Kerguélen, M.; Morla, C. Festuca graniticola, nueva especie del noroeste de la Península Ibérica. Anales Jard. Bot. Madrid 1985, 42, 155–158. [Google Scholar]
  16. Fuente, V.; Ortúñez, E. Nueva especie de Festuca, L. sección Festuca (Poaceae) en la Península Ibérica. Lazaroa 2000, 21, 3–6. [Google Scholar]
  17. Fuente, V.; Ferrero, L.M.; Ortúñez, E. Chromosome counts in the genus Festuca L. section Festuca (Poaceae) in the Iberian Peninsula. Bot. J. Linn. Soc. 2001, 137, 385–398. [Google Scholar] [CrossRef]
  18. Ortúñez, E.; Fuente, V. Reports (394-400) in Mediterranean chromosome number reports. Fl. Medit. 1995, 5, 261–265. [Google Scholar]
  19. Kerguélen, M. Les Gramineae (Poaceae) de la flore française. Essai de mise au point taxonomique et nomenclaturale. Lejeuniaser. 2 1975, 75, 1–343. [Google Scholar]
  20. Fuente, V.; Ortúñez, E. A new species of Festuca L. (Poaceae) from Pyrenees (Spain). Fontqueria 1994, 40, 35–42. [Google Scholar]
  21. Suda, J.; Krahulcová, A.; Trávníek, P.; Krahulec, F. Ploidy level versus DNA ploidy level: An appeal for consistent terminology. Taxon 2006, 55, 447–450. [Google Scholar] [CrossRef]
  22. Pellicer, J.; Leitch, I.J. The application of flow cytometry for estimating genome size and ploidy level in plants. Methods Mol. Biol. 2014, 1115, 279–307. [Google Scholar]
  23. Suda, J.; Trávníček, P. Reliable DNA ploidy determination in dehydrated tissues of vascular plants by DAPI flow cytometry—New prospects for plant research. Cytom. Part A 2006, 69, 273–280. [Google Scholar] [CrossRef]
  24. Šmarda, P. DNA ploidy levels and intraspecific DNA content variability in Romanian fescues (Festuca, Poaceae) measured in fresh and herbarium material. Folia Geobot. 2006, 41, 417–432. [Google Scholar] [CrossRef]
  25. Šmarda, P.; Stančík, D. Ploidy Level Variability in South American Fescues (Festuca L., Poaceae): Use of flow cytometry in up to 5 1/2-year-old caryopses and herbarium specimens. Plant Biol. 2006, 8, 73–80. [Google Scholar] [CrossRef]
  26. Viruel, J.; Conejero, M.; Hidalgo, O.; Pokorny, L.; Powell, R.F.; Forest, F.; Kantar, M.B.; Soto Gomez, M.; Graham, S.W.; Gravendeel, B.; et al. A target capture-based method to estimate ploidy from herbarium specimens. Front. Plant Sci. 2019, 10, 937. [Google Scholar] [CrossRef]
  27. Lysak, M.A.; Doležel, J. Estimation of nuclear DNA content in Sesleria (Poaceae). Caryologia 1998, 51, 123–132. [Google Scholar] [CrossRef]
  28. Marhold, K.; Kudoh, H.; Pak, J.H.; Watanabe, K.; Španiel, S.; Lihová, J. Cytotype diversity and genome size variation in eastern Asian polyploid Cardamine (Brassicaceae) species. Ann. Bot. 2009, 105, 249–264. [Google Scholar] [CrossRef] [PubMed] [Green Version]
  29. Afonso, A.; Loureiro, J.; Arroyo, J.; Olmedo-Vicente, E.; Castro, S. Cytogenetic diversity in the polyploid complex Linum suffruticosum sl. (Linaceae). Bot. J. Linn. Soc. 2021, 195, 216–232. [Google Scholar] [CrossRef]
  30. Bureš, P.; Wang, Y.F.; Horová, L.; Suda, J. Genome size variation in Central European species of Cirsium (Compositae) and their natural hybrids. Ann. Bot. 2004, 94, 353–363. [Google Scholar] [CrossRef] [Green Version]
  31. Mahelka, V.; Suda, J.; Jarolímová, V.; Trávníček, P.; Krahulec, F. Genome size discriminates between closely related taxa Elytrigia repens and E. intermedia (Poaceae: Triticeae) and their hybrid. Folia Geobot. 2005, 40, 367–384. [Google Scholar] [CrossRef]
  32. Garnatje, T.; Garcia, S.; Vilatersana, R.; Vallès, J. Genome size variation in the genus Carthamnus (Asteraceae, Cardueae): Systematic implications and additive changes during alloploidization. Ann. Bot. 2006, 97, 461–467. [Google Scholar] [CrossRef] [Green Version]
  33. Suda, J.; Krahulcová, A.; Trávníček, P.; Rosenbaumová, R.; Peckert, T.; Krahulec, F. Genome size variation and species relationships in Hieracium subgenus Pilosella (Asteraceae) as inferred by flow cytometry. Ann. Bot. 2007, 100, 1323–1335. [Google Scholar] [CrossRef] [Green Version]
  34. Španiel, S.; Marhold, K.; Hodálová, I.; Lihová, J. Diploid and tetraploid cytotypes of Centaurea stoebe (Asteraceae) in Central Europe: Morphological differentiation and cytotype distribution patterns. Folia Geobot. 2008, 43, 131–158. [Google Scholar] [CrossRef]
  35. Cires, E.; Cuesta, C.; Peredo, E.L.; Revilla, M.Á.; Fernández Prieto, J.A. Genome size variation and morphological differentiation within Ranunculus parnassifolius group (Ranunculaceae) from calcareous screes in the Northwest of Spain. Plant Syst. Evol. 2009, 281, 193–208. [Google Scholar] [CrossRef]
  36. Chumová, Z.; Krejčíková, J.; Mandáková, T.; Suda, J.; Trávníček, P. Evolutionary and taxonomic implications of variation in nuclear genome size: Lesson from the grass genus Anthoxanthum (Poaceae). PLoS ONE 2015, 10, e0133748. [Google Scholar] [CrossRef]
  37. Prančl, J.; Koutecký, P.; Trávníček, P.; Jarolímová, V.; Lučanová, M.; Koutecká, E.; Kaplan, Z. Cytotype variation, cryptic diversity and hybridization in Ranunculus sect. Batrachium revealed by flow cytometry and chromosome numbers. Preslia 2018, 90, 195–223. [Google Scholar] [CrossRef]
  38. Rewers, M.; Jedrzejczyk, I.; Rewicz, A.; Jakubska-Busse, A. Genome Size Diversity in Rare, Endangered, and Protected Orchids in Poland. Genes 2021, 12, 563. [Google Scholar] [CrossRef] [PubMed]
  39. Leitch, I.J.; Johnston, E.; Pellicer, J.; Hidalgo, O.; Bennett, M.D. Angiosperm DNA C-Values Database (Release 9.0, April 2019). 2019. Available online: https://cvalues.science.kew.org/ (accessed on 14 April 2021).
  40. Huff, D.R.; Palazzo, A.J. Fine fescue species determination by laser flow cytometry. Crop Sci. 1998, 38, 445–450. [Google Scholar] [CrossRef]
  41. Arumuganathan, K.; Tallury, S.P.; Fraser, M.L.; Bruneau, A.H.; Qu, R. Nuclear DNA content of thirteen turfgrass species by flow cytometry. Crop Sci. 1999, 39, 1518–1521. [Google Scholar]
  42. Šmarda, P.; Bureš, P.; Horová, L.; Foggi, B.; Rossi, G. Genome size and GC content evolution of Festuca: Ancestral expansion and subsequent reduction. Ann. Bot. 2008, 101, 421–433. [Google Scholar] [CrossRef] [PubMed] [Green Version]
  43. Rewicz, A.; Tomczyk, P.P.; Kiedrzyński, M.; Zielińska, K.M.; Jędrzejczyk, I.; Rewers, M.; Kiedrzyńska, E.; Rewicz, T. Morphometric traits in the fine-leaved fescues depend on ploidy level: The case of Festuca amethystina L. PeerJ 2018, 6, e5576. [Google Scholar] [CrossRef] [PubMed] [Green Version]
  44. Qiu, Y.; Hamernick, S.; Ortiz, J.B.; Watkins, E. DNA content and ploidy estimation of Festuca ovina accessions by flow cytometry. Crop Sci. 2020, 60, 2757–2767. [Google Scholar] [CrossRef]
  45. Galbraith, D.W.; Harkins, K.R.; Maddox, J.M.; Ayres, N.M.; Sharma, D.P.; Firoozabady, E. Rapid flow cytometric analysis of the cell cycle in intact plant tissues. Science 1983, 220, 1049–1051. [Google Scholar] [CrossRef]
  46. Loureiro, J.; Rodriguez, E.; Doležel, J.; Santos, C. Two new nuclear isolation buffers for plant DNA flow cytometry: A test with 37 species. Ann. Bot. 2007, 100, 875–888. [Google Scholar] [CrossRef] [PubMed] [Green Version]
  47. Doležel, J.; Greilhuber, J.; Lucretti, S.; Lysák, M.A.; Nardi, L.; Obermayer, R. Plant genome size estimation by flow cytometry: Inter-laboratory comparison. Ann. Bot. 1998, 82, 17–26. [Google Scholar] [CrossRef] [Green Version]
  48. Doležel, J.; Sgorbati, S.; Lucretii, S. Comparison of three DNA fluorochromes for flow cytometric estimation of nuclear DNA content in plants. Physiol. Plant. 1992, 85, 625–631. [Google Scholar] [CrossRef]
  49. Snow, R. Alcoholic hydrochloric acid-carmine as stain for chromosomes in squash preparations. Stain Technol. 1963, 38, 9–13. [Google Scholar] [CrossRef] [PubMed]
  50. Bainard, J.D.; Husband, B.C.; Baldwin, S.J.; Fazekas, A.J.; Gregory, T.R.; Newmaster, S.G.; Kron, P. The effects of rapid desiccation on estimates of plant genome size. Chromosome Res. 2011, 19, 825–842. [Google Scholar] [CrossRef]
  51. Leitch, I.J.; Bennett, M.D. Genome downsizing in polyploid plants. Biol. J. Linn. Soc. 2004, 82, 651–663. [Google Scholar] [CrossRef] [Green Version]
  52. Ezquerro-López, D.; Kopecký, D.; Inda, L.Á. Cytogenetic relationships within the Maghrebian clade of Festuca subgen. Schedonorus (Poaceae), using flow cytometry and FISH. Anales Jard. Bot. Madrid 2017, 74, e052. [Google Scholar]
  53. Bennetzen, J.L.; Ma, J.; Devos, K.M. Mechanism of recent genome size variation in flowering plants. Ann. Bot. 2005, 95, 127–132. [Google Scholar] [CrossRef] [Green Version]
  54. Šmarda, P.; Bureš, P. Intraspecific DNA content variability in Festuca pallens on different geographical scales and ploidy levels. Ann. Bot. 2006, 98, 665–678. [Google Scholar] [CrossRef] [Green Version]
  55. Šmarda, P.; Bureš, P.; Horová, L.; Rotreklová, O. Intrapopulation genome size dynamics in Festuca pallens. Ann. Bot. 2008, 102, 599–607. [Google Scholar] [CrossRef] [Green Version]
  56. Catalán, P. Phylogeny and evolution of Festuca L. and related genera of the subtribe Loliinae (Poeae, Poaceae). In Plant Genome: Biodiversity and Evolution; Sharma, A.K., Sharma, A., Eds.; Science Publishers: London, UK, 2006; Volume 1D, pp. 255–303. [Google Scholar]
  57. Inda, L.A.; Segarra-Moragues, J.G.; Müller, J.; Peterson, P.M.; Catalán, P. Dated historical biogeography of the temperate Loliinae (Poaceae, Pooideae) grasses in the northern and southern hemispheres. Mol. Phylogenetics Evol. 2008, 46, 932–957. [Google Scholar] [CrossRef] [PubMed]
  58. Hewitt, G.M. Post-glacial re-colonization of European biota. Biol. J. Linn. Soc. 1999, 68, 87–112. [Google Scholar] [CrossRef]
  59. Médail, F.; Diadema, K. Glacial refugia influence plant diversity patterns in the Mediterranean Basin. J. Biogeogr. 2009, 36, 1333–1345. [Google Scholar] [CrossRef]
  60. Sampoux, J.P.; Huyghe, C. Contribution of ploidy-level variation and adaptive trait diversity to the environmental distribution of taxa in the ‘fine-leaved fescue’ line age (genus Festuca subg. Festuca). J. Biogeogr. 2009, 36, 1978–1993. [Google Scholar] [CrossRef]
  61. Wood, T.E.; Takebayashi, N.; Barker, M.S.; Mayrose, I.; Greenspoon, P.B.; Rieseberg, L.H. The frequency of polyploid speciation in vascular plants. Proc. Natl. Acad. Sci. USA 2009, 106, 13875–13879. [Google Scholar] [CrossRef] [Green Version]
  62. Loureiro, J.; Castro, M.; Cerca de Oliveira, J.; Mota, L.; Torices, R. Genome size variation and polyploidy incidence in the alpine flora from Spain. Anales Jard. Bot. Madrid 2013, 70, 39–47. [Google Scholar] [CrossRef] [Green Version]
  63. Martínez-Sagarra, G. Estudio Taxonómico de Festuca L. Sect. Festuca (Poaceae) en la Península Ibérica. Ph.D. Thesis, University of Córdoba, Córdoba, Spain, 2018. [Google Scholar]
  64. Chen, Z.J. Genetic and epigenetic mechanisms for gene expression and phenotypic variation in plant polyploids. Annu. Rev. Plant Biol. 2007, 58, 377–406. [Google Scholar] [CrossRef] [PubMed] [Green Version]
  65. Madlung, A.; Masuelli, R.W.; Watson, B.; Reynolds, S.H.; Davison, J.; Comai, L. Remodeling of DNA methylation and phenotypic and transcriptional changes in synthetic Arabidopsis allotetraploids. Plant Physiol. 2002, 129, 733–746. [Google Scholar] [CrossRef] [PubMed] [Green Version]
  66. Stebbins, G.L. Cytogenetics and evolution of the grass family. Am. J. Bot. 1956, 43, 890–905. [Google Scholar] [CrossRef]
Figure 1. Populations of F. yvesii subsp. summilusitana (squares) and F. yvesii subsp. lagascae (circles) sampled in the Iberian Peninsula. Ploidy-level variation is shown using coloured symbols: purple, 6x; green, 8x; yellow, 10x; light blue, 12x; and red, 14x. The asterisks (*) indicate populations estimated from dried material.
Genes 12 00906 g001
Figure 2. (AE) Flow cytometric histograms of relative PI fluorescence intensities and (FH) mitotic metaphase chromosome preparations (for the S4, S5 and S6 populations) of F. yvesii subsp. summilusitana. Abbreviations: S1, ManTable S2. Sabugueiro; S4, Puerto del Pico (2n  =  12x  =  84); S5, Plataforma de Gredos (2n  =  14x  =  98); and S6, La Covatilla (2n  =  14x  =  98). Mean FL, mean relative fluorescence in picograms; DI, DNA index; CV (%), coefficient of variation of the peak in percent. Scale bar: 10 μm.
Genes 12 00906 g002
Figure 3. (AE) Flow cytometric histograms of relative PI fluorescence intensities and (FH) mitotic metaphase chromosome preparations (for the L5, L6 and L7 populations) of F. yvesii subsp. lagascae. Abbreviations: L2, Trigaza; L3, Puerto de Piqueras; L5, Puerto de Navacerrada (2n  =  8x  =  56), L6, Puerto de la Morcuera (2n  =  8x  =  56); and L7, Puerto de Canencia (2n  =  10x  =  70). Mean FL, mean relative fluorescence in picograms; DI, DNA index; CV (%), coefficient of variation of the peak in percent. Scale bar: 10 μm.
Genes 12 00906 g003
Figure 4. Holoploid genome size range and mean (2C values, in picograms) in the sampled populations of (A) F. yvesii subsp. summilusitana (S1–S6) and (B) F. yvesii subsp. lagascae (L1–L7). DNA-ploidy levels are marked (6x, 8x, 10x, 12x and 14x). Only estimates from fresh material are represented. Abbreviations (S1–S6 and L1–L7) correspond to the populations indicated in Table 2. Significant differences among populations at p < 0.05 are denoted by different letters.
Genes 12 00906 g004
Figure 5. Linear regression between holoploid genome size estimates (2C values, in picograms) and chromosome number observed in this study (2n = 56, 70, 84, 98), including 95% confidence intervals. The linear regression equation and coefficient are provided. The correlation is statistically significant (p < 0.0001).
Genes 12 00906 g005
Figure 6. Box plot indicating variation in the lemma, upper glume and seed lengths (in millimetres) in the different ploidy levels detected in (AC) Festuca yvesii subsp. summilusitana and (DF) F. yvesii subsp. lagascae. Outliers are shown as dots. Significant differences among cytotypes at p < 0.05 are denoted by different letters.
Genes 12 00906 g006
Table 1. Ploidy level and chromosome number reported in the literature for subspecies of F. yvesii by chromosome counting or FCM analysis. The reference column provides the original source of publication to each chromosome count. Superscript indicates the taxon name it was published under. The asterisk (*) indicates chromosome counts in extra-Iberian material.
Subspecies (According to Devesa et al., [13])2nMethodReferences
F. yvesii subsp. yvesii2n = 6x = 42 *Counting 1[19]
2n = 8x = 56Counting 1[17]
F. yvesii subsp. altopyrenaica2n = 4x = 28Counting 2[20]
F. yvesii subsp. summilusitana2n = 6x = 42Counting 3,4[17,18]
2n = 10x = 70Counting and FCM 4[12,17]
2n = 12x = 84Counting and FCM 4[12]
F. yvesii subsp. lagascae2n = 6x = 42Counting 5[17]
2n = 8x = 56Counting 1[17]
1 F. yvesii, 2 F. altopyrenaica, 3 F. gredensis, 4 F. summilusitana, 5 F. curvifolia.
Table 2. Holoploid genome size estimations (mean, standard deviation of the mean and maximum and minimum values) for the sampled populations of each subspecies. Data regarding the population and number of individuals sampled (n) are provided. The last column shows the chromosome counts carried out in this study. Type of material analysed: F, fresh; D, dry.
TaxonMountain RangeLocalityn2C Mean ± SD (pg)2C Range (pg)MaterialDNA-Ploidy Level2n
F. yvesii subsp. summilusitanaW range: Serra da Estrela (Portugal)S1: Castelo Branco, Manteigas922.89 ± 0.9621.44–24.17F10x-
S2: Castelo Branco, Sabugueiro826.60 ± 0.3526.18–27.15F12x-
S3: Castelo Branco, Torre626.58 ± 0.8725.20–27.71F12x-
C-W range: Sierra de Gredos and Candelario (Spain)S4: Ávila, Puerto del Pico526.89 ± 0.5525.98–27.48F12x84
S5: Ávila, Plataforma de Gredos730.31 ± 0.4929.68–31.16F14x98
S6: Salamanca, La Covatilla630.48 ± 0.7329.85–31.91F14x98
NW mountains (Spain)S7: León, Villalibre de Somoza324.67 ± 1.4723.01–25.84D10x-
S8: Zamora, Sierra Segundera124.11 D10x-
S9: Zamora, Alto de San Juan124.82 D10x-
F. yvesii subsp. lagascaen range: Sierra de la Demanda and Cebollera (Spain)L1: Logroño, Valdezcaray613.79 ± 0.1513.62–13.98F6x-
L2: Burgos, Trigaza1014.01 ± 0.3213.60–14.46F6x-
L3: Logroño/Soria, Puerto de Piqueras1017.42 ± 0.2917.06–18.00F8x-
C range: Sierra de Guadarrama (Spain)L4: Madrid, Puerto de Guadarrama716.76 ± 0.2216.57–17.21F8x56
L5: Madrid, Puerto de Navacerrada716.88 ± 0.2416.63–17.36F8x56
L6: Madrid, Puerto de la Morcuera 417.39 ± 0.6516.71–18.23F8x56
L7: Madrid, Puerto de Canencia 921.18 ± 0.6220.51–22.31F10x70
North range: Cantabrian mountains (Spain)L8: Puerto de San Glorio 219.31 ± 0.4119.02–19.59D8x-
Publisher’s Note: MDPI stays neutral with regard to jurisdictional claims in published maps and institutional affiliations.

