Article

From Laboratory towards Industrial Operation: Biomarkers for Acidophilic Metabolic Activity in Bioleaching Systems

1
Centro de Biotecnología, Universidad Católica del Norte, Antofagasta 1240000, Chile
2
Departamento de Matemáticas, Facultad de Ciencias, Universidad Católica del Norte, Antofagasta 1240000, Chile
*
Author to whom correspondence should be addressed.
Genes 2021, 12(4), 474; https://doi.org/10.3390/genes12040474
Submission received: 28 December 2020 / Revised: 2 March 2021 / Accepted: 17 March 2021 / Published: 25 March 2021
(This article belongs to the Special Issue Genetics and Genomics of Acidophiles)

Abstract

:
In the actual mining scenario, copper bioleaching, mainly raw mined material known as run-of-mine (ROM) copper bioleaching, is the best alternative for the treatment of marginal resources that are not currently considered part of the profitable reserves because of the cost associated with leading technologies in copper extraction. It is foreseen that bioleaching will play a complementary role in either concentration—as it does in Minera Escondida Ltd. (MEL)—or chloride main leaching plants. In that way, it will be possible to maximize mines with installed solvent-extraction and electrowinning capacities that have not been operative since the depletion of their oxide ores. One of the main obstacles for widening bioleaching technology applications is the lack of knowledge about the key events and the attributes of the technology’s critical events at the industrial level and mainly in ROM copper bioleaching industrial operations. It is relevant to assess the bed environment where the bacteria–mineral interaction occurs to learn about the limiting factors determining the leaching rate. Thus, due to inability to accurately determine in-situ key variables, their indirect assessment was evaluated by quantifying microbial metabolic-associated responses. Several candidate marker genes were selected to represent the predominant components of the microbial community inhabiting the industrial heap and the metabolisms involved in microbial responses to changes in the heap environment that affect the process performance. The microbial community’s predominant components were Acidithiobacillus ferrooxidans, At. thiooxidans, Leptospirillum ferriphilum, and Sulfobacillus sp. Oxygen reduction, CO2 and N2 fixation/uptake, iron and sulfur oxidation, and response to osmotic stress were the metabolisms selected regarding research results previously reported in the system. After that, qPCR primers for each candidate gene were designed and validated. The expression profile of the selected genes vs. environmental key variables in pure cultures, column-leaching tests, and the industrial bioleaching heap was defined. We presented the results obtained from the industrial validation of the marker genes selected for assessing CO2 and N2 availability, osmotic stress response, as well as ferrous iron and sulfur oxidation activity in the bioleaching heap process of MEL. We demonstrated that molecular markers are useful for assessing limiting factors like nutrients and air supply, and the impact of the quality of recycled solutions. We also learned about the attributes of variables like CO2, ammonium, and sulfate levels that affect the industrial ROM-scale operation.

Graphical Abstract

1. Introduction

The Chilean copper industry will be mostly based on the exploitation of sulfide ore reserves in the coming years [1] because of the exhaustion of oxide resources. Mineral concentration is the primary process currently used for copper extraction from sulfide ores. Then, even when the copper production is expected to increase in Chile, a 50% decrease in the production of electrowon cathodes is estimated. That decrease means a concomitant loss of advantages like a possible reward from the quality of cathodes and additional revenues from the recovery and sale of valuable metals contained in the concentrates. On the other hand, concentrate exports and shipping have potential restrictions and additional costs, and variable charges are also associated with treatment and refining [1]. Nowadays, the development of chemical leaching processes for sulfide ores has gained broad attention in hydrometallurgy due to its faster kinetics and higher recovery when compared to bioleaching [2,3]. Copper leaching in concentrated chloride media under ambient conditions is already used in several Chilean operations to benefit secondary sulfide ore [4]. In contrast, for primary sulfide ores, pilot-scale tests can foresee acceptable copper recovery [3]. However, above all the advantages of the beneficiation processes for sulfide ores mentioned above, the high-energy consumption of crushing and grinding for concentrate production poses an impediment when working with marginal materials. On the other side, one of the main issues in the application of chloride leaching is related to costs and impact on infrastructure due to the necessity of changing metallic equipment in contact with Cl- [4]. In that scenario, copper bioleaching, mainly run-of-mine (ROM) copper bioleaching, is considered the best alternative for the extraction of marginal resources currently not considered part of the profitable reserves because of the cost associated with leading technologies in copper extraction [1]. It is foreseen that bioleaching will play a complementary role in concentration and chloride primary leaching operations, considering that it is not necessary to consider the capital cost for installing the solvent extraction and electrowinning (SX/EW) plants, which are already installed. This was the case at the ROM bioleaching plant at Minera Escondida Ltd. (MEL), where more than 250,000 t of copper as cathodes were produced in 2018, and half of them by bioleaching. Consequently, there is a “clearly crucial need to endow hydrometallurgy with technologies that allow it to increase its efficiency” [1]. The potential of bioleaching to enable recovery of metals from deposits to process available resources that are not amenable to metal recovery by any other means has been assessed, e.g., in Europe as well, aiming to develop environmentally sustainable mining operations [5].
One of the main issues of bioleaching at the mine site is the close control required of acidity, air and nutrients availability, temperature, water quality, and cell activity, among other variables, for better metallurgical performances [6,7,8,9,10,11]. However, it is not feasible to monitor these variables inside ROM industrial permanent heaps, as argued before [12,13]. Furthermore, in terms of mineralogy, the heterogeneous ore bed of sulfide exposure to leachate, solution permeability, and air distribution [14] challenges the control of these variables. ROM permanent heaps have had a remarkable engineering development during the last 20 years. The experience revealed the necessity to solve additional issues, like differential acid feeding, air distribution, and solution recirculation.
The microbial community inhabiting ROM bioleaching heaps at MEL has been monitored based on the relevant taxonomic groups and cell activity determination [15,16]. Following these strategies, we assessed the impact of the microbial community structure on the process’s metallurgical performance [6,15,17]. The microbial diversity was also assessed in other bioleaching operations by using the same strategy [17].
We proposed that a state-of-the-art functional-based strategy to assess habitat-specific functional features should indirectly reveal a heap’s environment conditions, such as bioavailable O2, nutrients, and stressful conditions [18,19]. A similar strategy was used to opportunely predict oil contamination in the marine environment [20]. However, up to our knowledge, the analysis of functional genes as biomining community traits was only reported by using cultured microorganisms and in laboratory-controlled conditions [21,22]. Our research work focuses on applying molecular microbial markers for a better control and bioleaching efficiency enhancement.
Based on the genome and metatranscriptomic analyses [9] and the predicted main functions involved in bacterial leaching, we determined the set of genes that better characterizes the microbial response to critical variables in the heap environment. Some of the selected genes were already recognized as the standard for microbial functional ecology [19]. We designed and validated the primers for qPCR, and we performed the experiments at different levels (cultures, column tests, and industrial heap) to validate those genes as biomarkers.
The information obtained from the validated real-time PCR array was incorporated in the development of one of the modules of a decision-support system (DSS) based on decision rules that transform the obtained knowledge into recommendations to the plant operator of the bioleaching process [23,24], assisting with the mine site. This kind of DSS is popularly used, e.g., in evidence-based medicine, to improve healthcare delivery [25]. A clinical decision-support system (CDSS) is a software designed to aid clinical decision-making. In a CDSS, the characteristics of an individual patient are matched to a computerized clinical knowledge base to present the clinician with patient-specific assessments or recommendations. The construction of the DSS for bioleaching processes considers a database for industrial data logging and storage, a knowledge base acquired by suitable statistical and computational tools, and finally, the translation of knowledge into action by applying recommendations that come to terms with operational limitations. The DSS is composed of five reasoning modules: (1) the impact of mineralogy/mineralization in the metallurgical performance, (2) microbial activity and copper recovery, (3) estimated temperature inside the heap, (4) marker genes for critical issues, and (5) inoculation/reinoculation requirements [23].

2. Materials and Methods

2.1. Strains and Media

Acidithiobacillus thiooxidans strain IESL-33 [26] was grown in reactors (3 L) on double-strength (DS) media [27] using sodium tetrathionate (5 mM) as energy source at 30 °C, pH 2.8, with agitation of 200 rpm, and four input CO2 concentrations: 50 ppm, 100 ppm, 300 ppm, and 500 ppm (Table 1). The CO2 concentration was controlled by bubbling, and input and output gas levels were monitored online using a Micro-Oxymax respirometer (Columbus Instruments, Columbus, Ohio, USA.). Each condition was performed in duplicate.
Leptospirillum ferriphilum DSM 14647 type-strain and IESL strain were grown in reactors (1 L) with 600 mL of ABS medium [28], using FeSO4 7H2O (50 mM) as an energy source at 37 °C, pH 1.5, with agitation of 200 rpm, and three different concentrations of MgSO4 7H2O: 25 mM (control, 2.5 g L−1 SO42−), 250 mM (25 g L−1 SO42−), and 500 mM (50 g L−1 SO42) (Table 1). Each condition was performed in triplicate. The strain DSM 14647 is the type-strain obtained from a culture collection, while IESL is a native strain isolated from the industrial process and maintained in active growth since that. Both L. ferriphilum strains have different life histories related to sulfate and probably have different tolerance levels.
Sulfobacillus sp. strain CBAR13 (DSM 103670), isolated from MEL industrial bioleaching heap, was grown independently in reactors (1 L) with 600 mL of single-strength [29] and double-strength [27] media, both supplemented with trace elements [28], yeast extract (0.02%), and using FeSO4 7H2O (50 mM) and K2S4O6 (2 mM) as an energy source, respectively. Cultures were maintained at 50 °C, pH 1.8, and with agitation of 200 rpm until they reached the late exponential phase. Each condition was performed in triplicate.
Every 3 h during 3 to 4 days, a direct cell count was performed using an improved Neubauer chamber and phase contrast microscope for L. ferriphilum and At. thiooxidans cultures. Ferrous ion and tetrathionate oxidation activity were monitored by titration with K2Cr2O7 and by potentiometric titration of produced H2SO4, respectively [30]. All cultures were harvested in the late exponential growth phase when cells were in abundance and metabolically active. Cells were recovered by vacuum filtration through nitrocellulose membrane (0.2 µm) and were immediately preserved at −80 °C in RNAlater® solution (Invitrogen™ AM7021, Carlsbad, California, USA) until nucleic acid isolation.
We modeled growth (cells·L−1) and bacterial activity (Fe2+ consumption and H2SO4 generation) as a function of incubation time and nutrient or stressor concentrations (CO2 ppm and SO42−, respectively) in order to determine the effect of these variables. Modeling was carried out using a multiple regression model [31] using the Minitab 18 statistical software.

2.2. Bioleaching Column Test

Controlled bioleaching experiments run for 105 days at 21–25 °C. Columns (1 m high, 0.6 m diameter) were operated in an open-circuit system (without solution recirculation) and fed with raffinate from the MEL process [32]. Column (col.) tests were performed to assess the effect of air feeding, and NH4+ and SO42− concentrations in the bioleaching environment (col.1/control, col.2/air-test, col.3/NH4+-test, and col.4/SO42−-test). The columns were inoculated with a microbial consortium from the MEL industrial bioleaching heap. The operation setup was maintained as stable during the test, except for the input-airflow of col.2, which was intentionally interrupted twice by a sustained flow of N2 (Table 1), and the NH4+ and SO42− concentrations of col.3, and col.4, respectively, that were modified twice (Table 1). Samples were collected at different operation times for each microorganism’s quantification and transcriptomic analyses (Table 1). Notwithstanding the relevant metabolic activity previously observed on mineral-associated bacteria [33,34] and its recognized effect on mineral dissolution [35], mineral samples were neither obtained nor analyzed in this work. That decision was taken regarding the research work scope, which was to develop molecular markers for monitoring a mining operation where it is not possible to get representative mineral samples for periodic assessment [12].
Input/output gas (O2/CO2) concentrations were continuously monitored by a Micro-Oxymax respirometer (Columbus Instruments) in col.2. Ammonia and sulfate levels were daily analyzed by titration after the steam distillation method and gravimetry, in col.3 and col.4, respectively. Cells for relative expression analysis were collected from 40 L of pregnant leaching solution (PLS) by a tangential flow filtration system [9,36] and nitrocellulose membranes of a 0.2 µm pore diameter. Membranes were washed by filtration with 100 mL of TK-444 (0.4 g L−1, (NH4)2SO4; 0.4 g L−1, MgSO4 × 7H2O; 0.4 g L−1, K2HPO4) medium (pH 1.8), 50 mL of sodium citrate (10 mM), and preserved at −80 °C within RNAlater® (Invitrogen™ AM7021) solution until RNA isolation.

2.3. Industrial Bioleaching Heap

The bioleaching heap process at MEL considers ROM material that has been characterized as low-grade sulfide ore and heap dimensions of 5000 m long by 2000 m wide [6]. Leaching horizontal sections denominated strips, and five lifts or levels are currently loaded (18 m height each). The strips are irrigated with raffinate from the top of the heap. Raffinate percolates until reaching the heap’s base, enabling dissolved copper from the ore in a PLS. In an attempt to feed the entire ore heap with the O2 and CO2 necessary for microbial growth and activity, the heap is force-aerated by mechanical blowers located at the base of the heap of each strip. Only some strips of the fourth lift are aerated from their bases as well (Figure 1).
The microbial community at the Escondida sulfide leach process was mainly composed of (i) mesophilic microorganisms, At. ferridurans D2, At. thiooxidans, and Ac. acidiphilum; (ii) thermotolerant microorganisms, L. ferriphilum and At. ferrooxidans IESL-32; (iii) moderate thermophiles, At. caldus, Firmicutes representatives from Sulfobacillus genus and Ferroplasma from the Archaea domain; (iv) extremely thermophilic genus, Sulfolobus [6]. Recently, pyrosequencing of 16S rRNA and metagenome sequencing of industrial PLS samples revealed the occurrence of Thermoplasmatales archaeon A or E-plasma [37].
Ten PLS samples were collected from five strips (S-132, S-327, S-410, S-413, and S-414) with different aeration conditions and NH4+ and SO42− levels (Table 2). Briefly, PLS samples (10 L for RNA and 1 L for DNA isolation) from the aerated strip S-410 were obtained biweekly, both at the base of the first lift (drop-D) and the base of the fourth lift (M) of the heap, before (one sample) and after (two samples) an aeration interruption. Aeration suspension was carried out by turning off the aeration blowers (forced aeration) located at the base of the S-410, on the fourth lift (M), while the blowers in the base of the first lift (D) of the strip remained turned on. Besides, PLS samples (10 L for RNA and 1 L for DNA isolation) from the S-132, S-327, S-413 strips (permanently and fully aerated), and from the S-414 strip (permanently and partially aerated, with half of the blowers off) were collected. Operational and physicochemical (pH, Eh, NH4+, and SO42− concentrations) characterization of samples were performed (Table 2). Cells from the PLS of each strip were harvested, washed, and preserved as described above. Differences in the NH4+, SO42−, and Fe2+ concentrations were detected in the strips S-405-D, S-405-B, S-405-M, sampled in 2015, and S-132, S-327, S-413, S-414 sampled in 2017 (Table 2). These samples were used to validate the biomarkers associated with nitrogen metabolism, osmotic stress, and ferrous/sulfur oxidation.

2.4. Candidate Genes Selection and Primer Design

To better understand the situation within the heap, it is necessary to know what the microorganisms are doing and how representative they are of the microbial community through gene expression studies and cell quantification. The candidate marker genes were selected to represent the predominant components of the microbial community inhabiting the industrial heap (At. ferrooxidans, At. thiooxidans, L. ferriphilum, and Sulfobacillus sp. CBAR13) and the metabolisms involved in microbial responses to changes in the heap environment that affects the process performance. Oxygen reduction, CO2 and N2 fixation, ammonium transport, iron, and sulfur oxidation, and response to osmotic stress were the metabolisms selected regarding the results of previous research in the system [7,8,10,11].
The metagenomic analysis of a DNA pool generated from industrial samples from the MEL bioleaching heap was previously performed [37]. At. thiooxidans, At. ferrooxidans, L. ferriphilum, and Sulfobacillus sp. related sequences were separated through mapping with CLC Genomic Workbench 8.1 (QIAGEN Bioinformatics, Redwood City, CA, USA.) against Acidithiobacillus, Leptospirillum, and Sulfobacillus available genomes. Four representative reconstructed genomes from industrial samples were chosen, respectively, for At. thiooxidans, At. ferrooxidans, L. ferriphilum, and Sulfobacillus sp. Reconstruction was performed based on the coverage and the sequencing depth. The sequences of the reconstructed genome were then annotated using the RAST server (https://rast.nmpdr.org/ (accessed on 28 December 2020)) [38].
Primers for RT-qPCR (Table S1) were designed for protein-coding genes related to CO2 fixation, such as rcbL1, rcbL2, csoS2, csoS3, csoS4 from At. thiooxidans, and rcbL1, rcbL2 from At. ferrooxidans (Table 3). Primers were also designed for protein-coding genes related to synthetic pathways of compatible solutes, nitrogenase activity, ammonium transport and assimilation from L. ferriphilum, and protein-coding genes related to the ferrous ion and sulfur oxidation from Sulfobacillus sp. CBAR13 (Table 3). Additionally, primers for 16S rRNA, gyrA, and alaS housekeeping genes (Table 3) were designed for At. thiooxidans, At. ferrooxidans, L. ferriphilum, and Sulfobacillus sp. CBAR13 (Table S1). These housekeeping genes were used as endogenous controls for the relative gene-expression calculation.
DNA sequences of the At. thiooxidans selected candidate genes for strains Licanantay (GCA_000709715), ATCC 19377 (GCA_009662475) and the reconstructed Licanantay-like genome from MEL were aligned with ClustalW [39]. Conserved regions were used as the base for the primer design. The same procedure was performed with the candidate genes selected from At. ferrooxidans, L. ferriphilum strain ML04 (GCA_000299235), SpCl (GCA_001280545), Sulfobacillus sp. CBAR13 (LGRO00000000), and the reconstructed genomes from MEL. The promissory candidate primers were evaluated in silico in their specificity with Primer-BLAST (https://www.ncbi.nlm.nih.gov/tools/primer-blast/ (accessed on 28 December 2020)) [40].
All used primers were empirically validated in their specificity, repeatability, and sensibility, as described previously [11]. Pearson’s (R) coefficients of 0.99 and optimal efficiencies (E) (100–110%) [41] were obtained for all selected primers (Table S1). The annealing temperature for all primers was 60 °C.

2.5. RNA Isolation and Transcriptional Analysis

RNA was isolated, and reverse transcription was performed as previously described [9,11].
Transcription dynamics of five At. thiooxidans (ATT) Calvin–Benson–Basham (CBB) genes (Table 3) were evaluated in ATT cultures, col.1, col.2 (Table 1), and ten industrial samples (Table 2) by reverse transcription quantitative PCR (RT-qPCR) [6]. Transcription dynamics of two At. ferrooxidans (AFE) CBB genes (Table 3) were also evaluated on industrial samples. The AFE–CBB genes were not evaluated in the bioleaching column col.2 because At. ferrooxidans did not predominate in that microbial community (results not shown). Since ATT and AFE have the same CO2 fixation mechanism (CBB pathway) but different gas requirements, we hypothesize that it is expectable that CBB genes from both species could have a similar response but different expression levels in the industrial environment.
Transcription dynamics of six L. ferriphilum (LII) genes associated with the trehalose synthetic pathway for osmotic stress response (Table 3) were evaluated in LII cultures, col.4 (Table 1), and industrial strips S-132, S-327, S-413, and S-414 (Table 2). Three genes associated with nitrogen metabolism (Table 3) were evaluated in col.3 and industrial strips S-132, S-327, S-413, S-414, and S-405 (Table 2). Each qPCR run was performed using technical triplicates.
Transcription dynamics of four genes associated with ferrous oxidation and two genes associated with sulfur oxidation (Table 3) were evaluated in Sulfobacillus sp. CBAR13 (STO) pure cultures (Table 1) and industrial strips S-132, S-327, S-413, and S-414 (Table 2).
The fold-change gene expression (ratio) was calculated by the Pfaffl model using REST software V2.0.13 [42]. The Pfaffl model has been successfully used in previous gene expression analyses for acidophilic microorganisms [6,9,11]. One sample of each sample-set was selected and used as a control sample. Relative gene expression was calculated as the transcription level in target samples relative to the control sample. All relative gene expression analyses were normalized against endogenous controls previously validated by the NormFinder algorithm [43]. Relative expression levels were expressed as Log2-ratio. Significant differences in relative expression were adjusted at −1 < Log2 ratio < 1.

3. Results

3.1. Cell Harvesting, DNA, and RNA Extraction

RNA quantity obtained from culture samples ranged between 20–200 ng/µL while the quality for 260/280 and 260/230 ratios ranged between 1.5–2.1 and 0.9–2.0, respectively, as expected for this kind of sample. The analysis performed on the RNA obtained from bioleaching columns and industrial-strip samples (Table S2) revealed that, in general, RNA presented good and acceptable quantity and quality ranges for transcriptomic RT-qPCR analyses.

3.2. Biomarkers for CO2 Availability in Acidithiobacillus spp.

3.2.1. Effects of CO2 Availability on Growth and Activity of At. thiooxidans Strain IESL-33

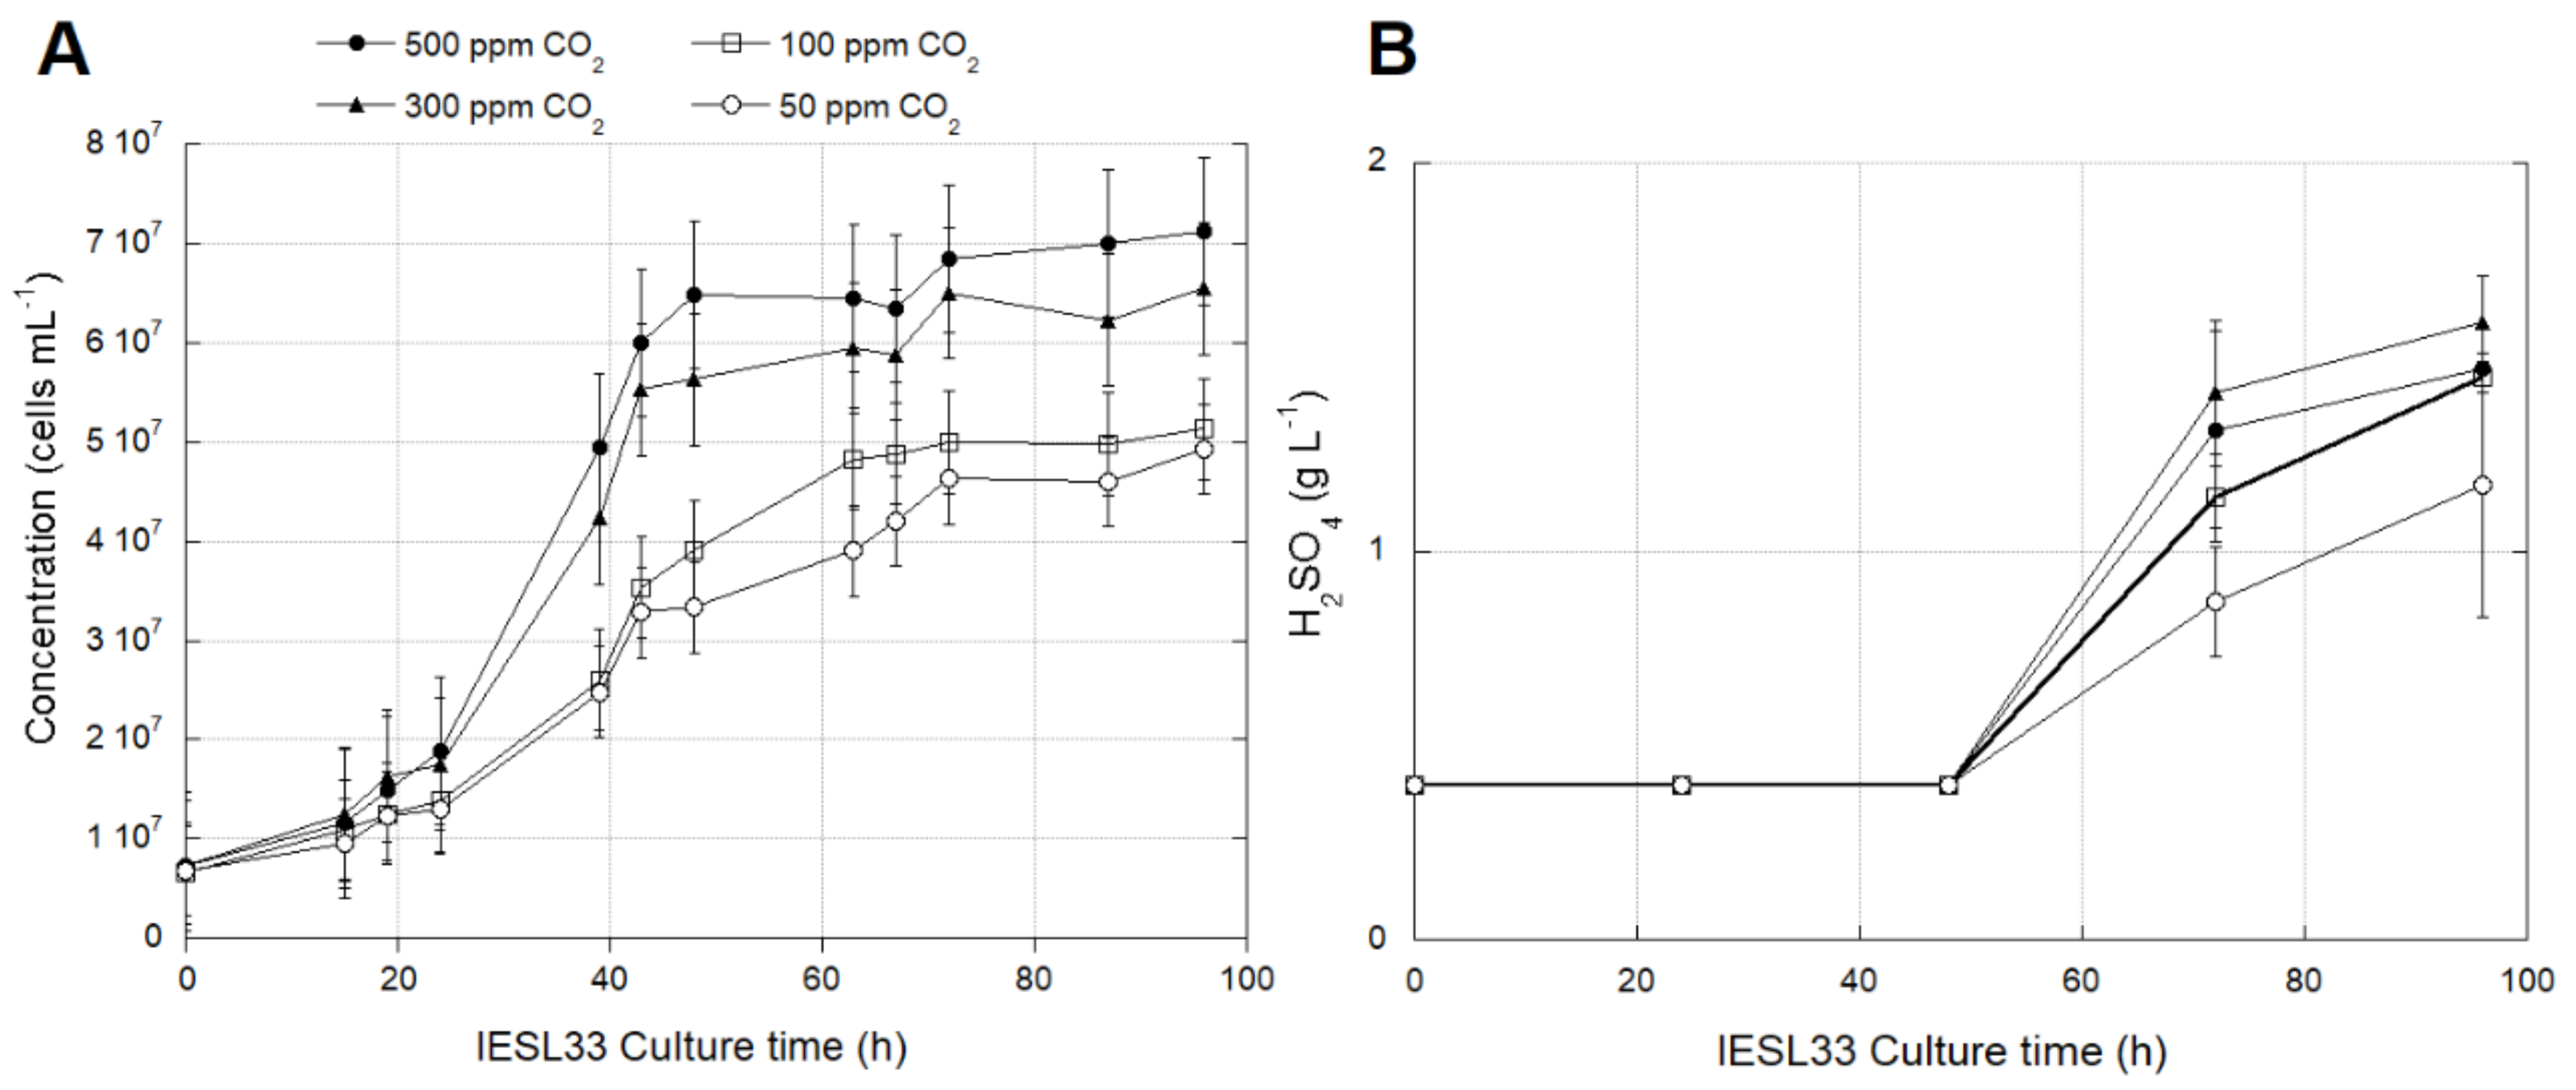
Different CO2 concentrations in all four reactors were maintained as stable through time in the experiments (Figure 2). The growth rates of At. thiooxidans IESL-33 as assessed by cell counts was slower at lower CO2 concentrations. Significant differences (p < 0.05) (Table S3) were observed between reactors operated at 50 and 500 ppm of CO2 (Figure 2A). No significant differences were observed in growth between reactors operated at 50 and 100 ppm of CO2 or reactors operated at 300 and 500 ppm of CO2. The microbial activity expressed as acid generation (H2SO4)—the product of bacterial sulfur oxidation activity—showed a lower rate of production in reactors with lower CO2 availability (Figure 2B).

3.2.2. Identification of Transcriptomic Markers Associated with CO2 Availability

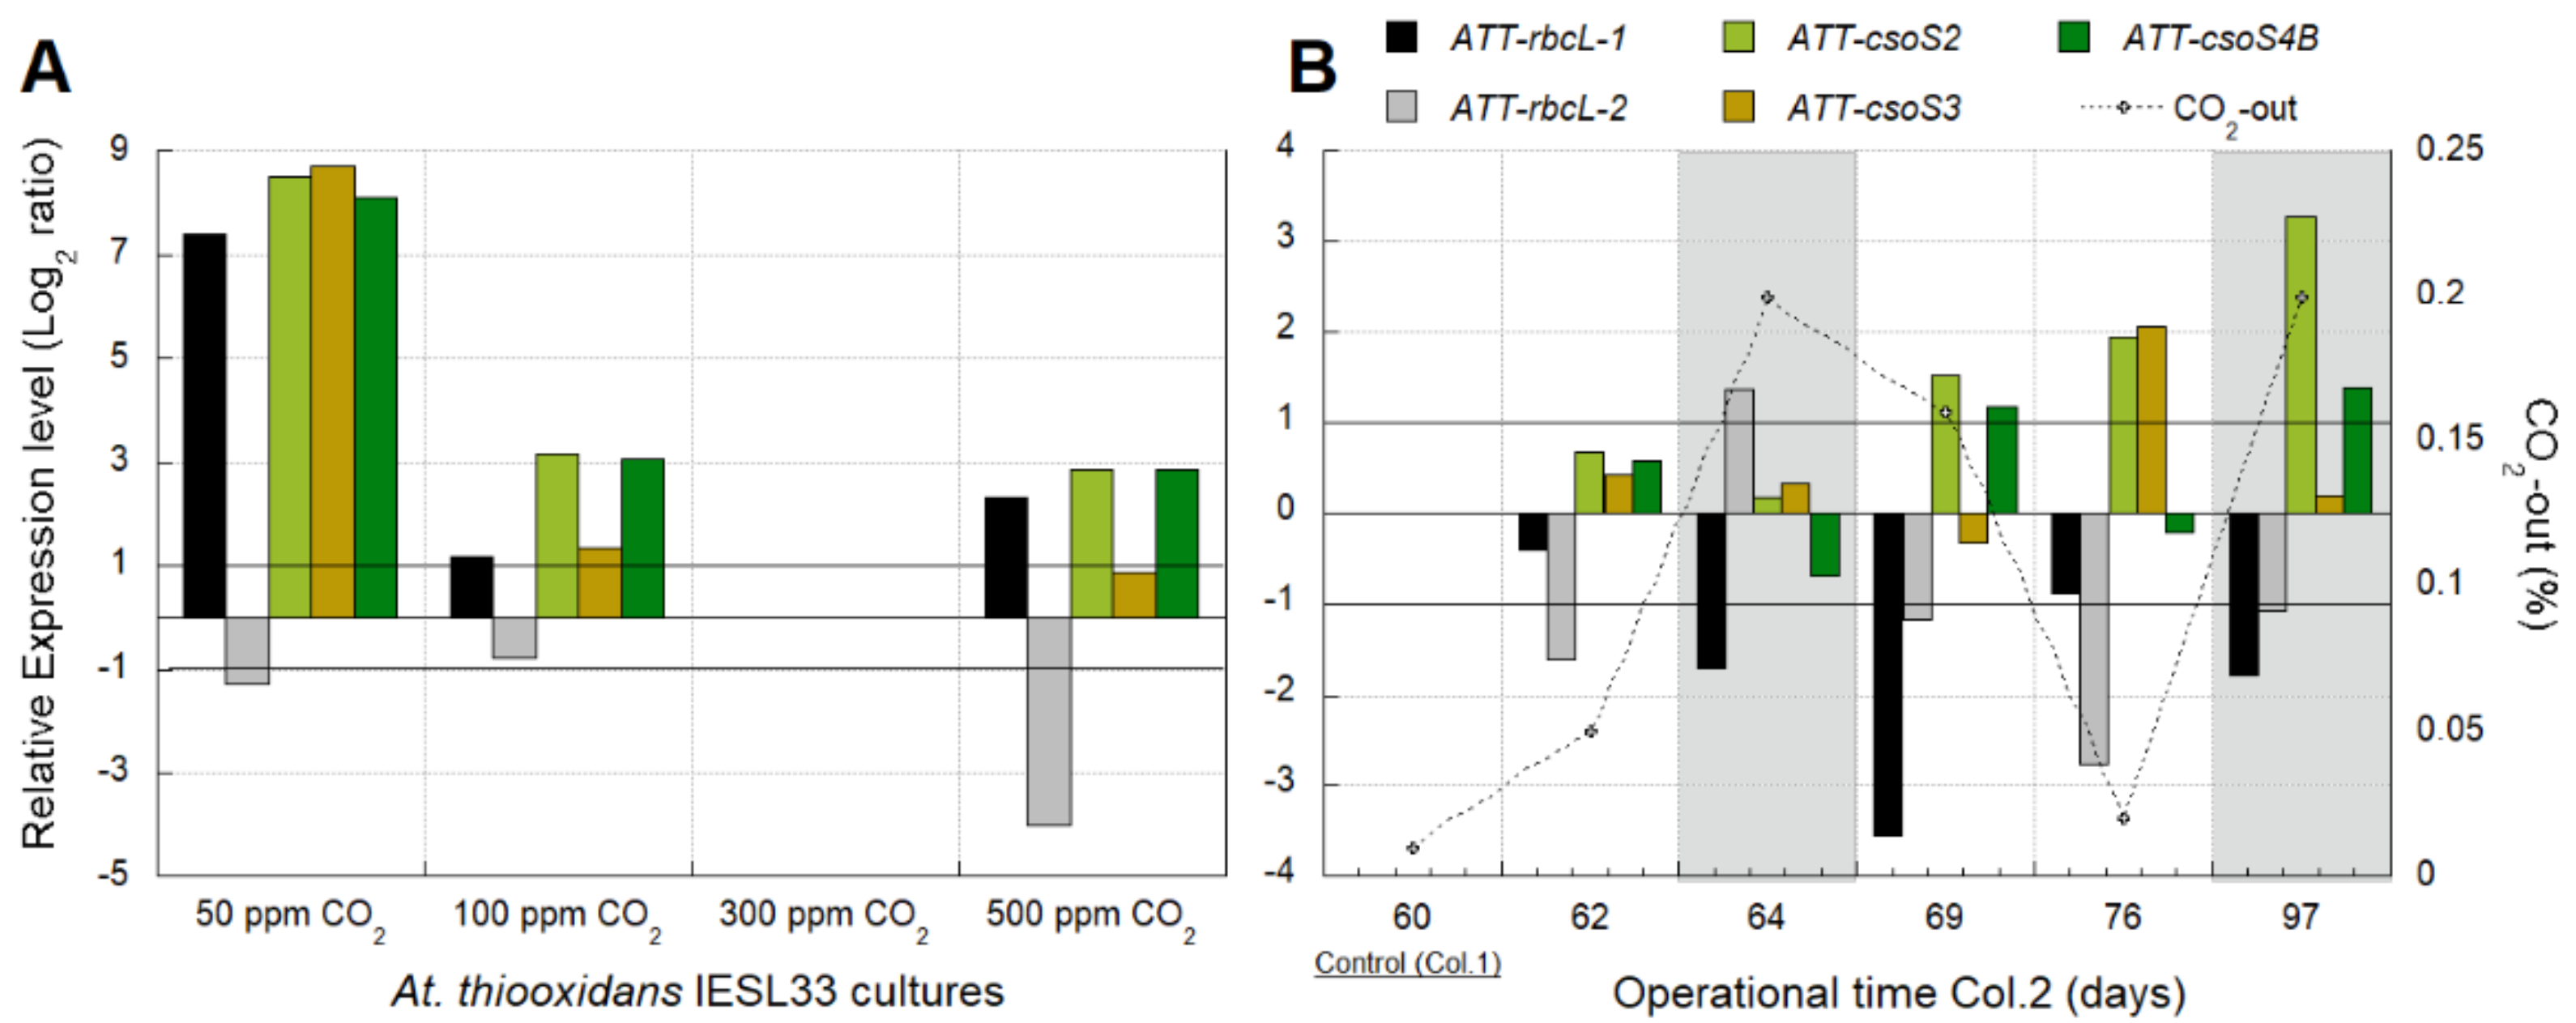
Culture batch reactors of At. thiooxidans (ATT) IESL-33 at 50 ppm, 100 ppm, and 500 ppm of CO2 showed an over-expression of ATT-rbcL-1, ATT-csoS2, ATT-csoS3, and ATT-csoS4B genes, and an under-expression of ATT-rbcL-2 gene relative to the control condition (300 ppm CO2) (Figure 3A). The highest over-expression of these genes occurred in the culture growing with 50 ppm of CO2 (Figure 3A), suggesting an apparent transcriptomic response to low CO2 availability. The ATT-csoS3 gene associated with carbonic anhydrase [44] was significantly over-expressed only at relatively low CO2 levels (Figure 3A), as was also observed in the column test (Figure 3B).
In the column test (col.2), non-significant differences were observed in the expression level of the ATT-rbcL-1 gene among samples with relatively low CO2 levels (0–500 ppm CO2-out). Meanwhile, this gene’s under-expression was evident in samples with relatively high CO2 levels (1500–2000 ppm CO2-out) (Figure 3B). Besides this, the over-expression of the ATT-rbcL-2 gene was evidenced at day 64 with 2000 ppm CO2-out.
The transcription dynamics of the ATT-csoS3 gene were similar to the ATT-rbcL-1 gene, except after the second decrease of CO2 on day 76 (200 ppm CO2-out) when ATT-csoS3 was over-expressed (Figure 3B).

3.2.3. Industrial Validation of Transcriptomic Markers Associated with CO2 Fixation

Transcriptional analyses were performed using industrial strips sampled for aeration (Table 2) because the cDNA of strips S-410-D1, S-410-M2, S-413-D did not show PCR amplification for any of the candidate marker genes. This result was possibly due to the absence of the target microorganisms or the absence of the expression of those genes. Besides this, some genes like ATT-csoS2, ATT-csoS3, and rbcL2 from At. ferrooxidans (AFE) did not show amplification in any examined industrial samples (Figure 4). The absence of significant differences (Log2 ratio < 1) in the relative expression level of the ATT-rbcL-1 gene among S-410-M0, S-410-D4, and S-410-M4 (Figure 4A) suggested that similar levels of CO2 were available in these samples. Only the PLS solution from S-410-D4, obtained from the drop four weeks after aeration interruption, showed a slight gene over-expression, which allows us to infer a relatively low CO2 availability for At. thiooxidans. A different response was observed in At. ferrooxidans AFE-rbcL-1 gene, which was slightly over-expressed in S-410-D2 (obtained from the drop two weeks after aeration interruption), and no expression differences were observed in the rest of the samples (Figure 4A). The ATT-rbcL-2 gene was over-expressed in samples S-410-D2 and S-410-M4 (Figure 4A) and partially aerated strip S-414-D (Figure 4B).

3.3. Biomarkers for N2 Availability in L. ferriphilum

3.3.1. Identification of Transcriptomic Markers Associated with N2 Availability

Transcriptional analyses were performed with PLS samples from the column test (col.3), where NH4+ concentration was modified. The relative gene expression of nifH, amt, glnA, and glnB genes from L. ferriphilum were determined using two validated reference genes (16S rRNA and alaS).
Lower expressions of nifH (involved in dinitrogen fixation, Table 3), glnA, and glnB (involved in the assimilation of ammonium, Table 3) were detected in most of the samples when the NH4+ concentration was increased in the bioleaching column col.3 (Figure 5). The transcriptional pattern observed for glnA and glnB genes was different in the first sample (operation day 76) after the increment of NH4+ (day 62). On the contrary, the amt gene (involved in the transport of ammonium, Table 3) was only under-expressed when a high level of NH4+ was present in col.3 (Figure 5). All genes were over-expressed on day 104, 13 days after the second interruption of the NH4+ supply in the column.

3.3.2. Industrial Validation of Transcriptomic Markers Associated with N2 Metabolism

Transcriptional analyses for industrial validation of biomarkers associated with nitrogen fixation were performed using sampled strips (Table 2). Some genes like glnA did not show amplification in any of the industrial samples. The relative gene expression was analyzed using two validated reference genes (16S rRNA and alaS).
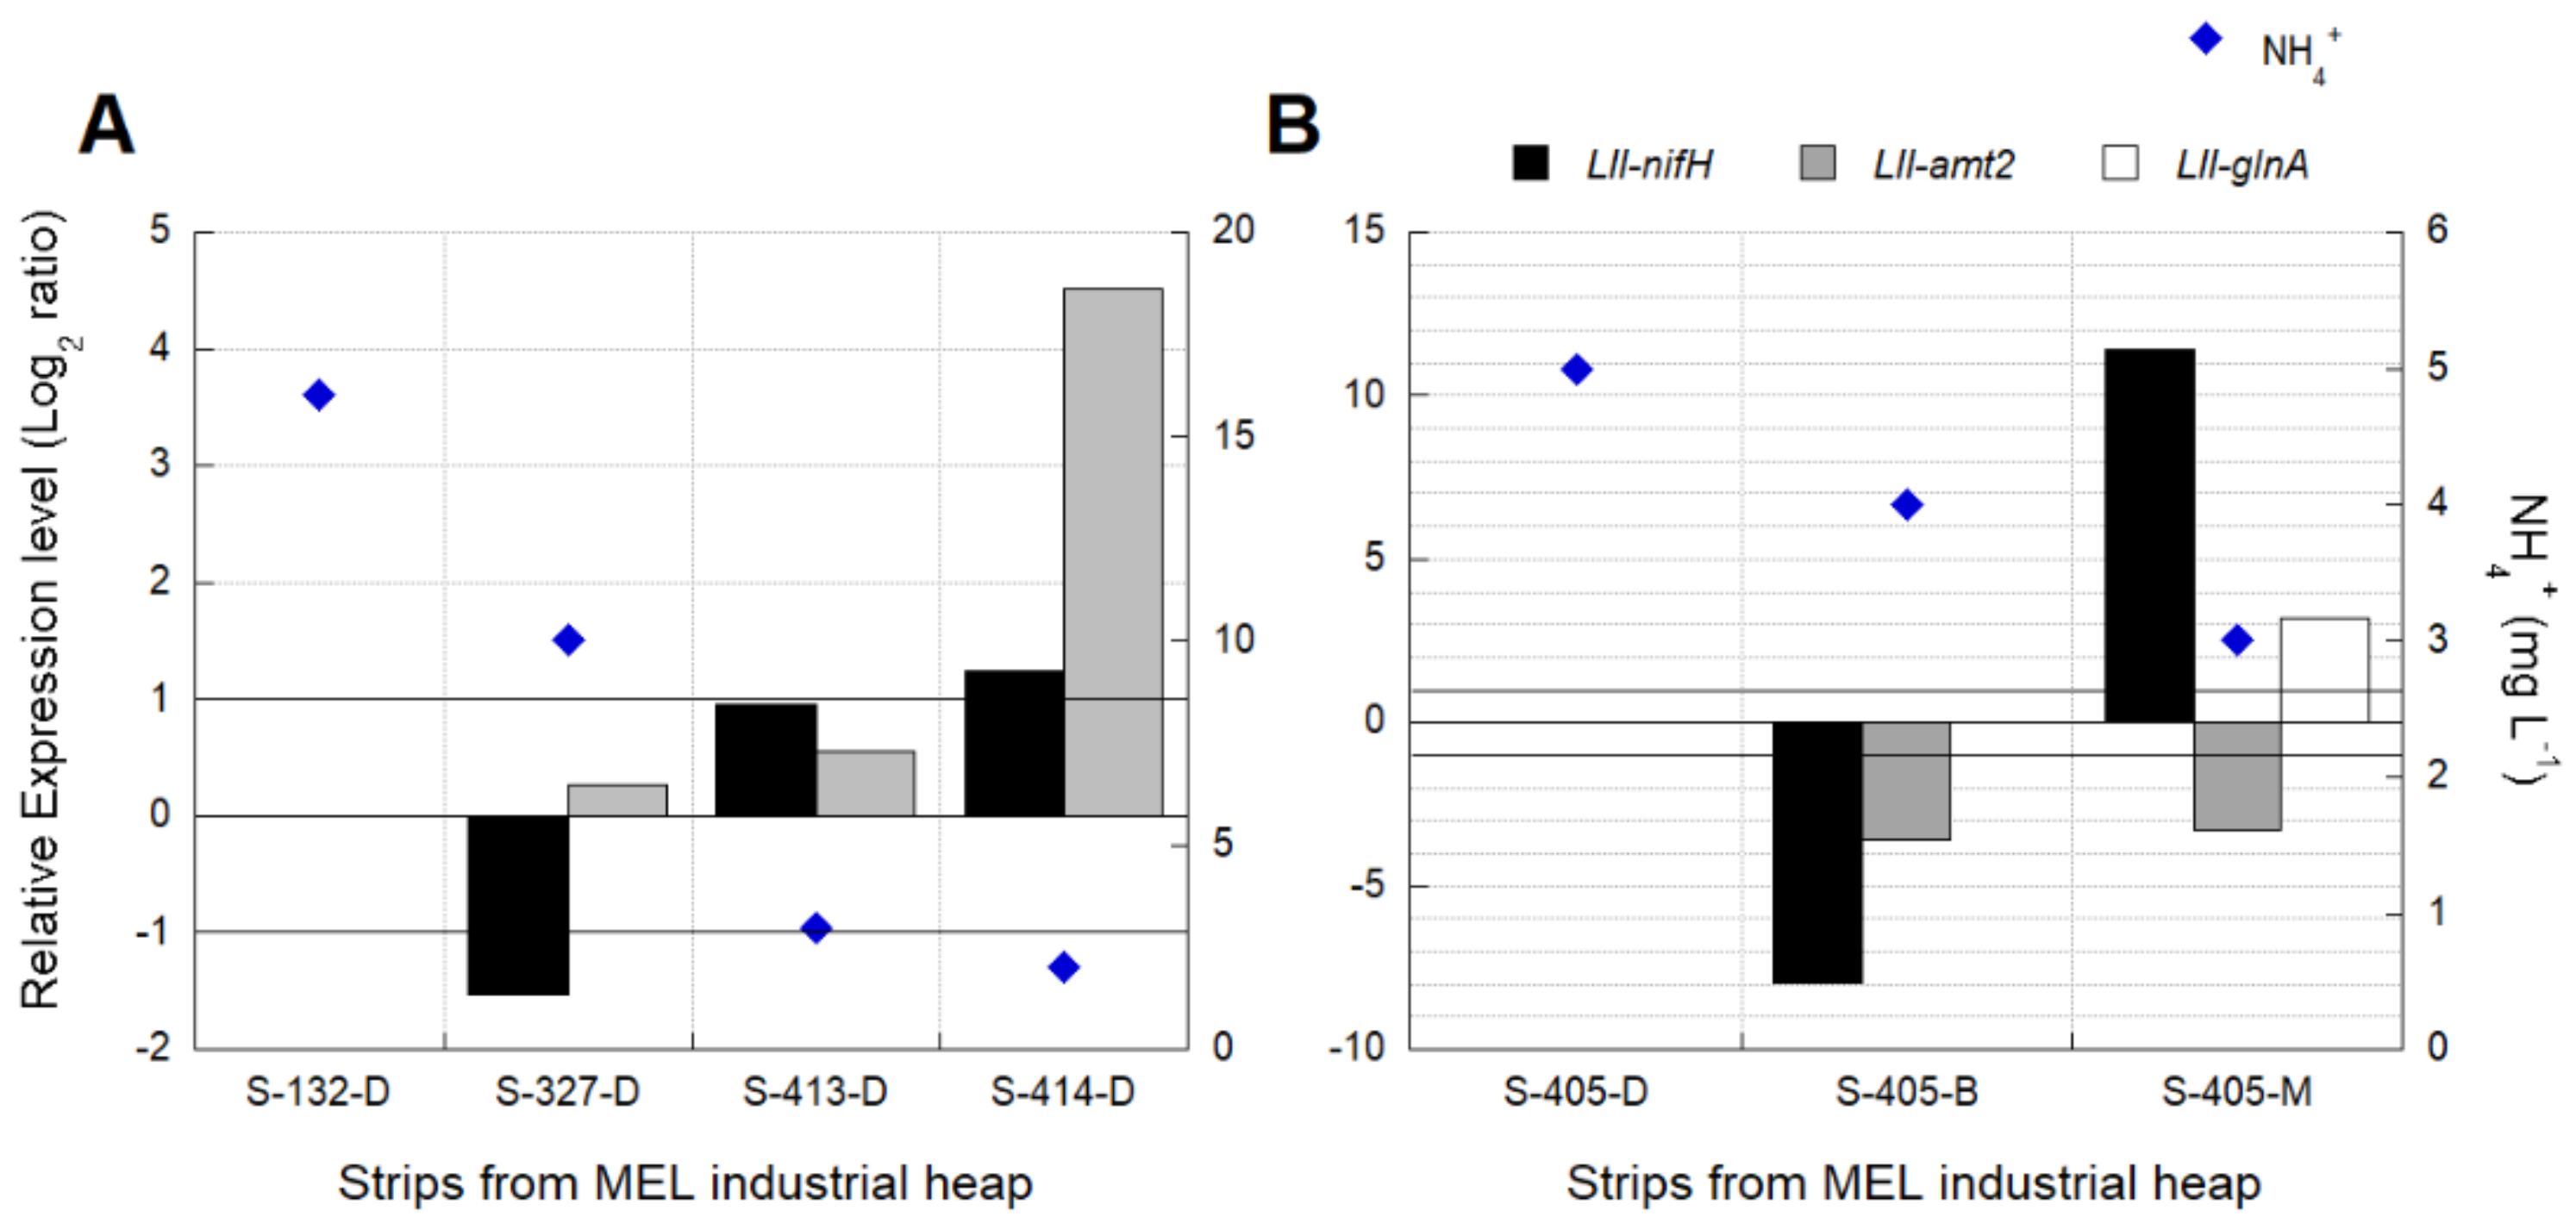
An increase in the expression of nifH was observed when the NH4+ level decreased to 3 mg L−1 in the industrial leaching solutions analyzed (Figure 6). The pattern observed in the amt2 and glnA gene’s transcription does not relate to the registered concentration of NH4+. It is crucial to consider that the level of NH4+ reached in the columns was higher than the high level reported from the industrial solutions.

3.4. Biomarkers for Osmotic Stress in L. ferriphilum

3.4.1. Effect of SO42− Concentration on Growth and Activity of L. ferriphilum Strains DSMZ 14647 and IESL-25

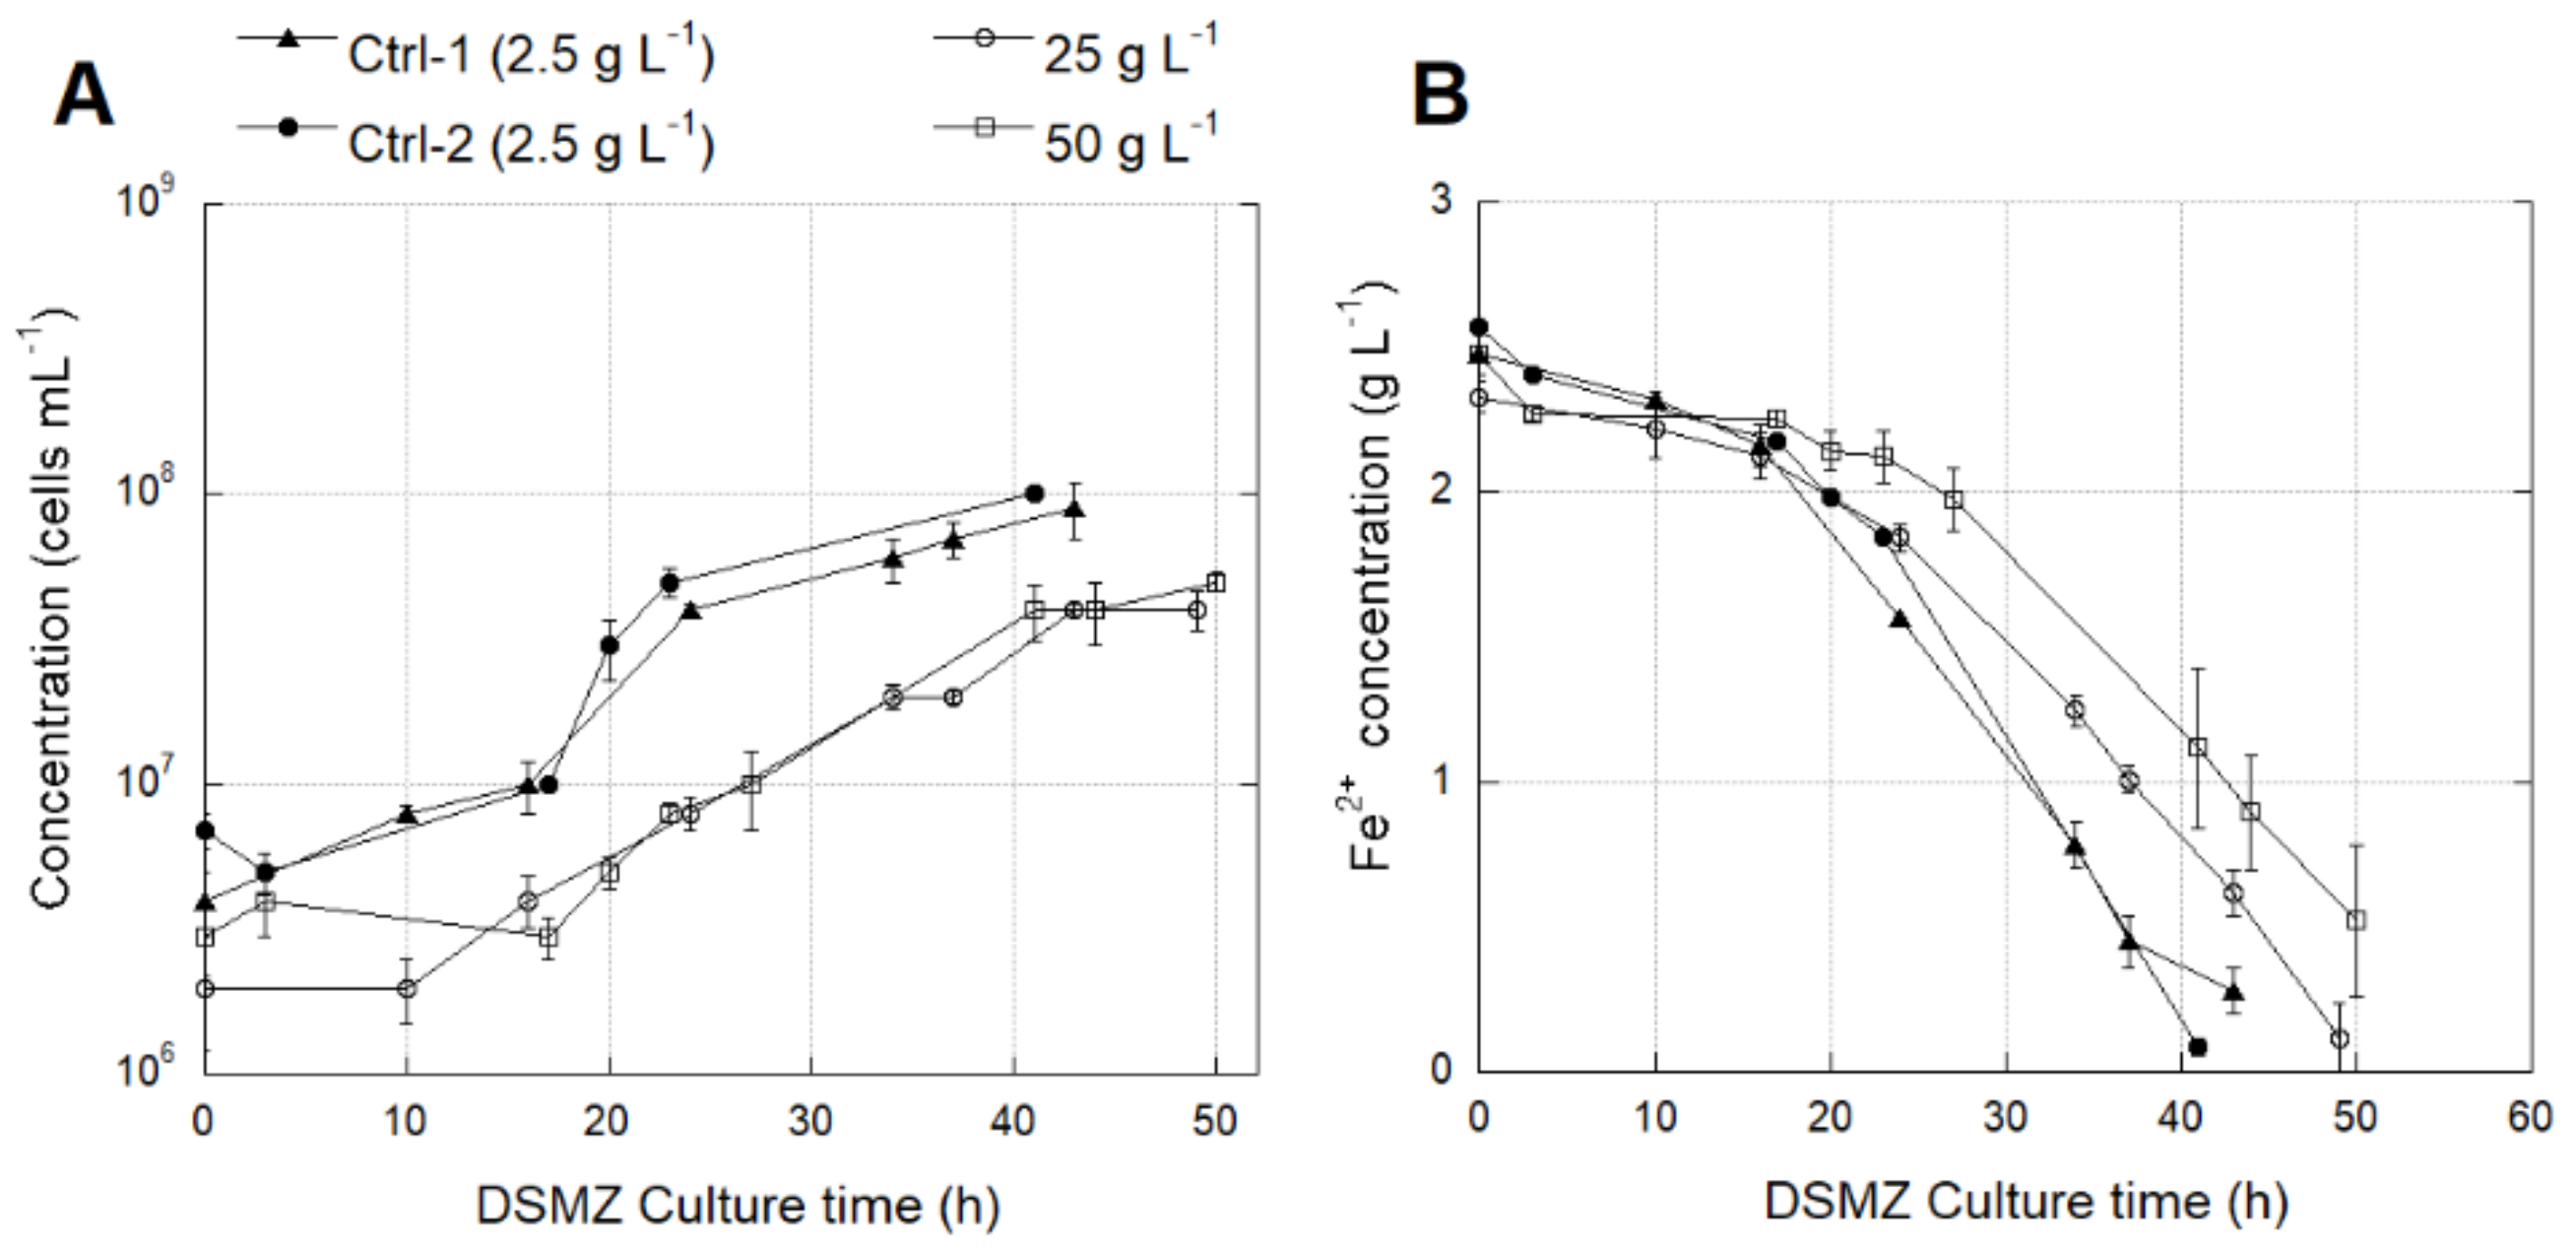
The L. ferriphilum strain DSM 14647 growth rate was significantly lower (p < 0.0001) at 25 and 50 g L−1 SO42− than at 2.5 g L−1 (Figure 7A) (Table S3). However, there was not enough data to confirm the significance of the decrease in the oxidation activity measured by the Fe2+ consumption at higher SO42− concentrations (Figure 7B) (Table S3).
The native L. ferriphilum strain IESL-25 growth rate was significantly lower (p < 0.0001) at 25 and 50 g L−1 SO42− than at 2.5 g L−1 SO42− (Figure 8A). The negative effect of high SO42− levels was evidenced by the significant decrease (p < 0.05) in the rate of Fe2+ consumption in cultures growing with 50 g L−1 SO42− (Figure 8B) (Table S3).

3.4.2. Identification of Transcriptomic Markers Associated with Osmotic Stress

Transcriptional analyses were performed with pure culture samples (three conditions on triplicate) of L. ferriphilum DSMZ 14647 growing under different SO42− concentration and PLS samples from the column test (col.4) where SO42− concentration was modified. The relative gene expression of treZ, treY, lamb, treX, galU, and gadB genes was analyzed using two validated reference genes (16S rRNA and alaS).
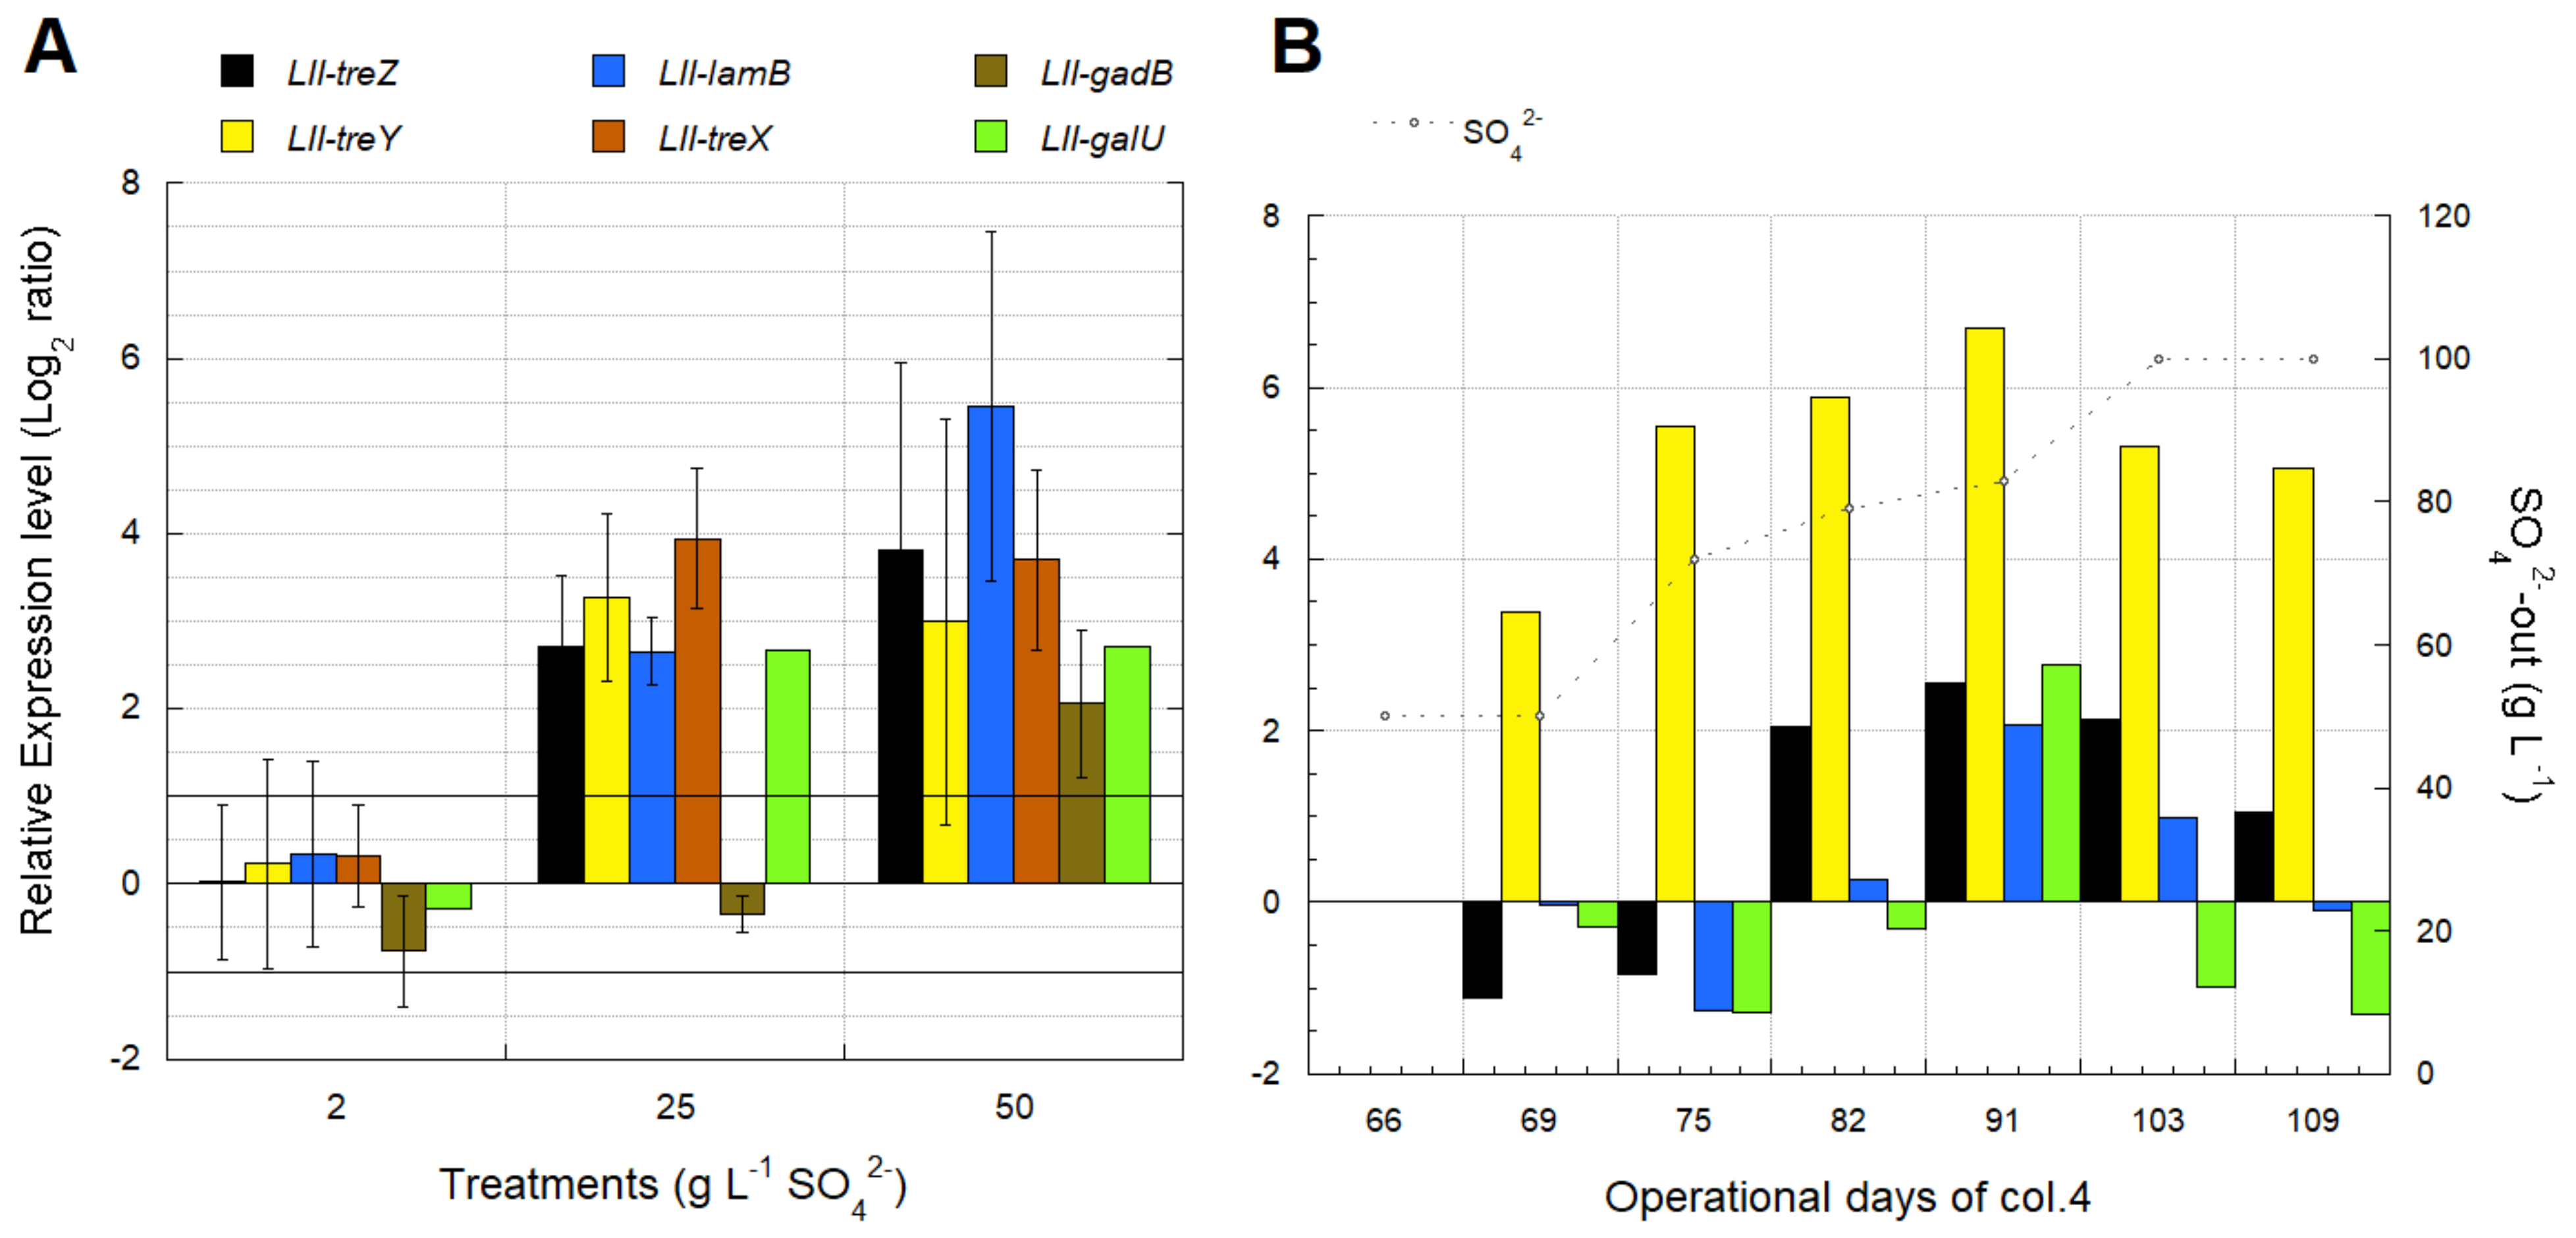
The transcriptional dynamic of the selected genes involved in the trehalose synthesis pathway in the reactor culture of L. ferriphilum type strain DSM 14647 showed an increase at high SO42− levels (Figure 9A) relative to the control sample (2 g L−1 SO42−). The transcription of the gadB gene only increased when culturing with 50 g L−1 SO4 (Figure 9A). Non-significant gene transcription differences were observed between the triplicates of L. ferriphilum DSMZ 14647 control cultures growing on 2.5 g L−1 SO4 or between the different analyzed genes in the pure culture tests (Figure 9A).
Four of the six genes associated with compatible solutes in L. ferriphilum were quantified in the bioleaching column test (col.4) after the first and the second increment of sulfate concentration in the feeding solution (Figure 9B) and relative to the non-intervened sample used as control (day 67). The over-expression of treYZ genes remained stable during both sulfate interventions performed on operation days 68 and 103, respectively (Figure 9B). The lamB and galU genes were only over-expressed on day 91, after 23 days since the first sulfate increment from 50 to 80 g L−1. The gene of the trehalose biosynthetic pathway OtsAB (I) represented by the gene galU maintains its expression level despite sulfate increase. A similar result was observed in the expression level of the lamB gene related to trehalose transport (Figure 9B).

3.4.3. Industrial Validation of Transcriptomic Markers Associated with Osmotic Stress

Transcriptional analyses for industrial validation of biomarkers associated with osmotic stress were performed using the sampled strips (Table 2). Some genes like treX, gadB, and galU did not show amplification in the industrial samples. The relative gene expression was analyzed using the two validated reference genes (16S rRNA and alaS).
The treZ, treY, and lamB genes from L. ferriphilum were over-expressed in industrial PLS samples related to high SO42− concentrations (Figure 10A,B). The couple treYZ was over-expressed either in industrial strips obtained during the same sampling activity (Figure 10A) as in strips obtained during independent samplings (Figure 10B) with concentrations over 90 g L−1 SO42.

3.5. Biomarkers for Iron and Sulfur Oxidation in Sulfobacillus sp. CBAR13

3.5.1. Effect of the Energy Source on Growth of Sulfobacillus sp.

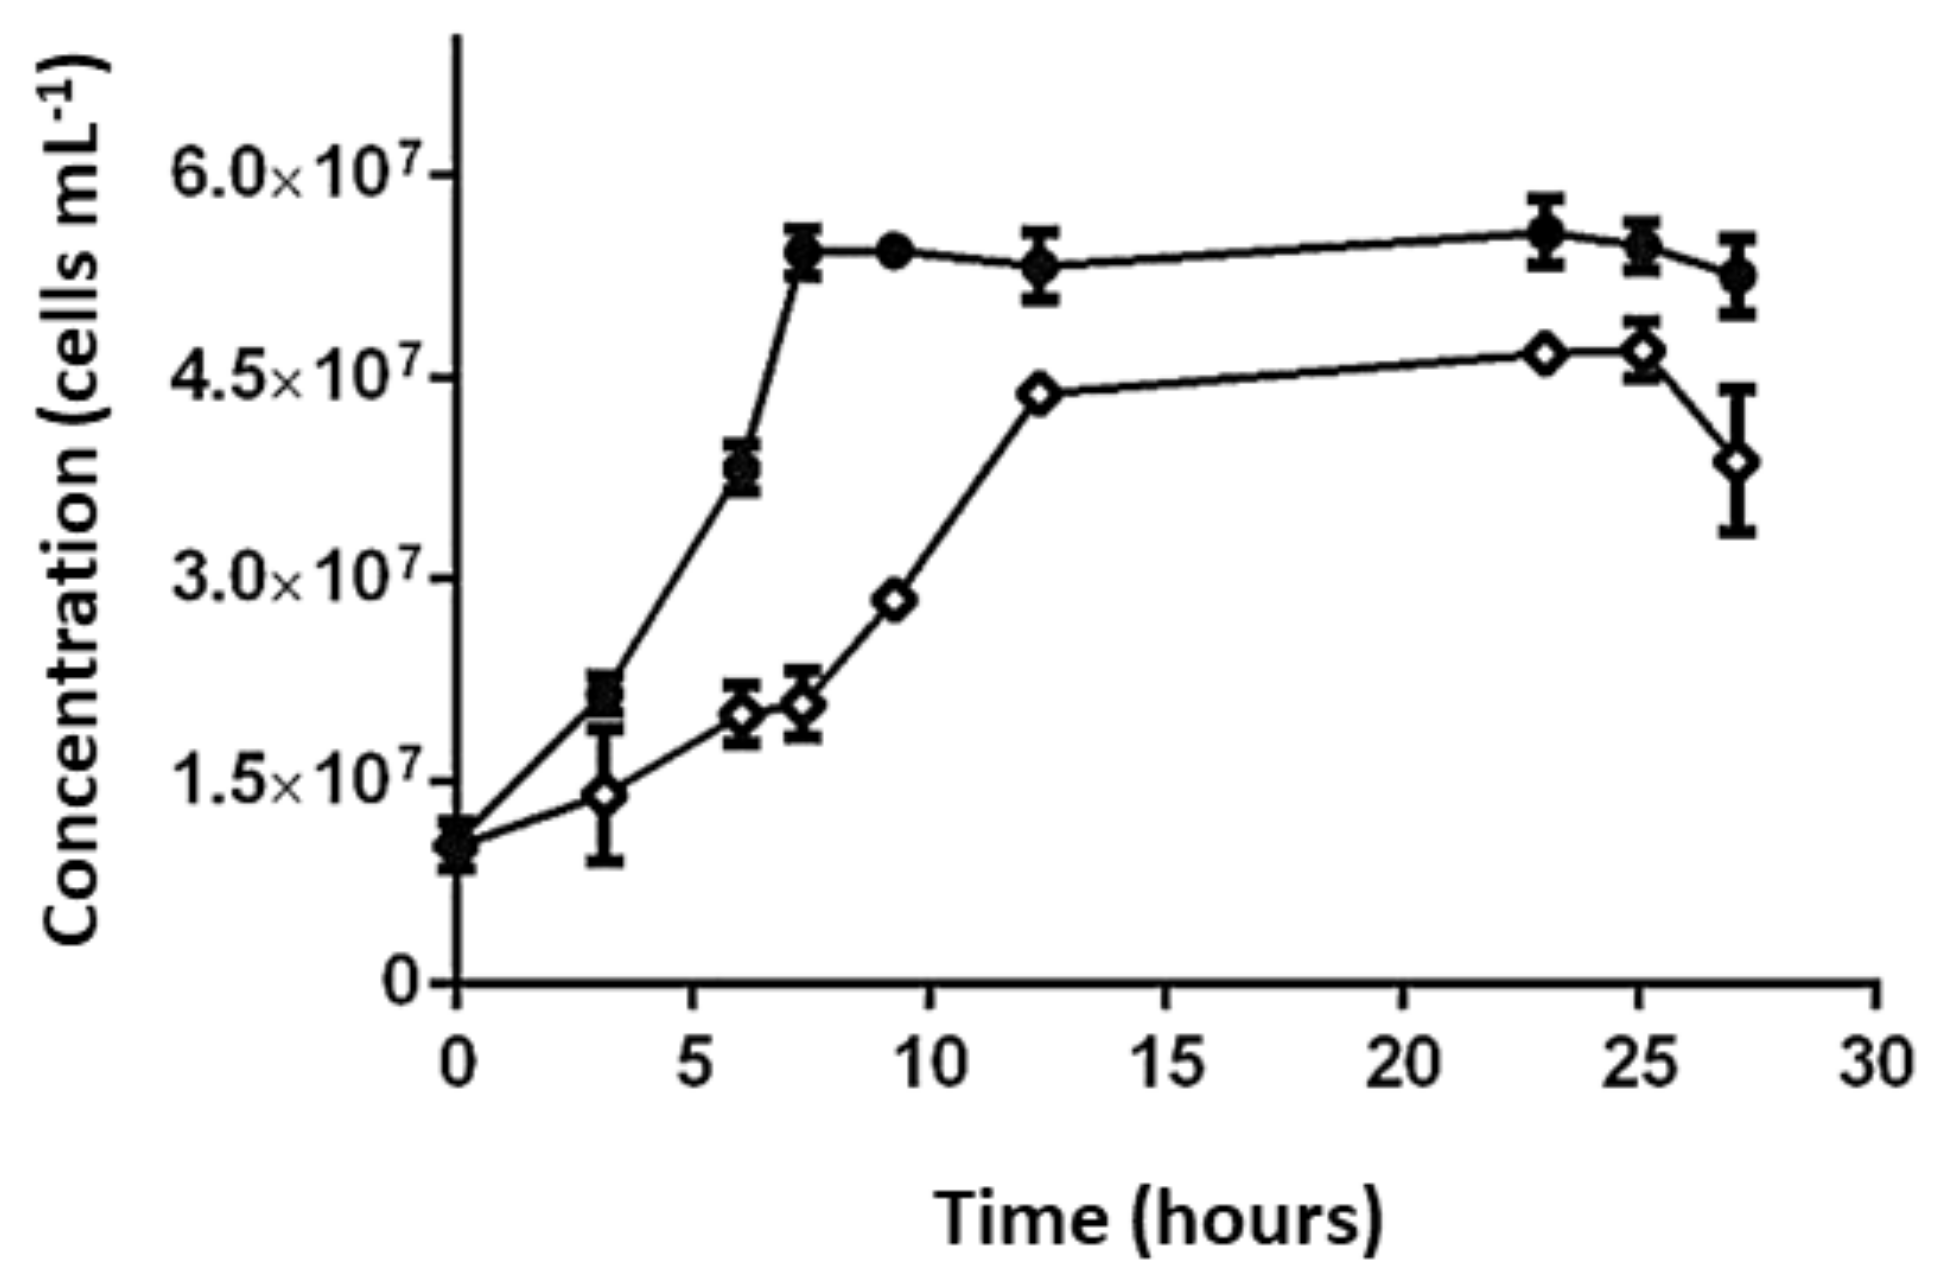
The Sulfobacillus sp. strain CBAR13 growth rate was significantly higher on SS medium with iron as the energy source than under DS medium with tetrathionate (Figure 11).

3.5.2. Identification of Transcriptomic Markers Associated with Ferrous and Sulfur Oxidation

Transcriptional analyses were performed with pure culture samples (two conditions on triplicate) of Sulfobacillus sp. CBAR13 growing with different electron donors (Fe2+ and sulfur). The relative gene expression of cytbdl, sulf, chypII, carb, tehy, and fadp genes (Table 2) were analyzed using the validated reference gene gyrA.
Transcriptional dynamics of the cytbdl, sulf, chypII, and carb genes from culture batch reactor samples of Sulfobacillus sp. CBAR13 growing on SS medium (50 mM FeSO4 7H2O) showed a significant over-expression from one to six-folds relative to one of the replicates growing on DS medium (2 mM K2S4O6) (Figure 12A). Besides which, a significant under-expression from five to nine-folds for tehy and fadp genes associated with tetrathionate oxidation (Table 3) was observed in cultures growing on SS medium (Figure 12A). Nonsignificant transcriptional differences were observed between the triplicates of Sulfobacillus sp. CBAR13 growing on DS cultures (Figure 12A).

3.5.3. Industrial Validation of Transcriptomic Markers Associated with Ferrous and Sulfur Oxidation

Transcriptional analyses for industrial validation of biomarkers associated with ferrous/sulfur oxidation (Table 2) showed a significant increment near six-folds on the gene tehy transcription in strip S-327 with 0.04 g L−1 Fe2+ relative to strip S-132 with 0.24 g L−1 Fe2+ (Figure 12B and Table 2). Inversely, an under-expression was observed for sulf and chypll genes in the industrial sample with less Fe2+ availability (S-327) (Figure 12B). The relative gene expression was analyzed using the validated reference gyrA gene.
The analyses were performed using the sampled strips (Table 2). PCR amplification was not obtained from cDNA of strips S-413 and S-414 for any candidate marker genes. Genes cytbdl, carb, and fadp did not show amplification in the industrial samples (Figure 12B).

4. Discussion

The results obtained for validating genetic markers associated with O2 availability within the heap were previously reported [11].

4.1. Carbon Fixation

It is known that bioleaching processes rely on O2 to promote the oxidation processes for sulfide mineral dissolution and on CO2 as the carbon source for the growth of microorganisms, which catalyze the oxidation. An important issue in heap bioleaching technology is to install homogeneous aeration for providing enough O2 and CO2 in the environment to improve operational performance. The pH, temperature, ion concentration, carbonate content in the mineral, altitude, and activity of heterotrophic microorganisms also influence the CO2 availability [28]. A significant decline of microbial oxidation rates was evidenced in CO2 depleted zones in a controlled heap-like environment, sealed large columns operated isothermally at 40 °C and supplemented with additional CO2 [45]. Besides, the effect of CO2 was also determined in agitated reactors, and increased copper extraction was observed when CO2 was supplied at 4% (4000 ppm) [46].
The results obtained from reactor experiments of At. thiooxidans growing at different CO2 concentrations (Figure 2A,B) confirm previous studies regarding the necessity of elevated CO2 concentrations for optimum growth in At. thiooxidans [47]. On the contrary, it has been reported that the closely related species At. ferrooxidans that use the same CBB cycle reach an optimum specific growth rate (µ) at 100 ppm of CO2 [28]. However, At. thiooxidans maintains an increasing µ tendency until 3000 ppm of CO2 [47] while a decline of µ was registered in At. ferrooxidans growing at CO2 concentration above 100 ppm [28].
The characterization of the microbial community composition after air feeding interruption in col.2 evidenced a decrease of acidithiobacilli and L. ferriphilum and a similar abundance, or even an increase, of heterotrophic microorganisms like Thermoplasma sp. and Ferroplasma acidiphillum (Supplementary Figure S1). Then, the increased concentration of CO2 on the output of col.2 (Figure 3B) was probably due to heterotrophic microbial metabolism. In this experiment, the air was displaced with an equal flux of N2, so the gas-in mass input changes were discarded.
Previous works have shown that the growth of At. thiooxidans is favored by an elevated concentration of CO2 (2500 ppm) [47]. Our results show that ATT rbcL-1 transcription was associated with relatively low CO2 availability (Figure 3A,B). Similar results in the transcription of rbcl-1 have been reported for At. ferrooxidans [9]. The over-expression of ATT rcbL-2 observed at the first airflow interruption in col.2 (Figure 3B) suggests that the transcription of this gene could be associated with relatively high CO2 levels, as it has been previously reported for other species [48]. It is generally concluded that RubisCo type II enzymes are adapted to function at low-O2 and medium to high-CO2 environmental levels [49], a feature supported by these results.
Apparently, relatively low CO2 levels induced an increased transcription of ATT rbcL-1 and ATT csoS3 genes, as we have previously reported for acidithiobacilli [9]. The structural carboxysome csoS2 and csoS4B genes were over-expressed at both high and low CO2 levels. A plausible explanation could be the differences in the turnover between the structural (e.g., CsoS2 and CsoS4B) and functional proteins (e.g., CsoS3), or it indicates a CO2-storage function in carboxysome. More evidence is required to confirm these hypotheses.
The transcriptional dynamics observed in the industrial samples (Figure 4A,B) support previous findings that At. thiooxidans and At. ferrooxidans have different strategies to respond to changes in CO2 levels, although both species share the same CO2 uptake/fixation mechanism [50].
The over-expression of the ATT rbcL-2 gene (Figure 4A,B) is probably suggesting a response of At. thiooxidans to high CO2 and low O2 levels as has been recognized for this gene [49] and observed in pure cultures and bioleaching column tests as well (Figure 3A,B).
The consistent results of transcriptional dynamics obtained from the pure culture at the laboratory level, controlled column tests, and industrial samples allowed us to obtain real indicators for CO2 availability in bioleaching systems. The industrial application of those indicators in monitoring forced aeration in a heap could influence the control and design of present and future bioleaching operations, respectively.
Finally, we show that the growth and the oxidation activity of At. thiooxidans IESL-33 was slower when the cells were exposed to a low concentration of CO2, also accompanied by a lower metabolic activity (Figure 2 and Table S3), confirming the results of previous works [28]. Furthermore, we found that changes in the airflow input in bioleaching column tests and the MEL heap’s industrial operation influence the microbial population (Supplementary Figures S2 and S3). These changes can be related to metabolic shifts that microorganisms must overcome during periods of low oxygen concentration. Finally, the transcriptional analysis of the biomarkers for CO2 metabolism of At. thiooxidans, rbcL-1 and rbcL-2 showed a similar response to that observed in At. ferrooxidans but at different CO2 or O2 concentrations.

4.2. Nitrogen Metabolism

The ore in a heap provides the micronutrients required for the microbial community’s activity responsible for sulfide minerals dissolution. However, a supply of macronutrients, such as ammonium, potassium, and phosphate could be needed [51]. There is, as well, an input of ammonium in the system, caused by the ability of some microorganisms like At. ferrooxidans and some members of Leptospirillum genus to fix nitrogen from the atmosphere [8,51,52].
The ammonium concentration measured at the heap is on average 5.5 mg L−1, and higher levels (up to 10 mg L−1) were observed after the start of irrigation of some new strips (Figure S4). Similar levels were reported in leaching solutions on a heap bioleaching process from Talvivaara Mining Company [51]. Over-expression of genes involved in the nitrogen fixation (nifH) was observed in the column test when NH4+ concentration decreased up to 3 mg L−1, and a similar behavior was observed in the industrial leaching solutions analyzed (Figure 6).
Previous results have shown a significant increase of the nifH expression level after 110 days of heap operation and an opposite profile for the amt gene of L. ferriphilum. Even though we have not measured the ammonium concentration in that opportunity, the results insinuated a higher availability of ammonium at the initial stages of the process and a metabolic shift to N2 fixation when the operation time progressed. The results from ammonium analysis of randomly selected strip PLSs confirmed the occurrence of ammonium levels above the average during the initial irrigation of some strips from the first lift (Figure S4).
A high diversity of L. ferriphillum was observed in the industrial heap with a predominance of sequences from Group IIc [6,37]. Group IIc is composed of strains with and without the capacity for N2 fixation [8,52,53,54]. The N2 fixation capacity was confirmed in the IESL-25 strain [54] isolated from the industrial heap [55]. Different gene localization was observed in the nitrogen fixation operon of the pan-genome of Leptospirillum spp. retrieved from the heap [37].

4.3. Osmotic Stress

The primary response of bacteria to exposure to a high osmotic environment is the accumulation of specific solutes like K+, glutamate, γ-aminobutyrate, trehalose, proline, and glycine betaine at concentrations that are proportional to the osmolarity of the medium [56].
Trehalose is a sugar that has been described as the compatible solute mainly used by L. ferriphilum in response to osmotic stress. Increments of trehalose synthesis until 59 folds after exposition to high concentrations of MgSO4 have been previously reported [57]. Genes involved in the three trehalose biosynthetic pathways: GalU-OtsAOtsB (I), TreY-TreZ (V), and TreS (IV) [58,59], were identified in the genome of L. ferriphilum Sp-Cl [54]. The transcription dynamics of genes involved in the TreYZ pathway observed in this study from pure cultures, controlled bioleaching columns, and industrial bioleaching heap (Figure 9 and Figure 10) confirms that L. ferriphilum prefers the TreYZ pathway under osmotic stress triggered by high SO42− concentrations.
The over-expression of treYZ genes observed in all the mentioned scenarios (Figure 9 and Figure 10) confirms the participation of the TreYZ pathway in the response to osmotic stress in all the analyzed sulfate concentrations in L. ferriphilum and the treYZ genes as industrially validated transcriptomic markers for the monitoring of the osmotic stress in bioleaching systems.
The UDP-glucose pyrophosphorylase enzyme coded by the galU1 gene [60] catalyzes a reaction between the glucose-1-phosphate and the UTP to form UDP-glucose. UDP-glucose participates in glycogen synthesis, which, in turn, can be used as a precursor for the trehalose synthesis by the TreYZ pathway [61,62]. Previous studies report that the simultaneous over-expression of galU, otsAB, and treYZ genes triggers a six-fold increment in the trehalose production in Corynebacterium glutamicum [60,61]. The results of the present study allow us to infer that L. ferriphilum type-strain (DSMZ 14647) and L. ferriphilum “wild” strains from the industrial bioleaching heap use the TreYZ pathway to increase the trehalose synthesis under prolonged conditions of osmotic stress (Figure 9A,B).
The lamB gene expression is associated with the trehalose transport from the cytoplasm to the cell periplasm. It can then be degraded to two glucose molecules by a trehalase (TreA) [63]. The over-expression of the lamB gene observed at all the analyzed sulfate concentrations (Figure 9A,B and Figure 10A) confirms that this gene is also transcribed by L. ferriphilum in response to osmotic stress (Figure 9 and Figure 10). It is possible to infer that L. ferriphilum can regulate the intracellular concentration of solutes by lamB gene transcription when trehalose synthesis has been increased by the co-transcription of treYZ/galU genes.
The transcription of the gadAB genes is associated with the synthesis of the glutamate decarboxylase, a pyridoxal 5′-phosphate-dependent enzyme that catalyzes the glutamate conversion producing λ-aminobutyric acid (GABA) by an irreversible decarboxylation reaction [64]. From the gadB transcription-dynamic results observed only in the pure culture tests (Figure 9A), it is reasonable to assume that glutamate is probably not the compatible solute preferred by L. ferriphilum under osmotic stress conditions. This issue agrees with previously reported results confirming trehalose as the preferred compatible solute in L. ferriphilum [57]. The gad gene does not participate in trehalose synthesis, but it has been reported that the enzyme is required for trehalose protection against acid stress. The over-expression of both genes simultaneously could indicate the occurrence of acid stress [65].
The congruent transcription dynamic observed from treYZ and lamB genes on the pure cultures, bioleaching-column tests, and industrial bioleaching heap certainly allow us to validate these three genes as transcriptional markers associated with osmotic stress response in L. ferriphilum. The treYZ and lamB genes can be useful for eventual metabolic monitoring of industrial copper-bioleaching processes.

4.4. Ferrous and Sulfur Oxidation

The candidate genes associated with ferrous (cytbdI, sulf, chypII, carb) and sulfur (tehy, fadp) oxidation pathways (Table 3) were over-expressed and under-expressed, respectively, in pure cultures of Sulfobacillus sp. CBAR13 growing in the presence of iron as the only energy source (SS) relative to cultures growing with tetrathionate as electrons donor (DS) (Figure 12A). The same transcriptional dynamics were observed for sulf, chypII, and tehy-genes analyzed on the industrial samples (Figure 12B), validating those genes as molecular markers for monitoring iron and sulfur oxidation in industrial heap-bioleaching systems. The cytbdI, carb, and fadp genes did not show amplification in the analyzed industrial samples, so they were proposed as putative molecular markers for the energy generation metabolism in Sulfobacillus until the industrial validation be reached. The absence of amplification could be due to the low sensibility of the primers. New primers will be designed and assayed for these three genes in future experiments.
The results observed agreement with the previously reported substrate behavior in tetrathionate-adapted and iron (II)-adapted cells of three species of Sulfobacillus genus. In that research, the authors concluded that a ‘preference’ for ferrous oxidation appears to be expected in this genus. The requirement of ferric ions for growth on tetrathionate would explain that feature [66].
While a ‘preference’ for ferrous oxidation appears to be shared in this genus, understanding how the cells convert the chemical energy to biomass will require significant further study.
Sulfobacillus genomes were predicted to possess tetrathionate hydrolase (tehy), which directs the disproportion of tetrathionate to generate sulfate, thiosulfate, and sulfur [67,68]. In this work, the tehy gene was under-expressed near ten-folds in pure cultures growing with ferrous ion as the electron donor (SS) (Figure 12A) and over-expressed near six-folds in the industrial strip with a lower Fe2+ availability (S-327) (Figure 12B, Table 2). Similar transcriptional dynamics were observed in S. acidophilus, where the tehy gene was over-transcribed 1.94-folds and under-transcribed 0.47-folds in cultures grown in the presence of sulfur and FeSO4, respectively [69].
Blue-copper proteins are members of the cupredoxin superfamily and have been found related to aerobic ferrous iron oxidation in bioleaching systems (e.g., [70]). The sulf gene related to sulfocyanin blue-copper protein from Sulfobacillus was over-expressed in the CBAR13 strain growing on SS medium with Fe2+ and under-expressed in the industrial strip with lower Fe2+ availability (Figure 12A,B). The transcription dynamics observed in the present study support the RNAseq [71], and the semi-quantitative RT-PCR [67] results showed previously. Both studies revealed an over-expression of putative genes associated with blue-copper-like proteins (sulfocyanin/rusticyanin) from S. thermosulfidooxidans on a chalcopyrite bioleaching column test when Sulfobacillus proportion in the column was >80% and the Fe2+ oxidation rate measured at 45 °C reached 10 mg L−1h−1, and during growth on ferrous sulfate, respectively.
The sulf and chypII genes associated with the sulfocyanin protein and the cbb3-type cytochrome-c-oxidase-subunit-I, respectively, and both putatively related to iron oxidation in Sulfobacillus sp. CBAR13 were under-expressed in industrial strip S-327 (0.04 g L−1 Fe2+) relative to S-132 (0.24 g L−1 Fe2+) (Figure 12B). However, the level of under-expression of those genes observed in the industrial strip with lower Fe2+ availability was less evident than the over-expression of the ferrous ion oxidation genes evidenced in the Sulfobacillus sp. CBAR13 pure cultures growing with Fe2+ as the energy source (Figure 12). The stronger iron-oxidizer L. ferriphilum present could explain this result in the studied industrial MEL strips (Figure S3). It has been reported that some electron chain components, linked to iron oxidation in Sulfobacillus sp. CBAR13, are down-regulated in the presence of a second iron oxidizer as L. ferriphilum [72]. The above is probably because the concentration of available iron is too low for utilization by Sulfobacillus sp. CBAR13. Meanwhile, L. ferriphilum can scavenge Fe2+ at concentrations far below Sulfobacillus sp. CBAR13 capabilities but that L. ferriphilum is still able to use [72].
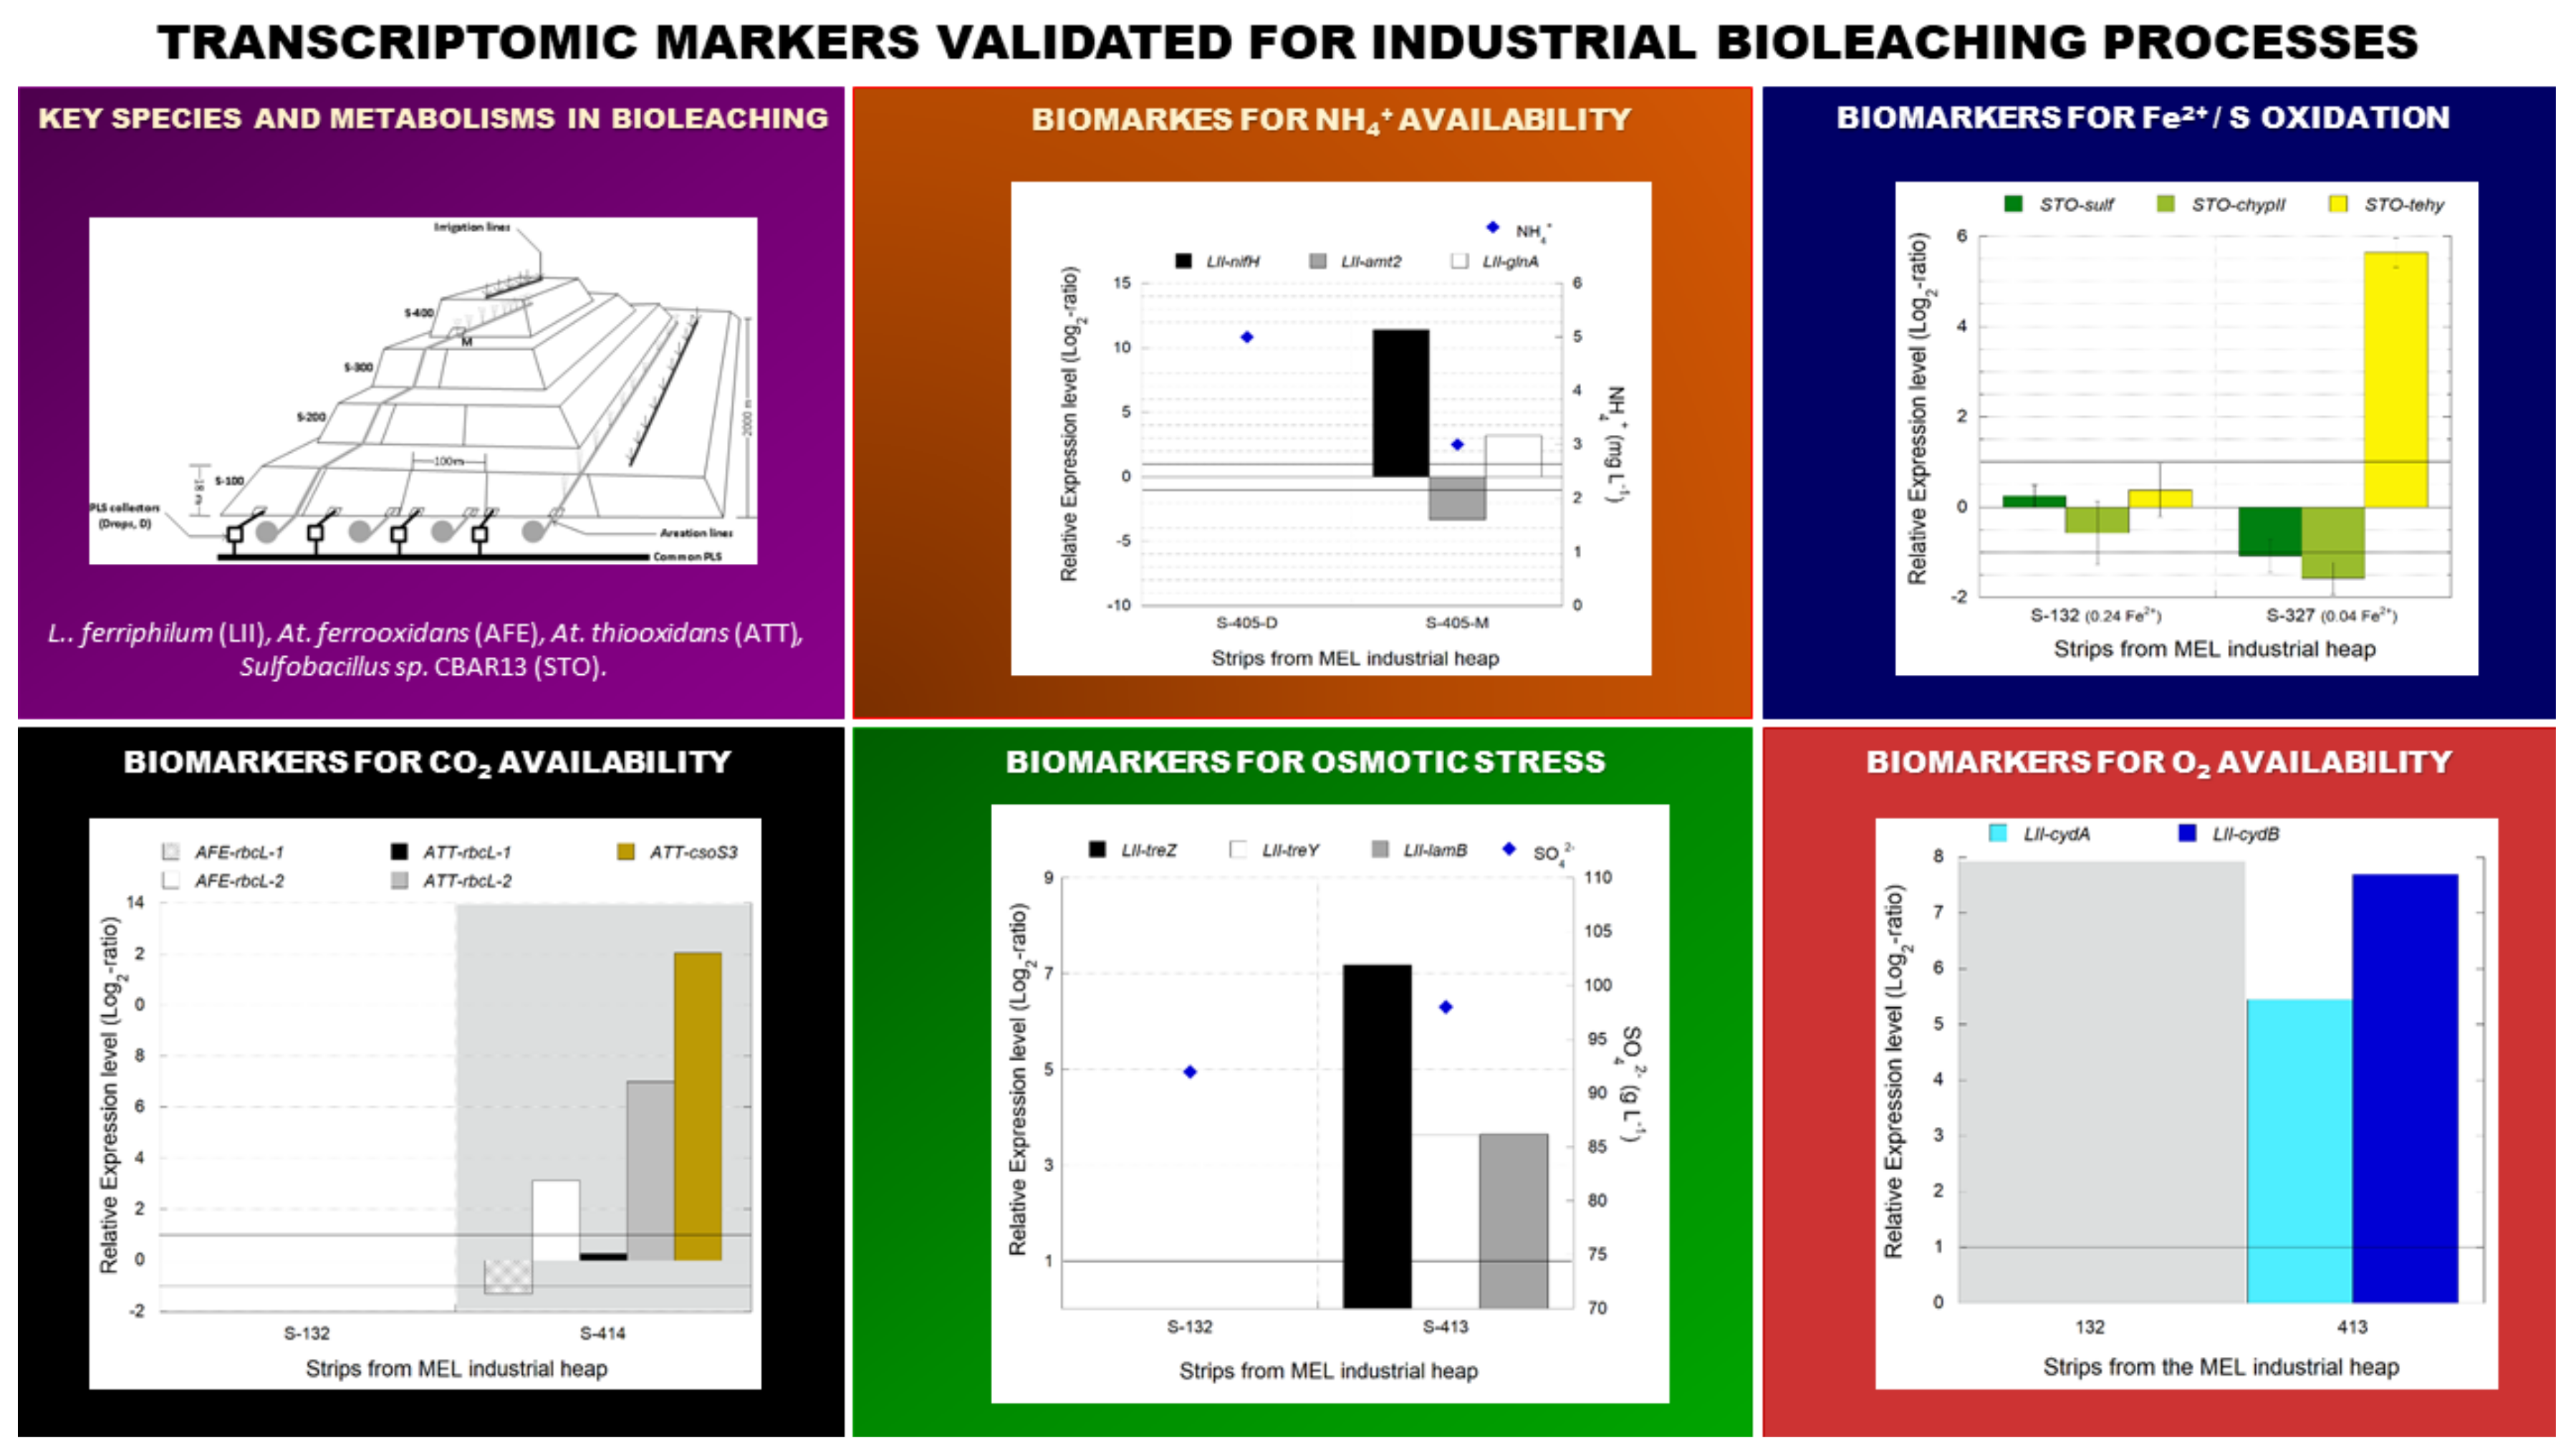
A set of 16 marker genes industrially validated throughout our work for O2, CO2, and N2 availability, osmotic stress, and sulfur/ferrous oxidation study in Acidithiobacillus sp, Leptospirillum sp., and Sulfobacillus sp., conform the first qPCR-array for monitoring critical metabolic status in copper industrial bioleaching systems (Figure 13). Furthermore, the rules constructed based on these results and already incorporated in the DSS, opportunely advise the operator about deviating parameters, that cannot be directly determined in the heap, from the optimal range for the microbial process.

5. Conclusions

The array of transcriptomic markers developed and validated in this study strongly represents the metabolic scenario involved in microbial responses to parameters that influence the industrial bioleaching heap process’s productivity and efficiency. The transcriptomic dynamics resulting from the industrial strips analyses evidence of an active response to CO2 and N2 limitation, osmotic stress, and active iron and sulfur microbial oxidation.
Molecular markers were demonstrated to be useful for indirectly assessing critical environmental variables (events), which are known as limiting factors for the rate of copper leaching in bacterial-assisted plants. The results have allowed us to provide new data on parameters that should be improved to optimize bioleaching, such as CO2 and NH4+ concentrations. Moreover, this array, applied for periodically assessing the industrial bioleaching operations, will provide the amount of data needed to get the industry knowledge required to encourage innovation. The incorporation of those results in the DSS, by means of rules, transfers the knowledge acquired to the operator.
The possibility of transferring this approach to other bioleaching plants is high because the microbial community structure inhabiting the bioleaching processes is mostly a traceable one, where Acidithiobacillus, Leptospirillum, and Sulfobacillus are the predominant members.

Supplementary Materials

The following are available online at https://www.mdpi.com/article/10.3390/genes12040474/s1, Table S1: Primers designed for At. thiooxidans (ATT), At. ferrooxidans (AFE), L. ferriphilum (LII), and Sulfobacillus sp. CBAR13 (STO) and used for real-time quantitative PCR (RT-qPCR) analysis. Table S2: RNA quantity and quality obtained from the bioleaching column test and industrial bioleaching strip samples. Table S3: Estimated p-values for multiple regression models of the At. thiooxidans, L. ferriphilum IESL-25, and L. ferriphilum-type strain DSM 14647 growing at different CO2 and SO42− levels. Figure S1: Copy numbers of 16S rRNA by real-time PCR analysis of autotrophic (Atf and Att) and heterotrophic (Fac and Thsp) microorganisms in column experiment with on/off air feeding. Cut = air feeding interrupted. Atf: Acidithiobacillus ferrooxidans; Att: At. thiooxidans; Fac: Ferroplasma acidiphilum; Thsp: Thermoplasma sp. Figure S2: Characterization of the col.2 community in response to input–airflow interventions. Samples used in the transcriptional analysis are indicated with an asterisk and their O2 levels (%) (*). Horizontal bars on the below the x-axis indicate the two periods when input-airflow was interrupted in the column (days 62 to 68 and days 91 to 104). The input (CO2-in) and output (CO2-out) CO2 levels are shown. Figure S3: Community characterization of the industrial strips S-410 (A) and S132, 327, 413, 414 (B) of MEL bioleaching heap responding to aeration interventions. Samples that were used in the transcriptional analysis are indicated with an asterisk (*). (A) 0, 2, 4 correspond to the three samplings performed biweekly before (0) and after (2, 4) aeration intervention in strip 410. M are samples taken on the base of the fourth lift). D is a drop (base of the first lift). Figure S4: Ammonium level measured in industrial PLS solutions vs. the age of the heap expressed as the day after the start of irrigation.

Author Contributions

Conceptualization, S.M. and C.D.; Data curation, S.M., C.D. and D.A.; Formal analysis, S.M., C.D. and D.A.; Funding acquisition, C.D.; Investigation, S.M., M.C., M.A., K.D. and C.E.; Methodology, S.M., M.C., M.A., K.D., and C.E.; Project administration, C.D.; Supervision, C.D.; Writing—original draft, S.M. and C.D.; Writing—review & editing, S.M., M.A., and C.D. All authors have read and agreed to the published version of the manuscript.

Funding

This research was funded by FONDEF, grant number IT13I20042 and IT16M100045, and Minera Escondida Ltd.

Institutional Review Board Statement

Not applicable.

Informed Consent Statement

Not applicable.

Data Availability Statement

Metagenome data available on request.

Acknowledgments

We acknowledge Minera Escondida Ltd. for providing the data and the samples for this research, Víctor Zepeda, Pedro Galleguillos, and Ing. Dina Cautivo for their technical assistance in the column experiments and in analyzing industrial samples, respectively, and M. C. Chong D. for language improvements.

Conflicts of Interest

The authors declare no conflict of interest. The funders had no role in the design of the study; in the collection, analyses, or interpretation of data; in the writing of the manuscript, or in the decision to publish the results.

References

  1. Fundación-Chile. From Copper to Innovation: Technological Roadmap 2015–2035; A Impresores: Santiago, Chile, 2016; p. 387. ISBN 978-956-8200-30-5. [Google Scholar]
  2. Velasquez-Yevenes, L.; Torres, D.; Toro, N. Leaching of chalcopyrite ore agglomerated with high chloride concentration and high curing periods. Hydrometallurgy 2018, 181, 215–220. [Google Scholar] [CrossRef]
  3. Rautenbach, G. Heap Leaching of Copper. U.S. Patent No. 10041143, 7 August 2018. [Google Scholar]
  4. Kelly, G.; Aguilera, S.; Chico, V. Transition from traditional leaching to chloride leaching—Costs and impacts on infrastructure. In Proceedings of the Hydroprocess, Santiago, Chile, 26–28 October 2020. [Google Scholar]
  5. Hajdu-Rahkama, R.; Ahoranta, S.; Lakaniemi, A.M.; Puhakka, J.A. Effects of elevated pressures on the activity of acidophilic bioleaching microorganisms. Biochem. Eng. J. 2019, 150, 107286. [Google Scholar] [CrossRef]
  6. Acosta, M.; Galleguillos, P.; Ghorbani, Y.; Tapia, P.; Contador, Y.; Velasquez, A.; Espoz, C.; Pinilla, C.; Demergasso, C. Variation in microbial community from predominantly mesophilic to thermotolerant and moderately thermophilic species in an industrial copper heap bioleaching operation. Hydrometallurgy 2014, 150, 281–289. [Google Scholar] [CrossRef]
  7. Cautivo, D.; Soto, P.; Zepeda, V.; Galleguillos, P.; Velásquez, A.; Pinilla, C.; Demergasso, C. Estimation of ionic load effect on the oxidizing activity of the microbial population in the heap bioleaching process at Escondida Mine. Adv. Mater. Res. 2013, 825, 219–222. [Google Scholar] [CrossRef]
  8. Galleguillos, P.A.; Music, V.; Acosta, M.; Salazar, C.N.; Quatrini, R.; Shmaryahu, A.; Holmes, D.S.; Velásquez, A.; Espoz, C.; Pinilla, C.; et al. Temporal Dynamics of Genes Involved in Metabolic Pathways of C and N of L. ferriphilum, in the Industrial Bioleaching Process of Escondida Mine, Chile. Adv. Mater. Res. 2013, 825, 162–165. [Google Scholar] [CrossRef]
  9. Marin, S.; Acosta, M.; Galleguillos, P.; Chibwana, C.; Strauss, H.; Demergasso, C. Is the growth of microorganisms limited by carbon availability during chalcopyrite bioleaching? Hydrometallurgy 2017, 168, 13–20. [Google Scholar] [CrossRef]
  10. Zepeda, V.; Cautivo, D.; Galleguillos, P.; Salazar, C.; Velásquez, A.; Pinilla, C.; Demergasso, C. Effect of increased acid concentration on the microbial population inhabiting an industrial heap bioleaching plant. Adv. Mater. Res. 2013, 825, 348–351. [Google Scholar] [CrossRef]
  11. Cortes, M.; Marin, S.; Galleguillos, P.; Cautivo, D.; Demergasso, C. Validation of Genetic Markers Associated to Oxygen Availability in Low-Grade Copper Bioleaching Systems: An Industrial Application. Front. Microbiol. 2019, 10, 1841. [Google Scholar] [CrossRef]
  12. Remonsellez, F.; Galleguillos, F.; Moreno-Paz, M.; Parro, V.; Acosta, M.; Demergasso, C. Dynamic of active microorganisms inhabiting a bioleaching industrial heap of low-grade copper sulfide ore monitored by real-time PCR and oligonucleotide prokaryotic acidophile microarray. Microb. Biotechnol. 2009, 2, 613–624. [Google Scholar] [CrossRef]
  13. Roberto, F.F. Copper Heap Bioleach Microbiology—Progress and Challenges. Solid State Phenom. 2017, 262, 250–254. [Google Scholar] [CrossRef]
  14. Watling, H.R.; Watkin, E.L.J.; Ralph, D.E. The resilience and versatility of acidophiles that contribute to the bio-assisted extraction of metals from mineral sulphides. Environ. Technol. 2011, 31, 915–933. [Google Scholar] [CrossRef]
  15. Demergasso, C.; Galleguillos, F.; Soto, P.; Serón, M.; Iturriaga, V. Microbial succession during a heap bioleaching cycle of low grade copper sulfides: Does this knowledge mean a real input for industrial process design and control? Hydrometallurgy 2010, 104, 382–390. [Google Scholar] [CrossRef]
  16. Demergasso, C.; Galleguillos, P.; Escudero, L.; Zepeda, V.; Castillo, D.; Casamayor, E. Molecular characterization of microbial populations in a low-grade copper ore bioleaching test heap. Hydrometallurgy 2005, 80, 241–253. [Google Scholar] [CrossRef]
  17. Roberto, F.F. 16S-rRNA gene-targeted amplicon sequence analysis of an enargite-dominant bioleach demonstration in Peru. Hydrometallurgy 2018, 180, 271–276. [Google Scholar] [CrossRef]
  18. Ramirez-Flandes, S.; Gonzalez, B.; Ulloa, O. Redox traits characterize the organization of global microbial communities. Proc. Natl. Acad. Sci. USA 2019, 116, 3630–3635. [Google Scholar] [CrossRef] [PubMed]
  19. Escalas, A.; Hale, L.; Voordeckers, J.W.; Yang, Y.F.; Firestone, M.K.; Alvarez-Cohen, L.; Zhou, J.Z. Microbial functional diversity: From concepts to applications. Ecol. Evol. 2019, 9, 12000–12016. [Google Scholar] [CrossRef]
  20. Techtmann, S.M.; Hazen, T.C. Metagenomic applications in environmental monitoring and bioremediation. J. Ind. Microbiol. Biotechnol. 2016, 43, 1345–1354. [Google Scholar] [CrossRef] [PubMed]
  21. Buetti-Dinh, A.; Herold, M.; Christel, S.; El Hajjami, M.E.; Delogu, F.; Ilie, O.; Bellenberg, S.; Wilmes, P.; Poetsch, A.; Sand, W.; et al. Reverse engineering directed gene regulatory networks from transcriptomics and proteomics data of biomining bacterial communities with approximate Bayesian computation and steady-state signalling simulations. BMC Bioinform. 2020, 21, 23. [Google Scholar] [CrossRef] [PubMed]
  22. Esparza, M.; Jedlicki, E.; Gonzalez, C.; Dopson, M.; Holmes, D.S. Effect of CO2 Concentration on Uptake and Assimilation of Inorganic Carbon in the Extreme Acidophile Acidithiobacillus ferrooxidans. Front. Microbiol. 2019, 10, 603. [Google Scholar] [CrossRef] [PubMed]
  23. Demergasso, C.; Veliz, R.; Galleguillos, P.; Marin, S.; Acosta, M.; Zepeda, V.; Zeballos, J.; Henriquez, F.; Pizarro, R.; Sekios-Calfa, J. Decision support system for bioleaching processes. Hydrometallurgy 2018, 181, 113–122. [Google Scholar] [CrossRef]
  24. Véliz, R.; Demergasso, C.; Galleguillos, P.A.; Marín, S.; Acosta, M. Molecular microbial indicators for industrial bioleaching operations and its implementation in a Decision support system. In Proceedings of the International Biohydrometallurgy Symposium, Fukuoka, Japan, 21–23 October 2019. [Google Scholar]
  25. Sutton, R.T.; Pincock, D.; Baumgart, D.C.; Sadowski, D.C.; Fedorak, R.N.; Kroeker, K.I. An overview of clinical decision support systems: Benefits, risks, and strategies for success. NPJ Digit. Med. 2020, 3, 17. [Google Scholar] [CrossRef]
  26. Galleguillos, P. Biodiversity and Stress Response of Extremophilic Prokaryotes Isolated from the Escondida Copper Mine, Chile. Ph.D. Thesis, Bangor University, Gwynedd, UK, 2011. [Google Scholar]
  27. Norris, P.R.; Clark, D.A.; Owen, J.P.; Waterhouse, S. Characteristics of Sulfobacillus acidophilus sp. nov. and other moderately thermophilic mineral-sulphide-oxidizing bacteria. Microbiology 1996, 142, 775–783. [Google Scholar] [CrossRef] [PubMed]
  28. Bryan, C.G.; Davis-Belmar, C.S.; van Wyk, N.; Fraser, M.K.; Dew, D.; Rautenbach, G.F.; Harrison, S.T.L. The effect of CO2 availability on the growth, iron oxidation and CO2-fixation rates of pure cultures of Leptospirillum ferriphilum and Acidithiobacillus ferrooxidans. Biotechnol. Bioeng. 2012, 109, 1693–1703. [Google Scholar] [CrossRef] [PubMed]
  29. Davis-Belmar, C.S.; Nicolle, J.L.C.; Norris, P.R. Ferrous iron oxidation and leaching of copper ore with halotolerant bacteria in ore columns. Hydrometallurgy 2008, 94, 144–147. [Google Scholar] [CrossRef]
  30. Paipa, C.; Mateo, M.; Godoy, I.; Poblete, E.; Toral, M.; Vargas, T. Comparative study of alternative methods for the simultaneous determination of Fe+3 and Fe+2 in leaching solutions and in acid mine drainages. Miner. Eng. 2005, 18, 1116–1119. [Google Scholar] [CrossRef]
  31. Weisberg, S. Applied Linear Regression, 4th ed.; Barnett, V.S.H., Hunter, J.S., Kendall, D.G., Teugels, J.L., Eds.; John Wiley & Sons, Inc.: Hoboken, NJ, USA, 2014; p. 368. [Google Scholar]
  32. Demergasso, C.; Iturriaga, V.; Galleguillos, P.A.; Davis, S. Effect of SX on microbial populations inhabiting in solutions of a heap bioleaching process. In Proceedings of the 19th International Biohydrometallurgy Symposium, Biohydrometallurgy: Biotech Key to Unlock Mineral Resource Value, Changsha, China, 18–22 September 2011; p. 1015. [Google Scholar]
  33. Makaula, D.X.; Huddy, R.J.; Fagan-Endres, M.A.; Harrison, S.T.L. Using isothermal microcalorimetry to measure the metabolic activity of the mineral-associated microbial community in bioleaching. Miner. Eng. 2017, 106, 33–38. [Google Scholar] [CrossRef]
  34. Zepeda, V.J.; Galleguillos, F.; Urtuvia, V.; Molina, J.; Demergasso, C. Comparison between the bacterial populations from solutions and minerals in 1 m test columns and the industrial low grade copper sulphide bioleaching process in the Escondida Mine, Chile. Adv. Mater. Res. 2009, 71–73, 63–66. [Google Scholar] [CrossRef]
  35. Bellenberg, S.; Barthen, R.; Boretska, M.; Zhang, R.; Sand, W.; Vera, M. Manipulation of pyrite colonization and leaching by iron-oxidizing Acidithiobacillus species. Appl. Microbiol. Biotechnol. 2015, 99, 1435–1449. [Google Scholar] [CrossRef]
  36. Demergasso, C.; Shmaryahu, A.; Quatrini, R.; Galleguillos, P.; Acosta Grinok, M.; Holmes, D. DNA Microarray for the Quantitative Analysis of Gene Expression from Microorganisms Inhabiting Liquid and Solid Samples of Industrial Bioleaching Processes; Method for Analyzing Gene Expression Using the Microarray. Chile Patent No. 58023, 23 September 2019. [Google Scholar]
  37. Acosta, M.; Galleguillos, P.; Guajardo, M.; Demergasso, C. Microbial survey on industrial bioleaching heap by high-throughput 16S sequencing and metagenomics analysis. Solid State Phenom. 2017, 262, 219–223. [Google Scholar] [CrossRef]
  38. Aziz, R.K.; Bartels, D.; Best, A.A.; DeJongh, M.; Disz, T.; Edwards, R.A.; Formsma, K.; Gerdes, S.; Glass, E.M.; Kubal, M.; et al. The RAST Server: Rapid annotations using subsystems technology. BMC Genom. 2008, 9, 75. [Google Scholar] [CrossRef]
  39. Larkin, M.A.; Blackshields, G.; Brown, N.P.; Chenna, R.; McGettigan, P.A.; McWilliam, H.; Valentin, F.; Wallace, I.M.; Wilm, A.; Lopez, R.; et al. Clustal W and Clustal X version 2.0. Bioinformatics 2007, 23, 2947–2948. [Google Scholar] [CrossRef]
  40. Ye, J.; Coulouris, G.; Zaretskaya, I.; Cutcutache, I.; Rozen, S.; Madden, T.L. Primer-BLAST: A tool to design target-specific primers for polymerase chain reaction. BMC Bioinform. 2012, 13, 134. [Google Scholar] [CrossRef] [PubMed]
  41. Svec, D.; Tichopad, A.; Novosadova, V.; Pfaffl, M.W.; Kubista, M. How good is a PCR efficiency estimate: Recommendations for precise and robust qPCR efficiency assessments. Biomol. Detect. Quantif. 2015, 3, 9–16. [Google Scholar] [CrossRef]
  42. Pfaffl, M.W.; Horgan, G.W.; Dempfle, L. Relative expression software tool (REST) for group-wise comparison and statistical analysis of relative expression results in real time PCR. Nucleic Acid Res. 2002, 30, e36. [Google Scholar] [CrossRef]
  43. Andersen, C.; Jensen, J.; Orntoft, T. Normalization of Real-Time quantitative transcription-PCR data: A model-based variance estimation approach to identify genes suited for normalization, applied to bladder and colon cáncer data sets. Cancer Res. 2004, 64, 5245–5250. [Google Scholar] [CrossRef] [PubMed]
  44. Klein, M.G.; Zwart, P.; Bagby, S.C.; Cai, F.; Chisholm, S.W.; Heinhorst, S.; Cannon, G.C.; Kerfeld, C.A. Identification and structural analysis of a novel carboxysome shell protein with implications for metabolite transport. J. Mol. Biol. 2009, 392, 319–333. [Google Scholar] [CrossRef] [PubMed]
  45. Petersen, J.; Minnaar, S.; du Plessis, C. Carbon dioxide and oxygen consumption during the bioleaching of a copper ore in a large isothermal column. Hydrometallurgy 2010, 104, 356–362. [Google Scholar] [CrossRef]
  46. Acevedo, F.; Gentina, J.; García, N. CO2 supply in the biooxidation of an enargite-pyrite gold concentrate. Biotechnol. Lett. 1998, 20, 257–259. [Google Scholar]
  47. Kurosawa, H.; Konno, Y.; Nakamura, K.; Amano, Y. Estimation of the CO2 fixation ability of Thiobacillus thiooxidans JCM 7814. J. Ferment. Bioeng. 1993, 75, 71–72. [Google Scholar] [CrossRef]
  48. Toyoda, K.; Yoshizawa, Y.; Arai, H.; Ishii, M.; Igarashi, Y. The role of two CbbRs in the transcriptional regulation of three ribulose-1,5-bisphosphate carboxylase/oxygenase genes in Hydrogenovibrio marinus strain MH-110. Microbiol. SGM 2005, 151, 3615–3625. [Google Scholar] [CrossRef] [PubMed]
  49. Badger, M.R.; Bek, E.J. Multiple Rubisco forms in proteobacteria: Their functional significance in relation to CO2 acquisition by the CBB cycle. J. Exp. Bot. 2008, 59, 1525–1541. [Google Scholar] [CrossRef] [PubMed]
  50. Valdes, J.; Cardenas, J.P.; Quatrini, R.; Esparza, M.; Osorio, H.; Duarte, F.; Lefimil, C.; Sepulveda, R.; Jedlicki, E.; Holmes, D.S. Comparative genomics begins to unravel the ecophysiology of bioleaching. Hydrometallurgy 2010, 104, 471–476. [Google Scholar] [CrossRef]
  51. Ahoranta, S.H.; Peltola, M.K.; Lakaniemi, A.M.; Puhakka, J.A. Enhancing the activity of iron-oxidising bacteria: A case study with process liquors from heap bioleaching of a complex sulphide ore. Hydrometallurgy 2017, 167, 163–172. [Google Scholar] [CrossRef]
  52. Goltsman, D.S.; Dasari, M.; Thomas, B.C.; Shah, M.B.; VerBerkmoes, N.C.; Hettich, R.L.; Banfield, J.F. New group in the Leptospirillum clade: Cultivation-independent community genomics, proteomics, and transcriptomics of the new species “Leptospirillum group IV UBA BS”. Appl. Environ. Microbiol. 2013, 79, 5384–5393. [Google Scholar] [CrossRef] [PubMed]
  53. Goltsman, D.S.; Denef, V.J.; Singer, S.W.; VerBerkmoes, N.C.; Lefsrud, M.; Mueller, R.S.; Dick, G.J.; Sun, C.L.; Wheeler, K.E.; Zemla, A.; et al. Community genomic and proteomic analyses of chemoautotrophic iron-oxidizing “Leptospirillum rubarum” (Group II) and “Leptospirillum ferrodiazotrophum” (Group III) bacteria in acid mine drainage biofilms. Appl. Environ. Microbiol. 2009, 75, 4599–4615. [Google Scholar] [CrossRef] [PubMed]
  54. Issotta, F.; Galleguillos, P.A.; Moya-Beltran, A.; Davis-Belmar, C.S.; Rautenbach, G.; Covarrubias, P.C.; Acosta, M.; Ossandon, F.J.; Contador, Y.; Holmes, D.S.; et al. Draft genome sequence of chloride-tolerant Leptospirillum ferriphilum Sp-Cl from industrial bioleaching operations in northern Chile. Stand. Genom. Sci. 2016, 11, 19. [Google Scholar] [CrossRef]
  55. Galleguillos, P.; Demergasso, C.S.; Johnson, D.B.; Quatrini, R.; Holmes, D.S.; Hallberg, K.B. Identification and analysis of diazotrophy in strains of Leptospirillum ferriphilum from heap bioleaching operations. In Proceedings of the Biohydrometallurgy: Biotech Key to Unlock Mineral Resources Value of the 19th International Biohydrometallurgy Symposium, Changsha, China, 18–22 September 2011; p. 1015. [Google Scholar]
  56. Csonka, L.N. Physiological and genetic responses of bacteria to osmotic-stress. Microbiol. Rev. 1989, 53, 121–147. [Google Scholar] [CrossRef] [PubMed]
  57. Galleguillos, P.A.; Grail, B.M.; Hallberg, K.B.; Demergasso, C.S.; Johnson, D.B. Identification of trehalose as a compatible solute in different species of acidophilic bacteria. J. Microbiol. 2018, 56, 727–733. [Google Scholar] [CrossRef]
  58. Cai, X.; Seitl, I.; Mu, W.M.; Zhang, T.; Stressler, T.; Fischer, L.; Jiang, B. Biotechnical production of trehalose through the trehalose synthase pathway: Current status and future prospects. Appl. Microbiol. Biotechnol. 2018, 102, 2965–2976. [Google Scholar] [CrossRef]
  59. Maruta, K.; Kubota, M.; Fukuda, S.; Kurimoto, M. Cloning and nucleotide sequence of a gene encoding a glycogen debranching enzyme in the trehalose operon from Arthrobacter sp Q36. Biochim. Biophys. Acta Protein Struct. Mol. Enzymol. 2000, 1476, 377–381. [Google Scholar] [CrossRef]
  60. Padilla, L.; Morbach, S.; Kramer, R.; Agosin, E. Impact of heterologous expression of Escherichia coli UDP-glucose pyrophosphorylase on trehalose and glycogen synthesis in Corynebacterium glutamicum. Appl. Environ. Microbiol. 2004, 70, 3845–3854. [Google Scholar] [CrossRef] [PubMed]
  61. Carpinelli, J.; Kramer, R.; Agosin, E. Metabolic engineering of Corynebacterium glutamicum for trehalose overproduction: Role of the TreYZ trehalose biosynthetic pathway. Appl. Environ. Microbiol. 2006, 72, 1949–1955. [Google Scholar] [CrossRef] [PubMed]
  62. Chandra, G.; Chater, K.F.; Bornemann, S. Unexpected and widespread connections between bacterial glycogen and trehalose metabolism. Microbiology 2011, 157, 1565–1572. [Google Scholar] [CrossRef]
  63. Ruhal, R.; Kataria, R.; Choudhury, B. Trends in bacterial trehalose metabolism and significant nodes of metabolic pathway in the direction of trehalose accumulation. Microb. Biotechnol. 2013, 6, 493–502. [Google Scholar] [CrossRef]
  64. Feehily, C.; Karatzas, K.A.G. Role of glutamate metabolism in bacterial responses towards acid and other stresses. J. Appl. Microbiol. 2013, 114, 11–24. [Google Scholar] [CrossRef]
  65. Wang, R.M.; Li, N.; Zheng, K.; Hao, J.F. Enhancing acid tolerance of the probiotic bacterium Lactobacillus acidophilus NCFM with trehalose. FEMS Microbiol. Lett. 2018, 365, fny217. [Google Scholar] [CrossRef]
  66. Shiers, D.W.; Ralph, D.E.; Watling, H.R. A comparative study of substrate utilisation by Sulfobacillus species in mixed ferrous ion and tetrathionate growth medium. Hydrometallurgy 2010, 104, 363–369. [Google Scholar] [CrossRef]
  67. Guo, X.; Yin, H.; Liang, Y.; Hu, Q.; Zhou, X.; Xiao, Y.; Ma, L.; Zhang, X.; Qiu, G.; Liu, X. Comparative Genome Analysis Reveals Metabolic Versatility and Environmental Adaptations of Sulfobacillus thermosulfidooxidans Strain ST. PLoS ONE 2014, 9, e99417. [Google Scholar] [CrossRef] [PubMed]
  68. Zhang, X.; Liu, X.; Liang, Y.; Guo, X.; Xiao, Y.; Ma, L.; Miao, B.; Liu, H.; Peng, D.; Huang, W.; et al. Adaptive Evolution of Extreme Acidophile Sulfobacillus thermosulfidooxidans Potentially Driven by Horizontal Gene Transfer and Gene Loss. Appl. Environ. Microbiol. 2017, 83. [Google Scholar] [CrossRef] [PubMed]
  69. Guo, W.B.; Zhang, H.J.; Zhou, W.G.; Wang, Y.G.; Zhou, H.B.; Chen, X.H. Sulfur Metabolism Pathways in Sulfobacillus acidophilus TPY, A Gram-Positive Moderate Thermoacidophile from a Hydrothermal Vent. Front. Microbiol. 2016, 7, 1861. [Google Scholar] [CrossRef] [PubMed]
  70. Panyushkina, A.E.; Babenko, V.V.; Nikitina, A.S.; Selezneva, O.V.; Tsaplina, I.A.; Letarova, M.A.; Kostryukova, E.S.; Letarov, A.V. Sulfobacillus thermotolerans: New insights into resistance and metabolic capacities of acidophilic chemolithotrophs. Sci. Rep. 2019, 9, 15069. [Google Scholar] [CrossRef] [PubMed]
  71. Acosta, M.; Galleguillos, P.; Marín, S.; Chibwana, C.; Strauss, H.; Demergasso, C. Blue-Copper Proteins: Expression of Coding Genes from Sulfobacillus spp. and Iron Oxidation in Column Bioleaching Tests. Adv. Mater. Res. 2015, 1130, 333–337. [Google Scholar] [CrossRef]
  72. Christel, S.; Herold, M.; Bellenberg, S.; Buetti-Dinh, A.; El Hajjami, M.; Pivkin, I.V.; Sand, W.; Wilmes, P.; Poetsch, A.; Vera, M.; et al. Weak Iron Oxidation by Sulfobacillus thermosulfidooxidans Maintains a Favorable Redox Potential for Chalcopyrite Bioleaching. Front. Microbiol. 2018, 9, 3059. [Google Scholar] [CrossRef] [PubMed]
Figure 1. Schematic drawing of the bioleaching heap at Escondida mine with four lifts. D corresponds to drops. M is the base of the fourth lift (adapted from [11]).
Genes 12 00474 g001
Figure 2. Cell growth (A) and acid production (B) of At. thiooxidans IESL-33 cultured under different CO2 concentrations. Vertical bars represent the standard deviation (SD) calculated with biological replicates.
Genes 12 00474 g002
Figure 3. Transcriptional dynamics of five key Calvin–Benson–Basham (CBB) genes of At. thiooxidans (ATT) in response to (A) four different CO2 supply conditions in pure cultures of the strain IESL-33 and to (B) variations in the CO2 availability produced by three different interventions of input airflow in a controlled bioleaching column. Gray areas in the second graph show the two periods without input airflow in col.2 (days 63 to 68 and days 91 to 104). Significant differences in relative expression were adjusted at −1 < Log2 ratio < 1 (horizontal black lines). Gene expression was calculated relative to the control samples (log 0 values) that correspond in (A,B), respectively, to the culture with 300 ppm and the sample from operational day 60. In (B), the X-axis corresponds to operation days at the sampling time of col.2.
Genes 12 00474 g003
Figure 4. Transcriptional dynamics of key CBB-genes of At. thiooxidans (ATT) and At. ferrooxidans (AFE) in response to (A) industrial aeration interventions performed in strip S-410 and (B) in strips S-132, S-327, and S-414. In (A) 0, 2, and 4 are the three samplings performed biweekly before (0) and after (2, 4) aeration intervention in strip S-410 (Table 2). The samples D were collected from the drop located at the base of the heap. The samples M were collected at the base of the fourth lift of the heap. Gray areas show the strips without aeration (blowers turned off) in the base of the fourth lift. Significant differences in relative expression were adjusted at −1 < Log2 ratio < 1 (horizontal black lines). Gene expression was calculated relative to the control samples (log 0 values) that correspond in (A,B), respectively, to S-410-W0-M and S-414-D.
Genes 12 00474 g004
Figure 5. Transcriptional dynamics of nifH, amt2, glnA, and glnB genes of L. ferriphilum (LII) during NH4+ interventions (NH4+ supplemented on and off at operation days 62 and 90, respectively) in the bioleaching column, col.3. Significant differences in relative expression were adjusted at −1 < Log2 ratio < 1 (horizontal black lines). Gene expression was calculated relative to the control sample (log 0 values) that corresponds to operational day 61. The X-axis corresponds to operation days at the sampling time of col.3.
Genes 12 00474 g005
Figure 6. Transcriptional dynamics of nifH, amt2, and glnA genes in L. ferriphilum (LII) from (A) strips S-132, S-327, S-413, S-414, and (B) S-405 of the MEL industrial copper bioleaching heap with different NH4+ availabilities. D = Drop or base of the heap, B = the base of the second lift, M = the base of the fourth lift. Significant differences in relative expression were adjusted at −1 < Log2 ratio < 1 (horizontal black lines). Gene expression was calculated relative to the control samples (log 0 values) that correspond in (A,B), respectively, to S-132 and S.405-D.
Genes 12 00474 g006
Figure 7. Cell growth (A) and Fe2+ consumption (B) of L. ferriphilum type strain DSM 14647 cultured under different SO42− concentrations (g L−1). Vertical bars represent the standard deviation (SD) calculated with biological replicates.
Genes 12 00474 g007
Figure 8. Cell growth (A) and Fe2+ consumption (B) of L. ferriphilum IESL-25 cultured under different SO42− concentrations (g L−1). Vertical bars represent the standard deviation (SD) calculated with biological replicates.
Genes 12 00474 g008
Figure 9. Transcriptional dynamics of trehalose synthesis genes of L. ferriphilum (LII) in response to (A) three different SO42− levels in pure cultures of the type strain DSM 14647, using as control one biological replicate of the cultures with 2 g L−1 SO42−, and (B) variations in the SO42− concentration produced by two increments of feeding SO42− at operation days 68 and 103 in a bioleaching column, respectively, using as control the sample taken on operation day 66. Vertical bars represent the standard deviation (SD) calculated with biological replicates. Significant differences in relative expression were adjusted at −1 < Log2 ratio < 1 (horizontal black lines). In (B), the X-axis corresponds to operation days at the sampling time of col.4.
Genes 12 00474 g009
Figure 10. Transcriptional dynamics of treZ, treY, and lamB genes of L. ferriphilum (LII) from industrial bioleaching strips with different operational times (Table 2) and sampling (A) at the same date (23 August 2017) or (B) at different dates (11 November 2015, and 23 August 2017, Table 2). The gene lamb was not amplified in S-405-D (from drop), S-405-B (from the base of the second lift), and S-405-M (from the base of the fourth lift) (Table 2). Significant differences in relative expression were adjusted at −1 < Log2 ratio < 1 (horizontal black lines). Gene expression was calculated relative to the control samples (log 0 values) that correspond in (A,B), respectively, to S-132 and S-327.
Genes 12 00474 g010
Figure 11. Cell growth of Sulfobacillus sp. CBAR13 strain growing with iron (Fe2+) (black circles) and tetrathionate (white circles) as the energy source. Vertical bars represent the standard deviation (SD) calculated with biological replicates.
Genes 12 00474 g011
Figure 12. Transcriptional dynamics of cytbdI, sulf, chypII, carb, tehy, and fadp genes from Sulfobacillus sp. CBAR13 (STO) growing in a pure culture test with different electron donors (SS with Fe2+ and DS with tetrathionate) (A), and industrial bioleaching strips from the MEL-heap with different availabilities of Fe2+ (0.24 and 0.04 g L−1 Fe2+ in S-132-D and S-327-D, respectively) (B). Significant differences in relative expression were adjusted at −1 < Log2 ratio < 1 (horizontal black lines). Gene expression was calculated relative to a control sample (log 0 values) that correspond in (A,B), respectively, to one biological triplicate from DS cultures and one technical triplicate from S-132. Vertical bars in each column correspond to the standard deviation (SD) calculated with biological and technical replicates.
Genes 12 00474 g012
Figure 13. Reverse transcription quantitative PCR (RT-qPCR) array of industrially validated transcriptomic markers for monitoring copper bioleaching systems.
Genes 12 00474 g013
Table 1. Samples collected from L. ferriphilum DSM 14647, L. ferriphilum IESL-25, At. thiooxidans IESL-33, and Sulfobacillus sp. CBAR13 cultures and from the bioleaching columns (col.1, col.2, col.3, col.4) at several operational times and specific running conditions (CO2, SO42−, and NH4+ availability). (*) Air displacement with N2 in col.2. (**) Restoration of regular aeration in col.2. OpD, operation day; CO2-out, output CO2 concentration; SS, single-strength medium (with Fe2+ as an energy source), DS, double-strength medium (with K2S4O6 as energy source); Sb. sp., Sulfobacillus sp.
Cultures and Columns ConditionsIdentification LabelSO42− (g L−1)
NH4+ (mg L−1)
Feeding
Air Feeding
Sb. sp. CBAR13 cultures for markers identification associated with ferrous and sulfur oxidation.SS -Atmospheric
DS -Atmospheric
L. ferriphilum DSM 14647 cultures for markers identification associated with osmotic stress (SO42− impurity)LII-DSM-2(2.5)Atmospheric
LII-DSM-25 (25)Atmospheric
LII-DSM-50(50)Atmospheric
L. ferriphilum IESL-25 cultures study of osmotic stress (SO42− impurity)LII-IESL_2(2.5)Atmospheric
LII-IESL_25(25)Atmospheric
LII-IESL_50(50)Atmospheric
At. thiooxidans IESL-33 cultures for markers identification associated with CO2 availabilityATH-50-50 ppm CO2-in
ATH-100-100 ppm CO2-in
ATH-300-300 ppm CO2-in
ATH-500-500 ppm CO2-in
col.1: bioleaching column #1, controlOpD60-200 ppm CO2-out
col.2: bioleaching column #2 for markers identification associated with O2 and CO2 availability(*) OpD62-Air ON (500 ppm CO2-out)
OpD64-Air OFF (2000 ppm CO2-out)
(**) OpD69-Air OFF (1600 ppm CO2-out)
OpD76-Air ON (200 ppm CO2-out)
OpD97-Air OFF (200 ppm CO2-out)
col.3: bioleaching column #3 for markers identification associated with N2 and NH4+ availability (nutrients) OpD62(0)Atmospheric
OpD69(40)Atmospheric
OpD76(40)Atmospheric
OpD90(40)Atmospheric
OpD104(0)Atmospheric
col.4: bioleaching column #4 for markers identification associated with osmotic stress (SO42− impurity)OpD67(50)Atmospheric
OpD70(50)Atmospheric
OpD77(80)Atmospheric
OpD84(80)Atmospheric
OpD93(80)Atmospheric
OpD105(10)Atmospheric
OpD111(100)Atmospheric
Table 2. Physicochemical characterization of industrial samples from the Minera Escondida Ltd. (MEL) bioleaching heap (strips S-405, S-410, S-132, Scheme 327. S-413, and S-414) sampled at different operation times for gene expression analysis associated with CO2 availability, osmotic stress, nitrogen availability, and ferrous/sulfur oxidation. Gray areas mark the operational factors and their related metabolisms studied in the respective industrial samples. Industrial strips were sampled on: (1) 24 November 2015; (2) 29 December 2016; (3) 12 January 2017; (4) 26 January 2017; (5) 23 August 2017. The marks W0, W2, and W4 in S-410 correspond to three samplings performed biweekly before (0), after 2 weeks, and after 4 weeks since the blower was turned off. D represents samples collected from the heap base, M represents samples collected at the base of the fourth lift, and B represents a sample collected at the base of the second lift of the heap. L1 and L4 represent blowers present in the heap-base or the fourth lift base, respectively. ON and OFF are blowers turned on and turned off, respectively. Day refers to the strip operation day.
SampleDayHeap
Lift
Total Fe
(g L−1)
Fe2+
(g L−1)
H2SO4
(g L−1)
pHEh
(mV)
NH4+
(mg L−1)
SO42−
(g L−1)
Blowers Status
(1) S-405-D2844th1.39-2.362.067864.0106L1 ON
(1) S-405-B2844th0.84-1.572.287985.096L1 ON
(1) S-405-M2844th1.91-4.681.678003.298L1 ON
(2) S410-W0-D3774th1.46<0.012.692.057904.0113L1 and L4 ON
(2) S410-W0-M3774th1.950.243.671.846762.2122L1 and L4 ON
(3) S410-W2-D3914th1.53<0.013.012.057651.8104L1 ON L4 OFF
(3) S410-W2-M3914th2.140.922.721.956591.8103L1 ON L4 OFF
(4) S410-W4-D4054th1.59<0.012.092.148265.4104L1 ON L4 OFF
(4) S410-W4-M4054th2.330.645.911.856665.8104L1 ON L4 OFF
(5) S-132-D631st1.730.242.072.007081692L1 ON
(5) S-327-D433th0.830.041.292.167201092L1 ON
(5) S-413-D3944th1.820.152.881.977073.097L1 and L4 ON
(5) S-414-D64th1.650.152.382.087692.098L1 ON L4 OFF
Table 3. Candidate genes analyzed for biomarkers identification and industrial validation. The CO2 fixation genes are from the Calvin–Benson–Basham cycle. HKG is housekeeping genes. SRC is sulfur-reduced compounds. Sb. sp. is Sulfobacillus sp. Genes that were used as endogenous control are indicated with (*).
SpeciesGeneGene ProductEC NumberPathway
A. thiooxidansrbcL1RubisCo type I4.1.1.39CO2 fixation
A. thiooxidansrbcL2RubisCo type II4.1.1.39CO2 fixation
A. thiooxidanscsoS2Carboxysome shell proteins-CO2 fixation
A. thiooxidanscsoS3Carbonic anhydrase type ε4.2.1.1CO2 fixation
A. thiooxidanscsoS4Carboxysome shell proteins-CO2 fixation
A. thiooxidansgyrA *DNA gyrase subunit A5.99.1.3HKG
A. ferrooxidansrbcL-1RubisCo type I4.1.1.39CO2 fixation
A. ferrooxidansrbcL-2RubisCo type II4.1.1.39CO2 fixation
A. ferrooxidansAlas *DNA-binding transcription factor-HKG
L. ferriphilumtreZMalto-oligosyltrehalose trehalohydrolase3.2.1.141Trehalose synthetase
L. ferriphilumtreYMalto-oligosyltrehalose synthase5.4.99.15Trehalose synthetase
L. ferriphilumtreXGlycogen debranching enzyme3.2.1.68Trehalose synthetase
L. ferriphilumlamBPorine maltose-Trehalose synthetase
L. ferriphilumgalUGlucose-1 -phosphate-UDP-pyrophosphorylase2.7.7.9Trehalose synthetase
L. ferriphilumgadABGlutamate descarboxilase4.1.1.15Trehalose synthetase
L. ferriphilumnifHNitrogenase1.18.6.1N2 fixation
L. ferriphilumamt2Ammonium transporter-NH4+ transporter
L. ferriphilumglnAGlutamine synthetase6.3.1.2NH4+ asimilation
L. ferriphilumglnBGlutamine synthetase6.3.1.2NH4+ asimilation
L. ferriphilumalas *DNA-binding transcription factor-HKG
L. ferriphilum16SRibosomal RNA small subunit-HKG
Sb. sp. CBAR13carb2Fe-2S iron-sulfur cluster binding domain-containing protein1.2.7.4Fe2+ oxidation
Sb. sp. CBAR13cytbdlCytochrome bd ubiquinol oxidase subunit I-Fe2+oxidation
Sb. sp. CBAR13sulfHypothetical sulfocyanin-Fe2+oxidation
Sb. sp. CBAR13chypllHypothetical cbb3-type cytochrome c oxidase subunit I-Fe2+oxidation
Sb. sp. CBAR13fadpNAD(P)/FAD-dependent oxidoreductase-SRC oxidation
Sb. sp. CBAR13tehyTetrathionate hydrolase3.12.1.B1SRC oxidation
Sb. sp. CBAR13gyrA *DNA gyrase subunit A5.99.1.3HKG
Publisher’s Note: MDPI stays neutral with regard to jurisdictional claims in published maps and institutional affiliations.