
Multivariate Analysis Identifies Eight Novel Loci Associated with Meat Productivity Traits in Sheep

 ,
,  , ,
, ,  ,
,
Abstract
1. Introduction
2. Materials and Methods
2.1. Data Collection
2.2. Data Pre-Processing
2.3. Phenotype Grouping
2.4. Multivariate GWAS Analysis
2.5. Regional Association Plots
2.6. Functional Annotation
2.7. Literature-Based Prioritization
2.8. The Functional Network of Genes Associated with Meat Productivity Traits
2.9. Replication in a Russian Independent Sample
3. Results
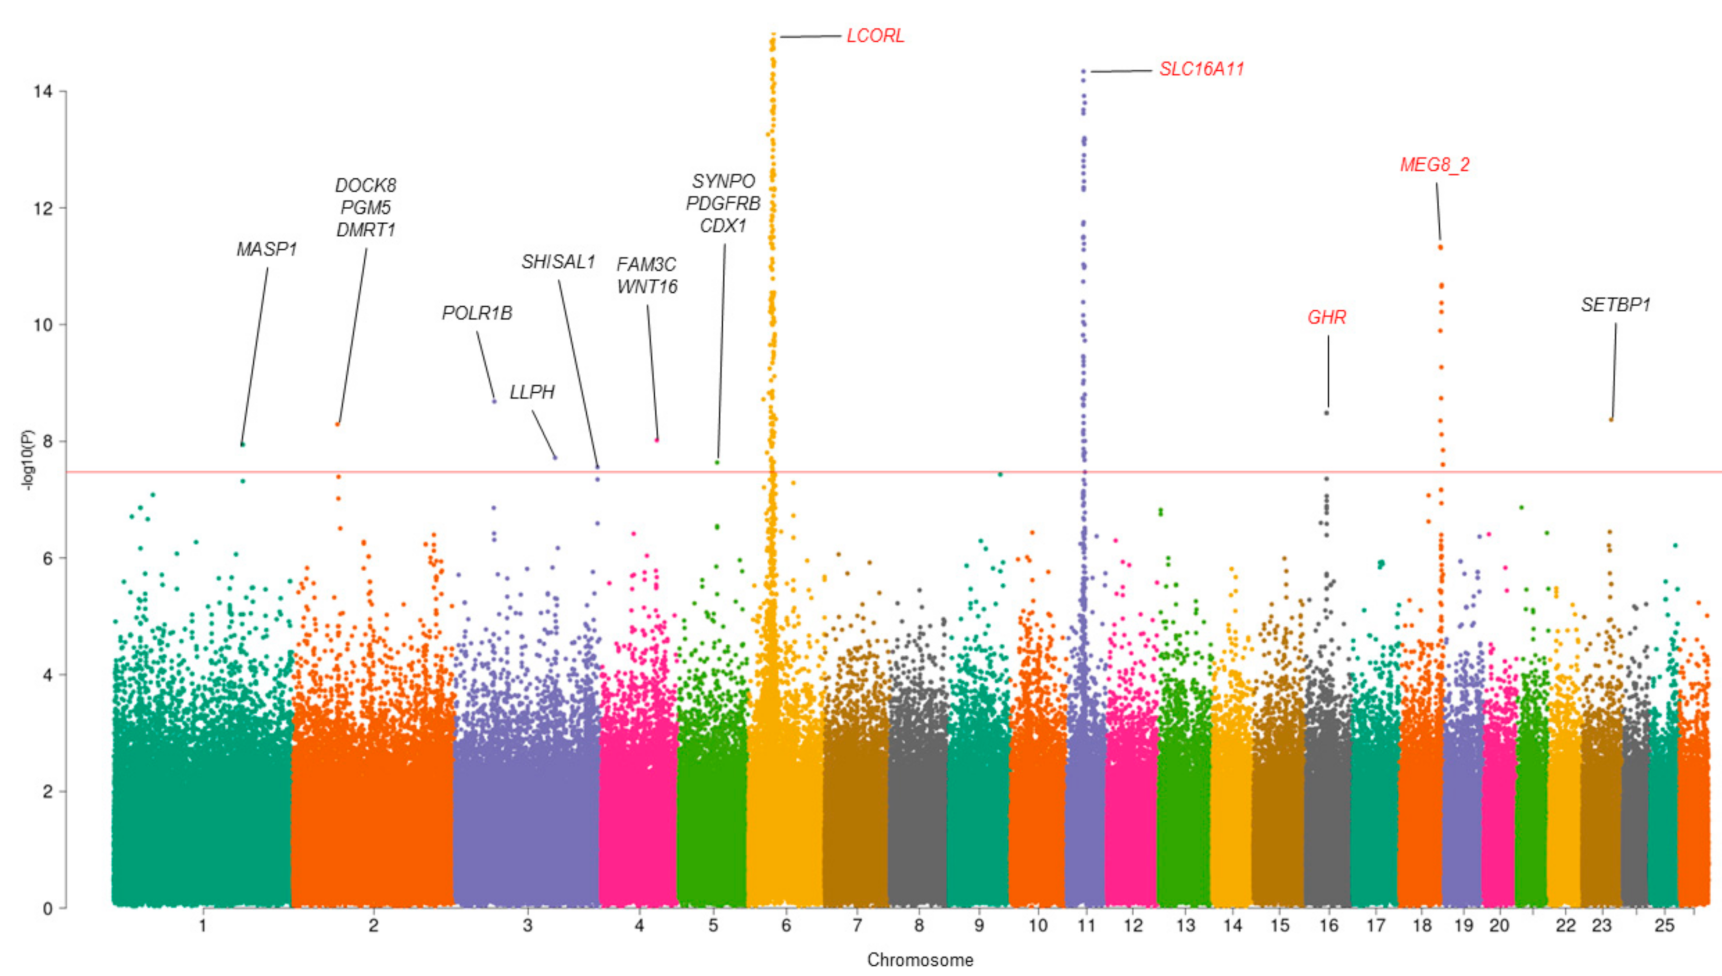
3.1. Multivariate GWAS Analysis
3.2. Literature-Based Gene Prioritization
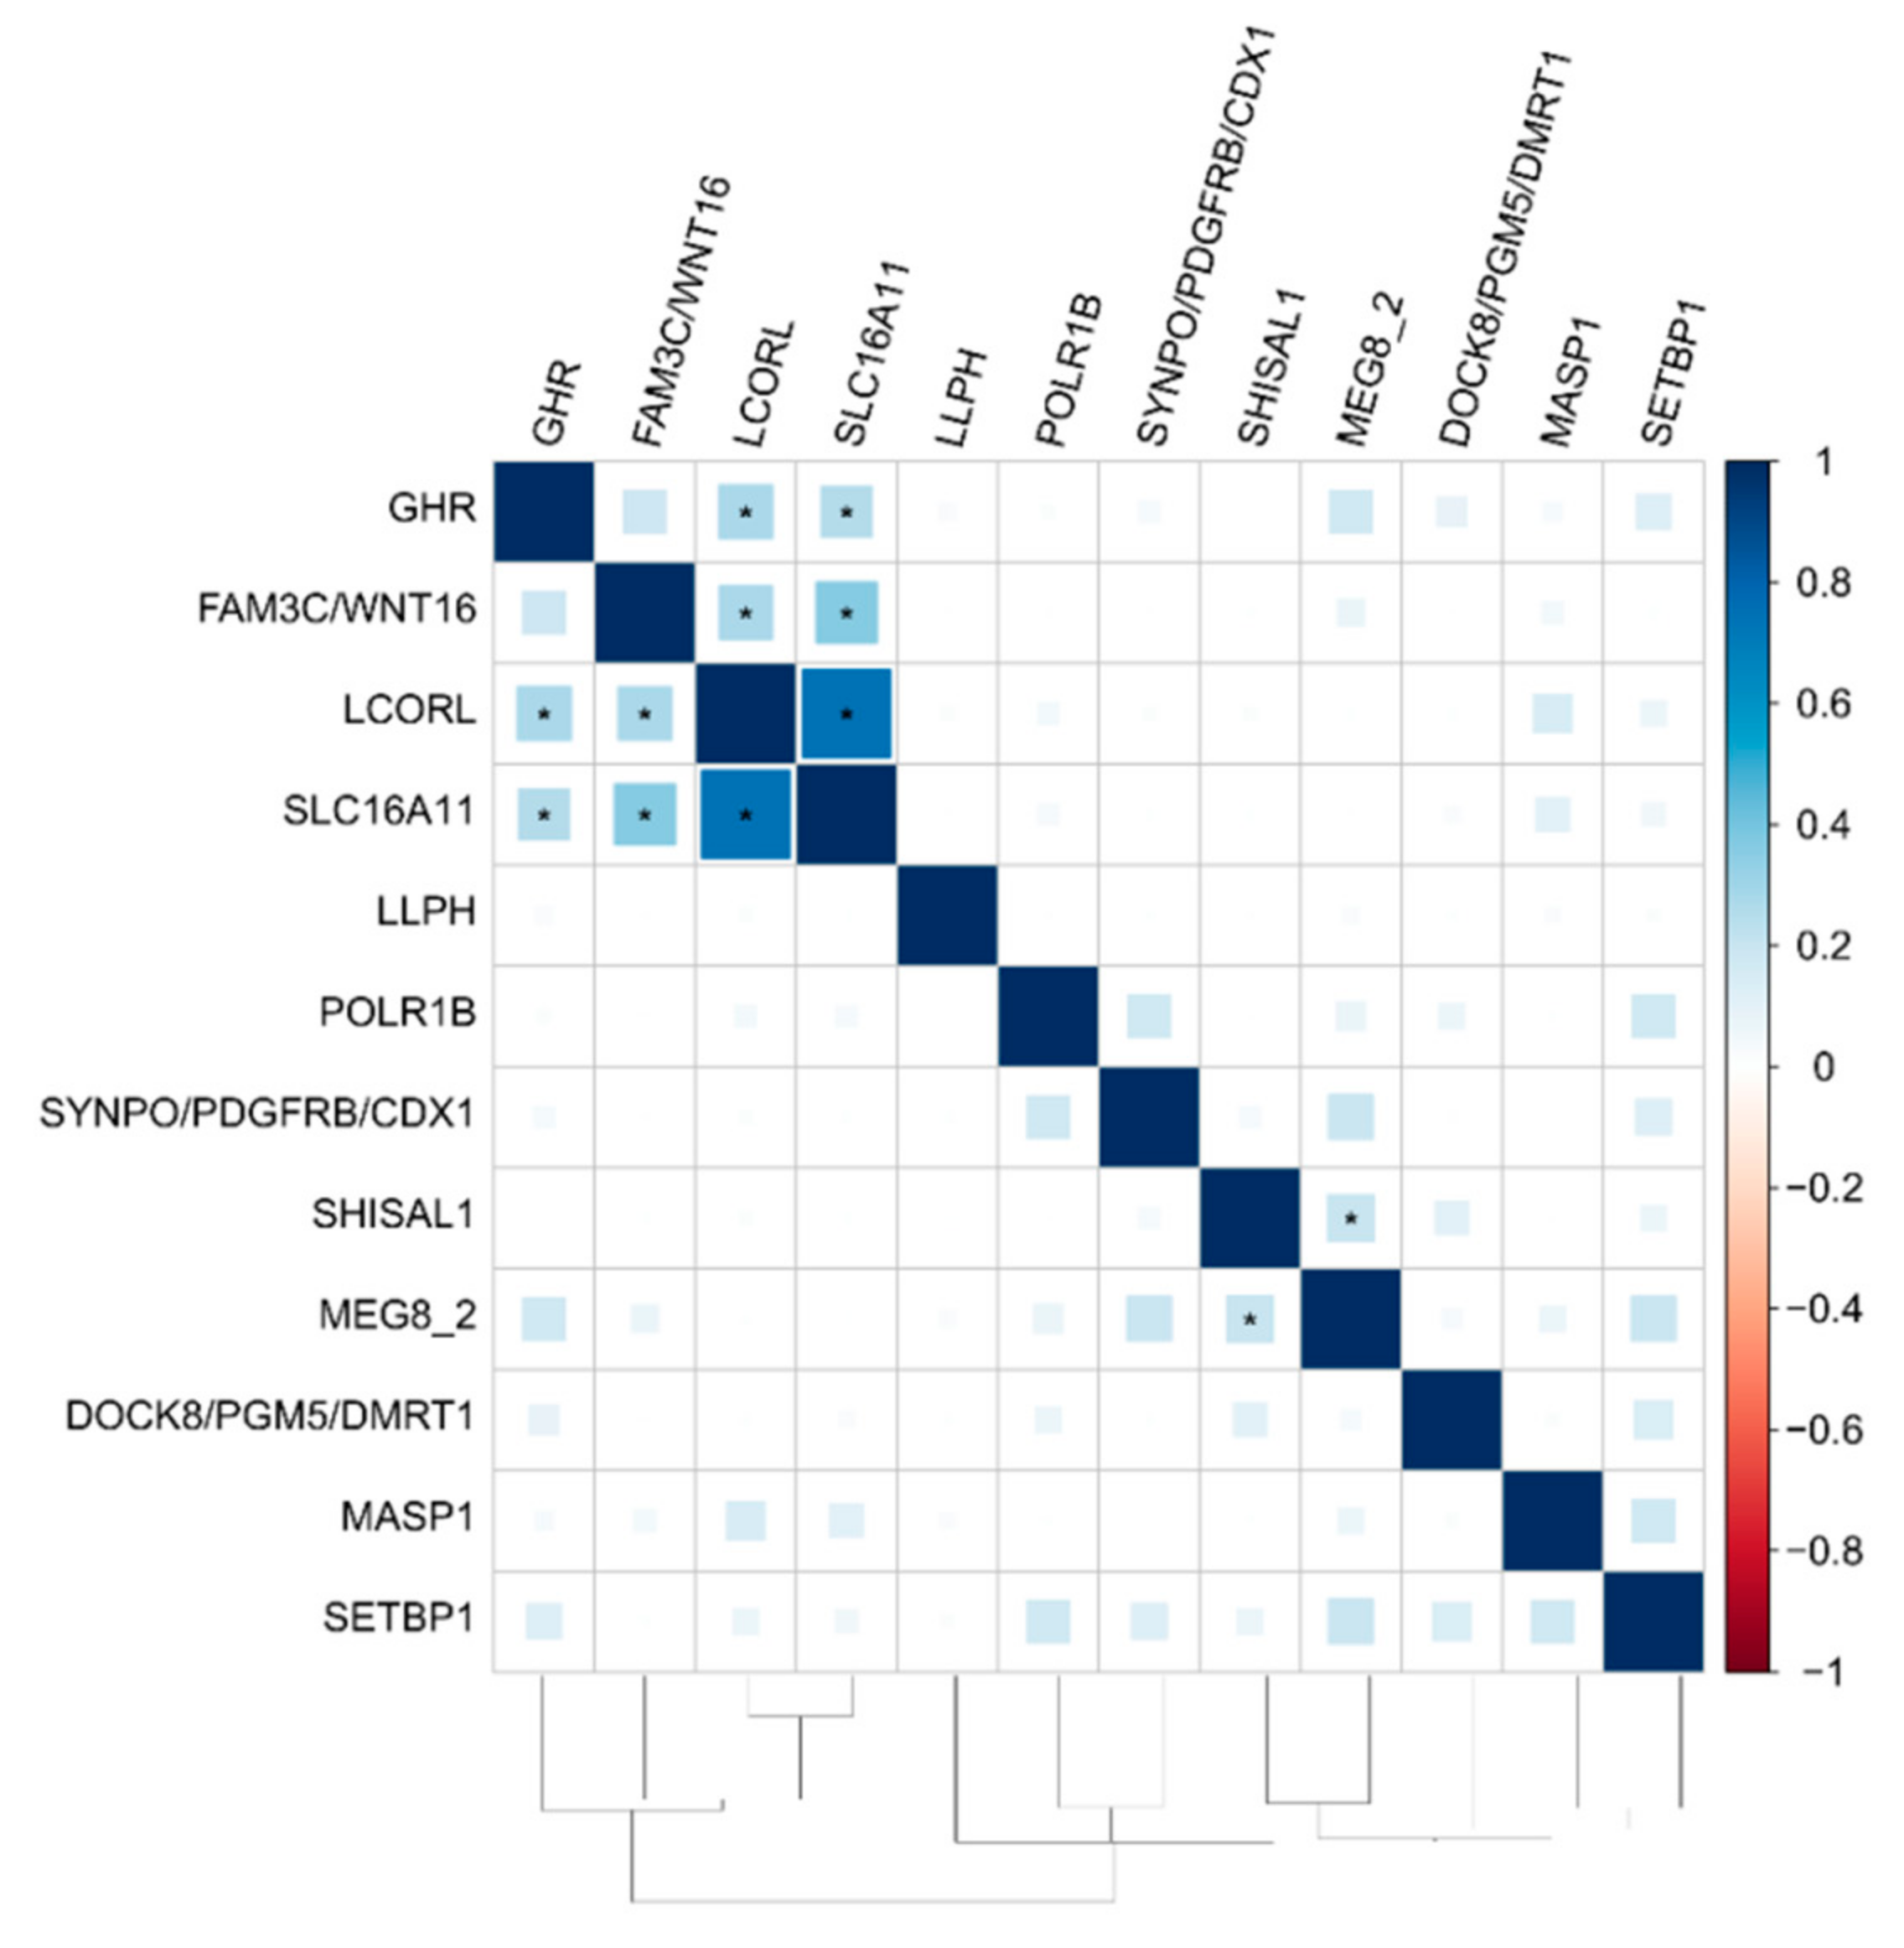
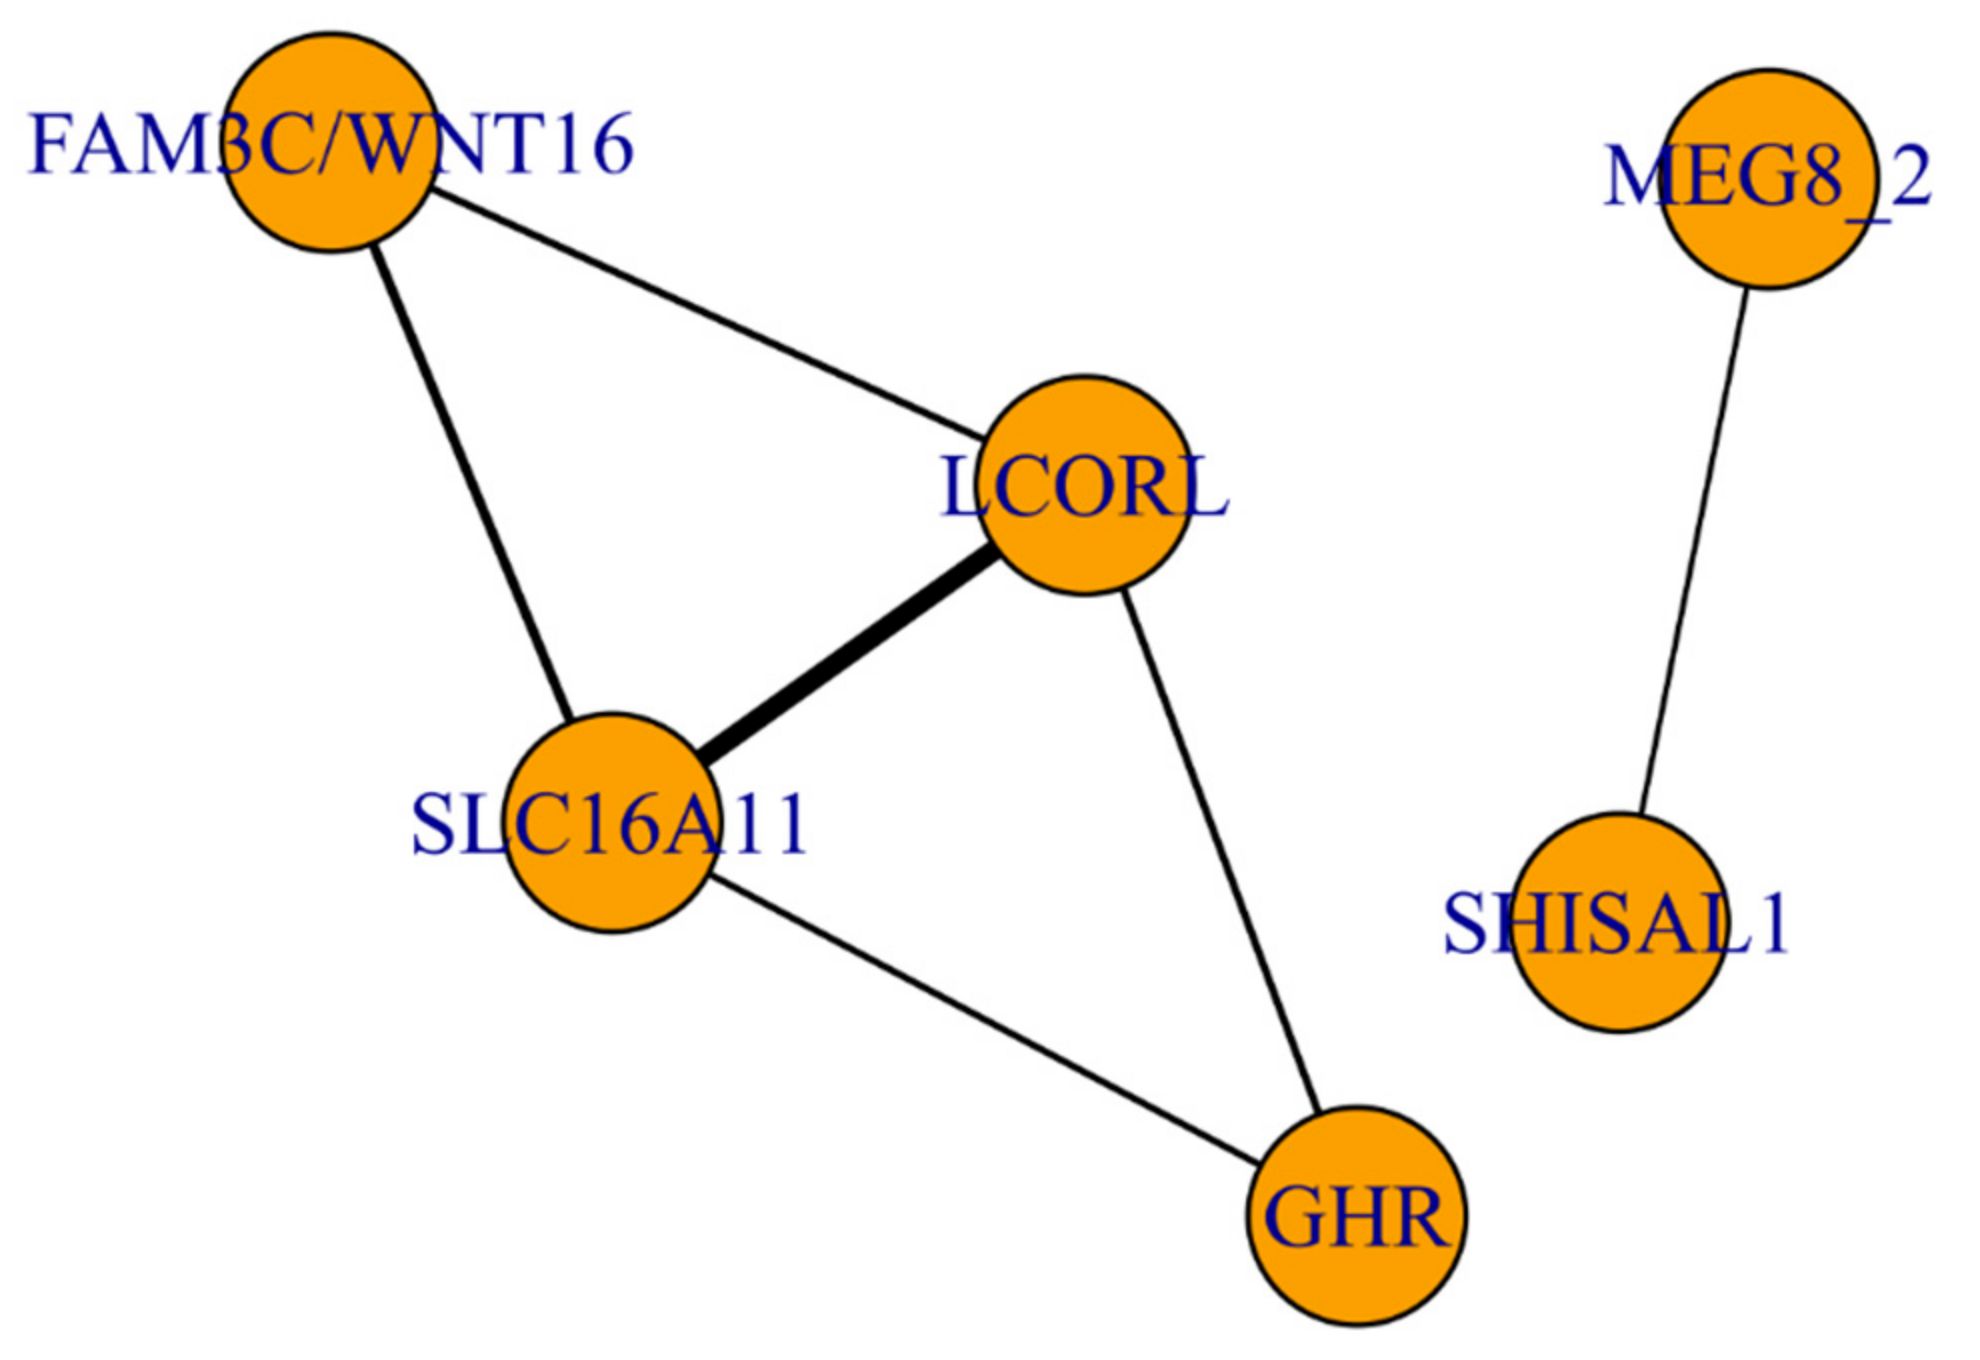
3.3. The Functional Network of Loci Associated with Meat Productivity Traits in Sheep
3.4. Replication in the Russian Independent Sample
4. Discussion
5. Conclusions
Supplementary Materials
Author Contributions
Funding
Institutional Review Board Statement
Informed Consent Statement
Data Availability Statement
Conflicts of Interest
References
- Teixeira, A.; Silva, S.; Rodrigues, S. Advances in Sheep and Goat Meat Products Research, 1st ed.; Elsevier Inc.: Amsterdam, The Netherlands, 2019; Volume 87, ISBN 9780128160497. [Google Scholar]
- Collard, B.C.Y.; Jahufer, M.Z.Z.; Brouwer, J.B.; Pang, E.C.K. An introduction to markers, quantitative trait loci (QTL) mapping and marker-assisted selection for crop improvement: The basic concepts. Euphytica 2005, 142, 169–196. [Google Scholar] [CrossRef]
- Zlobin, A.S.; Volkova, N.A.; Borodin, P.M.; Aksenovich, T.I.; Tsepilov, Y.A. Recent advances in understanding genetic variants associated with growth, carcass and meat productivity traits in sheep (Ovis aries): An update. Arch. Anim. Breed. 2019, 62, 579–583. [Google Scholar] [CrossRef]
- Chung, J.; Jun, G.R.; Dupuis, J.; Farrer, L.A. Comparison of methods for multivariate gene-based association tests for complex diseases using common variants. Eur. J. Hum. Genet. 2019, 27, 811–823. [Google Scholar] [CrossRef]
- Shen, X.; Wang, X.; Ning, Z.; Tsepilov, Y.; Shirali, M.; Smith, B.H.; Hocking, L.J.; Padmanabhan, S.; Hayward, C.; Porteous, D.J. Simple multi-trait analysis identifies novel loci associated with growth and obesity measures. bioRxiv 2015, 22269. [Google Scholar]
- Stephens, M. A Unified Framework for Association Analysis with Multiple Related Phenotypes. PLoS ONE 2013, 8, e65245. [Google Scholar] [CrossRef]
- Shen, X.; Klarić, L.; Sharapov, S.; Mangino, M.; Ning, Z.; Wu, D.; Trbojević-Akmačić, I.; Pučić-Baković, M.; Rudan, I.; Polašek, O.; et al. Multivariate discovery and replication of five novel loci associated with Immunoglobulin G N-glycosylation. Nat. Commun. 2017, 8, 447. [Google Scholar] [CrossRef]
- Timmers, P.R.H.J.; Wilson, J.F.; Joshi, P.K.; Deelen, J. Multivariate genomic scan implicates novel loci and haem metabolism in human ageing. Nat. Commun. 2020, 11, 1–10. [Google Scholar] [CrossRef]
- Brčić, L.; Barić, A.; Gračan, S.; Torlak, V.; Brekalo, M.; Škrabić, V.; Zemunik, T.; Barbalić, M.; Punda, A.; Boraska Perica, V. Genome-wide association analysis suggests novel loci underlying thyroid antibodies in Hashimoto’s thyroiditis. Sci. Rep. 2019, 9, 1–10. [Google Scholar] [CrossRef] [PubMed]
- Bolormaa, S.; Hayes, B.J.; van der Werf, J.H.J.; Pethick, D.; Goddard, M.E.; Daetwyler, H.D. Detailed phenotyping identifies genes with pleiotropic effects on body composition. BMC Genom. 2016, 17. [Google Scholar] [CrossRef]
- Sargolzaei, M.; Chesnais, J.P.; Schenkel, F.S. A new approach for efficient genotype imputation using information from relatives. BMC Genom. 2014, 15. [Google Scholar] [CrossRef]
- Download Sheep Data. Available online: http://bioinformatics.tecnoparco.org/SNPchimp/index.php/download/download-sheep-data (accessed on 2 September 2020).
- Ihaka, R.; Gentleman, R. R: A Language for Data Analysis and Graphics. J. Comput. Graph. Stat. 1996, 5, 299–314. [Google Scholar]
- McLaren, W.; Gil, L.; Hunt, S.E.; Riat, H.S.; Ritchie, G.R.S.; Thormann, A.; Flicek, P.; Cunningham, F. The Ensembl Variant Effect Predictor. Genome Biol. 2016, 17, 122. [Google Scholar] [CrossRef]
- OMIM—Online Mendelian Inheritance in Man. Available online: https://www.omim.org/ (accessed on 2 September 2020).
- Bult, C.J.; Blake, J.A.; Smith, C.L.; Kadin, J.A.; Richardson, J.E.; Anagnostopoulos, A.; Asabor, R.; Baldarelli, R.M.; Beal, J.S.; Bello, S.M.; et al. Mouse Genome Database (MGD) 2019. Nucleic Acids Res. 2019, 47, D801–D806. [Google Scholar] [CrossRef]
- Klarić, L.; Tsepilov, Y.A.; Stanton, C.M.; Mangino, M.; Sikka, T.T.; Esko, T.; Pakhomov, E.; Salo, P.; Deelen, J.; McGurnaghan, S.J.; et al. Glycosylation of immunoglobulin G is regulated by a large network of genes pleiotropic with inflammatory diseases. Sci. Adv. 2020, 6, 24. [Google Scholar] [CrossRef]
- Zhou, X.; Stephens, M. Genome-wide efficient mixed-model analysis for association studies. Nat. Genet. 2012, 44, 821–824. [Google Scholar] [CrossRef]
- Bolormaa, S.; Pryce, J.E.; Reverter, A.; Zhang, Y.; Barendse, W.; Kemper, K.; Tier, B.; Savin, K.; Hayes, B.J.; Goddard, M.E. A Multi-Trait, Meta-analysis for Detecting Pleiotropic Polymorphisms for Stature, Fatness and Reproduction in Beef Cattle. PLoS Genet. 2014, 10, e1004198. [Google Scholar] [CrossRef]
- Kang, H.M.; Sul, J.H.; Service, S.K.; Zaitlen, N.A.; Kong, S.; Freimer, N.B.; Sabatti, C.; Eskin, E. Variance component model to account for sample structure in genome-wide association studies. Nat. Genet. 2010, 42, 348–354. [Google Scholar] [CrossRef]
- Willer, C.J.; Li, Y.; Abecasis, G.R. METAL: Fast and efficient meta-analysis of genomewide association scans. Bioinformatics 2010, 26, 2190–2191. [Google Scholar] [CrossRef] [PubMed]
- Sirmaci, A.; Walsh, T.; Akay, H.; Spiliopoulos, M.; Şakalar, Y.B.; Hasanefendioǧlu-Bayrak, A.; Duman, D.; Farooq, A.; King, M.C.; Tekin, M. MASP1 mutations in patients with facial, umbilical, coccygeal, and auditory findings of carnevale, malpuech, OSA, and michels syndromes. Am. J. Hum. Genet. 2010, 87, 679–686. [Google Scholar] [CrossRef] [PubMed]
- Kearney, C.J.; Randall, K.L.; Oliaro, J. DOCK8 regulates signal transduction events to control immunity. Cell. Mol. Immunol. 2017, 14, 406–411. [Google Scholar] [CrossRef]
- Moiseeva, E.P.; Belkin, A.M.; Spurr, N.K.; Koteliansky, V.E.; Critchley, D.R. A novel dystrophin/utrophin-associated protein is an enzymatically inactive member of the phosphoglucomutase superfamily. Eur. J. Biochem. 1996, 235, 103–113. [Google Scholar] [CrossRef] [PubMed]
- Huang, S.; Ye, L.; Chen, H. Sex determination and maintenance: The role of DMRT1 and FOXL2. Asian J. Androl. 2017, 19, 619–624. [Google Scholar] [CrossRef]
- Guo, X.; Day, T.F.; Jiang, X.; Garrett-Beal, L.; Topol, L.; Yang, Y. Wnt/β-catenin signaling is sufficient and necessary for synovial joint formation. Genes Dev. 2004, 18, 2404–2417. [Google Scholar] [CrossRef]
- Gilbertson, R.J.; Clifford, S.C. PDGFRB is overexpressed in metastatic medulloblastoma. Nat. Genet. 2003, 35, 197–198. [Google Scholar] [CrossRef]
- Nazarian, R.; Shi, H.; Wang, Q.; Kong, X.; Koya, R.C.; Lee, H.; Chen, Z.; Lee, M.K.; Attar, N.; Sazegar, H.; et al. Melanomas acquire resistance to B-RAF(V600E) inhibition by RTK or N-RAS upregulation. Nature 2010, 468, 973–977. [Google Scholar] [CrossRef]
- Lee, J.; Termglinchan, V.; Diecke, S.; Itzhaki, I.; Lam, C.K.; Garg, P.; Lau, E.; Greenhaw, M.; Seeger, T.; Wu, H.; et al. Activation of PDGF pathway links LMNA mutation to dilated cardiomyopathy. Nature 2019, 572, 335–340. [Google Scholar] [CrossRef]
- Bonner, C.A.; Loftus, S.K.; Wasmuth, J.J. Isolation, characterization, and precise physical localization of human CDX1, a caudal-type homeobox gene. Genomics 1995, 28, 206–211. [Google Scholar] [CrossRef] [PubMed]
- Sanchez, E.; Laplace-Builhé, B.; Mau-Them, F.T.; Richard, E.; Goldenberg, A.; Toler, T.L.; Guignard, T.; Gatinois, V.; Vincent, M.; Blanchet, C.; et al. POLR1B and neural crest cell anomalies in Treacher Collins syndrome type 4. Genet. Med. 2020, 22, 547–556. [Google Scholar] [CrossRef] [PubMed]
- Makishima, H.; Yoshida, K.; Nguyen, N.; Przychodzen, B.; Sanada, M.; Okuno, Y.; Ng, K.P.; Gudmundsson, K.O.; Vishwakarma, B.A.; Jerez, A.; et al. Somatic SETBP1 mutations in myeloid malignancies. Nat. Genet. 2013, 45, 942–946. [Google Scholar] [CrossRef] [PubMed]


| SNP | CHR | POS | p-Value_MMass | p-Value_MFat | p-Value_MMeat | ra/ea | Gene |
|---|---|---|---|---|---|---|---|
| rs193632759 * | 1 | 198273462 | 1.14 × 10⁻⁸ | 0.95 | 0.11 | T/G | MASP1 |
| rs420734786 * | 2 | 68158297 | 5.12 × 10⁻⁹ | 0.56 | 0.74 | A/C | DOCK8 PGM5 DMRT1 |
| rs399851221 * | 3 | 60513720 | 2.08 × 10⁻⁹ | 0.30 | 0.38 | T/C | POLR1B |
| rs403766990 * | 3 | 153924034 | 0.02 | 1.93 × 10⁻⁸ | 0.05 | A/G | LLPH |
| rs428034699 * | 3 | 219082890 | 2.78 × 10⁻⁹ | 0.25 | 0.41 | T/C | SHISAL1 |
| rs401990068 * | 4 | 85985834 | 0.41 | 9.62 × 10⁻⁹ | 0.90 | T/G | FAM3C WNT16 |
| rs408893215 * | 5 | 59475661 | 0.06 | 2.31 × 10⁻⁸ | 0.01 | T/C | SYNPO PDGFRB CDX1 |
| rs401834107 | 6 | 37530647 | 6.04 × 10−94 | 9.73 × 10⁻²⁴ | 5.11× 10⁻¹² | T/C | LCORL |
| rs161042491 | 11 | 26445930 | 2.34 × 10−41 | 2.64 × 10⁻¹⁰ | 1.15 × 10⁻⁶ | A/G | SLC16A11 |
| rs405660596 | 16 | 31871071 | 3.28 × 10⁻⁹ | 0.03 | 8.73 × 10⁻⁴ | A/C | GHR |
| rs408838557 | 18 | 62894338 | 4.64 × 10⁻¹² | 5.04 × 10⁻⁸ | 1.29 × 10⁻³ | A/C | MEG8_2 |
| rs418394153 * | 23 | 44492468 | 4.27 × 10⁻⁹ | 0.60 | 0.28 | A/G | SETBP1 |
Publisher’s Note: MDPI stays neutral with regard to jurisdictional claims in published maps and institutional affiliations. |
© 2021 by the authors. Licensee MDPI, Basel, Switzerland. This article is an open access article distributed under the terms and conditions of the Creative Commons Attribution (CC BY) license (http://creativecommons.org/licenses/by/4.0/).
Share and Cite
Zlobin, A.S.; Nikulin, P.S.; Volkova, N.A.; Zinovieva, N.A.; Iolchiev, B.S.; Bagirov, V.A.; Borodin, P.M.; Aksenovich, T.I.; Tsepilov, Y.A. Multivariate Analysis Identifies Eight Novel Loci Associated with Meat Productivity Traits in Sheep. Genes 2021, 12, 367. https://doi.org/10.3390/genes12030367
Zlobin AS, Nikulin PS, Volkova NA, Zinovieva NA, Iolchiev BS, Bagirov VA, Borodin PM, Aksenovich TI, Tsepilov YA. Multivariate Analysis Identifies Eight Novel Loci Associated with Meat Productivity Traits in Sheep. Genes. 2021; 12(3):367. https://doi.org/10.3390/genes12030367
Chicago/Turabian StyleZlobin, Alexander S., Pavel S. Nikulin, Natalia A. Volkova, Natalia A. Zinovieva, Baylar S. Iolchiev, Vugar A. Bagirov, Pavel M. Borodin, Tatiana I. Aksenovich, and Yakov A. Tsepilov. 2021. "Multivariate Analysis Identifies Eight Novel Loci Associated with Meat Productivity Traits in Sheep" Genes 12, no. 3: 367. https://doi.org/10.3390/genes12030367
APA StyleZlobin, A. S., Nikulin, P. S., Volkova, N. A., Zinovieva, N. A., Iolchiev, B. S., Bagirov, V. A., Borodin, P. M., Aksenovich, T. I., & Tsepilov, Y. A. (2021). Multivariate Analysis Identifies Eight Novel Loci Associated with Meat Productivity Traits in Sheep. Genes, 12(3), 367. https://doi.org/10.3390/genes12030367