Article

Identification and Characterization of the APX Gene Family and Its Expression Pattern under Phytohormone Treatment and Abiotic Stress in Populus trichocarpa

1
State Key Laboratory of Tree Genetics and Breeding, Northeast Forestry University, Harbin 150040, China
2
College of Life Science, Northeast Forestry University, Harbin 150040, China
3
School of Forestry, Northeast Forestry University, Harbin 150040, China
4
College of Forestry, Guizhou University, Guiyang 550025, China
*
Author to whom correspondence should be addressed.
These authors contributed equally to this work.
Genes 2021, 12(3), 334; https://doi.org/10.3390/genes12030334
Submission received: 22 January 2021 / Revised: 19 February 2021 / Accepted: 22 February 2021 / Published: 25 February 2021
(This article belongs to the Special Issue Genetic and Epigenetic Changes in Plant Response to Abiotic Stress)

Abstract

:
Ascorbate peroxidase (APX) is a member of class I of the heme-containing peroxidase family. The enzyme plays important roles in scavenging reactive oxygen species for protection against oxidative damage and maintaining normal plant growth and development, as well as in biotic stress responses. In this study, we identified 11 APX genes in the Populus trichocarpa genome using bioinformatic methods. Phylogenetic analysis revealed that the PtrAPX proteins were classifiable into three clades and the members of each clade shared similar gene structures and motifs. The PtrAPX genes were distributed on six chromosomes and four segmental-duplicated gene pairs were identified. Promoter cis-elements analysis showed that the majority of PtrAPX genes contained a variety of phytohormone- and abiotic stress-related cis-elements. Tissue-specific expression profiles indicated that the PtrAPX genes primarily function in roots and leaves. Real-time quantitative PCR (RT-qPCR) analysis indicated that PtrAPX transcription was induced in response to drought, salinity, high ammonium concentration, and exogenous abscisic acid treatment. These results provide important information on the phylogenetic relationships and functions of the APX gene family in P. trichocarpa.

1. Introduction

On account of their immobility, plants are frequently subject to diverse environmental stresses, including biotic and abiotic stresses, such as insect attack, drought, chilling, and flooding [1]. Exposure to stress stimulates the production of reactive oxygen species (ROS), which induce a suite of stress responses in the plant. Accumulation of excessive ROS may cause injury to the plant, such as damage to cell membranes and organelles [2,3]. Ascorbate peroxidase (APX) is an important antioxidant enzyme involved in active oxygen metabolism in plants. The enzyme catalyzes the formation of O2 and H2O from the substrate hydrogen peroxide (H2O2) to protect the plant from oxidative damage caused by excessive H2O2 accumulation. Thus, APX plays a crucial role in redox homeostasis and the scavenging of ROS in plants [4,5].
Ascorbate peroxidase is a protease encoded by members of a polygenic family. The family is divided into four classes based on the subcellular localization of the protein, namely the cytosol, peroxisomes, chloroplasts, and mitochondria [5,6]. In Arabidopsis thaliana, eight members of the AtAPX gene family have been identified, which encode three cytosolic (AtAPX1, -2, and -6), three peroxisomal (AtAPX3, -4, and -5), and two chloroplastic (AtsAPX and AttAPX) proteins [7,8], of which AtsAPX binds to both the chloroplast matrix and mitochondria [9]. In rice (Oryza sativa), eight APX genes have been identified, including two cytosolic isozymes (OsAPX1 and -2), two peroxisomal isozymes (OsAPX3 and -4), three chloroplastic isozymes (OsAPX5, -7, and -8), and one mitochondrial isozyme (OsAPX6) [10,11,12]. The function of an APX protein varies with its subcellular localization. For instance, APX localized in mitochondria is mainly involved in scavenging H2O2 produced by β-oxidation of fatty acids [13]. Cytoplasmic OsAPX2 plays important roles in chloroplast protection and H2O2 homeostasis [14]. Silencing of OsAPX4, which encodes a peroxisomal protein, results in a premature aging phenotype in rice [10]. The same phenotypic response is observed in other plants species, such as Arabidopsis [15] and Chenopodium album [16].
Ascorbate peroxidase genes play important roles in plant growth, development, and response to environmental stress. The Arabidopsis apx1 mutant grows slowly and is sensitive to oxidative stress in comparison with the wild type (ecotype Col-0) [2,17,18]. The apx1 tapx double mutant of Arabidopsis shows substantial accumulation of anthocyanins and delayed flowering time under light stress [8,19]. The ROS content is increased and the germination frequency is reduced in seeds of the Arabidopsis apx6 mutant [20]. Loss-of-function of OsAPX4 results in a premature senescence phenotype in leaves of rice [21]. The rice apx2 mutant exhibits semi-dwarf seedlings, yellow-green leaves, and sterile seeds [22]. Expression of a rice cytosolic OsAPX gene in transgenic Arabidopsis elevates salt tolerance [23]. Drought stress tolerance is enhanced by over-expression of a peroxisomal ascorbate peroxidase (SbpAPX) of Salicornia brachiata in tobacco (Nicotiana tabacum) [24]. The expression level of the majority of APX genes is up-regulated in response to abscisic acid (ABA) treatment in maize (Zea mays) [25]. However, in contrast to studies of APX genes in herbaceous plant species, there is a paucity of research on genome-wide identification and expression pattern analysis of the APX gene family in woody plants.
Populus is characterized by its ease of vegetative propagation and rapid growth rate, and considerable genomic information is publicly available [26,27]. As a model species for woody plants, Populus trichocarpa is widely used in forest tree molecular breeding and resistance breeding research. The PpAPX gene in Populus tomentosa has been cloned and it has been found that overexpression of PpAPX increases drought and salt tolerance in transgenic tobacco [28,29]. PtomtAPX and PtosAPX located in mitochondria of Populus tomentosa Carr were identified. PtosAPX is dual targeted to both chloroplast and mitochondria, while PtomtAPX is specifically targeted to mitochondria and plays an important role in maintaining the redox balance [30]. As an important component of the ROS antioxidant system, the molecular characteristics of PtrAPX genes and their functions require detailed investigation. In this study, we identified 11 APX genes in the P. trichocarpa genome. We analyzed the chromosomal location, gene structure, phylogenetic relationships, physicochemical properties, and expression patterns of members of the PtrAPX gene family in response to abiotic stress and exogenous ABA treatment. The results provide a foundation for future exploration of the molecular mechanisms of APXs in poplar exposed to environmental stresses.

2. Materials and Methods

2.1. Identification of APX Genes in P. trichocarpa Genome

The amino acid sequences of the eight identified AtAPX genes were downloaded from The Arabidopsis Information Resource database (https://www.arabidopsis.org/, accessed on 2 September 2020). We used the protein family database Pfam (http://pfam.xfam.org/, accessed on 3 September 2020) to search for the hidden Markov model (HMM) profile of the APX gene family (protein family ID: PF06200) based on an expected value (E-value) cutoff of 1× 10⁻⁵ in HMMER 3.3 (http://hmmer.org, accessed on 3 September 2020) to find APX genes in the P. trichocarpa genome and then remove the redundancy with some specifications. All candidate PtrAPX genes were assessed for presence of the conserved Haem-peroxidase domain (IPR002016) using the InterProScan database (http://www.ebi.ac.uk/interpro/, accessed on 3 September 2020) and peroxidase (PF00141) in the pfam database (http://pfam.xfam.org/, accessed on 3 September 2020). The subcellular localization of the PtrAPX proteins was predicted using WoLF PSORT (https://www.genscript.com/wolf-psort.html, accessed on 5 September 2020). Physicochemical properties of the PtrAPX amino acid sequences, such as theoretical isoelectric point, molecular weight, number of amino acids, aliphatic index, and grand average of hydropathicity (GRAVY) index, were estimated using the ProtParam tool of the Expasy (https://web.expasy.org/protparam/, accessed on 5 September 2020) online portal. Transmembrane analysis was conducted using the TMHMM Server v2.0 (https://www.cbs.dtu.dk/services/TMHMM/, accessed on 5 September 2020) online database.

2.2. Gene Structure and Conserved Motif Analysis

The exon–intron structure of the PtrAPX gene family members was analyzed using the Gene Structure Display Server (GSDS 2.0 http://gsds.cbi.pku.edu.cn/, accessed on 6 September 2020). The conserved motifs of the PtrAPX proteins were identified using the MEME Suite 5.1.1 (MEME http://meme-suite.org/tools/meme, accessed on 6 September 2020) online tools.

2.3. Chromosomal Location, Duplication Analysis, and Ka/Ks Calculation

The chromosomal location of PtrAPX genes in the P. trichocarpa genome was determined using the PopGenIE v3: The Populus Genome Integrative Explorer database (http://popgenie.org/, accessed on 8 September 2020). A schematic representation of the chromosomal locations was generated using the MapGene2Chromosome v2 (http://mg2c.iask.in/mg2c_v2.0/, accessed on 8 September 2020) online tool. For Ka/Ks calculation, the coding sequences of paralogous gene pairs performed multiple alignment using ClustalW, and then, the values of Ka and Ks were calculated using Synonymous and NonSynonymous Substitutions in DnaSP software (version 6.12.03) [31]. The divergence time (T) was calculated as T = Ks/2 × 6.1 × 10−9 Mya [32].

2.4. Promoter cis-Element Analysis

The promoter sequence (2 kb upstream of the initiation codon) of each PtrAPX gene family member was downloaded from the Phytozome v12.1 database using the corresponding PtrAPX gene ID. The PlantCARE online database (http://bioinformatics.psb.ugent.be/webtools/plantcare/html/, accessed on 9 September 2020) was used to identify the abiotic stress- and phytohormone-related cis-elements in the PtrAPX promoters. IBS: Illustrator for Biological Sequences software was used to visualize the results.

2.5. Multiple Sequence Alignment and Phylogenetic Analysis

The PtrAPX protein sequences were aligned using Clustal X 2.0 [33] and Bioedit 7.2.5 software. MEGA 7.0 [34] was used to construct a phylogenetic tree (with 1000 bootstrap replications) of the APX gene family in P. trichocarpa, Arabidopsis, and rice using the neighbor-joining (NJ) method.

2.6. Prediction of the Secondary and Tertiary Structure of Proteins

We predicted the secondary structure of the PtrAPX proteins using the NPSA (https://npsa-prabi.ibcp.fr/cgi-bin/npsa_automat.pl?page=npsa_sopma.html, accessed on 12 September 2020) online software. The tertiary structure of PtrAPX proteins was predicted using the SWISS-MODEL database (https://swiss model.expasy.org/, accessed on 2 November 2020).

2.7. Tissue-Specific Expression Analysis

Visualized images of the tissue-specific expression pattern for each PtrAPX gene were downloaded from the PopGenIE v3 database (http://popgenie.org/, accessed on 12 September 2020) using the gene ID [35]. Then we used three-week-old in vivo P. trichocarpa to verify the expression level of each PtrAPX gene in roots and leaves using RT-qPCR. The specific primers are listed in Supplementary Table S1.

2.8. Plant Materials, Abiotic Stress, and Phytohormone Treatment

In vivo P. trichocarpa (genotype Nisqually-1) was cultured in a tissue culture laboratory under a 16/8 h (light/dark) photoperiod with light intensity of 50 µmol photons m−2 s−1 at 23–25 °C. Wild-type P. trichocarpa seedlings were cultured on a woody plant medium (WPM; pH 5.8) for 3 weeks to use for abiotic stress and phytohormone treatment. For abiotic stress treatment, consistently growing 3-week-old P. trichocarpa were transferred to a WPM supplemented with 7% PEG6000, 150 mM NaCl, or 10 mM (NH4)2SO4 (high ammonium: NH4+). For phytohormone treatment, wild-type P. trichocarpa was transferred to a WPM supplemented with 200 µM ABA. Each abiotic stress and phytohormone treatment was applied for 0, 3, 6, 12, and 24 h, of which the 3 and 6 h time points served as an early response, whereas the 12 and 24 h time points served as a later response. Nontreated seedlings of P. trichocarpa served as the control. Fresh roots and leaves from plants in each stress and phytohormone treatment were sampled at the corresponding time points, immediately frozen in liquid nitrogen, and stored at −80 °C until use. Each sample consisted of three biological replicates.

2.9. RNA Extraction and RT-qPCR Analysis

Total RNA was extracted from different tissues using pBIOZOL Plant Total RNA Extraction Reagent (BioFlux, Hangzhou, China) according to the protocol; then the extracted total RNA was treated with gDNA Eraser to remove genomic DNA as following the reaction system (5× g Eraser Buffer 2 μL, gDNA Eraser 1 μL, total RNA 1 µg) (Takara Bio, Dalian, China). Next, total RNA (1 µg) was reverse transcribed using the PrimeScriptTM RT kit (Takara Bio, Dalian, China) to obtain cDNA as following reaction system (PrimerScript RT Enzyme Mix I 1 μL, RT Primer Mix 1 μL, 5× PrimerScript Buffer 4 μL, total RNA 1 µg). The quantitative real-time PCR used an UltraSYBR Mixture (Low ROX) (CWBIO) with three biological replicates, and the detailed procedure referred to the manufacturer’s instructions. The RT-qPCR reaction was performed by qTOWER 3G Cycler (Analytik Jena, Germany) and the relative expression level analysis was calculated using 2−△△CT method [36,37]. We selected the UBQ7 gene as an internal reference gene [38,39]. All PtrAPX specific primers for RT-qPCR and UBQ7 gene primers are listed in Supplementary Table S1.

2.10. Gene Ontology of P. trichocarpa APXs

The gene ontology (GO) annotation of PtrAPX genes was conducted using Blast2GO v5.2 software. First, we uploaded all protein sequences to Blast2GO and blasted the sequences in the NCBI online database. After mapping and annotation, the GO results and visualized images were downloaded. All procedures were conducted using the default parameters.

2.11. Statistical Analysis

Student’s t test was performed using SPSS (version, IBM, Chicago, IL, USA) software to determine significance. Significance was defined as * p < 0.05, ** p <0.01. The detailed statistical analysis is listed in Supplementary Table S2.

3. Results

3.1. Identification of APX Genes in the P. trichocarpa Genome

Eight members of the APX gene family have been identified previously in the Arabidopsis genome, consisting of AtAPX1–6, AtsAPX (stromal APX), and AttAPX (thylakoid membrane- bound APX) [7,8,9]. To identify all APX genes in the P. trichocarpa genome, we used the eight AtAPX protein sequences for a BLAST search to detect homologs in the P. trichocarpa genome. Eleven candidate APX gene family members (hereafter PtrAPX) were identified in the P. trichocarpa genome. The 11 PtrAPX genes all possessed the ascorbic acid peroxidase domain (protein ID: IPR002016) as predicted with the InterProScan database. The PtrAPX genes were designated PtrAPX1 to PtrAPX11 based on the chromosomal location. The protein length and molecular weight ranged from 96 to 486 aa and 10,226.73 to 53,657.88 Da, respectively. The aliphatic index ranged from 72.6 to 92.5. The GRAVY score ranged from −0.491 to 0.255. PtrAPX6 possessed the maximum aliphatic index and GRAVY score, and was the only gene to show a positive GRAVY score. Prediction of the subcellular localization of the PtrAPX proteins using WoLF PSORT revealed that PtrAPX2, -3, -6, -7, -9, -10, and -11 were predicted to be cytoplasmic, PtrAPX1 and 8 were predicted to be localized to the chloroplast stroma and chloroplast thylakoid membrane, respectively, and PtrAPX4 and -5 were predicted to be localized to the chloroplast. Details for the PrtAPX genes are presented in Table 1.

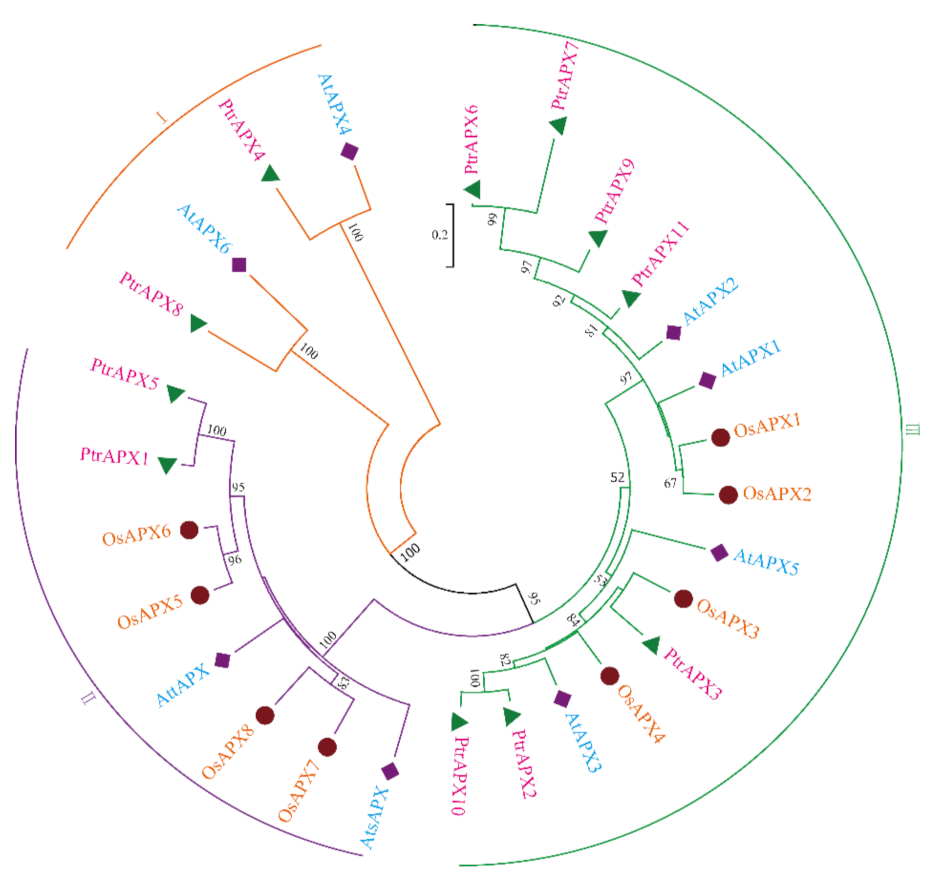
3.2. Phylogenetic Analysis

To evaluate the evolutionary relationships among plant APX genes, an unrooted NJ tree was constructed derived from Arabidopsis, rice, and P. trichocarpa APX protein sequences. The proteins were resolved into three clades (Figure 1). Previous research has shown that the classification of APX genes is consistent with the subcellular localization of the protein [5,40]. Thus, based on the predicted subcellular localization of the PtrAPX proteins, the three clades of the unrooted NJ tree were designated I (cytoplasmic), II (chloroplastic or mitochondrial), and III (chloroplastic). The majority of PtrAPX proteins were classified in clade III, PtrAPX1 and five were placed in clade II, and PtrAPX4 and -8 were classified in clade I. Rice is a monocotyledon and OsAPX proteins were predominantly clustered together. The majority of PtrAPX family members were clustered with Arabidopsis proteins, which indicated that PtrAPX genes were phylogenetically more closely related to those of Arabidopsis than to those of rice. The accession numbers and amino acid sequences of P. trichocarpa, Arabidopsis and rice are provided in Supplemental File 1.

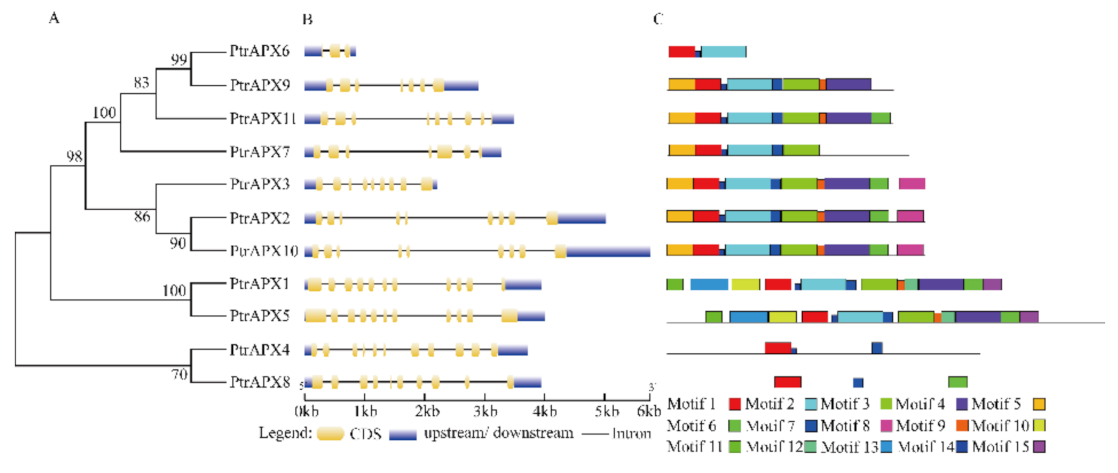
3.3. Gene Structure and Conserved Motifs of PtrAPX Genes

To further explore the phylogenetic relationships among PtrAPX proteins, an NJ tree was constructed from a multiple alignment of full-length PtrAPX protein sequences. We identified four paralogous pairs (PtrAPX1 and -5, PtrAPX2 and -10, PtrAPX4 and -8, and PtrAPX6 and -9), all of which received strong bootstrap support (>70%; Figure 2A). Analysis of the exon–intron organization revealed that the homologs showed similar numbers of exons and introns. For example, PtrAPX2 and its homolog, PtrAPX10, contained eight introns, the same number as PtrAPX1 and 5, and PtrAPX4 and -8. PtrAPX6 contained the fewest introns (Figure 2B). The MEME database was used to analyze conserved motifs in the PtrAPX genes (Supplementary Table S3). All PtrAPX genes contained motif 1 and nine PtrAPX genes possessed motif 3. The paralogous pairs contained similar motifs, such as PtrAPX2 and -10. PtrAPX1 and -5 contained -13 motifs, whereas PtrAPX4, -6, and -8 contained three motifs (Figure 2C).

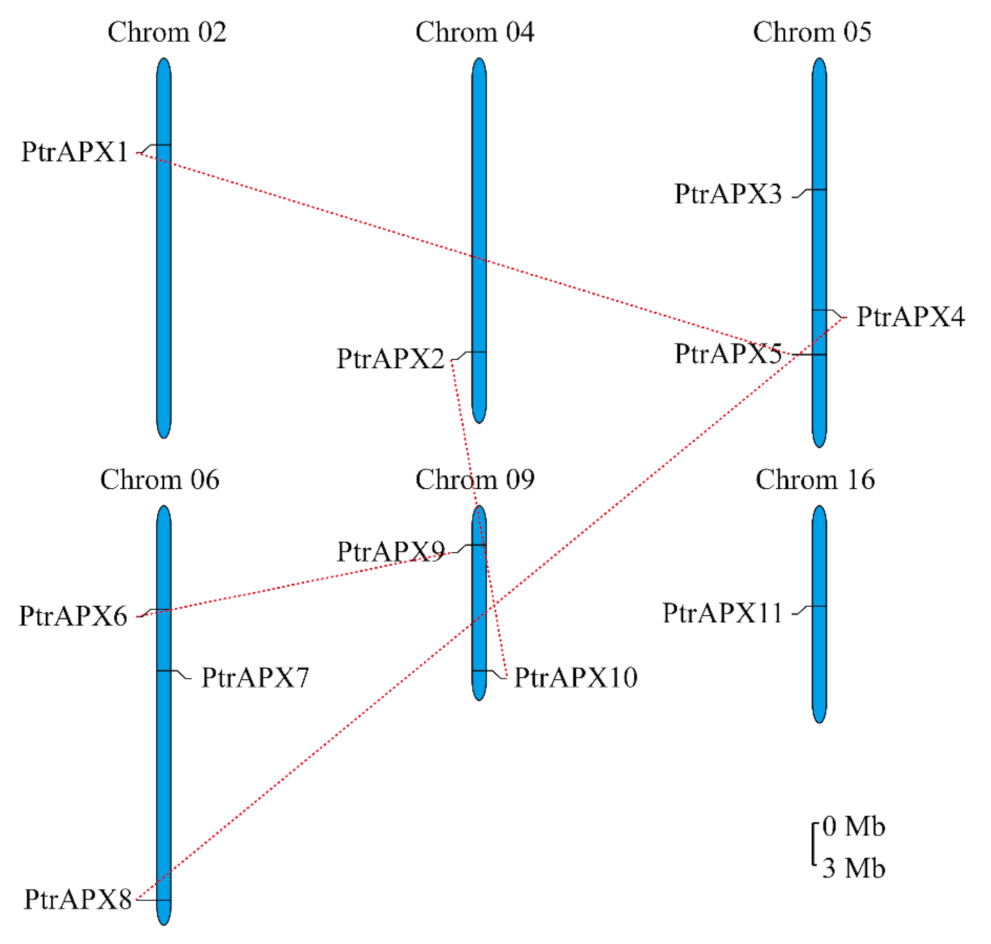
3.4. Chromosomal Location and Duplications of PtrAPX Genes

The chromosomal locations of PtrAPX genes were physically mapped on the 19 chromosomes of P. trichocarpa. The 11 PtrAPX genes were distributed on six chromosomes, namely chromosomes 02, 04, 05, 06, 09, and 16 (Figure 3). Chromosomes 05 and 06 each carried three PtrAPX genes. PtrAPX1, 2, and 11 were located on chromosomes 02, 04, and 16, respectively. PtrAPX9 and 10 were located on chromosome 09. All genes except PtrAPX7 were located in a duplicated chromosomal region. To better understand the evolutionary constraints associated with the PtrAPX genes the Ka/Ks values were calculated. Detailed information on the Ka/Ks values of the PtrAPX genes is listed in Table 2. The Ka/Ks values of the PtrAPX1PtrAPX5, PtrAPX2PtrAPX10 and PtrAPX4PtrAPX8 paralogous pairs were less than 1, which indicated that the evolution of the majority of paralogous pairs was under purifying selection. Therefore, the gene pairs may have the same functions. The Ka/Ks value of the PtrAPX6PtrAPX9 paralogous pair was 1.22, which suggested that these genes underwent positive selection and may be involved in different functions.

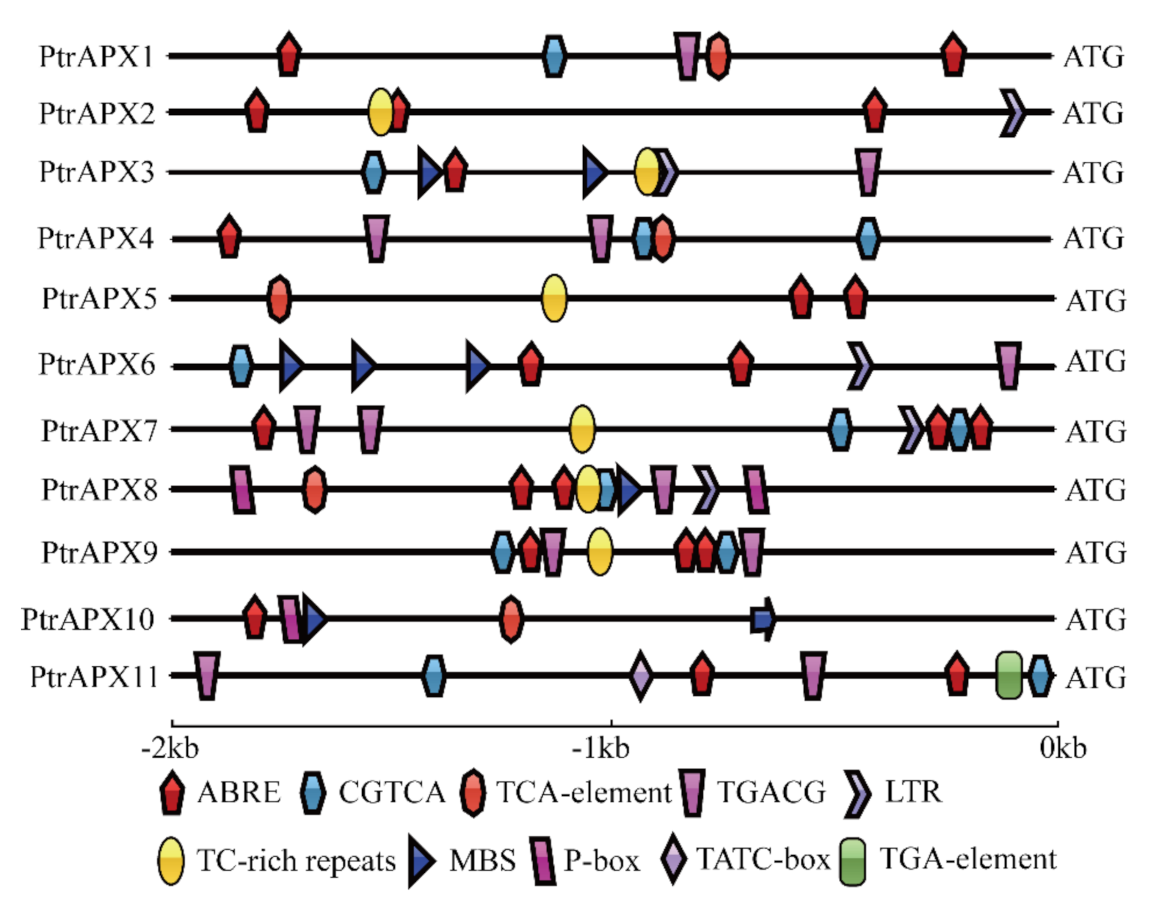
3.5. Promoter cis-Element Analysis

Promoter cis-elements function as transcription factor binding sites and play an important role in transcriptional regulation in response to abiotic stress and phytohormone treatment [41]. We identified putative abiotic stress- and phytohormone-related cis-elements in the promoter region of PtrAPX genes to explore the possible regulatory mechanisms of the genes. Ten types of abiotic stress- and phytohormone-related cis-elements were identified (Figure 4). With regard to phytohormone-related cis-elements, all PtrAPX genes contained the ABRE element (involved in ABA responsiveness), which indicated that PtrAPX genes may play a pivotal role in ABA response. PtrAPX8 and 10 contained the P-box (a gibberellin-responsive element). PtrAPX1, 4, 5, 8, and 10 possessed the TCA element (a cis-acting element involved in salicylic acid responsiveness). Only PtrAPX11 contained an additional gibberellin-responsive element (TATC-box) and the TGA-element (an auxin-responsive element). Interestingly, eight PtrAPX genes possessed CGTCA and TGACG motifs, which are both involved in methyl jasmonate responsiveness. With regard to abiotic stress-related cis-elements, all but PtrAPX1, 3, 6, 10, and 11 contained TC-rich repeats (cis-acting elements involved in defense and stress responsiveness). These four genes each contained the LTR element (involved in low-temperature responsiveness) and MYB-binding site (MBS; involved in drought-inducibility). Importantly, PtrAPX6 contained three MBS cis-elements in the promoter region, which indicated that PtrAPX6 may participate in the response to drought stress. It was notable that PtrAPX3, 6, and 8 contained all abiotic stress-related cis-elements, which indicated that these three genes may play an important role in abiotic stress response.

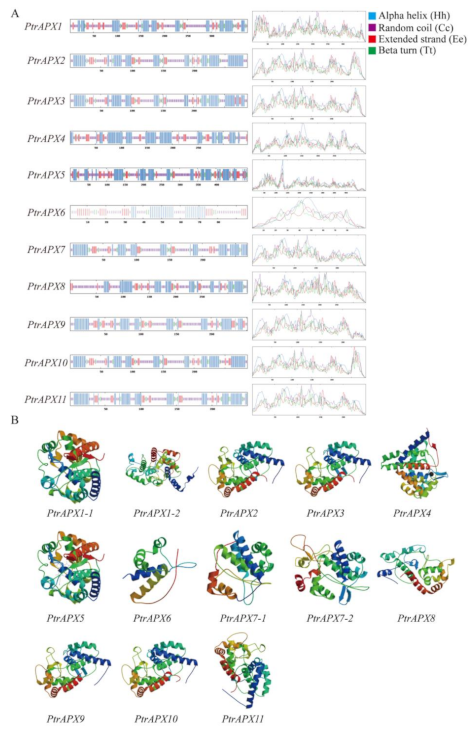
3.6. Prediction of the Secondary and Tertiary Structure of APX Proteins
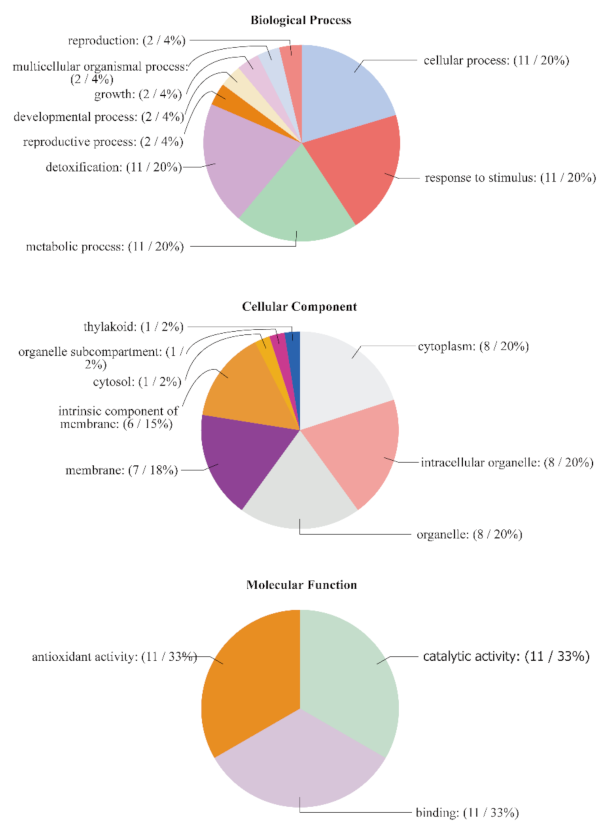
Protein is the basic unit of life activities and its structure determines its function. The study of protein structure is helpful to gain a thorough understanding of its function [42]. The secondary and tertiary structures of APX proteins was predicted using the Expaxy online database. The secondary structure of the PtrAPX proteins were classified into four structural patterns: α-helix, β-turn, extended strand, and random coil (Figure 5A). In the PtrAPX proteins, the random coil contained the highest number of amino acids, followed by the α-helix (Supplementary Table S4). With regard to the tertiary structure, a variety of structures were predicted. PtrAPX1 and 7 contained two types of tertiary structure (Figure 5B), which indicated that the PtrAPX proteins perform diverse functions. The templates and PDB files of each PtrAPXs proteins are provided in Supplementary File 2.

3.7. GO Annotation

The GO annotations were classified into three categories: cellular components, molecular functions, and biological processes. Detailed information on the GO annotation of the PtrAPX genes is provided in Supplemental Table S5. For cellular components, eight PtrAPX proteins were localized in the cytoplasm, intracellular organelles and organelles. Seven PtrAPX proteins were localized in membranes, six in intrinsic components of membranes, and one each in the thylakoids, organelle subcompartment, and cytosol. With regard to molecular functions, all PtrAPX gene family members participated in antioxidant activity, catalytic activity, and binding. The PtrAPX genes participated in a variety of biological processes; for instance, two PtrAPX genes are involved in reproduction, multicellular organismal processes, growth, and developmental and reproductive processes. All PtrAPX genes participated in detoxification, cellular processes, and response to stimulus processes (Figure 6). These results suggested that PtrAPX genes played an important role in plant development and growth as well as response to environmental stresses.

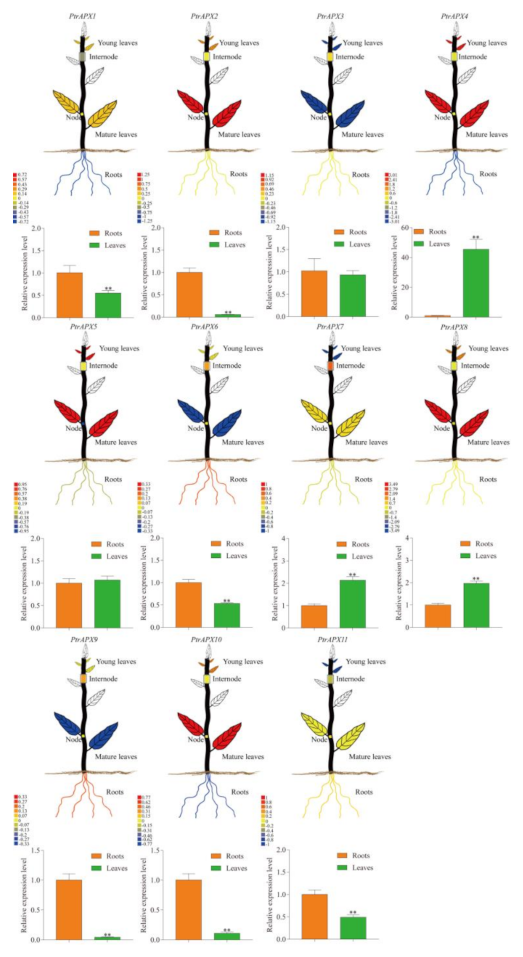
3.8. Tissue-Specific Expression Profiles of PtrAPX Genes

To analyze the possible roles of PtrAPX genes in the developmental processes of P. trichocarpa, visualized images were downloaded for different tissues or organs, consisting of roots, nodes, internodes, mature leaves, and young leaves, from the PopGenIE v3 database (accession number: GSE6422) [43]. The genes PtrAPX1, 4, and 9 exhibited a high relative expression level and PtrAPX6 and 9 showed a low expression level in roots (Figure 7). Five PtrAPX genes showed a high expression level in leaves: PtrAPX2, 4, 5, 8, and 10. The relative expression levels of PtrAPX3, 6, and 9 were low. Four PtrAPX genes expressed in internodes and three genes expressed in nodes showed a high relative expression level. Next, we further verified the validation of previous microarray data using RT-qPCR. As shown in Figure 7, the results of RT-qPCR were generally consistency with the microarray analysis and had very distinct tissue-specific expression pattern in roots and leaves (Figure 7). It is worth noting that PtrAPX1. -2 and -10 exhibited different expression patterns between the RT-qPCR analysis and microarray analysis, which might be caused by the differences of their experimental materials, such as conditions, sample collection times, etc. [44].

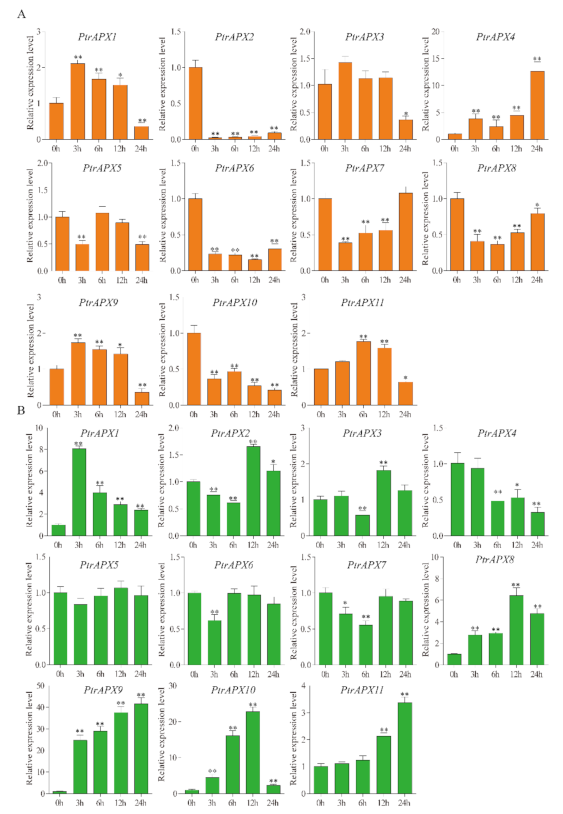
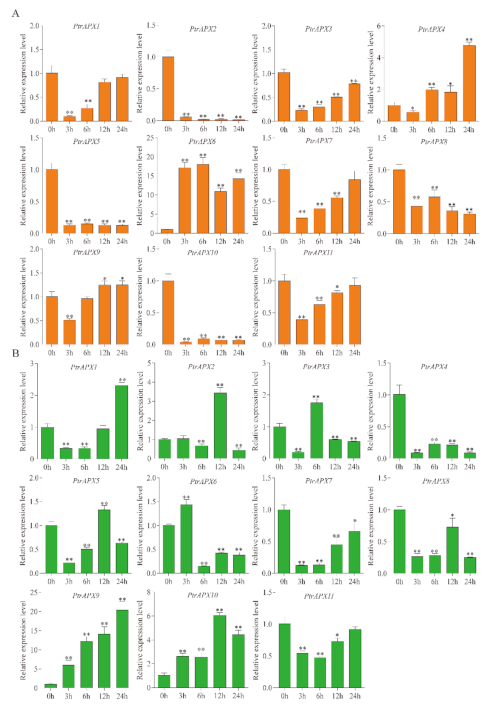
3.9. RT-qPCR Analysis of PtrAPXs Response to Drought and NaCl Stress

During growth and development, poplar plants are frequently subjected to a variety of abiotic stresses, including drought and high salinity [45,46]. Many genes are induced and contribute to resistance when the plant is exposed to these environmental stresses [47]. Therefore, the relative expression level of PtrAPX genes was detected in response to drought and salinity treatment in P. trichocarpa. Under drought stress, eight PtrAPX genes were induced by treatment with 7% PEG6000, and expression of PtrAPX4, 6, and 7 was suppressed at several time points. PtrAPX1 and 9 were significantly upregulated at all time points (p < 0.01). It was notable that PtrAPX9 was gradually upregulated in leaves at successive time points and expression peaked at 24 h, when the gene was up-regulated by approximately 40-fold compared with leaves of nontreated plants. In roots, PtrAPX1, 4, 9, and 11 were induced, whereas PtrAPX2, 6, 8, and 10 were suppressed at all time points. PtrAPX7 was rapidly downregulated at 3, 6, and 12 h, and thereafter returned to the normal expression level. The genes PtrAPX1, 9, and 11 were induced in roots and leaves in response to drought stress (Figure 8).
The expression profiles of PtrAPX genes under 150 mM NaCl stress were also analyzed. Seven PtrAPX genes were induced and the remainder were suppressed in leaves (Figure 9). PtrAPX4, 7, and 8 were significantly downregulated at all time points. PtrAPX6 was rapidly induced at 3 h and suppressed at 6, 12, and 24 h. PtrAPX11 was strongly down-regulated in the early response period and thereafter returned to the normal expression level at 24 h. The majority of PtrAPX genes were suppressed in roots, except for PtrAPX4, 6, and 9, which were induced. Both PtrAPX4 and 9 were significantly downregulated at 3 h and upregulated at 12 and 24 h, which indicated that these two PtrAPX genes may represent late-response genes. Notably, PtrAPX6 was strongly up-regulated at all time points (p < 0.01).

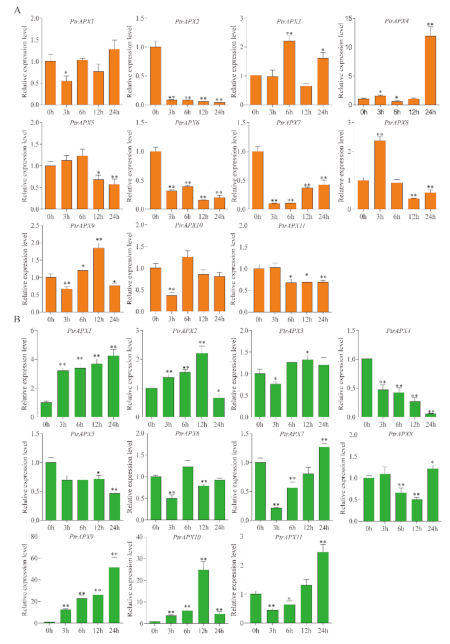
3.10. RT-qPCR Analysis of PtrAPX Genes under ABA Treatment

Expression of the PtrAPX genes in response to 200 μM ABA treatment was investigated using RT-qPCR analysis. Half of the PtrAPX genes were induced, whereas PtrAPX4 and 5 were significantly suppressed at all time points in leaves (p < 0.01; Figure 10). PtrAPX7 and 11 showed similar expression patterns, i.e., down-regulation at 3 and 6 h, and upregulation at 12 and 24 h. PtrAPX9 was rapidly induced at 3 h, then was gradually up-regulated at subsequent time points and expression peaked at 24 h, at which point it was up-regulated by approximately 50-fold compared with the control. Four PtrAPX genes were induced in roots. Interestingly, the PtrAPX4 expression level showed no significant change at 3, 6, and 12 h (p > 0.05), but was rapidly up-regulated by approximately 12-fold at 24 h. PtrAPX1 and 10 were significantly downregulated at 3 h and returned to the normal expression level at 6, 12, and 24 h. PtrAPX2, 6, and 7 were suppressed at all time points in roots. PtrAPX3, 8, and 9 were induced, whereas PtrAPX5, 6, and 7 were suppressed, in roots and leaves under ABA treatment.

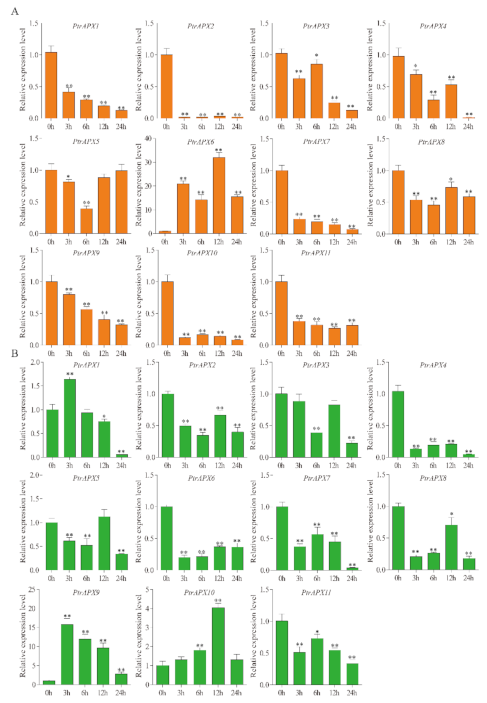
3.11. RT-qPCR Analysis of PtrAPX Genes under Ammonium Treatment

Almost all PtrAPX genes, except PtrAPX1, 9, and 10, were suppressed in leaves under NH4+ treatment. PtrAPX9 was dramatically up-regulated at all time points. PtrAPX10 showed no significant change in expression in roots and gradual up-regulation with time in leaves, which peaked at 12 h (approximately four-fold increase) and thereafter declined. PtrAPX2, -4, -7, -8, and -11 were significantly down-regulated at all time points in leaves (Figure 11). In roots, only PtrAPX6 was induced and showed a high expression level at all time points, whereas the remaining PtrAPX genes were all suppressed. Among these down-regulated genes, PtrAPX1, -2, -3, -4, -7, -8, -9, -10, and -11 were significantly down-regulated at all time points (p < 0.05). PtrAPX2, -3, -4, -5, -7, and -8 were suppressed in roots and leaves (Figure 11).

4. Discussion

Ascorbate peroxidase genes play an important role in the detoxification of photoproduced H2O2 and diverse abiotic stresses, such as drought, low temperature, high salinity, and iron stress [48]. APX genes have been characterized in, for example, Arabidopsis [8,49], rice [11,50], tomato (Solanum lycopersicum) [51], and cotton (Gossypium hirsutum) [52]. Limited information on the APX gene family is available for the model woody plant, Populus trichocarpa. In the present study, we identified 11 APX gene family members in the P. trichocarpa genome, each of which contained the conserved ascorbic acid peroxidase domain. The number of PtrAPX genes is notably higher than that reported for Arabidopsis and rice (which both possess eight members). This difference may suggest that APX genes perform more complex functions in woody plants.
Previous studies have identified seven APX genes in Populus trichocarpa [53], In this study, 11 PtrAPX genes have been identified encoding seven cytosolic isoforms, and four chloroplastic isoforms. Among the PtrAPXs genes located in chloroplast, PtrAPX1 and PtrAPX5 are dual-targeted to chloroplasts and/or mitochondria, consistent with the findings that PtosAPX and AtsAPX are dual-targeted to these two organelles [9,30].
Integration and realignment of gene fragments may lead to an increase or decrease in the number of exons or introns [54]. In the current study, the majority of PtrAPX members of class I contained eight introns, except for PtrAPX6, 7, and 9, which possessed two, six, and six introns, respectively (Figure 2). It is notable that PtrAPX6 and 9 were paralogous gene pairs. These results indicated that a number of gene evolutionary events accrued in these genes and led to the increase or decrease in intron number, and may have resulted in functional differences. This phenomenon is even observed among homologous genes.
It is generally accepted that promoter cis-elements play an important role in the transcriptional regulation that controls diverse biological processes, such as responses to exogenous phytohormone treatment and abiotic stress [55]. In the present report (Figure 4), we identified numerous phytohormone- and abiotic stress-related cis-elements in the promoter region of PtrAPX genes, including ABRE, CGTCA-motif, TCA-element, LTR, TC-rich repeat, TGA-element, TATC-box, P-box, and MBS cis-elements. Each PtrAPX gene contained at least one phytohormone- and one abiotic stress-related cis-element, which indicated that PtrAPX genes perform important functions in the responses to phytohormones and abiotic stress. For example, PtrAPX3 and 8 contained six and eight phytohormone- and abiotic stress-related cis-elements in the promoter, respectively. Notably, PtrAPX9 was strongly induced by drought stress in leaves at all time points (Figure 8B), but no drought-related cis-element (MBS) was detected in the promoter sequence. Thus, we speculate that PtrAPX9 may interact with other drought-related genes in the response to drought stress.
Drought and salinity stress have a negative effect on plant development and growth [56,57]. Under exposure to drought and high salinity, plants produce substantially higher quantities of ROS, including H2O2, in chloroplasts and peroxisomes of photosynthesizing cells [58]. Accumulation of excessive ROS and H2O2 may cause cellular injury [59]. Ascorbate peroxidase catalyzes the conversion of H2O2 to H2O and O2, and scavenges ROS to protect against the toxic effects of ROS accumulation in higher plants [60]. Previous research has shown that AtAPX1 performs an important function in the drought stress response by protecting chloroplasts from oxidative damage in Arabidopsis. OsAPX2 is induced by salinity stress and transgenic lines of Arabidopsis and Medicago sativa show enhanced salt tolerance [23,61]. In the present study, expression of most PtrAPX genes was induced by drought and salinity stress, which indicated that these genes play an important role in resistance to drought and salinity stress. PtrAPX6 expression was significantly up-regulated by salinity stress but was down-regulated under drought stress; in contrast, PtrAPX11 was up-regulated under drought stress but was suppressed under salinity stress. These results indicated that PtrAPX genes perform different physiological and biochemical functions in response to environmental stresses. We observed that PtrAPX10 was significantly upregulated in leaves under drought stress at 3, 6, and 12 h, at which point it was up-regulated approximately 25-fold compared with that of the control (Figure 8B). Interestingly, PtrAPX10 was strongly suppressed at all time points in roots (Figure 8A,B). This result suggested that PtrAPX genes performed different functions in roots and leaves.
Abscisic acid plays an important role in drought stress [62]. Drought stress is known to trigger an increase in ABA content [63]. Moreover, a variety of drought stress-responsive genes are induced by exogenous ABA treatment [64]. Based on the present RT-qPCR results, all PtrAPX genes, except PtrAPX5, 6, 7, and 8, were induced by both drought stress and ABA treatment. Notably, PtrAPX9 and 10 were significantly up-regulated in leaves under drought stress and ABA treatment. In maize, the majority of ZmAPX genes are induced by ABA treatment, except for ZmAPX3 and 6, which are nonresponsive to ABA treatment [25]. The PEG treatment led to similar expression patterns as those observed in response to ABA treatment [25]. The present results are consistent with those reported for maize and suggested that the PtrAPX gene family may play an important role in cross-talk between drought stress and ABA treatment. In sugarcane (Saccharum officinarum) [65], APX6 is down-regulated in response to drought and salinity stimuli, but respond positively to ABA treatment. In the present study, PtrAPX8, which is homologous to ScAPX6, exhibited a similar expression pattern in that expression was suppressed by drought and salinity stress, and was significantly up-regulated by exogenous ABA. The present RT-qPCR data were highly consistent with the aforementioned previous results, thus indicating that homologous genes may perform similar functions in different species.
High salinity, which is considered to be a severe abiotic environmental stress factor, influences woody plant growth and development [66]. Salinity stress may alter biochemical pathways and physiological responses mediated by increased production of ROS [67]. A number of APX genes are induced by salt stress [51], such as the cytosolic OsAPX2 and 7 [11]. An increasing body of evidence has shown that the rapid increase in APX mRNA levels may maintain the high activity of APX in the cytosol to protect the cellular components from ROS-induced oxidative damage in response to salinity stress [11]. Moreover, PtrAPX1 located in chloroplasts and/or mitochondria was stongly induced by high salinity in leaves (Figure 9). A previous study showed that PtomtAPX is dual targeted to both chloroplast and mitochondria of Populus tomentosa Carr, and showed the same expression pattern under salt stress [30]. Based on the present phylogenetic reconstruction (Figure 1), cytosolic PtrAPX6 is homologous to OsAPX2, and the relative expression level or PtrAPX6 in roots was increased approximately 16-fold at 3 and 6 h under salt stress. Over-expression of PpAPX in transgenic tobacco also showed improved drought resistance and salt tolerance at the vegetative stage [29]. These results suggested that PtrAPX genes may play an important role in the salinity stress response.
Excessive NH4+ concentrations can induce accumulation of ROS in Arabidopsis [68] and rice [69]. Plants protect cells from oxidative damage by increasing the expression level of genes encoding antioxidant enzymes [70]. OsAPX1 and 2 are upregulated under NH4Cl treatment, and activate the antioxidant defense mechanism and modulate ROS homeostasis [69]. In the current study, PtrAPX6, 9, and 10 exhibited higher expression levels in roots and leaves compared with those of the control under NH4+ treatment. This result suggested that these PtrAPX genes play a dominant role in the removal of ROS to enhance tolerance to excessive NH4+ concentrations.

5. Conclusions

Eleven APX genes that contain the conserved ascorbic acid peroxidase domain were identified in the P. trichocarpa genome. The phylogenetic analysis revealed that the PtrAPX proteins were classifiable into three classes. The chromosomal locations, gene duplications, and promoter cis-elements of the PtrAPX gene family were predicted. A systematic approach was used to examine the roles of the PtrAPX genes in the responses to abiotic stress (drought, salinity, and high NH4+ concentration) and phytohormone treatment (ABA) in relation to promoter cis-elements and RT-qPCR analyses. The present findings provide an improved understanding of the evolution and functions of the APX gene family in P. trichocarpa, and present a framework for further detailed analysis of this gene family.

Supplementary Materials

The following are available online at https://www.mdpi.com/2073-4425/12/3/334/s1, Table S1: Primer pairs for real-time quantitative PCR. Table S2: Statistical analysis of RT-qPCR. Table S3: Motif sequences of PtrAPX genes. Table S4: Secondary structure of the PtrAPX proteins. Table S5: GO annotation of the PtrAPX genes. File 1: The accession numbers and amino acid sequences of P. trichocarpa, Arabidopsis and rice. File 2: The templates and PDB files of each PtrAPXs.

Author Contributions

Conceptualization, X.L. and G.L.; Experiment design, G.L., Z.X. and C.Y.; Data curation, X.L. H.W.; Contribution of materials/analysis tools, X.L., S.Z. and H.W.; Writing—original draft, X.L., C.Q. and H.W.; Writing—review and editing, G.L. All authors have read and agreed to the published version of the manuscript.

Funding

This work was supported by the Science Fund Project of Heilongjiang Province of China (LH2020C043), the Special Fund for Basic Scientific research operation Fee of Central University (2572019CT02), and the Innovation Project of State Key Laboratory of Tree Genetics and Breeding (Northeast Forestry University) (2019A03).

Institutional Review Board Statement

Not applicable.

Informed Consent Statement

Not applicable.

Data Availability Statement

The data that support the findings of this study are available from the corresponding author upon reasonable request.

Conflicts of Interest

The authors declare no conflict of interest.

References

  1. Mishra, P.; Bhoomika, K.; Dubey, R.S. Differential responses of antioxidative defense system to prolonged salinity stress in salt-tolerant and salt-sensitive Indica rice (Oryza sativa L.) seedlings. Protoplasma 2013, 250, 3–19. [Google Scholar] [CrossRef]
  2. Davletova, S.; Rizhsky, L.; Liang, H.; Shengqiang, Z.; Oliver, D.J.; Coutu, J.; Shulaev, V.; Schlauch, K.; Mittler, R. Cytosolic ascorbate peroxidase 1 is a central component of the reactive oxygen gene network of Arabidopsis. Plant Cell 2005, 17, 268–281. [Google Scholar] [CrossRef] [Green Version]
  3. Foyer, C.H.; Shigeoka, S. Understanding oxidative stress and antioxidant functions to enhance photosynthesis. Plant Physiol. 2011, 155, 93–100. [Google Scholar] [CrossRef] [Green Version]
  4. Maruta, T.; Sawa, Y.; Shigeoka, S.; Ishikawa, T. Diversity and Evolution of Ascorbate Peroxidase Functions in Chloroplasts: More Than Just a Classical Antioxidant Enzyme? Plant Cell Physiol. 2016, 57, 1377–1386. [Google Scholar] [CrossRef] [PubMed] [Green Version]
  5. Shigeoka, S.; Ishikawa, T.; Tamoi, M.; Miyagawa, Y.; Takeda, T.; Yabuta, Y.; Yoshimura, K. Regulation and function of ascorbate peroxidase isoenzymes. J. Exp. Bot. 2002, 53, 1305–1319. [Google Scholar] [CrossRef] [PubMed]
  6. Apel, K.; Hirt, H. Reactive oxygen species: Metabolism, oxidative stress, and signal transduction. Annu. Rev. Plant Biol. 2004, 55, 373–399. [Google Scholar] [CrossRef] [PubMed] [Green Version]
  7. Panchuk, I.I.; Volkov, R.A.; Schoffl, F. Heat stress- and heat shock transcription factor-dependent expression and activity of ascorbate peroxidase in Arabidopsis. Plant Physiol. 2002, 129, 838–853. [Google Scholar] [CrossRef] [PubMed] [Green Version]
  8. Narendra, S.; Venkataramani, S.; Shen, G.; Wang, J.; Pasapula, V.; Lin, Y.; Kornyeyev, D.; Holaday, A.S.; Zhang, H. The Arabidopsis ascorbate peroxidase 3 is a peroxisomal membrane-bound antioxidant enzyme and is dispensable for Arabidopsis growth and development. J. Exp. Bot. 2006, 57, 3033–3042. [Google Scholar] [CrossRef] [Green Version]
  9. Chew, O.; Whelan, J.; Millar, A.H. Molecular definition of the ascorbate-glutathione cycle in Arabidopsis mitochondria reveals dual targeting of antioxidant defenses in plants. J. Biol. Chem. 2003, 278, 46869–46877. [Google Scholar] [CrossRef] [Green Version]
  10. Lazzarotto, F.; Teixeira, F.K.; Rosa, S.B.; Dunand, C.; Fernandes, C.L.; Fontenele, A.V.; Silveira, J.A.; Verli, H.; Margis, R.; Margis-Pinheiro, M. Ascorbate peroxidase-related (APx-R) is a new heme-containing protein functionally associated with ascorbate peroxidase but evolutionarily divergent. New Phytol. 2011, 191, 234–250. [Google Scholar] [CrossRef]
  11. Teixeira, F.K.; Menezes-Benavente, L.; Galvao, V.C.; Margis, R.; Margis-Pinheiro, M. Rice ascorbate peroxidase gene family encodes functionally diverse isoforms localized in different subcellular compartments. Planta 2006, 224, 300–314. [Google Scholar] [CrossRef]
  12. Teixeira, F.K.; Menezes-Benavente, L.; Margis, R.; Margis-Pinheiro, M. Analysis of the molecular evolutionary history of the ascorbate peroxidase gene family: Inferences from the rice genome. J. Mol. Evol. 2004, 59, 761–770. [Google Scholar] [CrossRef]
  13. Caverzan, A.; Bonifacio, A.; Carvalho, F.E.; Andrade, C.M.; Passaia, G.; Schunemann, M.; Maraschin, F.S.; Martins, M.O.; Teixeira, F.K.; Rauber, R.; et al. The knockdown of chloroplastic ascorbate peroxidases reveals its regulatory role in the photosynthesis and protection under photo-oxidative stress in rice. Plant Sci. 2014, 214, 74–87. [Google Scholar] [CrossRef] [PubMed]
  14. Wu, B.; Li, L.; Qiu, T.; Zhang, X.; Cui, S. Cytosolic APX2 is a pleiotropic protein involved in H2O2 homeostasis, chloroplast protection, plant architecture and fertility maintenance. Plant Cell Rep. 2018, 37, 833–848. [Google Scholar] [CrossRef] [PubMed]
  15. Panchuk, I.I.; Zentgraf, U.; Volkov, R.A. Expression of the Apx gene family during leaf senescence of Arabidopsis thaliana. Planta 2005, 222, 926–932. [Google Scholar] [CrossRef] [PubMed]
  16. Khanna-Chopra, R.; Jajoo, A.; Semwal, V.K. Chloroplasts and mitochondria have multiple heat tolerant isozymes of SOD and APX in leaf and inflorescence in Chenopodium album. Biochem. Biophys. Res. Commun. 2011, 412, 522–525. [Google Scholar] [CrossRef] [PubMed]
  17. Pnueli, L.; Liang, H.; Rozenberg, M.; Mittler, R. Growth suppression, altered stomatal responses, and augmented induction of heat shock proteins in cytosolic ascorbate peroxidase (Apx1)-deficient Arabidopsis plants. Plant J. 2003, 34, 187–203. [Google Scholar] [CrossRef] [Green Version]
  18. Koussevitzky, S.; Suzuki, N.; Huntington, S.; Armijo, L.; Sha, W.; Cortes, D.; Shulaev, V.; Mittler, R. Ascorbate peroxidase 1 plays a key role in the response of Arabidopsis thaliana to stress combination. J. Biol. Chem. 2008, 283, 34197–34203. [Google Scholar] [CrossRef] [Green Version]
  19. Miller, G.; Suzuki, N.; Rizhsky, L.; Hegie, A.; Koussevitzky, S.; Mittler, R. Double mutants deficient in cytosolic and thylakoid ascorbate peroxidase reveal a complex mode of interaction between reactive oxygen species, plant development, and response to abiotic stresses. Plant Physiol. 2007, 144, 1777–1785. [Google Scholar] [CrossRef] [Green Version]
  20. Chen, C.; Letnik, I.; Hacham, Y.; Dobrev, P.; Ben-Daniel, B.H.; Vankova, R.; Amir, R.; Miller, G. ASCORBATE PEROXIDASE6 protects Arabidopsis desiccating and germinating seeds from stress and mediates cross talk between reactive oxygen species, abscisic acid, and auxin. Plant Physiol. 2014, 166, 370–383. [Google Scholar] [CrossRef] [PubMed] [Green Version]
  21. Ribeiro, C.W.; Korbes, A.P.; Garighan, J.A.; Jardim-Messeder, D.; Carvalho, F.; Sousa, R.; Caverzan, A.; Teixeira, F.K.; Silveira, J.; Margis-Pinheiro, M. Rice peroxisomal ascorbate peroxidase knockdown affects ROS signaling and triggers early leaf senescence. Plant Sci. 2017, 263, 55–65. [Google Scholar] [CrossRef]
  22. Zhang, Z.; Zhang, Q.; Wu, J.; Zheng, X.; Zheng, S.; Sun, X.; Qiu, Q.; Lu, T. Gene knockout study reveals that cytosolic ascorbate peroxidase 2(OsAPX2) plays a critical role in growth and reproduction in rice under drought, salt and cold stresses. PLoS ONE 2013, 8, e57472. [Google Scholar] [CrossRef]
  23. Lu, Z.; Liu, D.; Liu, S. Two rice cytosolic ascorbate peroxidases differentially improve salt tolerance in transgenic Arabidopsis. Plant Cell Rep. 2007, 26, 1909–1917. [Google Scholar] [CrossRef] [PubMed]
  24. Singh, N.; Mishra, A.; Jha, B. Over-expression of the peroxisomal ascorbate peroxidase (SbpAPX) gene cloned from halophyte Salicornia brachiata confers salt and drought stress tolerance in transgenic tobacco. Mar. Biotechnol. 2014, 16, 321–332. [Google Scholar] [CrossRef] [PubMed]
  25. Liu, Y.; Yuan, Y.; Liu, Y.; Liu, Y.; Fu, J.; Zheng, J.; Wang, G. Gene families of maize glutathione–ascorbate redox cycle respond differently to abiotic stresses. J. Plant Physiol. 2012, 169, 183–192. [Google Scholar] [CrossRef]
  26. Rennenberg, H.; Wildhagen, H.; Ehlting, B. Nitrogen nutrition of poplar trees. Plant. Biol. 2010, 12, 275–291. [Google Scholar] [CrossRef]
  27. Tuskan, G.A.; Difazio, S.; Jansson, S.; Bohlmann, J.; Grigoriev, I.; Hellsten, U.; Putnam, N.; Ralph, S.; Rombauts, S.; Salamov, A.; et al. The genome of black cottonwood, Populus trichocarpa (Torr. & Gray). Science 2006, 313, 1596–1604. [Google Scholar] [CrossRef] [PubMed] [Green Version]
  28. Lu, H.; Han, R.L.; Jiang, X.N. Heterologous expression and characterization of a proxidomal ascorbate peroxidase from Populus tomentosa. Mol. Biol. Rep. 2009, 36, 21–27. [Google Scholar] [CrossRef]
  29. Li, Y.; Hai, R.; Du, X.; Jiang, X.; Lu, H. Over-expression of a Populus peroxisomal ascorbate peroxidase (PpAPX) gene in tobacco plants enhances stress tolerance. Plant Breed. 2009, 128, 404–410. [Google Scholar] [CrossRef]
  30. Yin, B.; Zhang, J.; Liu, Y.; Pan, X.; Zhao, Z.; Li, H.; Zhang, C.; Li, C.; Du, X.; Li, Y.; et al. PtomtAPX, a mitochondrial ascorbate peroxidase, plays an important role in maintaining the redox balance of Populus tomentosa Carr. Sci. Rep. 2019, 9, 19541. [Google Scholar] [CrossRef]
  31. Librado, P.; Rozas, J. DnaSP v5: A software for comprehensive analysis of DNA polymorphism data. Bioinformatics 2009, 25, 1451–1452. [Google Scholar] [CrossRef] [PubMed] [Green Version]
  32. Wei, M.; Xu, X.; Li, C. Identification and expression of CAMTA genes in Populus trichocarpa under biotic and abiotic stress. Sci. Rep. 2017, 7, 17910. [Google Scholar] [CrossRef] [PubMed] [Green Version]
  33. Thompson, J.D.; Gibson, T.J.; Plewniak, F.; Jeanmougin, F.; Higgins, D.G. The CLUSTAL_X windows interface: Flexible strategies for multiple sequence alignment aided by quality analysis tools. Nucleic Acids Res. 1997, 25, 4876–4882. [Google Scholar] [CrossRef] [Green Version]
  34. Kumar, S.; Stecher, G.; Tamura, K. MEGA7: Molecular Evolutionary Genetics Analysis Version 7.0 for Bigger Datasets. Mol. Biol. Evol. 2016, 33, 1870–1874. [Google Scholar] [CrossRef] [Green Version]
  35. Sjodin, A.; Street, N.R.; Sandberg, G.; Gustafsson, P.; Jansson, S. The Populus Genome Integrative Explorer (PopGenIE): A new resource for exploring the Populus genome. New Phytol. 2009, 182, 1013–1025. [Google Scholar] [CrossRef]
  36. Livak, K.J.; Schmittgen, T.D. Analysis of relative gene expression data using real-time quantitative PCR and the 2(-Delta Delta C(T)) Method. Methods 2001, 25, 402–408. [Google Scholar] [CrossRef]
  37. Schmittgen, T.D.; Livak, K.J. Analyzing real-time PCR data by the comparative C(T) method. Nat. Protoc. 2008, 3, 1101–1108. [Google Scholar] [CrossRef] [PubMed]
  38. Pettengill, E.A.; Parmentier-Line, C.; Coleman, G.D. Evaluation of qPCR reference genes in two genotypes of Populus for use in photoperiod and low-temperature studies. BMC Res. Notes 2012, 5, 366. [Google Scholar] [CrossRef] [PubMed] [Green Version]
  39. Pettengill, E.A.; Pettengill, J.B.; Coleman, G.D. Elucidating the evolutionary history and expression patterns of nucleoside phosphorylase paralogs (vegetative storage proteins) in Populus and the plant kingdom. BMC Plant Biol. 2013, 13, 118. [Google Scholar] [CrossRef] [Green Version]
  40. Liao, G.L.; Liu, Q.; Li, Y.Q.; Zhong, M.; Huang, C.H.; Jia, D.F.; Xu, X.B. Identification and expression profiling analysis of ascorbate peroxidase gene family in Actinidia chinensis (Hongyang). J. Plant Res. 2020, 133, 715–726. [Google Scholar] [CrossRef]
  41. Kwong, S.; Woods, A.E.; Mirtschin, P.J.; Ge, R.; Kini, R.M. The recruitment of blood coagulation factor X into snake venom gland as a toxin: The role of promoter cis-elements in its expression. Thromb. Haemost. 2009, 102, 469–478. [Google Scholar] [CrossRef]
  42. Redfern, O.C.; Dessailly, B.H.; Dallman, T.J.; Sillitoe, I.; Orengo, C.A. FLORA: A novel method to predict protein function from structure in diverse superfamilies. PLoS Comput. Biol. 2009, 5, e1000485. [Google Scholar] [CrossRef] [PubMed] [Green Version]
  43. Xu, Z.; Gao, L.; Tang, M.; Qu, C.; Huang, J.; Wang, Q.; Yang, C.; Liu, G.; Yang, C. Genome-wide identification and expression profile analysis of CCH gene family in Populus. Peerj 2017, 5, e3962. [Google Scholar] [CrossRef] [Green Version]
  44. Yang, X.; Kalluri, U.C.; Jawdy, S.; Gunter, L.E.; Yin, T.; Tschaplinski, T.J.; Weston, D.J.; Ranjan, P.; Tuskan, G.A. The F-box gene family is expanded in herbaceous annual plants relative to woody perennial plants. Plant Physiol. 2008, 148, 1189–1200. [Google Scholar] [CrossRef] [Green Version]
  45. Zhuang, Y.; Wang, C.; Zhang, Y.; Chen, S.; Wang, D.; Liu, Q.; Zhou, G.; Chai, G. Overexpression of PdC3H17 Confers Tolerance to Drought Stress Depending on Its CCCH Domain in Populus. Front. Plant Sci. 2019, 10, 1748. [Google Scholar] [CrossRef] [Green Version]
  46. Li, J.; Sun, P.; Xia, Y.; Zheng, G.; Sun, J.; Jia, H. A Stress-Associated Protein, PtSAP13, from Populus trichocarpa Provides Tolerance to Salt Stress. Int. J. Mol. Sci. 2019, 20, 5782. [Google Scholar] [CrossRef] [PubMed] [Green Version]
  47. Liu, R.; Wu, M.; Liu, H.L.; Gao, Y.M.; Chen, J.; Yan, H.W.; Xiang, Y. Genome-wide identification and expression analysis of the NF-Y transcription factor family in Populus. Physiol. Plant. 2020, 171, 309–327. [Google Scholar] [CrossRef] [PubMed]
  48. Storozhenko, S.; De Pauw, P.; Van Montagu, M.; Inze, D.; Kushnir, S. The heat-shock element is a functional component of the Arabidopsis APX1 gene promoter. Plant Physiol. 1998, 118, 1005–1014. [Google Scholar] [CrossRef] [Green Version]
  49. Santos, M.; Gousseau, H.; Lister, C.; Foyer, C.; Creissen, G.; Mullineaux, P. Cytosolic ascorbate peroxidase from Arabidopsis thaliana L. is encoded by a small multigene family. Planta 1996, 198, 64–69. [Google Scholar] [CrossRef]
  50. Wu, B.; Wang, B. Comparative analysis of ascorbate peroxidases (APXs) from selected plants with a special focus on Oryza sativa employing public databases. PLoS ONE 2019, 14, e226543. [Google Scholar] [CrossRef] [PubMed]
  51. Najami, N.; Janda, T.; Barriah, W.; Kayam, G.; Tal, M.; Guy, M.; Volokita, M. Ascorbate peroxidase gene family in tomato: Its identification and characterization. Mol. Genet. Genomics 2008, 279, 171–182. [Google Scholar] [CrossRef] [PubMed]
  52. Tao, C.; Jin, X.; Zhu, L.; Xie, Q.; Wang, X.; Li, H. Genome-wide investigation and expression profiling of APX gene family in Gossypium hirsutum provide new insights in redox homeostasis maintenance during different fiber development stages. Mol. Genet. Genomics 2018, 293, 685–697. [Google Scholar] [CrossRef] [PubMed] [Green Version]
  53. Ozyigit, I.I.; Filiz, E.; Vatansever, R.; Kurtoglu, K.Y.; Koc, I.; Ozturk, M.X.; Anjum, N.A. Identification and Comparative Analysis of H2O2-Scavenging Enzymes (Ascorbate peroxidase and Glutathione peroxidase) in Selected Plants Employing Bioinformatics Approaches. Front. Plant Sci. 2016, 7, 301. [Google Scholar] [CrossRef] [PubMed] [Green Version]
  54. Xu, G.; Guo, C.; Shan, H.; Kong, H. Divergence of duplicate genes in exon-intron structure. Proc. Natl. Acad. Sci. USA 2012, 109, 1187–1192. [Google Scholar] [CrossRef] [Green Version]
  55. Yang, Y.; Ahammed, G.J.; Wan, C.; Liu, H.; Chen, R.; Zhou, Y. Comprehensive Analysis of TIFY Transcription Factors and Their Expression Profiles under Jasmonic Acid and Abiotic Stresses in Watermelon. Int. J. Genomics 2019, 2019, 6813086. [Google Scholar] [CrossRef]
  56. Takahashi, F.; Kuromori, T.; Sato, H.; Shinozaki, K. Regulatory Gene Networks in Drought Stress Responses and Resistance in Plants. Adv. Exp. Med. Biol. 2018, 1081, 189–214. [Google Scholar] [CrossRef]
  57. Chen, S.; Polle, A. Salinity tolerance of Populus. Plant Biol. 2010, 12, 317–333. [Google Scholar] [CrossRef]
  58. Del, R.L.; Sandalio, L.M.; Corpas, F.J.; Palma, J.M.; Barroso, J.B. Reactive oxygen species and reactive nitrogen species in peroxisomes. Production, scavenging, and role in cell signaling. Plant Physiol. 2006, 141, 330–335. [Google Scholar] [CrossRef] [Green Version]
  59. Dat, J.; Vandenabeele, S.; Vranova, E.; Van Montagu, M.; Inze, D.; Van Breusegem, F. Dual action of the active oxygen species during plant stress responses. Cell Mol. Life Sci. 2000, 57, 779–795. [Google Scholar] [CrossRef] [PubMed]
  60. Chen, Y.; Cai, J.; Yang, F.X.; Zhou, B.; Zhou, L.R. Ascorbate peroxidase from Jatropha curcas enhances salt tolerance in transgenic Arabidopsis. Genet. Mol. Res. 2015, 14, 4879–4889. [Google Scholar] [CrossRef]
  61. Guan, Q.; Takano, T.; Liu, S. Genetic transformation and analysis of rice OsAPx2 gene in Medicago sativa. PLoS ONE 2012, 7, e41233. [Google Scholar] [CrossRef]
  62. Fujita, Y.; Fujita, M.; Satoh, R.; Maruyama, K.; Parvez, M.M.; Seki, M.; Hiratsu, K.; Ohme-Takagi, M.; Shinozaki, K.; Yamaguchi-Shinozaki, K. AREB1 is a transcription activator of novel ABRE-dependent ABA signaling that enhances drought stress tolerance in Arabidopsis. Plant Cell 2005, 17, 3470–3488. [Google Scholar] [CrossRef] [PubMed] [Green Version]
  63. Gao, Y.F.; Liu, J.K.; Yang, F.M.; Zhang, G.Y.; Wang, D.; Zhang, L.; Ou, Y.B.; Yao, Y.A. The WRKY transcription factor WRKY8 promotes resistance to pathogen infection and mediates drought and salt stress tolerance in Solanum lycopersicum. Physiol. Plant. 2020, 168, 98–117. [Google Scholar] [CrossRef] [PubMed]
  64. Yamaguchi-Shinozaki, K.; Shinozaki, K. Transcriptional regulatory networks in cellular responses and tolerance to dehydration and cold stresses. Annu. Rev. Plant Biol. 2006, 57, 781–803. [Google Scholar] [CrossRef] [Green Version]
  65. Liu, F.; Huang, N.; Wang, L.; Ling, H.; Sun, T.; Ahmad, W.; Muhammad, K.; Guo, J.; Xu, L.; Gao, S.; et al. A Novel L-ascorbate Peroxidase 6 Gene, ScAPX6, Plays an Important Role in the Regulation of Response to Biotic and Abiotic Stresses in Sugarcane. Front. Plant Sci. 2017, 8, 2262. [Google Scholar] [CrossRef] [Green Version]
  66. Chen, N.; Tong, S.; Tang, H.; Zhang, Z.; Liu, B.; Lou, S.; Liu, J.; Liu, H.; Ma, T.; Jiang, Y. The PalERF109 transcription factor positively regulates salt tolerance via PalHKT1;2 in Populus alba var. pyramidalis. Tree Physiol. 2020, 40, 717–730. [Google Scholar] [CrossRef] [PubMed]
  67. Zhu, C.; Sanahuja, G.; Yuan, D.; Farre, G.; Arjo, G.; Berman, J.; Zorrilla-Lopez, U.; Banakar, R.; Bai, C.; Perez-Massot, E.; et al. Biofortification of plants with altered antioxidant content and composition: Genetic engineering strategies. Plant. Biotechnol. J. 2013, 11, 129–141. [Google Scholar] [CrossRef] [Green Version]
  68. Patterson, K.; Cakmak, T.; Cooper, A.; Lager, I.; Rasmusson, A.G.; Escobar, M.A. Distinct signalling pathways and transcriptome response signatures differentiate ammonium- and nitrate-supplied plants. Plant Cell Environ. 2010, 33, 1486–1501. [Google Scholar] [CrossRef] [Green Version]
  69. Xie, Y.; Mao, Y.; Xu, S.; Zhou, H.; Duan, X.; Cui, W.; Zhang, J.; Xu, G. Heme-heme oxygenase 1 system is involved in ammonium tolerance by regulating antioxidant defence in Oryza sativa. Plant Cell Environ. 2015, 38, 129–143. [Google Scholar] [CrossRef] [PubMed]
  70. Yang, S.; Hao, D.; Jin, M.; Li, Y.; Liu, Z.; Huang, Y.; Chen, T.; Su, Y. Internal ammonium excess induces ROS-mediated reactions and causes carbon scarcity in rice. BMC Plant Biol. 2020, 20, 143. [Google Scholar] [CrossRef]
Figure 1. Phylogenetic analysis of APX proteins from Populus trichocarpa, Arabidopsis thaliana, and Oryza sativa. A multiple alignment of the full-length amino acid sequences was generated using Clustal X 2.0. The unrooted phylogenetic tree was constructed using the neighbor-joining method with 1000 bootstrap replicates using MEGA 7.0. Different species are represented by different colors. The APX proteins are classified into three clades (I, II, and III) based on their subcellular localization.
Genes 12 00334 g001
Figure 2. Phylogenetic tree, gene structure, and conserved motif analysis of the 11 PtrAPX genes. (A) A multiple alignment of the full-length PtrAPX protein sequences was generated using Clustal X 2.0. The phylogenetic tree was constructed using the neighbor-joining method with 1000 bootstrap replicates using MEGA 7.0. (B) Intron–extron structure of the corresponding PtrAPX genes. (C) Conserved motifs of PtrAPX genes predicted by the MEME tool. The motif numbers 1–15 are represented by boxes of different colors.
Genes 12 00334 g002
Figure 3. Chromosomal location and gene duplication of PtrAPX genes. The 11 PtrAPX genes were distributed on six chromosomes in the P. trichocarpa genome. Red dotted lines show the links between duplicated gene pairs. Scale bar = 3Mb.
Genes 12 00334 g003
Figure 4. cis-Acting regulatory elements of PtrAPX genes involved in response to phytohormones and abiotic stress. Different cis-elements are indicated by symbols of different shapes.
Genes 12 00334 g004
Figure 5. Secondary and tertiary structures of PtrAPX proteins. (A) Secondary structure of PtrAPX proteins. Motifs are represented by different colors: blue, α-helix; purple, random coil; red, extended strand; green, β-turn. (B) Tertiary structure of PtrAPX proteins.
Genes 12 00334 g005
Figure 6. Gene ontology analysis of the PtrAPX gene family. The gene ontologies were predicted for the categories of biological processes, molecular functions, and cellular components.
Genes 12 00334 g006
Figure 7. Tissue-specific expression profiles of PtrAPX genes. The visual image for each PtrAPX gene in P. trichocarpa was obtained from PopGenIE [43]. Error bars represent the standard deviations from three biological replicates. Asterisks indicate stress treatment groups that showed a significant difference in transcript abundance compared with the control group (** p < 0.01).
Genes 12 00334 g007
Figure 8. Relative expression level of PtrAPX genes under drought stress estimated by RT-qPCR. The expression pattern of PtrAPX genes in roots (A) and leaves (B) is shown. Error bars represent the standard deviations from three biological replicates. The x-axis represents time points after PEG treatment. Asterisks indicate stress treatment groups that showed a significant difference in transcript abundance compared with the control group (* 0.01< p < 0.05, ** p < 0.01).
Genes 12 00334 g008
Figure 9. Relative expression level of PtrAPX genes under 150 mM NaCl treatment estimated by RT-qPCR. The expression pattern of PtrAPX genes in roots (A) and leaves (B) is shown. Error bars represent the standard deviations from three biological replicates. The x-axis represents time points after NaCl treatment. Asterisks indicate stress treatment groups that showed a significant difference in transcript abundance compared with the control group (* 0.01< p < 0.05, ** p < 0.01).
Genes 12 00334 g009
Figure 10. Relative expression level of PtrAPX genes under 200 μM abscisic acid (ABA) treatment estimated by RT-qPCR. The expression pattern of PtrAPX genes in roots (A) and leaves (B) is shown. Error bars represent the standard deviations from three biological replicates. The x-axis represents time points after ABA treatment. Asterisks indicate stress treatment groups that showed a significant difference in transcript abundance compared with the control group (* 0.01< p < 0.05, ** p < 0.01).
Genes 12 00334 g010
Figure 11. Relative expression level of PtrAPX genes under 10 mM (NH4)2SO4 treatment estimated by RT-qPCR. The expression pattern of PtrAPX genes in roots (A) and leaves (B) is shown. Error bars represent the standard deviations from three biological replicates. The x-axis represents time points after (NH4)2SO4 treatment. Asterisks indicate stress treatment groups that showed a significant difference in transcript abundance compared with the control group (* 0.01< p < 0.05, ** p < 0.01).
Genes 12 00334 g011
Table 1. Identifiers and physicochemical properties for the 11 APX gene family members in P. trichocarpa.
NameHomologous Gene in PoplarGene IDLocationProtein Length (a.a.)Aliphatic IndexGrand Average of Hydropathicity (GRAVY)
PtrAPX1PtomtAPX aPotri.002G081900Chloroplast/Mitochondrion37772.6−0.491
PtrAPX2PpAPX bPotri.004G174500Cytoplasm28684.23−0.344
PtrAPX3-Potri.005G112200Cytoplasm28785.05−0.336
PtrAPX4-Potri.005G161900Chloroplast34781.59−0.27
PtrAPX5PtosAPX cPotri.005G179200Chloroplast/Mitochondrion48682.41−0.25
PtrAPX6-Potri.006G089000Cytoplasm9692.50.255
PtrAPX7-Potri.006G132200Cytoplasm26889.48−0.165
PtrAPX8-Potri.006G254500Chloroplast33779.91−0.267
PtrAPX9-Potri.009G015400Cytoplasm25180.48−0.262
PtrAPX10-Potri.009G134100Cytoplasm28681.57−0.322
PtrAPX11-Potri.016G084800Cytoplasm25074.96−0.44
a: identified mitochondria APX gene in Populus tomentosa Carr [30]; b: identified Populus peroxisomal APX gene in Populus tomentosa [28,29] c: identified chloroplastic and/or mitochondrial APX gene in Populus tomentosa Carr [30].
Table 2. Ka/Ks ratios for duplicate APX genes in P. trichocarpa.
Paralogous PairsKsKaKa/KsDivergent Date (Mya)Duplicate Type
PtrAPX1–PtrAPX50.19550.0470.24040920716.02Segmental
PtrAPX2–PtrAPX100.23500.04120.17531914819.26Segmental
PtrAPX4–PtrAPX81.17060.99430.84939347395.95Segmental
PtrAPX6–PtrAPX90.09520.11621.2205882357.8Segmental
Publisher’s Note: MDPI stays neutral with regard to jurisdictional claims in published maps and institutional affiliations.

