Article

A Workflow for Selection of Single Nucleotide Polymorphic Markers for Studying of Genetics of Ischemic Stroke Outcomes

Institute of Molecular Genetics of National Research Centre, “Kurchatov Institute”, 123182 Moscow, Russia
*
Author to whom correspondence should be addressed.
The authors are contributed equally to this work.
Genes 2021, 12(3), 328; https://doi.org/10.3390/genes12030328
Submission received: 7 January 2021 / Revised: 21 February 2021 / Accepted: 21 February 2021 / Published: 25 February 2021
(This article belongs to the Section Human Genomics and Genetic Diseases)

Abstract

:
In this paper we propose a workflow for studying the genetic architecture of ischemic stroke outcomes. It develops further the candidate gene approach. The workflow is based on the animal model of brain ischemia, comparative genomics, human genomic variations, and algorithms of selection of tagging single nucleotide polymorphisms (tagSNPs) in genes which expression was changed after ischemic stroke. The workflow starts from a set of rat genes that changed their expression in response to brain ischemia and results in a set of tagSNPs, which represent other SNPs in the human genes analyzed and influenced on their expression as well.

1. Introduction

The ischemic stroke (IS) is a multifactorial disease, where the genetic factors contribute substantially [1]. The same seems to be true for outcomes after IS. However, their associations with the particular genetic factors are poorly known and require further investigation [2,3]. There are two main approaches to identify the genes involved in the development of complex traits: candidate gene approach and genome-wide association (GWA) study (GWAS) [4]. Both were extensively applied to study the genetic bases of IS and resulted in revealing several tens of genes involved in stroke development and risk [5]. In contrast, only few GWA studies have been published on outcomes after IS [6,7]. Therefore, the real genetic control of them remains a black box and the full list of the risk (prognostic) loci is yet to be identified. In this paper we describe an approach to explore the genetic bases of variability in IS outcomes.
GWAS does not require the prior knowledge on the importance of the specific functional features of the trait under consideration. At the same time, it is less precise in revealing causal loci (genes) generally located in particular chromosomal regions that can contain no genes or alternatively be abundant with them [8]. The usability of a gene-based approach was mainly restricted by the incompleteness of knowledge about the biology of the phenotypes studied. To break the information bottleneck, several strategies extending the candidate gene approach were proposed [4]. They were based on linkage information in a chromosomal segment, methods of comparative genomics, and gene expression at different stages. There were also the approaches that combine two or more strategies together. One such method is the digital candidate gene approach (DigiCGA), which extract, filter, and analyze the resources on the web available publicly [9]. The method we propose incorporates the best strategies of the mentioned above approaches and puts them in a form of a workflow.
The idea of this research originates from the models of brain ischemia in laboratory animals that were developed to understand the biological processes underlying cerebral ischemic injury [10]. Studies of rat and mouse genomes showed that most part of human disease genes (99.5%) had orthologues in rodents [11]. Furthermore, comparison of conservation rates of rodent orthologues associated with different types of diseases demonstrated that gene set related to neurological conditions evolved slowly. Together that suggested the rodent models of human neurological diseases to be appropriate representations of the disease processes in humans. Many of the results obtained in model experiments were subsequently confirmed (correlated) in corresponding GWA studies in humans, including those assessed with outcomes after IS [6]. Although there is no animal model that could cover all aspects of human ischemic stroke [12], one of such models—the transient middle cerebral artery occlusion (tMCAO)—is quite promising and actively tested for the development of neuroprotective therapeutic approaches. It is based on temporal artery occlusion and subsequent restoration of blood flow. According to Howells, such model was used in 42.2% of 2582 neuroprotection experiments. The occlusion with subsequent restoration of blood flow can influence the functioning of different genes. Recently, Dergunova et al. identified a list of rat genes that substantially changed their expression in brain in the response to tMCAO [13]. We propose to explore the genomic variations in human orthologues of these genes for searching the genomic markers of IS outcome. Below, we describe in the details the workflow that starts from the list of the rat genes and leads to a set of tagging SNPs (tagSNP) that can be used in case–control studies with the conventional TaqMan real-time PCR assays.

2. Materials and Methods

The main steps of the workflow proposed are shown in Figure 1. In the beginning, there are rat genes with expression level evaluated at 24 h after tMCAO [13]. Twenty-four of them demonstrated the most significant changes in expression level (change in expression >6-fold and p-value < 0.01) and were chosen for further analysis.
The human orthologues of the rat genes were comparatively identified by querying several resources: Ensembl [14], PANTHER 8.0 [15], PhylomeDB 4 [16], and MetaPhOrs [17]. The data from the database Ensembl Genes 97 were retrieved with BioMart by accessing it with web-based interface [18].
The next step was the identification of SNPs within the human genes, including their 5’ and 3’ flanking regions of 5000 bp length. To be relevant to the SNP frequencies in the potential case–control study, the genotypic data should be taken from an appropriate population [19]. To choose such a population, the collection of population samples of 1000 Genomes Project was used. The project comprises one the most comprehensively characterized set of populations with detailed history about each of them [20]. For our purposes we selected CEU population because its genotype data had been shown to be appropriate for selection of loci to assess genetic variability in the most European populations, including those living in Russia [21,22,23,24]. We extracted the required set of SNPs from the bulk of CEU genotype data using VCFtools (0.1.15) [25]. To capture the most common genetic variants, the SNPs with minor allele frequency (MAF) higher than 10% were considered.
Then, we explored the associations between the alleles of selected loci using the correlation coefficient r2 and revealed patterns of linkage disequilibrium (LD) in each of the region considered. To do this, we applied the CLUSTAG tool [26], Tagger instrument [27] implemented in Haploview 4.2 tool [28], and gpart R package (version 1.2.0) [29] using default parameters.
The input files were generated from vcf files obtained in the previous step with the custom scripts. All of the tools were able to reveal patterns of LD (LD blocks) using distinct algorithms but only CLUSTAG and Haploview allowed to compute tagSNPs which represented the groups of highly correlated SNPs in a chromosomal region. Thus, they were used for revealing tagSNPs in the gene regions studied (the threshold of squared correlation between SNPs r2 ≥ 0.8). For both tools, we estimated the tagging effectiveness (TE) as the ratio of the number of tagSNPs to the number of SNPs they tagged.
Because of large number of potential tagSNPs and taking into account that not all of them could mark functionally important SNPs, the subsequent step was to annotate all the possible tagSNPs from high-LD regions with expression quantitative trait loci (eQTLs). For each gene, we downloaded the Significant Single-Tissue eQTLs using the web-interface of Genotype-Tissue Expression (GTEx) project (Release V8) [30]. The eQTLs were further intersected with the tagSNPs determined with Tagger algorithm and filtered by tissue defined as Brain, Artery, Nerve, Blood, and Heart.
At the final step the tagSNPs from the Haploview’s Tagger runs with the maximal capture efficiency (maximal mean r2) and defying as eQTLs were selected to form a list of markers for studying in case–control associations using an appropriate genotyping approach (e.g., TaqMan real-time PCR assay).
The scripts used in this research are freely available at the repository https://github.com/inzilico/tagSNP (accessed on 9 August 2020).

3. Results

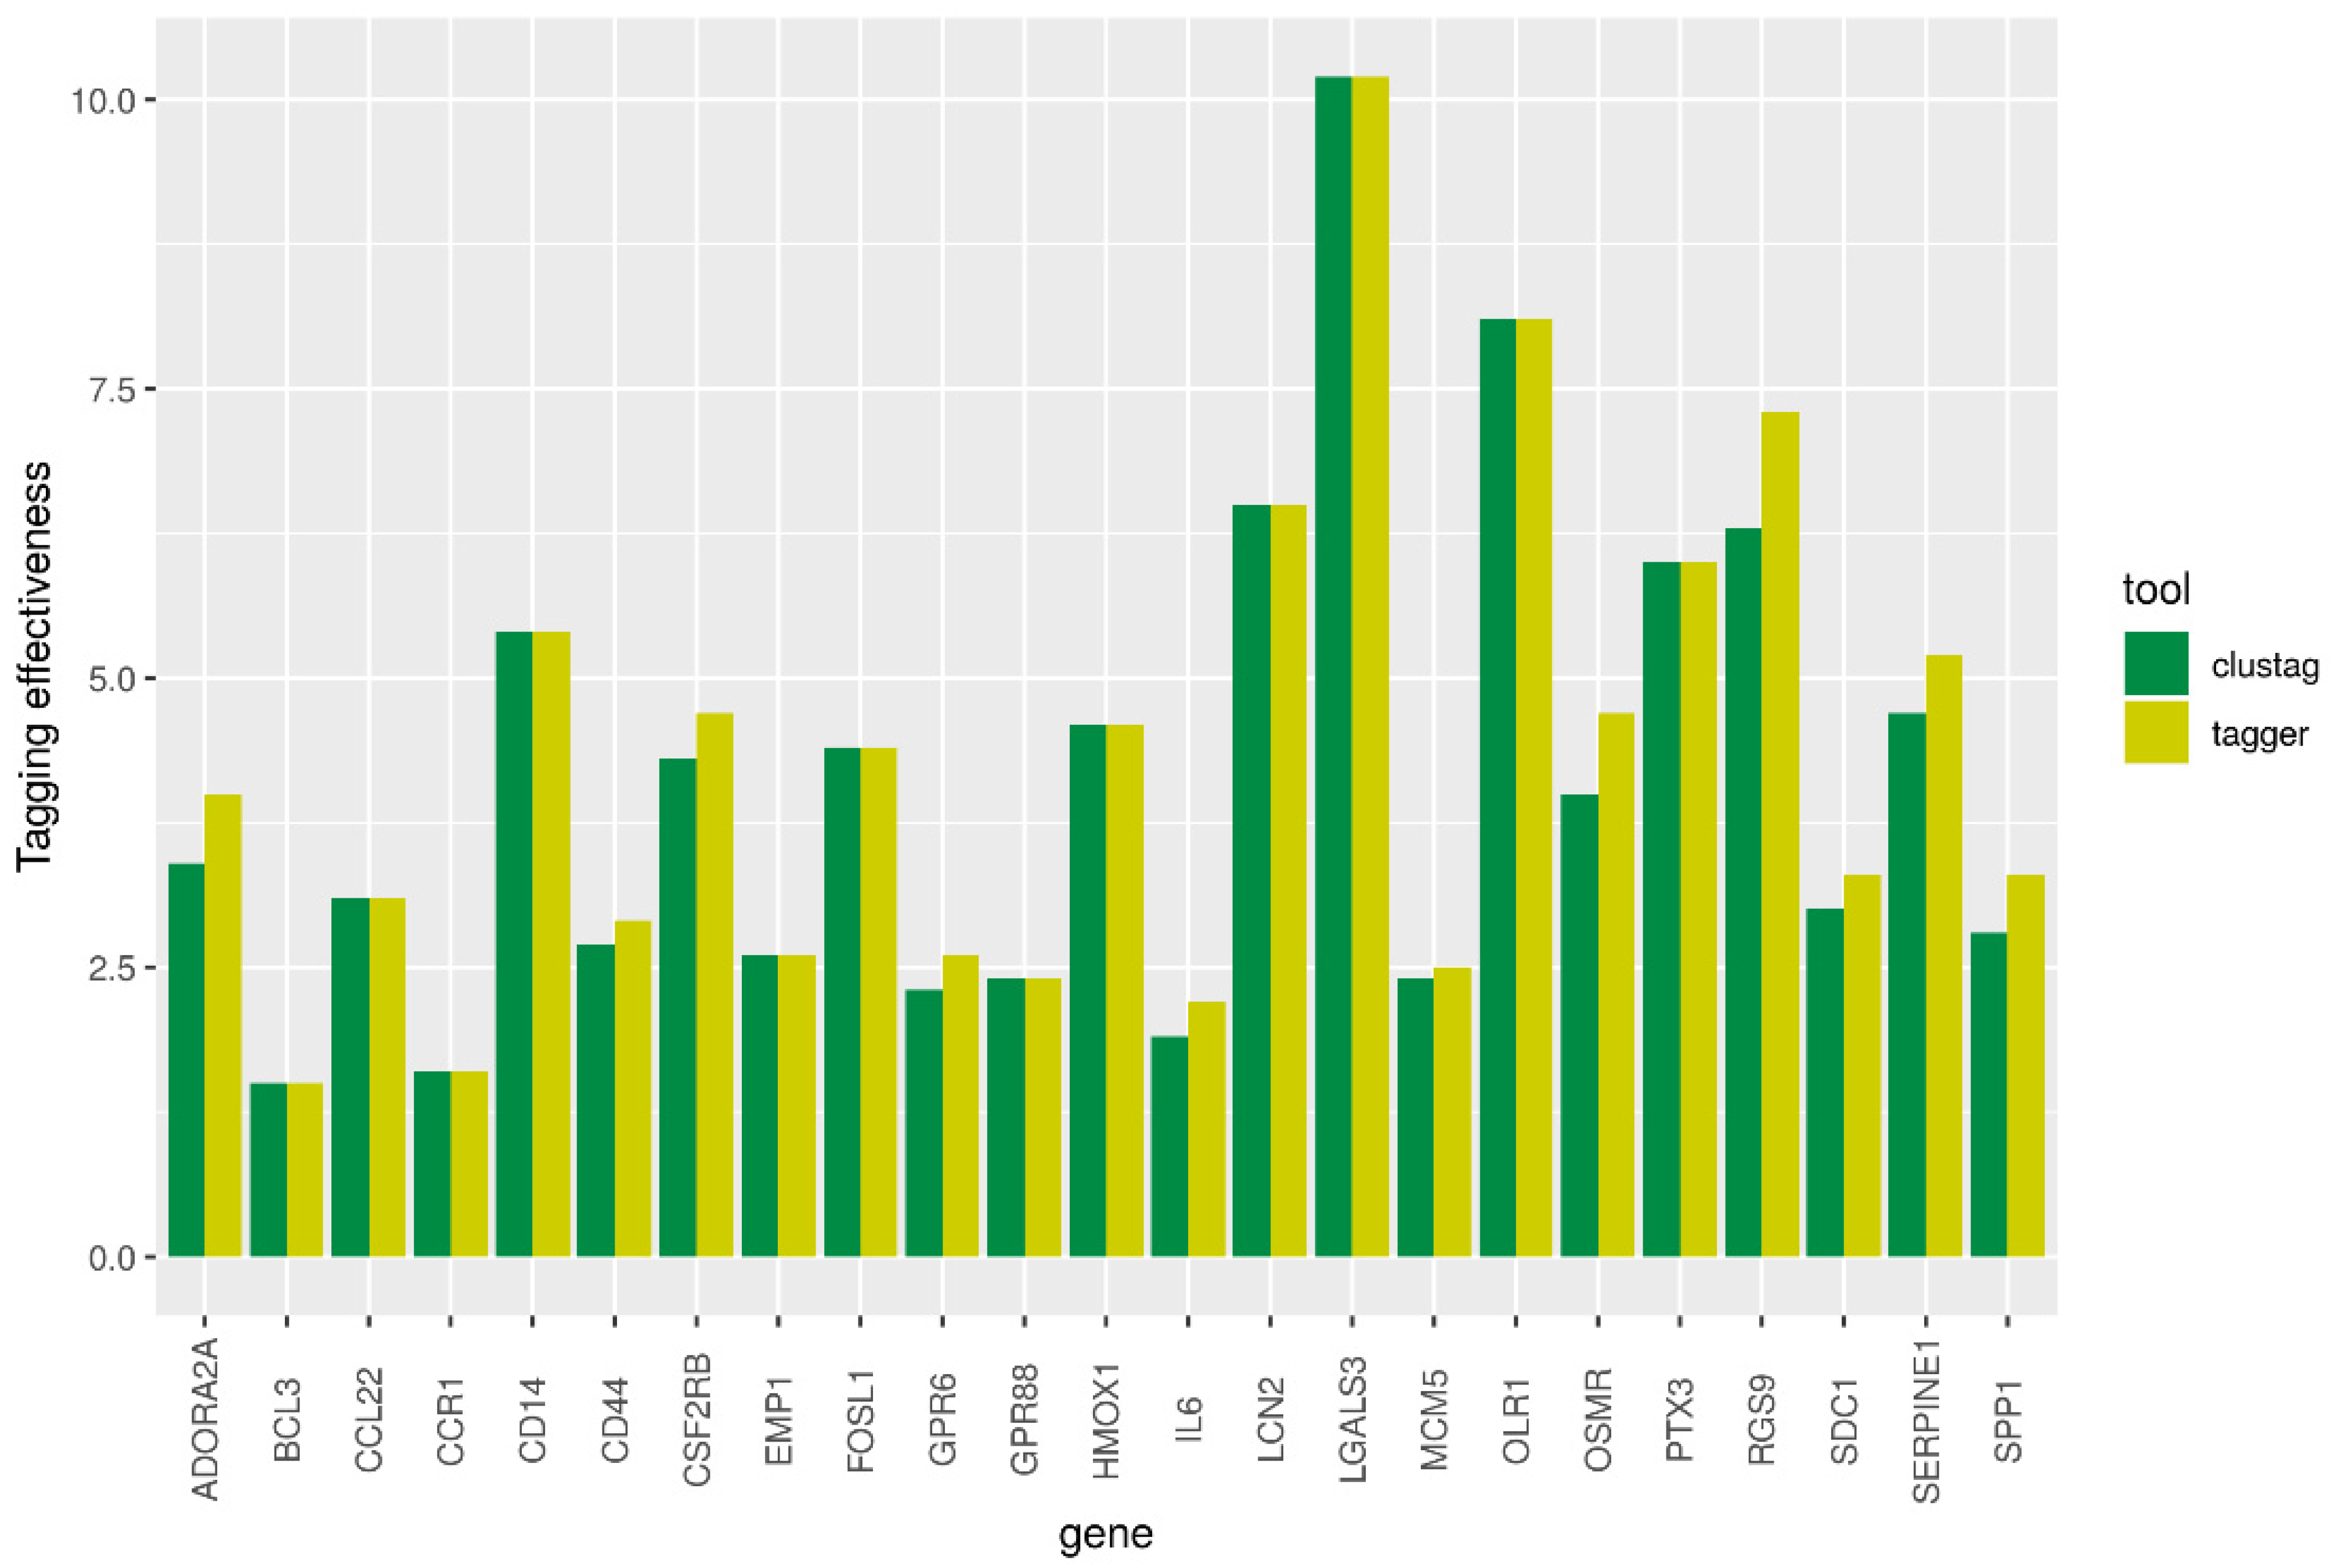
We extracted 23 of 24 human orthologues in rat using such projects as Ensembl, PANTHER, PhylomeDB, and MetaPhOrs. Different repositories resulted in the same list of orthologues that showed a one-to-one relationship between human and rat genes. The exception was Glycam1 gene, which orthologue was not identified. The human GLYCAM1 is pseudogene. The genes extracted from Ensembl are presented in Table 1. The numbers of SNPs identified in each gene including flanking regions are given in Supplementary Table S1. The high-LD regions revealed with three approaches were in good agreement. The TE for CLUSTAG and Tagger are presented in Figure 2. In general Tagger demonstrated higher values of TE than CLUSTAG. Therefore, the tagSNPs revealed by Tagger were used for further analyses, particularly, searching eQTLs.
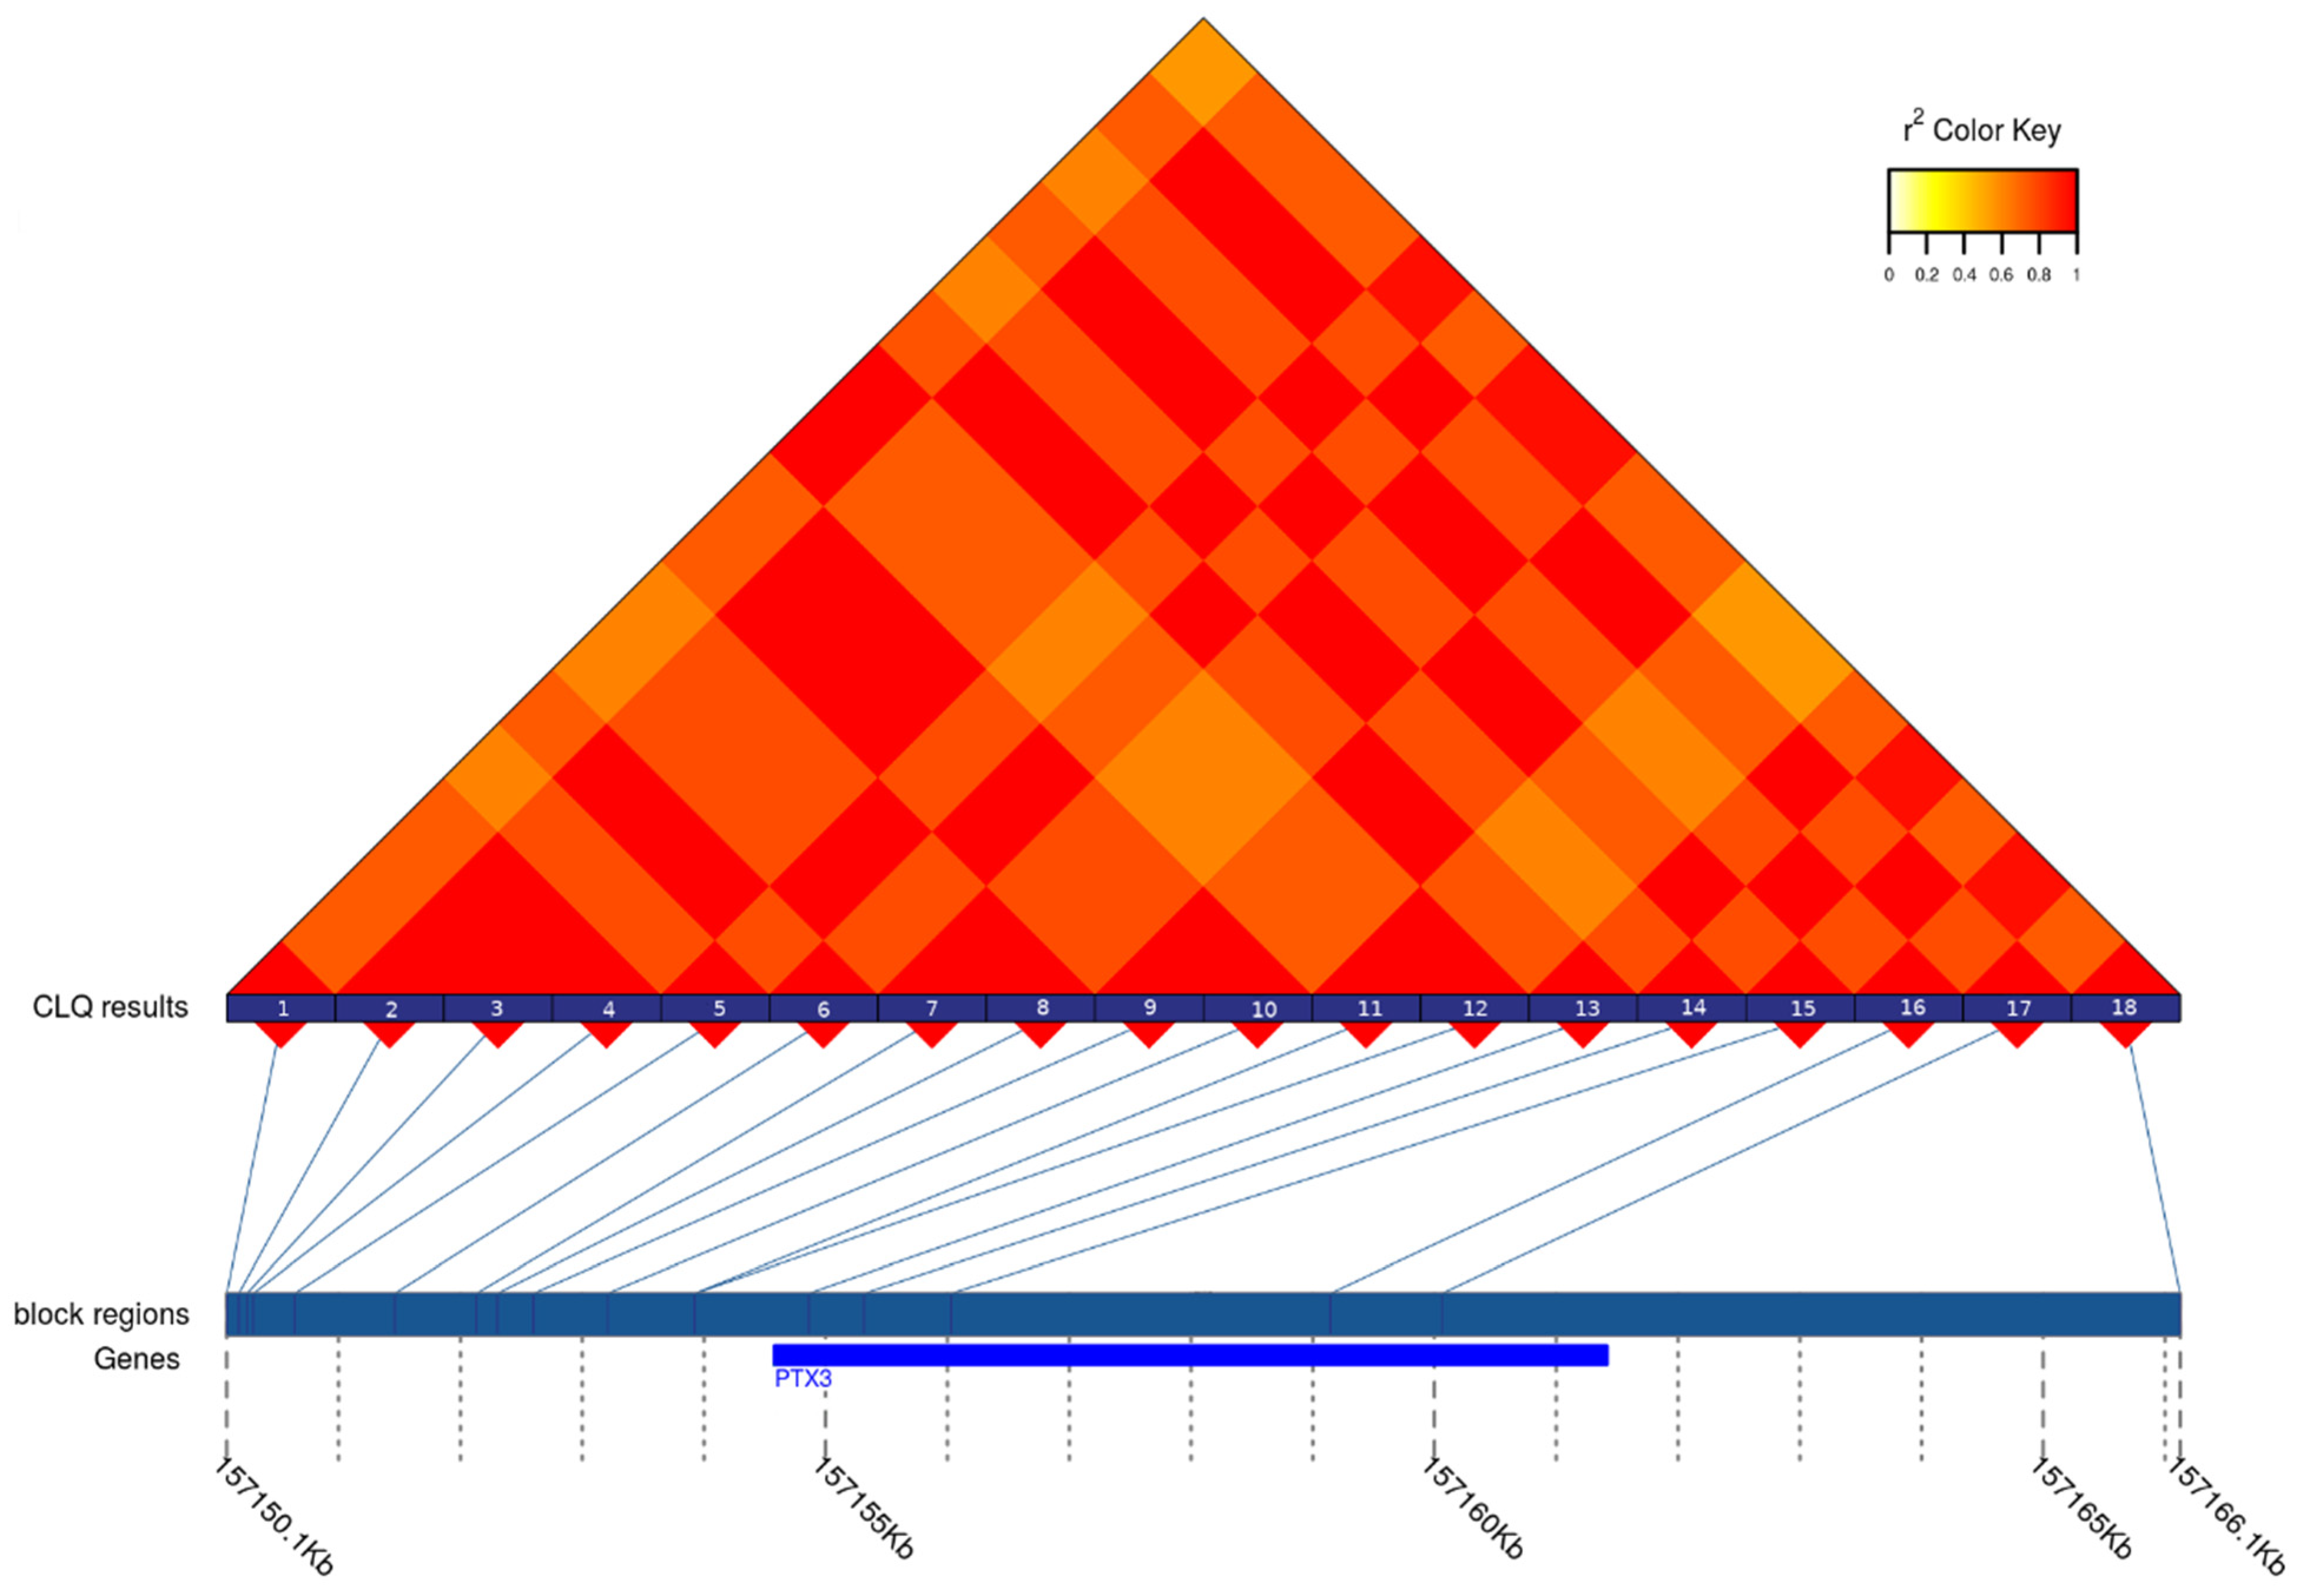
Figure 3 represents the patterns of LD and tagSNPs revealed in PTX3 gene. All the tagSNPs obtained are given in Supplementary Table S2. Only part of them was found to be eQTLs. Some of such tagSNPs was the eQTLs for several tissues. On other hand, no eQTLs were identified among tagSNPs located in BCL3, CCL22, FOSL1, GLYCAM1, GPR6, HMOX1, IL6, and LCN2 genes. After checking the identified sets of eQTLs, nine tagSNPs were determined as potential candidates for further analysis in case–control study using real-time PCR with TaqMan probes. Eight of them were associated with the changes of expression in brain tissues and thus to be the first-priority markers. The ninth locus—the SNP in CCR1 gene—had the greatest absolute values of eQTL-related statistics, particularly, p-value and normalized effect size (10−47 and −0.40, respectively).

4. Discussion

In this paper we proposed a workflow to identify the genetic markers associated with the outcomes of ischemic stroke. It is based on candidate gene approach that requires a prior knowledge about the system under consideration. We hypothesized that such information, particularly, a list of gene-candidates, can be taken from the model studies of brain ischemia in rat. Namely, we took 24 genes exhibited substantial changes in their expression in brain rat after tMCAO and using the workflow proposed obtained a list of the SNPs (tagSNPs with eQTLs abilities) that can be potentially applied in case–control studies.
In the line of workflow, we additionally compared four different sources of human orthologues in rat and three different methods for identification of high-LD regions and selection of tagSNPs. Ensembl, PANTHER, PhylomeDB, and MetaPhOrs were chosen because of the best accuracy and call rate of orthologues inference [31]. They all revealed the same list of human orthologues in rat and thus anyone can be used for searching of orthologs. Nevertheless, human orthologues in rat was identified for each gene of interest and confirmed by four different resources.
To explore patterns of LD and identify tagSNPs we used CLUSTAG, Tagger, and gpart tools. These methods were chosen because they represent three different approaches to the problem of identifying groups of highly correlated SNPs. Although they all exploit the LD-based approach and MAF to split the list of SNPs into high-LD regions (blocks), their algorithms differ. Tagger is based on the analysis of single markers and multi-marker haplotypes, CLUSTAG—on the analysis of clusters, while gpart—on graph analysis. gpart can effectively identify LD blocks of different range but cannot tag SNPs. In terms of TE, Tagger outperformed CLUSTAG and thus its tagSNPs were used for further analysis. However, the number of tagSNPs computed was still high for practical usage, which is why we annotated the SNPs from high-LD regions with eQTLs and subset the appropriate tagSNPs manually. Because the expression of a particular gene can be potentially affected not only the loci located inside the gene (cis-eQTLs) but the loci lied outside the gene (trans-eQTLs) [32] the workflow may be extended with searching additional distant loci associated with the changes of expression of target genes, particularly, the genes in which no cis-eQTLs were identified.
Like other studies pointed to establish genomic landscape of complex traits, our approach is also based on exploration of data of different types (mRNA transcription, population genetic variations, eQTLs) [33,34]. However, it does not rely on GWAS data which are known to be not good in identifying real causative variants and genes as well [35] and thus it is initially more confident. Another characteristic of our approach is its higher genetic complexity due to use of whole genome sequence data allowing possibility for involvement of higher number of real (not imputed) genetic loci in analysis. It should be also noted that although the workflow was applied to SNPs with frequency higher than 10%, it can be used for selecting and testing SNPs with lower frequency (e.g., loci with 5% to 1% frequency). However, it will require increasing the size of human samples analyzed (i.e., population sample, case and control samples). The data of Genome aggregation database project [36] that includes sequencing data of 1000 Genomes Project and others can be used for creating of samples with appropriate size.
The limitation of the proposed approach is that it has not been experimentally validated in a cohort of patients. Nevertheless, we believe that the created workflow will help both in studying of genomics of individual variability in ischemic stroke outcomes and looking inside the black box of polygenicity in their control.

Supplementary Materials

The following are available online at https://www.mdpi.com/2073-4425/12/3/328/s1, Table S1: The number of SNPs identified in human genes, Table S2: The gene based list of tagSNPs including those being eQTLs.

Author Contributions

Conceptualization, A.K. and S.L.; formal analysis, G.K.; investigation, A.K., I.F., V.S., and L.D.; methodology, G.K. and A.K.; project administration, L.D.; supervision, S.L.; writing—original draft, G.K. and A.K.; writing—review & editing, A.K., G.K., and S.L. All authors have read and agreed to the published version of the manuscript.

Funding

The study was funded by RFBR (Russian Foundation for Basic Research) according to the research project No 19-04-00397.

Institutional Review Board Statement

Not applicable.

Informed Consent Statement

Not applicable.

Conflicts of Interest

The authors have no conflict of interest to declare.

References

  1. Jood, K.; Ladenvall, C.; Rosengren, A.; Blomstrand, C.; Jern, C. Family history in ischemic stroke before 70 years of age: The Sahlgrenska academy study on ischemic stroke. Stroke 2005, 36, 1383–1387. [Google Scholar] [CrossRef] [PubMed] [Green Version]
  2. Jickling, G.C.; Kittner, S.J. A SNP-it of stroke outcome. Neurology 2019, 92, 549–550. [Google Scholar] [CrossRef]
  3. Torres-Aguila, N.P.; Carrera, C.; Muiño, E.; Cullell, N.; Cárcel-Márquez, J.; Gallego-Fabrega, C.; González-Sánchez, J.; Bustamante, A.; Delgado, P.; Ibañez, L.; et al. Clinical variables and genetic risk factors associated with the acute outcome of ischemic stroke: A systematic review. J. Stroke 2019, 21, 276–289. [Google Scholar] [CrossRef] [PubMed] [Green Version]
  4. Zhu, M.; Zhao, S. Candidate gene identification approach: Progress and challenges. Intl. J. Biol. Sci. 2007, 3, 420–427. [Google Scholar] [CrossRef] [PubMed] [Green Version]
  5. Falcone, G.J.; Malik, R.; Dichgans, M.; Rosand, J. Current concepts and clinical applications of stroke genetics. Lancet Neurol. 2014, 13, 405–418. [Google Scholar] [CrossRef]
  6. Söderholm, M.; Pedersen, A.; Lorentzen, E.; Stanne, T.M.; Bevan, S.; Olsson, M.; Cole, J.W.; Fernandez-Cadenas, I.; Hankey, G.J.; Jimenez-Conde, J.; et al. Genome-wide association meta-analysis of functional outcome after ischemic stroke. Neurology 2019, 92, E1271–E1283. [Google Scholar] [CrossRef] [Green Version]
  7. Ibanez, L.; Heitsch, L.; Carrera, C.; Farias, F.H.; Dhar, R.; Budde, J.; Cruchaga, C. Multi-ancestry genetic study in 5,876 patients identifies an association between excitotoxic genes and early outcomes after acute ischemic stroke. medRxiv Prepr Serv Heal. Sci. 2020. [Google Scholar] [CrossRef]
  8. Visscher, P.M.; Wray, N.R.; Zhang, Q.; Sklar, P.; McCarthy, M.I.; Brown, M.A.; Yang, J. 10 Years of GWAS Discovery: Biology, Function, and Translation. Amer. J.Human Gen. 2017, 101, 5–22. [Google Scholar] [CrossRef] [Green Version]
  9. Zhu, M.-J.; Li, X.; Zhao, S.-H. Digital candidate gene approach (DigiCGA) for identification of cancer genes. Methods Mol. Biol. 2010, 653, 105–129. [Google Scholar] [CrossRef]
  10. White, B.C.; Sullivan, J.M.; DeGracia, D.J.; O’Neil, B.J.; Neumar, R.W.; Grossman, L.I.; Rafols, J.A.; Krause, G.S. Brain ischemia and reperfusion: Molecular mechanisms of neuronal injury. J. Neurol. Sci. 2000, 179, 1–33. [Google Scholar] [CrossRef]
  11. Huang, H.; Winter, E.E.; Wang, H.; Weinstock, K.G.; Xing, H.; Goodstadt, L.; Stenson, P.D.; Cooper, D.N.; Smith, D.; Albà, M.M.; et al. Evolutionary Conservation and Selection of Human Disease Gene Orthologs in the Rat and Mouse Genomes. 2004. Available online: http://genomebiology.com/2004/5/7/R47 (accessed on 21 October 2019).
  12. Howells, D.W.; Porritt, M.J.; Rewell, S.S.J.; O’Collins, V.; Sena, E.S.; Van Der Worp, H.B.; Traystman, R.J.; MacLeod, M.R. Different strokes for different folks: The rich diversity of animal models of focal cerebral ischemia. J. Cereb. Blood Flow Metabolism. 2010, 30, 1412–1431. [Google Scholar] [CrossRef] [Green Version]
  13. Dergunova, L.V.; Filippenkov, I.B.; Stavchansky, V.V.; Denisova, A.E.; Yuzhakov, V.V.; Mozerov, S.A.; Limborska, S.A. Genome-wide transcriptome analysis using RNA-Seq reveals a large number of differentially expressed genes in a transient MCAO rat model. BMC Genom. 2018, 19, 1–16. [Google Scholar] [CrossRef] [PubMed] [Green Version]
  14. Hunt, S.E.; McLaren, W.; Gil, L.; Thormann, A.; Schuilenburg, H.; Sheppard, D.; Parton, A.; Armean, I.M.; Trevanion, S.J.; Flicek, P.; et al. Ensembl variation resources. Database 2018, 2018, 1–12. [Google Scholar] [CrossRef]
  15. Mi, H.; Muruganujan, A.; Ebert, D.; Huang, X.; Thomas, P.D. PANTHER version 14: More genomes, a new PANTHER GO-slim and improvements in enrichment analysis tools. Nucleic Acids Res. 2019, 47, D419–D426. [Google Scholar] [CrossRef]
  16. Huerta-Cepas, J.; Capella-Gutiérrez, S.; Pryszcz, L.P.; Marcet-Houben, M.; Gabaldón, T. PhylomeDB v4: Zooming into the plurality of evolutionary histories of a genome. Nucleic Acids Res. 2014, 42, 897–902. [Google Scholar] [CrossRef] [Green Version]
  17. Pryszcz, L.P.; Huerta-Cepas, J.; Gabaldón, T. MetaPhOrs: Orthology and paralogy predictions from multiple phylogenetic evidence using a consistency-based confidence score. Nucleic Acids Res. 2011, 39, e32. [Google Scholar] [CrossRef] [Green Version]
  18. BioMart. Available online: http://grch37.ensembl.org/biomart/martview/a117c9fd556f996c278019dae08cfa00 (accessed on 5 July 2019).
  19. Wojcik, G.L.; Fuchsberger, C.; Taliun, D.; Welch, R.; Martin, A.R.; Shringarpure, S.; Carlson, C.S.; Abecasis, G.; Kang, H.M.; Boehnke, M.; et al. Imputation-aware tag SNP selection to improve power for large-scale, multi-ethnic association studies. G3 Genes Genomes Genet. 2018, 8, 3255–3267. [Google Scholar] [CrossRef] [PubMed] [Green Version]
  20. 1000 Genomes Project. Available online: ftp://ftp.1000genomes.ebi.ac.uk/vol1/ftp/release/20130502 (accessed on 2 April 2018).
  21. Lundmark, P.E.; Liljedahl, U.; Boomsma, D.I.; Mannila, H.; Martin, N.G.; Palotie, A.; Syvänen, A.C. Evaluation of HapMap data in six populations of European descent. Eur. J. Hum. Genet. 2008, 16, 1142–1150. [Google Scholar] [CrossRef] [PubMed] [Green Version]
  22. Nelis, M.; Esko, T.; Mägi, R.; Zimprich, F.; Zimprich, A.; Toncheva, D.; Karachanak, S.; Piskácková, T.; Balascák, I.; Peltonen, L.; et al. Genetic structure of Europeans: A view from the North-East. PLoS ONE 2009, 4, e5472. [Google Scholar] [CrossRef] [Green Version]
  23. Khrunin, A.V.; Khokhrin, D.V.; Filippova, I.N.; Esko, T.; Nelis, M.; Bebyakova, N.A.; Bolotova, N.L.; Klovins, J.; Nikitina-Zake, L.; Rehnström, K.; et al. A genome-wide analysis of populations from European Russia reveals a new pole of genetic diversity in northern Europe. PLoS ONE 2013, 8, e58552. [Google Scholar] [CrossRef] [PubMed]
  24. Khrunin, A.V.; Aliev, A.M.; Limborska, S.A. DNA markers from genome-wide association studies of cardiovascular diseases. Microbiol. Virol. 2018, 33, 245–247. [Google Scholar] [CrossRef]
  25. Danecek, P.; Auton, A.; Abecasis, G.; Albers, C.A.; Banks, E.; DePristo, M.A. The variant call format and VCFtools. Bioinformatics 2011, 27, 2156–2158. [Google Scholar] [CrossRef] [PubMed]
  26. Ao, S.I.; Yip, K.; Ng, M.; Cheung, D.; Fong, P.Y.; Melhado, I. CLUSTAG: Hierarchical clustering and graph methods for selecting tag SNPs. Bioinformatics 2005, 21, 1735–1736. [Google Scholar] [CrossRef] [PubMed] [Green Version]
  27. De Bakker, P.I.W.; Yelensky, R.; Pe’Er, I.; Gabriel, S.B.; Daly, M.J.; Altshuler, D. Efficiency and power in genetic association studies. Nat. Genet. 2005, 37, 1217–1223. [Google Scholar] [CrossRef] [PubMed]
  28. Barrett, J.C.; Fry, B.; Maller, J.; Daly, M.J. Haploview: Analysis and visualization of LD and haplotype maps. Bioinformatics 2004, 21, 263–265. [Google Scholar] [CrossRef] [PubMed] [Green Version]
  29. Kim, S.A.; Brossard, M.; Roshandel, D.; Paterson, A.D.; Bull, S.B.; Yoo, Y.J. gpart: Human genome partitioning and visualization of high-density SNP data by identifying haplotype blocks. Bioinformatics 2019, 35, 4419–4421. [Google Scholar] [CrossRef] [PubMed]
  30. Genotype-Tissue Expression (GTEx) Project. Available online: gtexportal.org. (accessed on 8 July 2020).
  31. Altenhoff, A.M.; Boeckmann, B.; Capella-Gutierrez, S.; Dalquen, D.A.; DeLuca, T.; Forslund, K. Standardized benchmarking in the quest for orthologs. Nat. Methods 2016, 13, 425–430. [Google Scholar] [CrossRef]
  32. Nodzak, C. Introductory methods for EQTL analyses. In Methods in Molecular Biology; Humana Press Inc.: Totowa, NJ, USA, 2020; pp. 3–14. [Google Scholar] [CrossRef]
  33. Zhao, S.; Jiang, H.; Liang, Z.H.; Ju, H. Integrating Multi-Omics Data to Identify Novel Disease Genes and Single-Neucleotide Polymorphisms. Front. Genet. 2020, 10, 1–8. [Google Scholar] [CrossRef] [PubMed]
  34. Zheng, Q.; Ma, Y.; Chen, S.; Che, Q.; Chen, D. The Integrated Landscape of Biological Candidate Causal Genes in Coronary Artery. Disease. Front. Genet. 2020, 11, 1–14. [Google Scholar] [CrossRef] [Green Version]
  35. Gallagher, M.D.; Chen-Plotkin, A.S. The Post-GWAS Era: From Association to Function. Am. J. Hum. Genet. 2018, 102, 717–730. [Google Scholar] [CrossRef] [Green Version]
  36. Karczewski, K.J.; Francioli, L.C.; Tiao, G.; Cummings, B.B.; Alföldi, J.; Wang, Q.; Collins, R.L.; Laricchia, K.M.; Ganna, A.; Birnbaum, D.P.; et al. The mutational constraint spectrum quantified from variation in 141,456 humans. Nature 2020, 581, 434–443. [Google Scholar] [CrossRef] [PubMed]
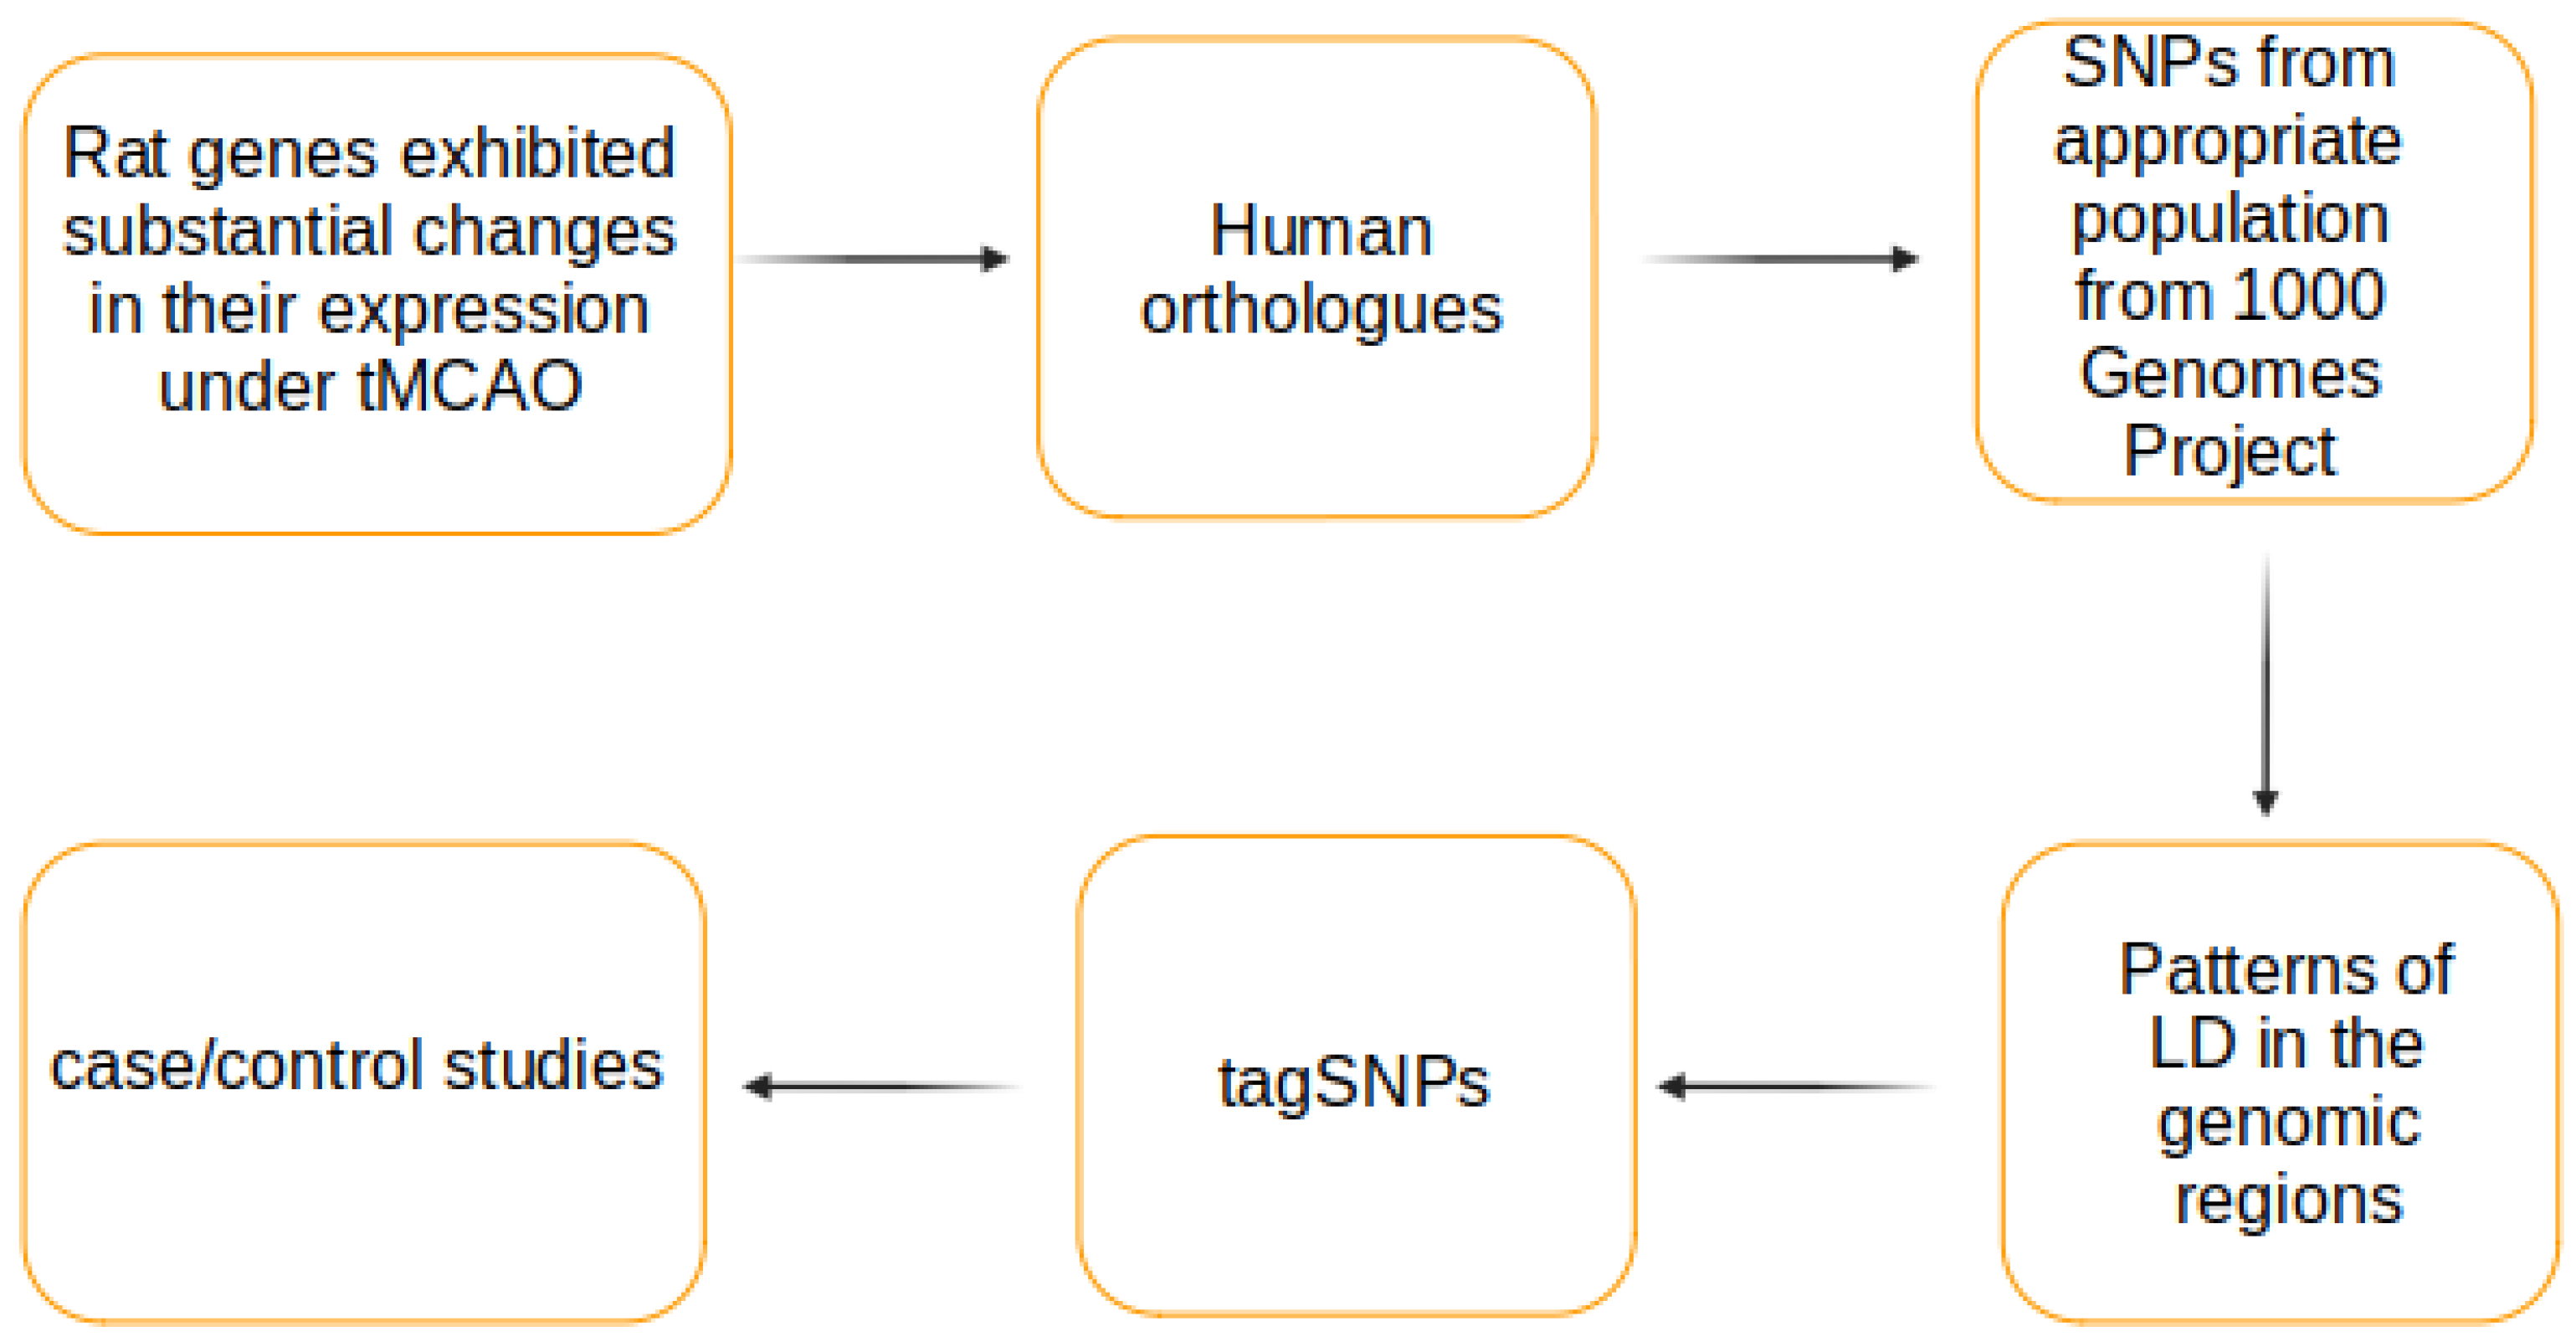
Figure 1. The workflow to identify the tagging SNPs for studying the ischemic stroke outcomes.
Genes 12 00328 g001
Figure 2. Tagging effectiveness by CLUSTAG and Tagger tools.
Genes 12 00328 g002
Figure 3. The heatmap of LD between the SNPs in the region of PTX3 gene in the CEU population. The numbers at the bottom of LD plot designate the SNPs included in analyses. Their coordinates as well as the boundaries of the gene are presented at the line below LD plot. The SNPs with numbers 2, 3, 4, 6, 9, 10, 13, 15, and 17 are the members of the first group of strongly associated (r2 ≥ 0.8) SNPs, while the SNPs with the numbers 5,7,8,14,16,18 and 1,11,12 represent the second and the third group, respectively.
Genes 12 00328 g003
Table 1. The human orthologues of rat genes identified with Ensembl.
RatHumanMetrics
GeneChromStart (bp)End (bp)GeneChromStart (bp)End (bp)12345
Adora2a201644938516466147ADORA2A222481384724838328828210087.441
Bcl318199611682010351BCL3194525096245263301828310059.561
Ccl22191066840310675173CCL22165739268457400102656510053.851
Ccr18132147929132153481CCR1346243200462498878080751001
Cd14182926535329266946CD1451400113131400132866263751001
Cd4439933945599426032CD44113516041735253949716810091.021
Csf2rb7119544873119558539CSF2RB22373096703733649156561001001
Emp14233415324233449254EMP11213349650133697087674751001
Fosl11227755887227764393FOSL111656595206566804492911001001
Glycam17142951738142953998*
Gpr6204751879047521561GPR6611029951411030192194945099.761
Gpr882237334865237339419GPR8811010036931010075749595501001
Hmox1192562255625629372HMOX12235776354357902078080501001
Il6430955363100112IL672276550322771621404001000
Lcn231676305916766466LCN2913091135013091573464641001001
Lgals3152809406228106276LGALS3145559082855612126827810096.411
Mcm5192563749225681915MCM522357960563582142347975099.530
Olr14211883405211905489OLR11210310902103247376649751000
Osmr27585166475892056OSMR53884596038945698565710099.61
Ptx32177457263177463073PTX3315715457815716141781811001001
Rgs9109722554197298645RGS917631335496322382191907567.671
Sdc164366744443689898SDC12204005582042519477761001001
Serpine1122465338524663763SERPINE1710077037010078254781811001001
Spp11466530936658953SPP148889681988904562636210066.281
1—%id. target rat gene identical to query gene; 2—%id. query gene identical to target Rat gene; 3—rat gene-order conservation score; 4—rat whole-genome alignment coverage; 5—rat orthology confidence [0 low, 1 high]; *Glycam1 has no orthologues in human.
Publisher’s Note: MDPI stays neutral with regard to jurisdictional claims in published maps and institutional affiliations.