
The Ancestry of Eastern Paraguay: A Typical South American Profile with a Unique Pattern of Admixture

 , , , ,
  ,
,  and
and 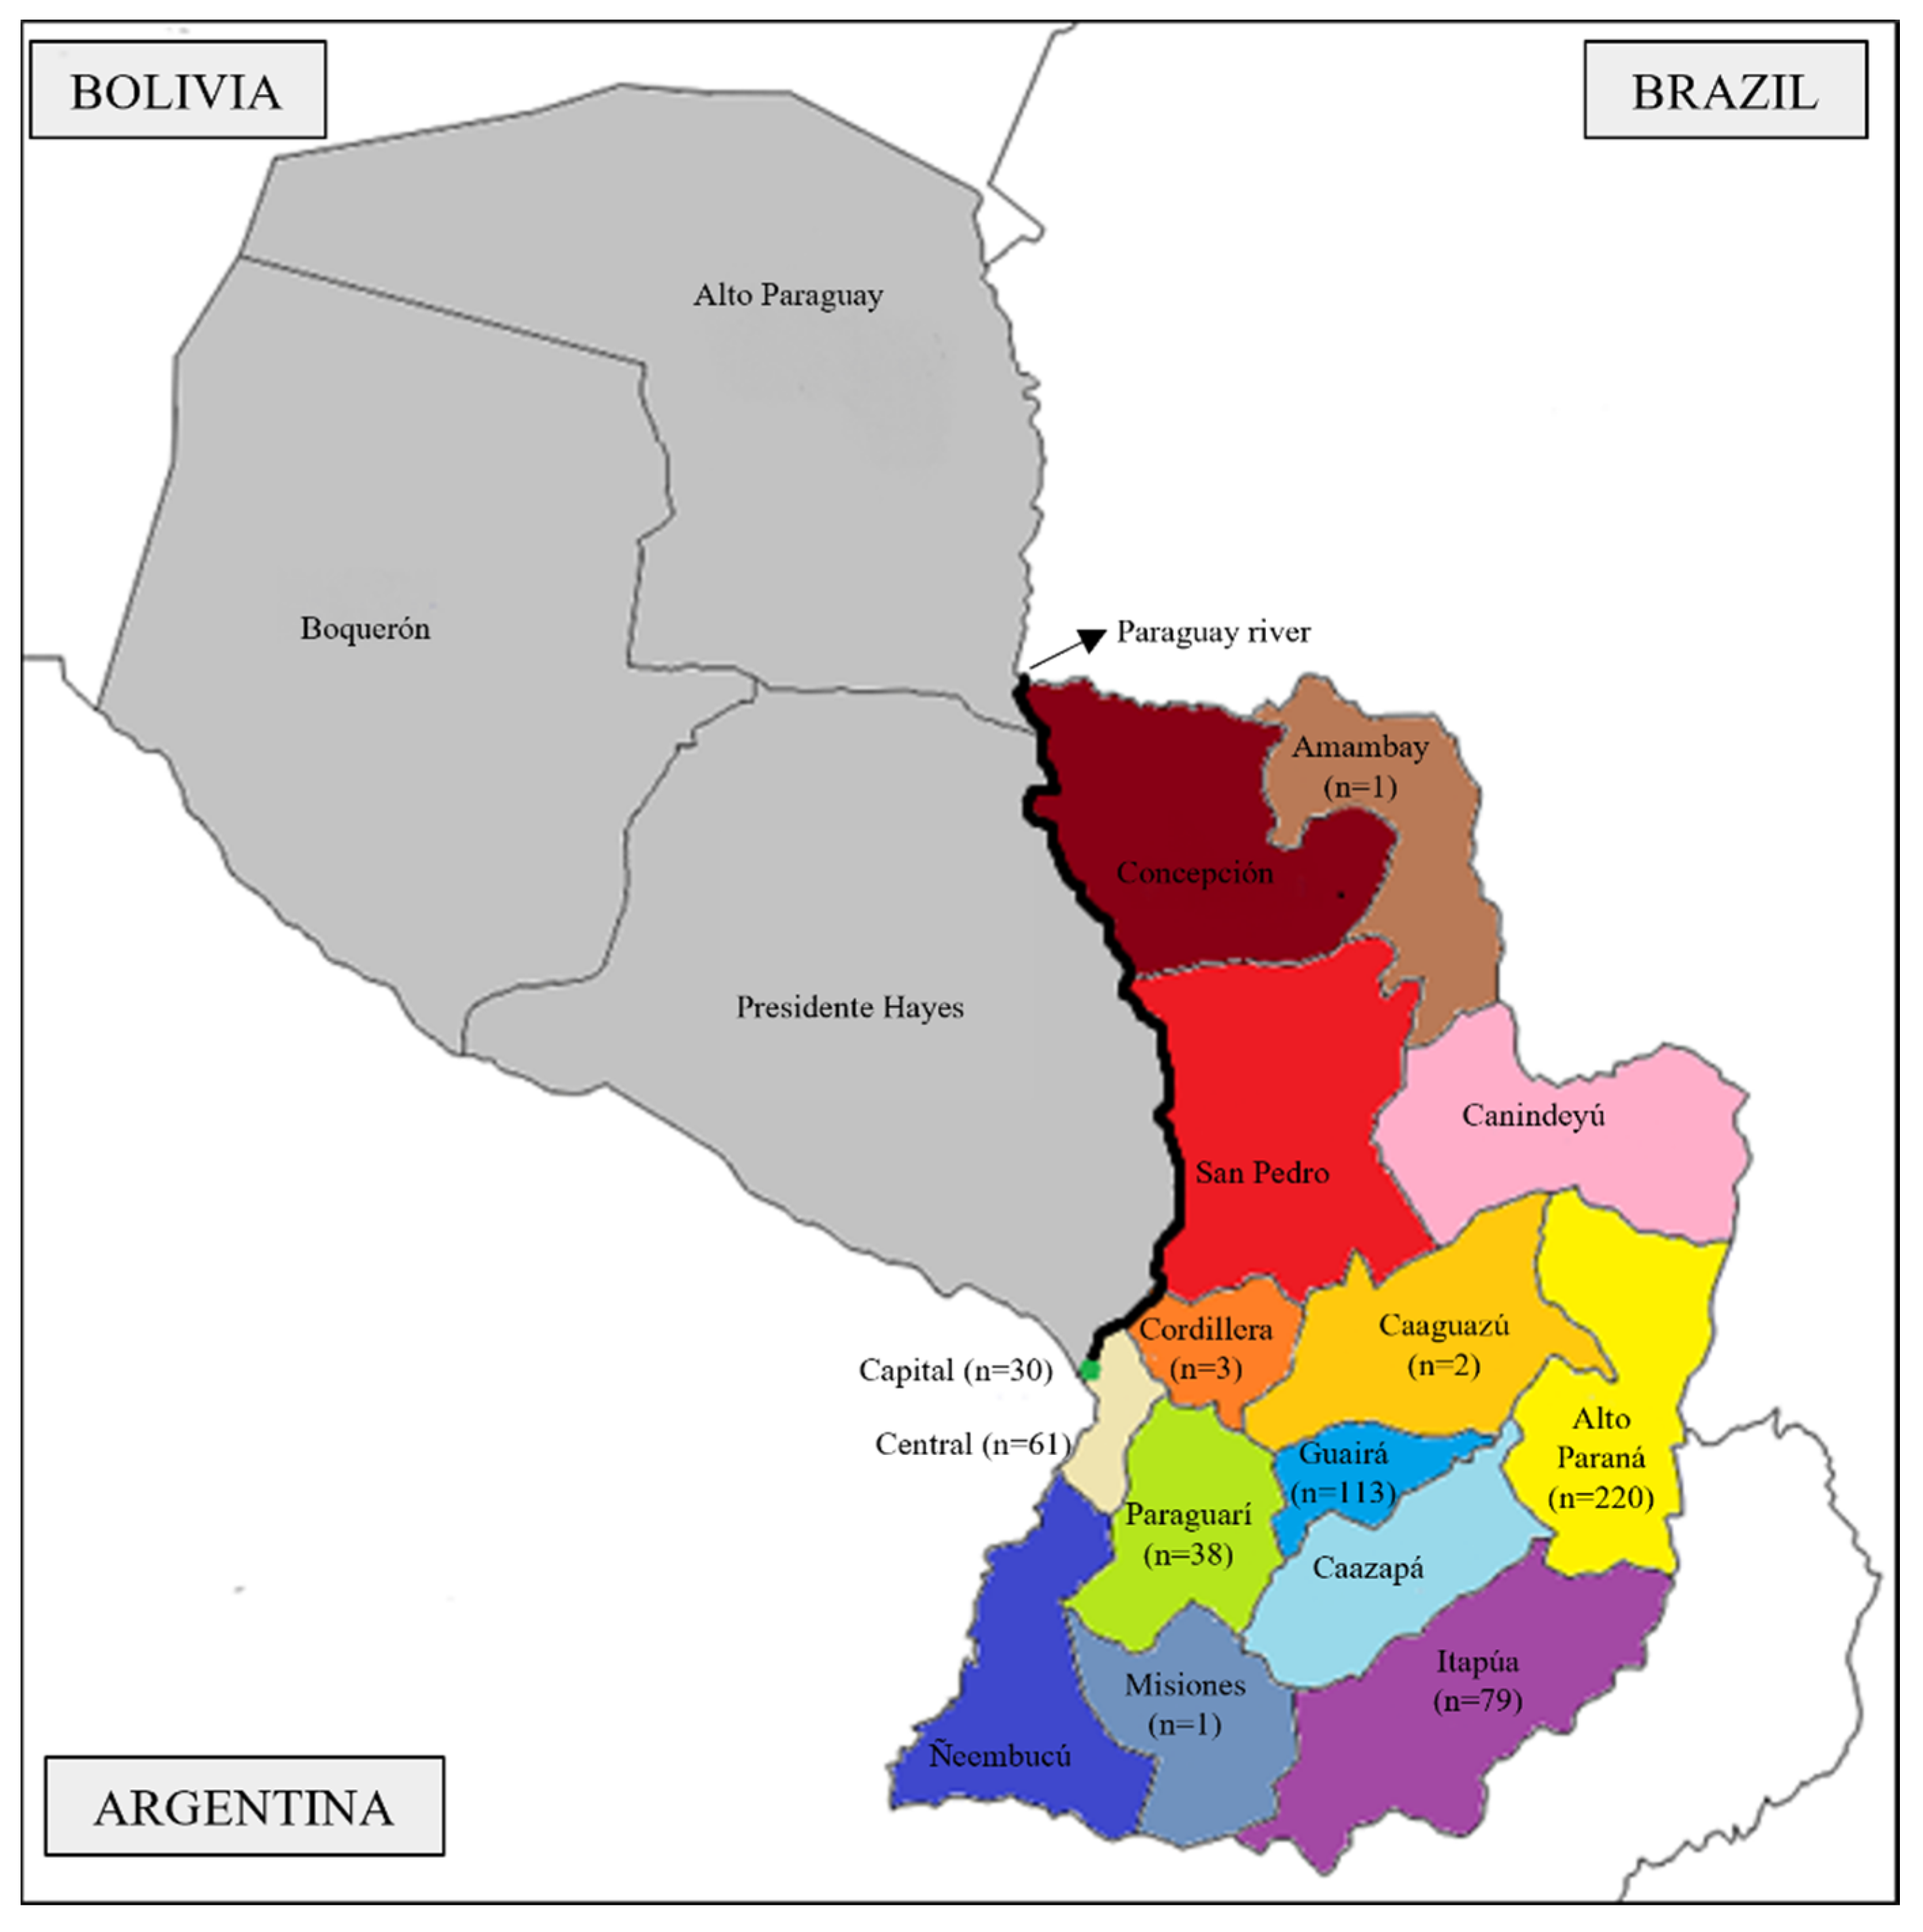
Abstract
1. Introduction
2. Materials and Methods
2.1. Sampling
2.2. Genotyping Methods
2.3. Statistical Analysis
3. Results and Discussion
3.1. Demography and Genetic Structure of Eastern Paraguay
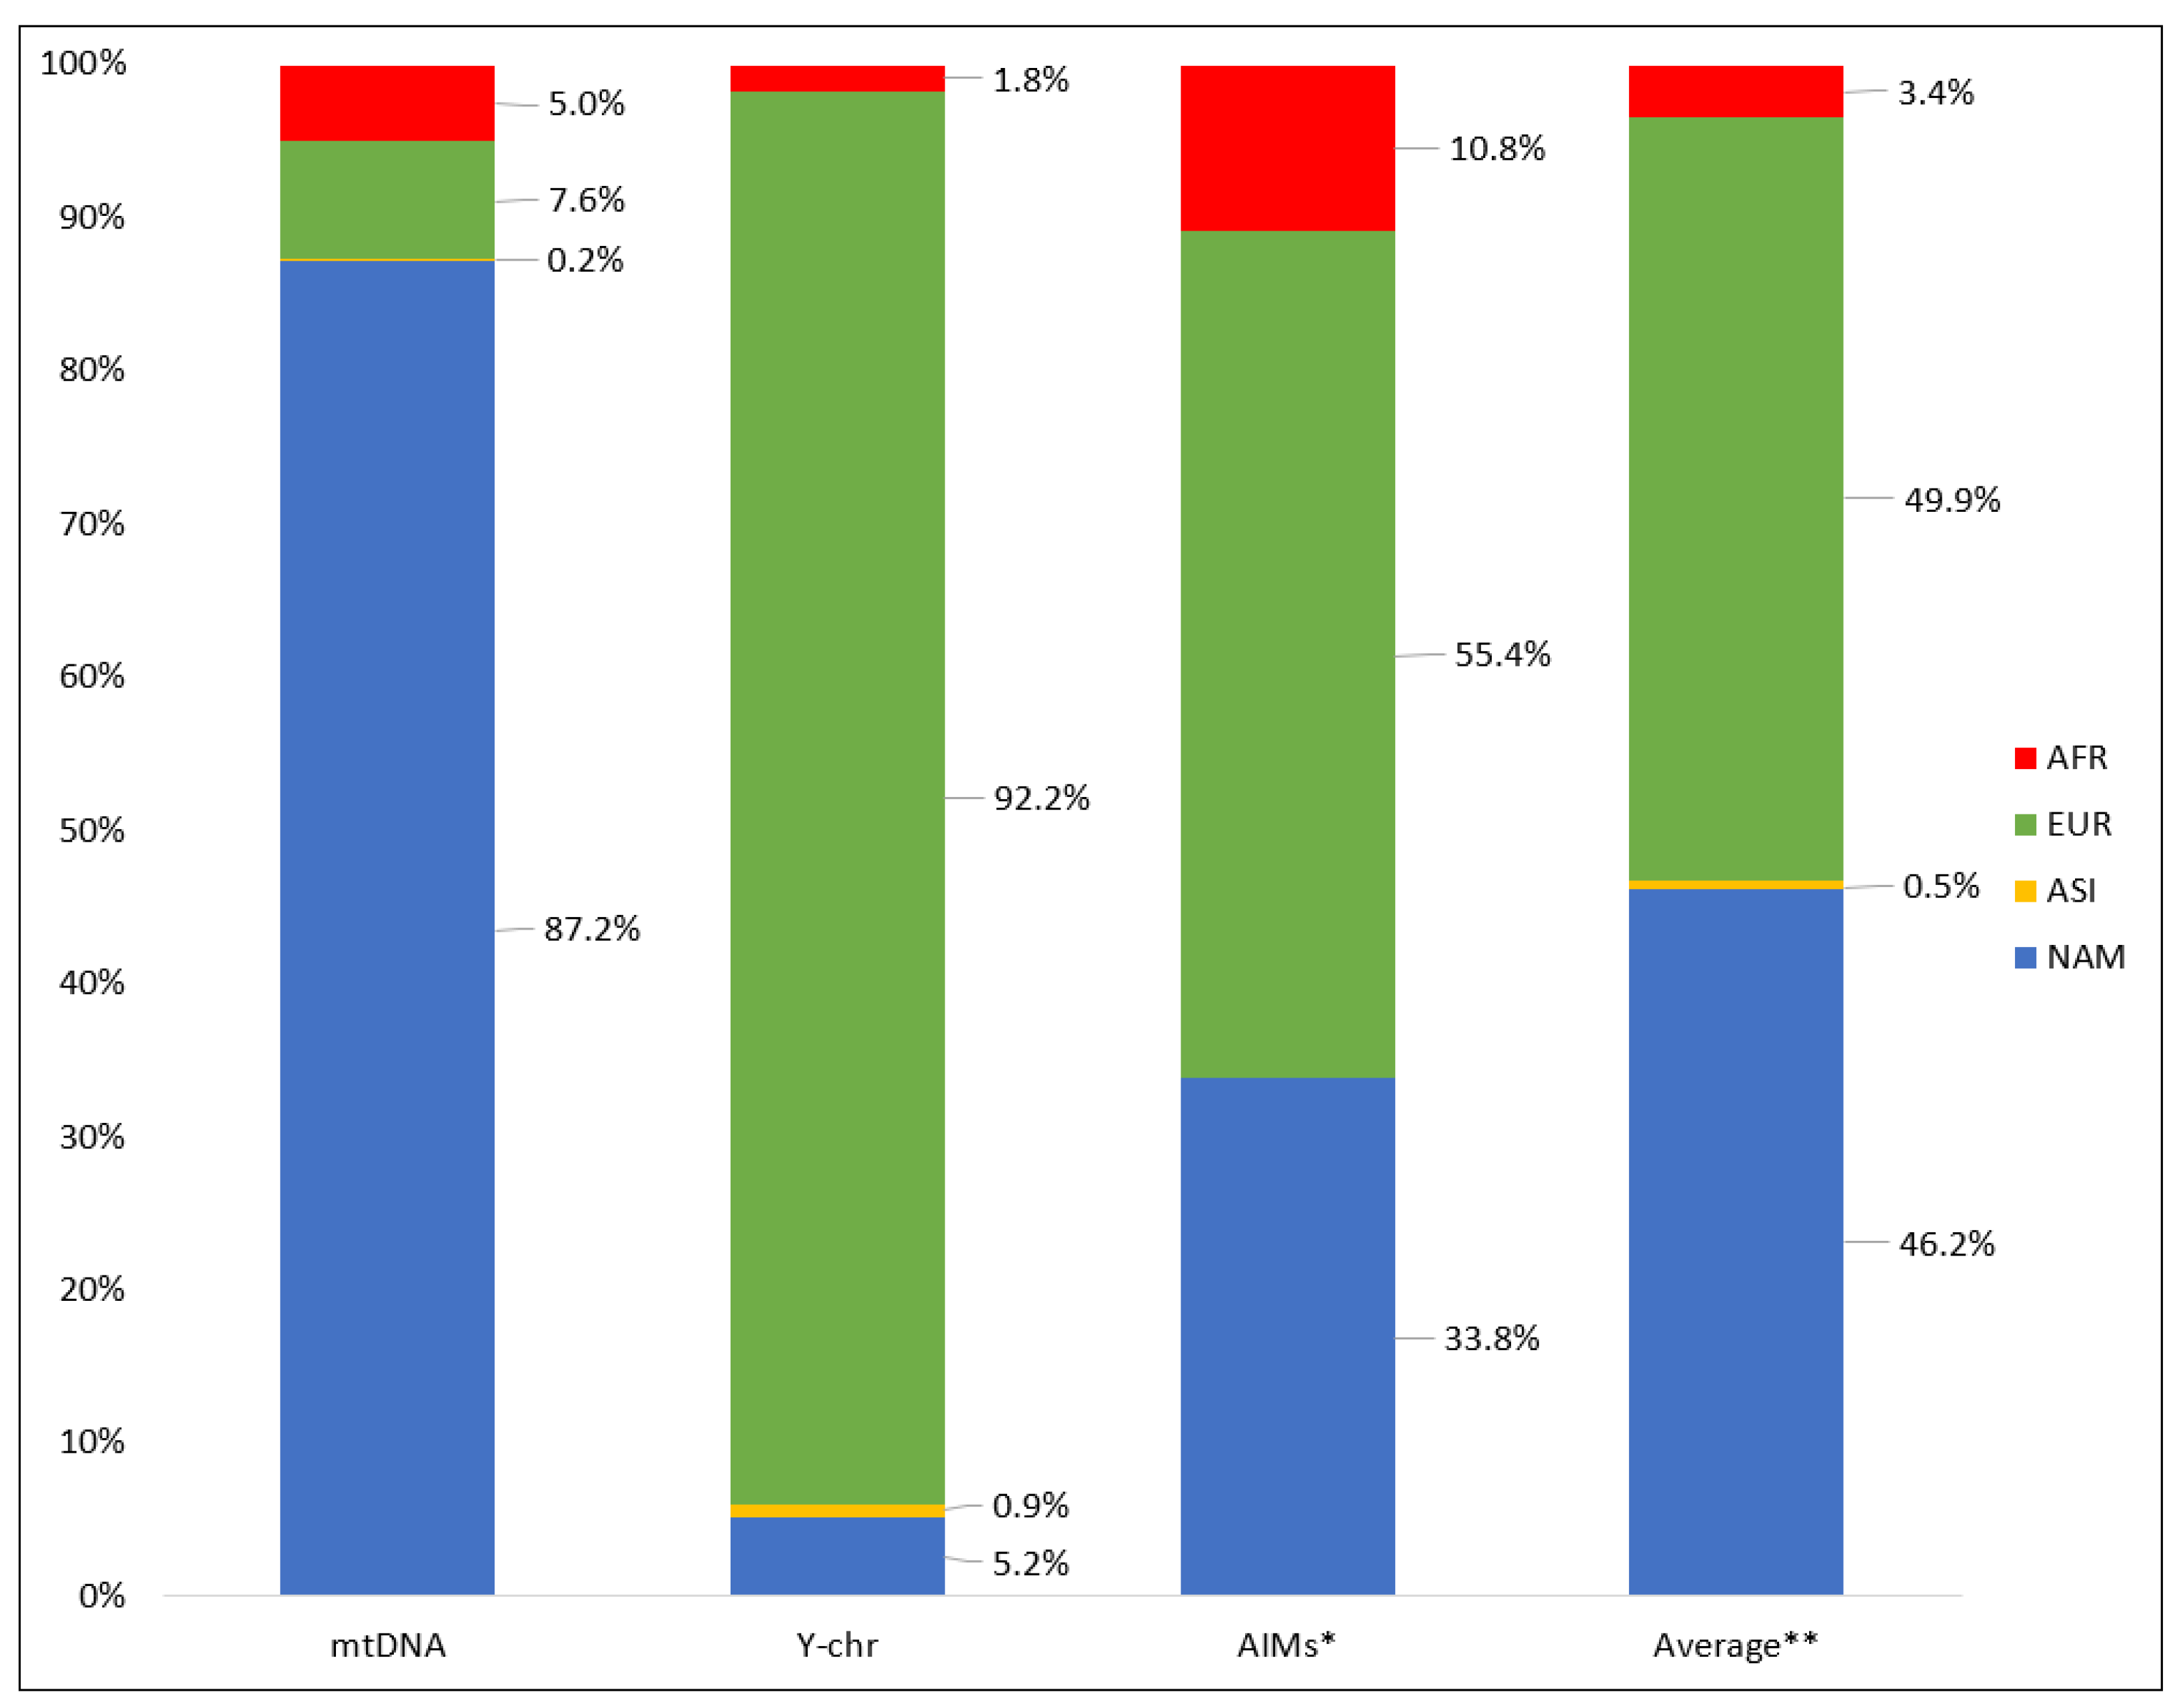
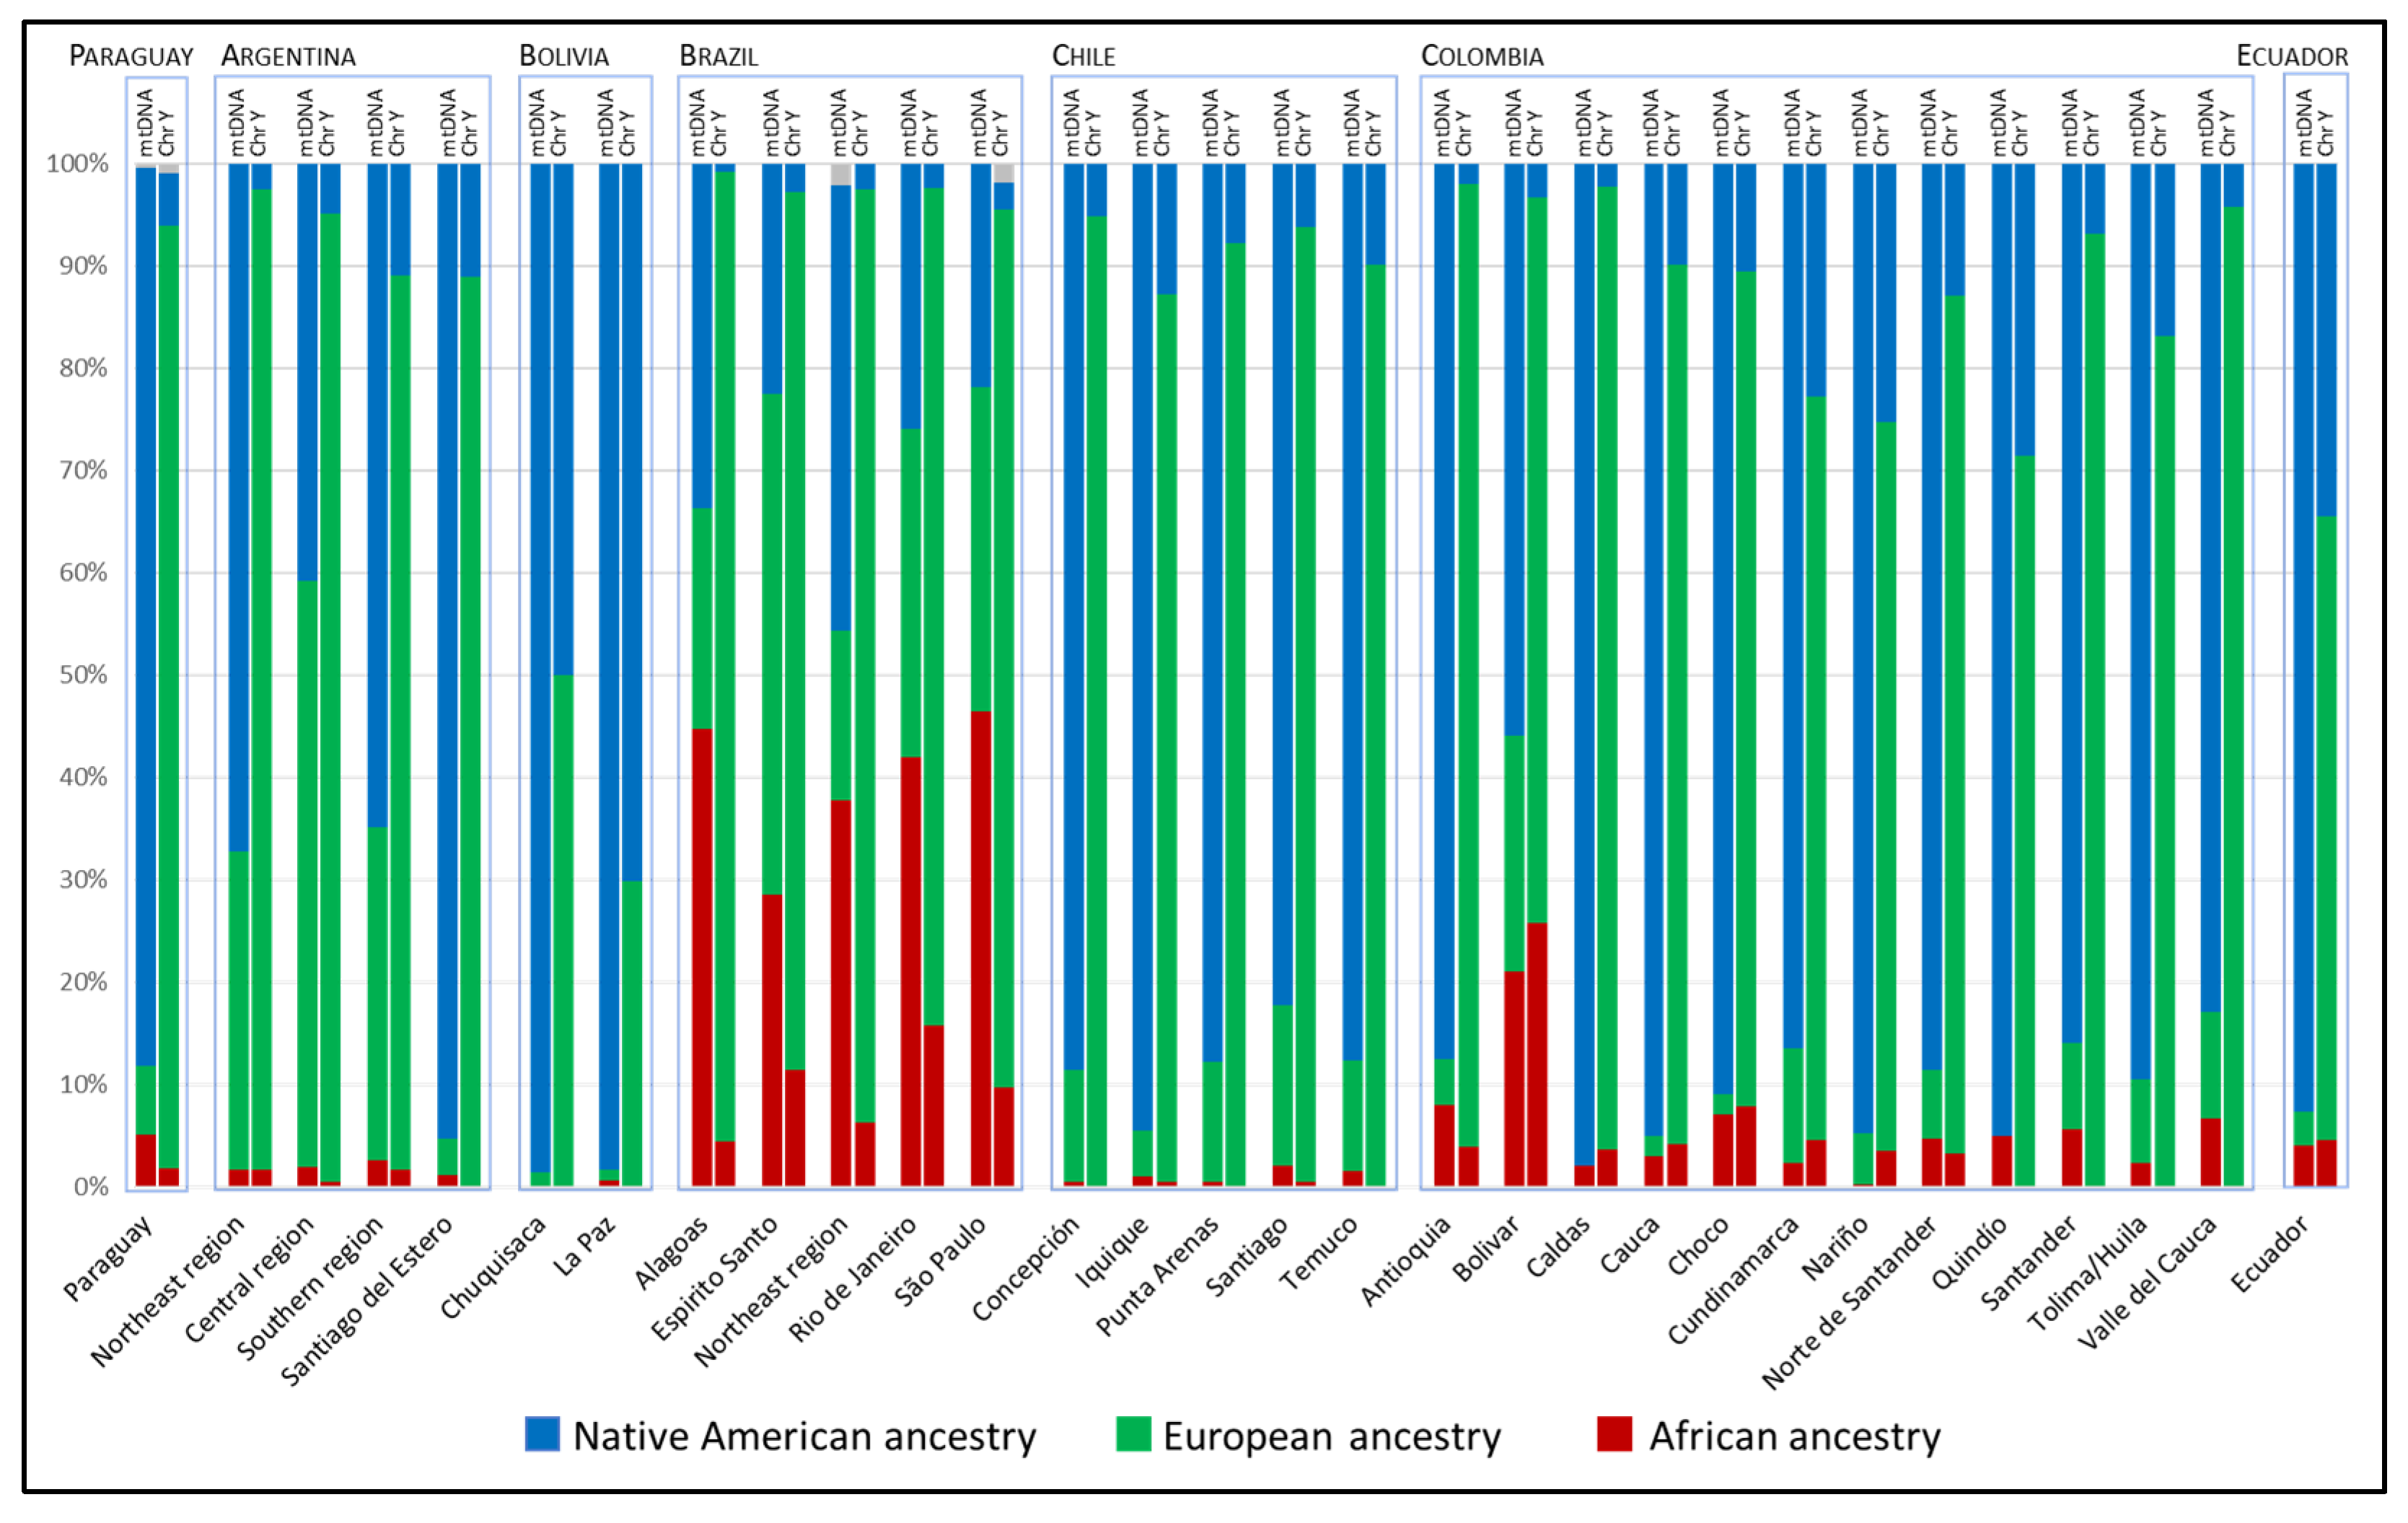
3.2. Continental Ancestry of Eastern Paraguay
3.3. Native American Maternal Ancestry
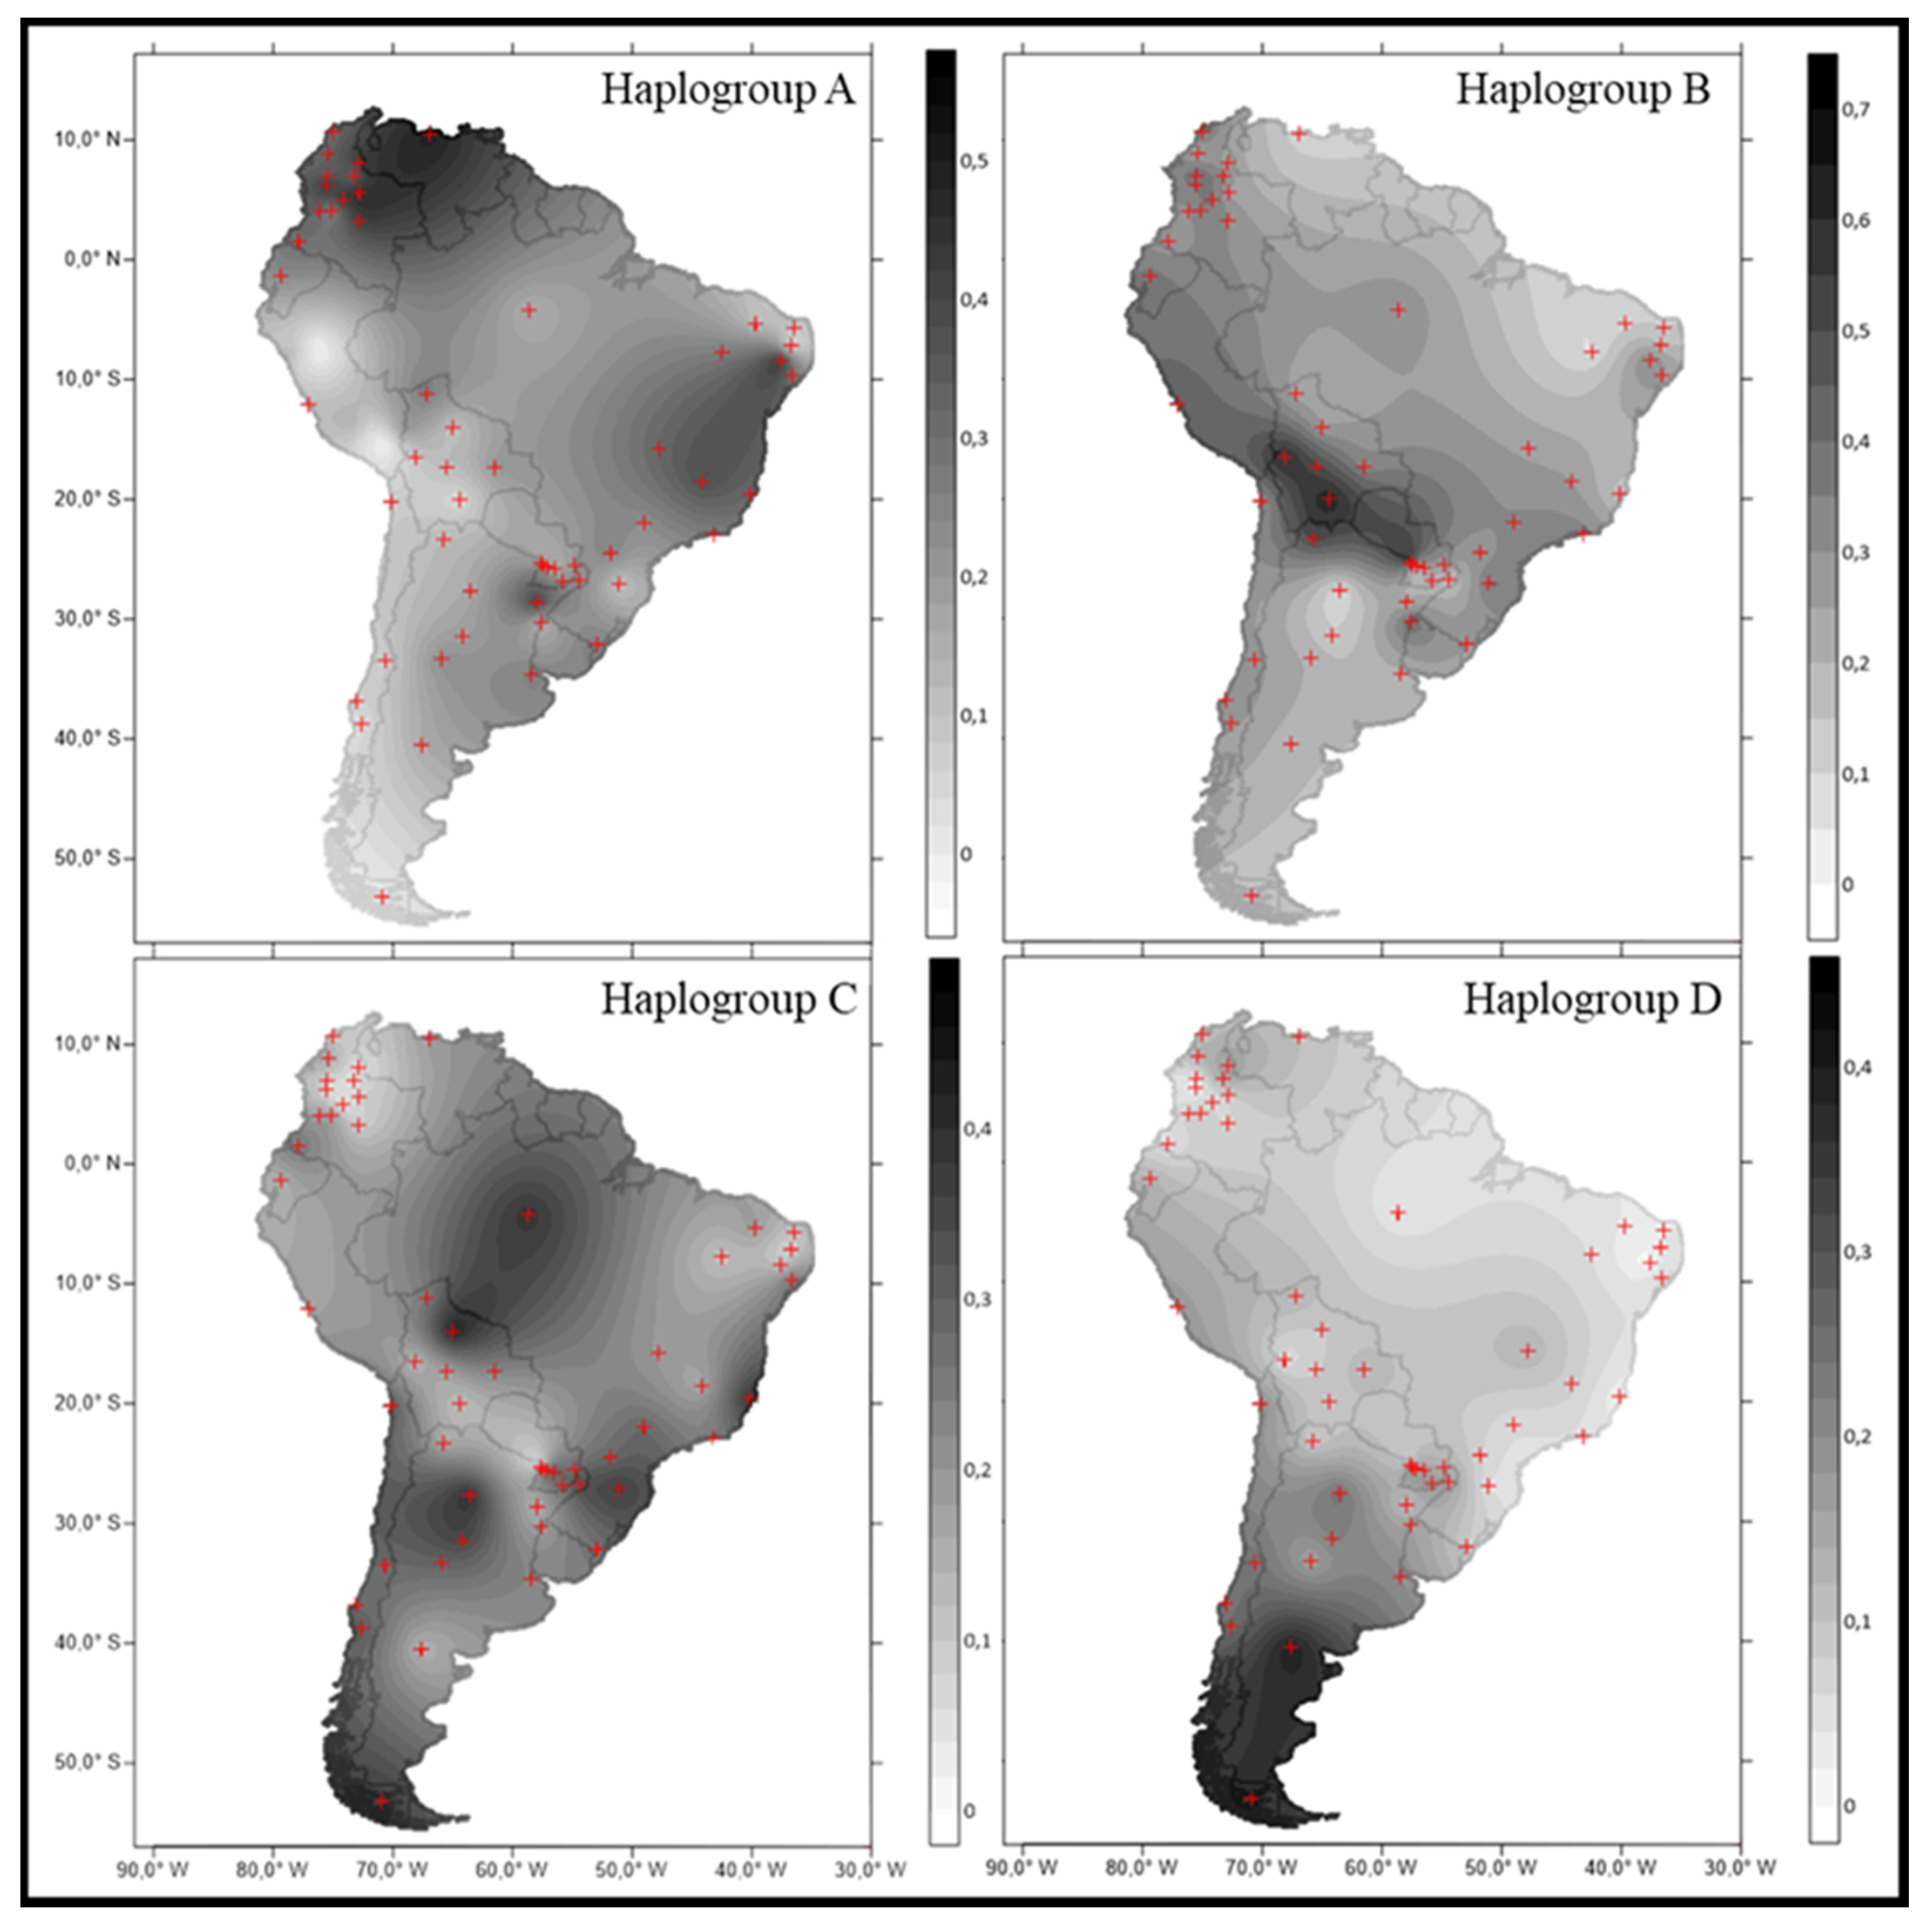
3.4. Phylogeographic Reconstruction of Maternal Native Lineages
3.5. European Paternal Ancestry
4. Conclusions
Supplementary Materials
Author Contributions
Funding
Institutional Review Board Statement
Informed Consent Statement
Data Availability Statement
Conflicts of Interest
References
- Vásquez, F. Territorio y Población Nuevas Dinámicas, 1st ed.; ADEPO: Asunción, Paraguay, 2006; ISBN 9788469096895. [Google Scholar]
- Pottthast-Jutkeit, B. The creation of the “mestizo family model”: The example of Paraguay. Hist. Fam. 1997, 2, 123–139. [Google Scholar] [CrossRef]
- Jermyn, L.; Lin, Y.J. Paraguay (Cultures of the World, Second), 2nd ed.; Marshall Cavendish Benchmark: New York, NY, USA, 2010. [Google Scholar]
- Rodriguez, J.P. The Historical Encyclopedia of World Slavery; ABC-CLIO: Santa Barbara, CA, USA, 1997. [Google Scholar]
- Juang, R.M.; Morrissette, N. Africa and the Americas: Culture, Politics, and History; ABC-CLIO: Santa Barbara, CA, USA, 2008. [Google Scholar]
- Oddone, H. The Encyclopedia of Global Human Migration, 1st ed.; Ness, I., Ed.; Wiley-Blackwell: Hoboken, NJ, USA, 2013; ISBN 9781444351071. [Google Scholar]
- Lambert, P.; Nickson, A. The Paraguay Reader: History, Culture, Politics; Duke University Press Books: Durham, NC, USA, 2012. [Google Scholar]
- Vullo, C.; Rotondo, M.; Daguerre, N.; Quiroz, A.; Velázquez, V.; Machado, P.; Serra, H.; Borosky, A. Genetic polymorphism of 22 autosomal STR markers in Paraguay. Forensic Sci. Int. Genet. 2016, 25, e16–e17. [Google Scholar] [CrossRef] [PubMed]
- Ribeiro, J.; Romero, M.; Simão, F.; Ferreira Almeida, A.P.; Quiroz, A.; Machado, P.; Velázquez, V.; de Carvalho, E.F.; Vullo, C.; Gusmão, L. Analysis of 23 Y-STRs in a population sample from eastern Paraguay. Forensic Sci. Int. Genet. 2018, 37, e20–e22. [Google Scholar] [CrossRef] [PubMed]
- Simão, F.; Ferreira, A.P.; Vullo, C.; Xavier, C.; Huber, G.; Quiroz, A.; Machado, P.; Velázquez, V.; Carvalho, E.F.; de Gusmão, L.; et al. Paraguay: Unveiling migration patterns with ancestry genetic markers. Forensic Sci. Int. Genet. Suppl. Ser. 2017, 6, e226–e228. [Google Scholar] [CrossRef]
- Simão, F.; Strobl, C.; Vullo, C.; Catelli, L.; Machado, P.; Huber, N.; Schnaller, L.; Huber, G.; Xavier, C.; Carvalho, E.F.; et al. The maternal inheritance of Alto Paraná revealed by full mitogenome sequences. Forensic Sci. Int. Genet. 2019, 39, 66–72. [Google Scholar] [CrossRef]
- Helsinki Declaration of the World Medical Association. Available online: https://www.wma.net/what-we-do/medical-ethics/declaration-of-helsinki (accessed on 14 January 2019).
- Walsh, P.S.; Metzger, D.A.; Higushi, R. Chelex 100 as a medium for simple extraction of DNA for PCR-based typing from forensic material. Biotechniques 1991, 10, 506–513. [Google Scholar] [CrossRef] [PubMed]
- Pereira, R.; Phillips, C.; Pinto, N.; Santos, C.; dos Santos, S.E.B.; Amorim, A.; Carracedo, Á.; Gusmão, L. Straightforward inference of ancestry and admixture proportions through ancestry-informative insertion deletion multiplexing. PLoS ONE 2012, 7, e29684. [Google Scholar] [CrossRef]
- Y-DNA Haplogroup Predictor NevGen. Available online: http://www.nevgen.org (accessed on 20 February 2020).
- Brion, M.; Sobrino, B.; Blanco-Verea, A.; Lareu, M.V.; Carracedo, A. Hierarchical analysis of 30 Y-chromosome SNPs in European populations. Int. J. Legal Med. 2005, 119, 10–15. [Google Scholar] [CrossRef] [PubMed]
- Gomes, V.; Sánchez-Diz, P.; Amorim, A.; Carracedo, Á.; Gusmão, L. Digging deeper into East African human Y chromosome lineages. Hum. Genet. 2010, 127, 603–613. [Google Scholar] [CrossRef]
- Resque, R.; Gusmão, L.; Geppert, M.; Roewer, L.; Palha, T.; Alvarez, L.; Ribeiro-Dos-santos, Â.; Santos, S. Male lineages in Brazil: Intercontinental admixture and stratification of the European background. PLoS ONE 2016, 11, e0152573. [Google Scholar] [CrossRef]
- Aragão, G. Characterization of Male Lineages in the Asháninka from Peru; Universidade do Porto: Porto, Portugal, 2018. [Google Scholar]
- Strobl, C.; Churchill Cihlar, J.; Lagacé, R.; Wootton, S.; Roth, C.; Huber, N.; Schnaller, L.; Zimmermann, B.; Huber, G.; Lay Hong, S.; et al. Evaluation of mitogenome sequence concordance, heteroplasmy detection, and haplogrouping in a worldwide lineage study using the Precision ID mtDNA Whole Genome Panel. Forensic Sci. Int. Genet. 2019, 42, 244–251. [Google Scholar] [CrossRef] [PubMed]
- Simão, F.; Ferreira, A.P.; de Carvalho, E.F.; Parson, W.; Gusmão, L. Defining mtDNA origins and population stratification in Rio de Janeiro. Forensic Sci. Int. Genet. 2018, 34, 97–104. [Google Scholar] [CrossRef] [PubMed]
- van Oven, M.; Kayser, M. Updated comprehensive phylogenetic tree of global human mitochondrial DNA variation. Hum. Mutat. 2009, 30, E386–E394. [Google Scholar] [CrossRef] [PubMed]
- Pritchard, J.K.; Stephens, M.; Donnelly, P. Inference of population structure using multilocus genotype data. Genetics 2000, 155, 945–959. [Google Scholar] [CrossRef]
- Ossa, H.; Aquino, J.; Pereira, R.; Ibarra, A.; Ossa, R.H.; Pérez, L.A.; Granda, J.D.; Lattig, M.C.; Groot, H.; De Carvalho, E.F.; et al. Outlining the ancestry landscape of Colombian admixed populations. PLoS ONE 2016, 11, e0164414. [Google Scholar] [CrossRef]
- Saloum de Neves Manta, F.; Pereira, R.; Vianna, R.; Rodolfo Beuttenmüller de Araújo, A.; Leite Góes Gitaí, D.; Aparecida da Silva, D.; de Vargas Wolfgramm, E.; da Mota Pontes, I.; Ivan Aguiar, J.; Ozório Moraes, M.; et al. Revisiting the genetic ancestry of Brazilians using autosomal AIM-Indels. PLoS ONE 2013, 8, e75145. [Google Scholar] [CrossRef]
- Xavier, C.; Builes, J.J.; Gomes, V.; Ospino, J.M.; Aquino, J.; Parson, W.; Amorim, A.; Gusmão, L.; Goios, A. Admixture and genetic diversity distribution patterns of non-recombining lineages of native american ancestry in colombian populations. PLoS ONE 2015, 10, e0120155. [Google Scholar] [CrossRef]
- Sanchez, I.; Mendoza, L.; Rincón, A.L.; Aguirre, D.P.; Builes, J.J. Ancestry evaluation in a population sample of the Tunja city, Department of Boyacá Colombia. Forensic Sci. Int. Genet. Suppl. Ser. 2019, 7, 695–697. [Google Scholar] [CrossRef]
- Martínez, B.; Builes, J.J.; Aguirre, D.; Mendoza, L.; Afanador, C.H.; Meza, C.; Marrugo, J. Ancestry background of a population sample from Bolivar Department, Colombia. Forensic Sci. Int. Genet. Suppl. Ser. 2015, 5, e170–e171. [Google Scholar] [CrossRef]
- Zambrano, A.K.; Gaviria, A.; Cobos-Navarrete, S.; Gruezo, C.; Rodríguez-Pollit, C.; Armendáriz-Castillo, I.; García-Cárdenas, J.M.; Guerrero, S.; López-Cortés, A.; Leone, P.E.; et al. The three-hybrid genetic composition of an Ecuadorian population using AIMs-InDels compared with autosomes, mitochondrial DNA and Y chromosome data. Sci. Rep. 2019, 9, 1–8. [Google Scholar] [CrossRef]
- Zambrano, A.K.; Gaviria, A.; Vela, M.; Cobos, S.; Leone, P.E.; Gruezo, C.; Fiallo, G.; García-Cárdenas, J.M.; López-Cortés, A.; Cabrera-Andrade, A.; et al. Ancestry characterization of Ecuador’s Highland mestizo population using autosomal AIM-INDELs. Forensic Sci. Int. Genet. Suppl. Ser. 2017, 6, e477–e478. [Google Scholar] [CrossRef][Green Version]
- Toscanini, U.; Gusmão, L.; Berardi, G.; Gómez, A.; Pereira, R.; Raimondi, E. Ancestry proportions in urban populations of Argentina. Forensic Sci. Int. Genet. Suppl. Ser. 2011, 3, 387–388. [Google Scholar] [CrossRef]
- Parolin, M.L.; Toscanini, U.F.; Velázquez, I.F.; Llull, C.; Berardi, G.L.; Holley, A.; Tamburrini, C.; Avena, S.; Carnese, F.R.; Lanata, J.L.; et al. Genetic admixture patterns in Argentinian Patagonia. PLoS ONE 2019, 14, e0214830. [Google Scholar] [CrossRef] [PubMed]
- Heinz, T.; Álvarez-Iglesias, V.; Pardo-Seco, J.; Taboada-Echalar, P.; Gómez-Carballa, A.; Torres-Balanza, A.; Rocabado, O.; Carracedo, Á.; Vullo, C.; Salas, A. Ancestry analysis reveals a predominant Native American component with moderate European admixture in Bolivians. Forensic Sci. Int. Genet. 2013, 7, 537–542. [Google Scholar] [CrossRef] [PubMed]
- Taboada-Echalar, P.; Alvarez-Iglesias1, V.; Heinz, T.; Vidal-Bralo, L.; Gomez-Carballa, A.; Catelli, L.; Pardo-Seco, J.; Pastoriza, A.; Carracedo, A.; Torres-Balanza, A.; et al. The Genetic Legacy of the Pre-Colonial Period in Contemporary Bolivians. PLoS ONE 2013, 8, e58980. [Google Scholar] [CrossRef]
- Verdugo, R.A.; Di Genova, A.; Herrera, L.; Moraga, M.; Acuña, M.; Berríos, S.; Llop, E.; Valenzuela, C.Y.; Bustamante, M.L.; Digman, D.; et al. Development of a small panel of SNPs to infer ancestry in Chileans that distinguishes Aymara and Mapuche components. Biol. Res. 2020, 53, 1–11. [Google Scholar] [CrossRef]
- Gontijo, C.C. Estrutura e Ancestralidade Genética de Populações Afro-Derivadas Brasileiras. 2019. Available online: https://repositorio.unb.br/handle/10482/37322 (accessed on 20 February 2020).
- da Veiga Borges Leal, D.F.; Santana da Silva, M.N.; de Oliveira Fernandes, D.C.R.; Gomes Rodrigues, J.C.; da Costa Barros, M.C.; do Carmo Pinto, P.D.; Pastana, L.F.; da Silva, C.A.; Fernandes, M.R.; de Assumpção, P.P.; et al. Amerindian genetic ancestry as a risk factor for tuberculosis in an amazonian population. PLoS ONE 2020, 15, e0236033. [Google Scholar] [CrossRef]
- Martins, S.; Simão, F.; Pinheiro, L.M.L.; Nguidi, M.; Deccache, L.; Gusmão, L.; Carvalho, E.F. Genetic characterization and ancestry of the admixed population of Marajó Island, northern of Brazil, with autosomal and lineage markers. Forensic Sci. Int. Genet. Suppl. Ser. 2019, 7, 313–314. [Google Scholar] [CrossRef]
- Magalhães Da Silva, T.; Sandhya Rani, M.R.; De Oliveira Costa, G.N.; Figueiredo, M.A.; Melo, P.S.; Nascimento, J.F.; Molyneaux, N.D.; Barreto, M.L.; Reis, M.G.; Teixeira, M.G.; et al. The correlation between ancestry and color in two cities of Northeast Brazil with contrasting ethnic compositions. Eur. J. Hum. Genet. 2015, 23, 984–989. [Google Scholar] [CrossRef]
- Chacón-Duque, J.C.; Adhikari, K.; Fuentes-Guajardo, M.; Mendoza-Revilla, J.; Acuña-Alonzo, V.; Barquera, R.; Quinto-Sánchez, M.; Gómez-Valdés, J.; Everardo Martínez, P.; Villamil-Ramírez, H.; et al. Latin Americans show wide-spread Converso ancestry and imprint of local Native ancestry on physical appearance. Nat. Commun. 2018, 9, 1–13. [Google Scholar] [CrossRef]
- Mogollón Olivares, F.; Moncada Madero, J.; Casas-Vargas, A.; Zea Montoya, S.; Suárez Medellín, D.; Gusmão, L.; Usaquén, W. Contrasting the ancestry patterns of three distinct population groups from the northernmost region of South America. Am. J. Phys. Anthropol. 2020, 173, 437–447. [Google Scholar] [CrossRef]
- Urbano, L.; Portilla, E.C.; Muñoz, W.; Sierra-Torres, C.H.; Bolaños, H.; Arboleda, Y.; Aguirre, D.P.; Mendoza, L.; Carmona, V.; Afanador, C.H.; et al. Ancestral genetic composition in a population of South Western Colombian using autosomal AIM-INDELS. Forensic Sci. Int. Genet. Suppl. Ser. 2015, 5, e189–e190. [Google Scholar] [CrossRef]
- Garavito, G.; Martinez, B.; Builes, J.J.; Aguirre, D.; Mendoza, L.; Afanador, C.H.; Egea, E.; Marrugo, J. Indels markers set and ancestry estimates in a population sample from Atlantic Department of Colombia. Forensic Sci. Int. Genet. Suppl. Ser. 2015, 5, e177–e178. [Google Scholar] [CrossRef]
- Excoffier, L.; Laval, G.; Schneider, S. Arlequin (version 3.0); an integrated software package for population genetics data analysis. Evol Bionform Online 2005, 1, 47–50. [Google Scholar] [CrossRef]
- Weir, B.S.; Cockerham, C.C. Estimating F-Statistics for the Analysis of Population Structure. Evolution (N. Y.) 1984, 38, 1358–1370. [Google Scholar]
- Adams, S.M.; Bosch, E.; Balaresque, P.L.; Ballereau, S.J.; Lee, A.C.; Arroyo, E.; López-Parra, A.M.; Aler, M.; Grifo, M.S.G.; Brion, M.; et al. The Genetic Legacy of Religious Diversity and Intolerance: Paternal Lineages of Christians, Jews, and Muslims in the Iberian Peninsula. Am. J. Hum. Genet. 2008, 83, 725–736. [Google Scholar] [CrossRef]
- Beleza, S.; Gusmão, L.; Lopes, A.; Alves, C.; Gomes, I.; Giouzeli, M.; Calafell, F.; Carracedo, A.; Amorim, A. Micro-Phylogeographic and Demographic History of Portuguese Male Lineages. Ann. Hum. Genet. 2006, 70, 181–194. [Google Scholar] [CrossRef]
- Boattini, A.; Martinez-Cruz, B.; Sarno, S.; Harmant, C.; Useli, A.; Sanz, P.; Yang-Yao, D.; Manry, J.; Ciani, G.; Luiselli, D.; et al. Uniparental Markers in Italy Reveal a Sex-Biased Genetic Structure and Different Historical Strata. PLoS ONE 2013, 8, e65441. [Google Scholar] [CrossRef]
- Cinnioǧlu, C.; King, R.; Kivisild, T.; Kalfoǧlu, E.; Atasoy, S.; Cavalleri, G.L.; Lillie, A.S.; Roseman, C.C.; Lin, A.A.; Prince, K.; et al. Excavating Y-chromosome haplotype strata in Anatolia. Hum. Genet. 2004, 114, 127–148. [Google Scholar] [CrossRef]
- Hernández, C.L.; Dugoujon, J.M.; Sánchez-Martínez, L.J.; Cuesta, P.; Novelletto, A.; Calderón, R. Paternal lineages in southern Iberia provide time frames for gene flow from mainland Europe and the Mediterranean world. Ann. Hum. Biol. 2019, 46, 63–76. [Google Scholar] [CrossRef]
- Ramos-Luis, E.; Blanco-Verea, A.; Brión, M.; Van Huffel, V.; Sánchez-Diz, P.; Carracedo, A. Y-chromosomal DNA analysis in French male lineages. Forensic Sci. Int. Genet. 2014, 9, 162–168. [Google Scholar] [CrossRef]
- Rȩbała, K.; Martínez-Cruz, B.; Tönjes, A.; Kovacs, P.; Stumvoll, M.; Lindner, I.; Büttner, A.; Wichmann, H.E.; Siváková, D.; Soták, M.; et al. Contemporary paternal genetic landscape of Polish and German populations: From early medieval Slavic expansion to post-World War II resettlements. Eur. J. Hum. Genet. 2013, 21, 415–422. [Google Scholar] [CrossRef] [PubMed]
- Zalloua, P.A.; Xue, Y.; Khalife, J.; Makhoul, N.; Debiane, L.; Platt, D.E.; Royyuru, A.K.; Herrera, R.J.; Hernanz, D.F.S.; Blue-Smith, J.; et al. Y-Chromosomal Diversity in Lebanon Is Structured by Recent Historical Events. Am. J. Hum. Genet. 2008, 82, 873–882. [Google Scholar] [CrossRef]
- Myres, N.M.; Rootsi, S.; Lin, A.A.; Järve, M.; King, R.J.; Kutuev, I.; Cabrera, V.M.; Khusnutdinova, E.K.; Pshenichnov, A.; Yunusbayev, B.; et al. A major Y-chromosome haplogroup R1b Holocene era founder effect in Central and Western Europe. Eur. J. Hum. Genet. 2011, 19, 95–101. [Google Scholar] [CrossRef] [PubMed]
- Castro de Guerra, D.; Figuera Pérez, C.; Bravi, C.M.; Saunier, J.; Scheible, M.; Irwin, J.; Coble, M.D.; Rodríguez-Larralde, A. Sequence variation of mitochondrial DNA control region in North Central Venezuela. Forensic Sci. Int. Genet. 2012, 6, e131–e133. [Google Scholar] [CrossRef]
- Pauro, M.; García, A.; Nores, R.; Demarchi, D.A. Analysis of uniparental lineages in two villages of Santiago del Estero, Argentina, seat of pueblos de indios in colonial times. Hum. Biol. 2013, 85, 699–719. [Google Scholar] [CrossRef] [PubMed]
- Corach, D.; Lao, O.; Bobillo, C.; van Der Gaag, K.; Zuniga, S.; Vermeulen, M.; van Duijn, K.; Goedbloed, M.; Vallone, P.M.; Parson, W.; et al. Inferring continental ancestry of argentineans from autosomal, Y-chromosomal and mitochondrial DNA. Ann. Hum. Genet. 2010, 74, 65–76. [Google Scholar] [CrossRef]
- Freitas, J.M.; Fassio, L.H.; Braganholi, D.F.; Chemale, G. Mitochondrial DNA control region haplotypes and haplogroup diversity in a sample from Brasília, Federal District, Brazil. Forensic Sci. Int. Genet. 2019, 40, e228–e230. [Google Scholar] [CrossRef]
- dos Reis, R.S.; Simão, F.; dos Santos Stange, V.; Garcia, F.M.; Spinassé Dettogni, R.; Stur, E.; da Silva, A.M.Á.; de Carvalho, E.F.; Gusmão, L.; Drumond Louro, I. A view of the maternal inheritance of Espírito Santo populations: The contrast between the admixed and Pomeranian descent groups. Forensic Sci. Int. Genet. 2019, 40, 175–181. [Google Scholar] [CrossRef]
- Palencia, L.; Valverde, L.; Álvarez, A.; Cainé, L.M.; Cardoso, S.; Alfonso-Sánchez, M.A.; Pinheiro, M.F.; De Pancorbo, M.M. Mitochondrial DNA diversity in a population from Santa Catarina (Brazil): Predominance of the European input. Int. J. Legal Med. 2010, 124, 331–336. [Google Scholar] [CrossRef]
- Auton, A.; Abecasis, G.R.; Altshuler, D.M.; Durbin, R.M.; Bentley, D.R.; Chakravarti, A.; Clark, A.G.; Donnelly, P.; Eichler, E.E.; Flicek, P.; et al. A global reference for human genetic variation. Nature 2015, 526, 68–74. [Google Scholar] [CrossRef]
- Baeta, M.; Núñez, C.; Sosa, C.; Bolea, M.; Casalod, Y.; González-Andrade, F.; Roewer, L.; Martínez-Jarreta, B. Mitochondrial diversity in Amerindian Kichwa and Mestizo populations from Ecuador. Int. J. Legal Med. 2012, 126, 299–302. [Google Scholar] [CrossRef] [PubMed]
- Brandini, S.; Bergamaschi, P.; Fernando Cerna, M.; Gandini, F.; Bastaroli, F.; Bertolini, E.; Cereda, C.; Ferretti, L.; Gómez-Carballa, A.; Battaglia, V.; et al. The Paleo-Indian entry into South America according to mitogenomes. Mol. Biol. Evol. 2018, 35, 299–311. [Google Scholar] [CrossRef]
- Alvarez-Iglesias, V.; Jaime, J.C.; Carracedo, A. Salas, a Coding region mitochondrial DNA SNPs: Targeting East Asian and Native American haplogroups. Forensic Sci. Int. Genet. 2007, 1, 44–55. [Google Scholar] [CrossRef] [PubMed]
- Sala, A.; Caputo, M.; Ginart, S.; Theiler, G.; Parolin, M.L.; Carnese, R.F.; Fainboim, L.; Corach, D. Historical records under the genetic evidence: “Chiriguano” tribe genesis as a test case. Mol. Biol. Rep. 2018, 45, 987–1000. [Google Scholar] [CrossRef] [PubMed]
- Sala, A.; Caputo, M.; Corach, D. Genetic structure of Mataco-Guaycurú speakers from Argentina and the extent of their genetic admixture with neighbouring urban populations. Sci. Rep. 2019, 9, 1–13. [Google Scholar] [CrossRef]
- Ramallo, V.; Bisso-Machado, R.; Bravi, C.; Coble, M.D.; Salzano, F.M.; Hünemeier, T.; Bortolini, M.C. Demographic expansions in South America: Enlightening a complex scenario with genetic and linguistic data. Am. J. Phys. Anthropol. 2013, 150, 453–463. [Google Scholar] [CrossRef]
- Arias, L.; Barbieri, C.; Barreto, G.; Stoneking, M.; Pakendorf, B. High-resolution mitochondrial DNA analysis sheds light on human diversity, cultural interactions, and population mobility in Northwestern Amazonia. Am. J. Phys. Anthropol. 2018, 165, 238–255. [Google Scholar] [CrossRef]
- Sandoval, J.R.; Lacerda, D.R.; Acosta, O.; Jota, M.S.; Robles-Ruiz, P.; Salazar-Granara, A.; Vieira, P.P.R.; Paz-y-Miño, C.; Fujita, R.; Santos, F.R.; et al. The Genetic History of Peruvian Quechua-Lamistas and Chankas: Uniparental DNA Patterns among Autochthonous Amazonian and Andean Populations. Ann. Hum. Genet. 2016, 80, 88–101. [Google Scholar] [CrossRef]
- Gómez-Carballa, A.; Moreno, F.; Álvarez-Iglesias, V.; Martinón-Torres, F.; García-Magariños, M.; Pantoja-Astudillo, J.A.; Aguirre-Morales, E.; Bustos, P.; Salas, A. Revealing latitudinal patterns of mitochondrial DNA diversity in Chileans. Forensic Sci. Int. Genet. 2016, 20, 81–88. [Google Scholar] [CrossRef]
- Jannuzzi, J.; Ribeiro, J.; Alho, C.; de Oliveira Lázaro e Arão, G.; Cicarelli, R.; Simões Dutra Corrêa, H.; Ferreira, S.; Fridman, C.; Gomes, V.; Loiola, S.; et al. Male lineages in Brazilian populations and performance of haplogroup prediction tools. Forensic Sci. Int. Genet. 2020, 44, 102163. [Google Scholar] [CrossRef] [PubMed]
- Oliveira, A.M.; Domingues, P.M.; Gomes, V.; Amorim, A.; Jannuzzi, J.; De Carvalho, E.F.; Gusmo, L. Male lineage strata of Brazilian population disclosed by the simultaneous analysis of STRs and SNPs. Forensic Sci. Int. Genet. 2014, 13, 264–268. [Google Scholar] [CrossRef] [PubMed]
- Prieto, L.; Zimmermann, B.; Goios, A.; Rodriguez-Monge, A.; Paneto, G.G.; Alves, C.; Alonso, A.; Fridman, C.; Cardoso, S.; Lima, G.; et al. The GHEP-EMPOP collaboration on mtDNA population data A new resource for forensic casework. Forensic Sci. Int. Genet. 2011, 5, 146–151. [Google Scholar] [CrossRef] [PubMed]
- Rojas, W.; Parra, M.V.; Campo, O.; Caro, M.A.; Lopera, J.G.; Arias, W.; Duque, C.; Naranjo, A.; García, J.; Vergara, C.; et al. Genetic make up and structure of Colombian populations by means of uniparental and biparental DNA markers. Am. J. Phys. Anthropol. 2010, 143, 13–20. [Google Scholar] [CrossRef]
- Schaan, A.P.; Costa, L.; Santos, D.; Modesto, A.; Amador, M.; Lopes, C.; Rabenhorst, S.H.; Montenegro, R.; Souza, B.D.A.; Lopes, T.; et al. MtDNA structure: The women who formed the Brazilian Northeast. BMC Evol. Biol. 2017, 17, 1–12. [Google Scholar] [CrossRef]
- Schaan, A.P.; Gusmaõ, L.; Jannuzzi, J.; Modesto, A.; Amador, M.; Marques, D.; Rabenhorst, S.H.; Montenegro, R.; Lopes, T.; Yoshioka, F.K.; et al. New insights on intercontinental origins of paternal lineages in Northeast Brazil. BMC Evol. Biol. 2020, 20, 1–9. [Google Scholar] [CrossRef]
- Toscanini, U.; Brisighelli, F.; Moreno, F.; Pantoja-Astudillo, J.A.; Morales, E.A.; Bustos, P.; Pardo-Seco, J.; Salas, A. Analysis of Y-chromosome STRs in Chile confirms an extensive introgression of European male lineages in urban populations. Forensic Sci. Int. Genet. 2016, 21, 76–80. [Google Scholar] [CrossRef] [PubMed]
- Toscanini, U.; Gaviria, A.; Pardo-Seco, J.; Gómez-Carballa, A.; Moscoso, F.; Vela, M.; Cobos, S.; Lupero, A.; Zambrano, A.K.; Martinón-Torres, F.; et al. The geographic mosaic of Ecuadorian Y-chromosome ancestry. Forensic Sci. Int. Genet. 2018, 33, 59–65. [Google Scholar] [CrossRef]
- Yunis, J.J.; Yunis, E.J. Mitochondrial DNA (mtDNA) haplogroups in 1526 unrelated individuals from 11 Departments of Colombia. Genet. Mol. Biol. 2013, 36, 329–335. [Google Scholar] [CrossRef] [PubMed]
- Vullo, C.; Gomes, V.; Romanini, C.; Oliveira, A.M.; Rocabado, O.; Aquino, J.; Amorim, A.; Gusmão, L. Association between Y haplogroups and autosomal AIMs reveals intra-population substructure in Bolivian populations. Int. J. Legal Med. 2015, 129, 673–680. [Google Scholar] [CrossRef]
- Acosta, M.A.; Blanco-Verea, A.; Lareu, M.V.; Brion, M.; Carracedo, A. The genetic male component of two South-Western Colombian populations. Forensic Sci. Int. Genet. 2009, 3, 2008–2010. [Google Scholar] [CrossRef]
- Afonso Costa, H.; Carvalho, M.; Lopes, V.; Balsa, F.; Bento, A.M.; Serra, A.; Andrade, L.; Anjos, M.J.; Vide, M.C.; Pantoja, S.; et al. Mitochondrial DNA sequence analysis of a native Bolivian population. J. Forensic Leg. Med. 2010, 17, 247–253. [Google Scholar] [CrossRef] [PubMed]
- Alonso Morales, L.A.; Casas-Vargas, A.; Castro, M.R.; Resque, R.; Ribeiro-dos-Santos, Â.K.; Santos, S.; Gusmão, L.; Usaquén, W. Paternal portrait of populations of the middle magdalena river region (tolima and huila, Colombia): New insights on the peopling of central America and northernmost South America. PLoS ONE 2018, 13, e0207130. [Google Scholar] [CrossRef]
- de Azevedo, D.A.; da Silva, L.A.F.; Gusmão, L.; de Carvalho, E.F. Analysis of Y chromosome SNPs in Alagoas, Northeastern Brazil. Forensic Sci. Int. Genet. Suppl. Ser. 2009, 2, 421–422. [Google Scholar] [CrossRef]
- Barbosa, A.B.G.; Silva, L.A.F.D.; Azevedo, D.A.; Balbino, V.Q.; Mauricio-Da-Silva, L. Mitochondrial DNA control region polymorphism in the population of Alagoas State, North-Eastern Brazil. J. Forensic Sci. 2008, 53, 142–146. [Google Scholar] [CrossRef]
- Bobillo, M.C.; Zimmermann, B.; Sala, A.; Huber, G.; Röck, A.; Bandelt, H.; Corach, D.; Parson, W. Amerindian mitochondrial DNA haplogroups predominate in the population of Argentina: Towards a first nationwide forensic mitochondrial DNA sequence database. Int. J. Leg. Med. 2010, 124, 263–268. [Google Scholar] [CrossRef]
- Catelli, M.L.; Álvarez-Iglesias, V.; Gómez-Carballa, A.; Mosquera-Miguel, A.; Romanini, C.; Borosky, A.; Amigo, J.; Carracedo, Á.; Vullo, C.; Salas, A. The impact of modern migrations on present-day multi-ethnic Argentina as recorded on the mitochondrial DNA genome. BMC Genet. 2011, 12, 1–13. [Google Scholar] [CrossRef]
- Criollo-Rayo, A.A.; Bohórquez, M.; Prieto, R.; Howarth, K.; Culma, C.; Carracedo, A.; Tomlinson, I.; Echeverry de Polnaco, M.M.; Carvajal Carmona, L.G. Native American gene continuity to the modern admixed population from the Colombian Andes: Implication for biomedical, population and forensic studies. Forensic Sci. Int. Genet. 2018, 36, e1–e7. [Google Scholar] [CrossRef]
- Figueiredo, R.; Ambrosio, I.B.; Braganholi, D.F.; Chemale, G.; Martins, J.A.; Gomes, V.; Gusmão, L.; Cicarelli, R.M.B. Male-specific contributions to the Brazilian population of Espirito Santo. Int. J. Legal Med. 2016, 130, 679–681. [Google Scholar] [CrossRef]
- Hong, S.B.; Kim, K.C.; Kim, W. Population and forensic genetic analyses of mitochondrial DNA control region variation from six major provinces in the Korean population. Forensic Sci. Int. Genet. 2015, 17, 99–103. [Google Scholar] [CrossRef]
- Pena, S.D.J.; Santos, F.R.; Tarazona-Santos, E. Genetic admixture in Brazil. Am. J. Med. Genet. Part C Semin. Med. Genet. 2020, 184, 928–938. [Google Scholar] [CrossRef]
- Rothhammer, F.; Fehren-Schmitz, L.; Puddu, G.; Capriles, J. Mitochondrial DNA haplogroup variation of contemporary mixed South Americans reveals prehistoric displacements linked to archaeologically-derived culture history. Am. J. Hum. Biol. 2017, 29, 1–10. [Google Scholar] [CrossRef] [PubMed]
- Alves-silva, J.; Santos, S.; Guimara, P.E.M.; Ferreira, A.C.S. The Ancestry of Brazilian mtDNA Lineages. Am. J. Hum. Genet. 2000, 67, 444–461. [Google Scholar] [CrossRef] [PubMed]
- Neves, W.A.; Bernardo, D.V.; Okumura, M.; De Almeida, T.F.; Strauss, A.M. Origin and dispersion of the Tupiguarani: What does cranial morphology say? Bol. do Mus. Para. Emilio Goeldi Ciencias Humanas 2011, 6, 95–122. [Google Scholar] [CrossRef]
- Barbieri, C.; Sandoval, J.R.; Valqui, J.; Shimelman, A.; Ziemendorff, S.; Schröder, R.; Geppert, M.; Roewer, L.; Gray, R.; Stoneking, M.; et al. Enclaves of genetic diversity resisted Inca impacts on population history. Sci. Rep. 2017, 7, 1–12. [Google Scholar] [CrossRef] [PubMed]
- Solé-Morata, N.; Villaescusa, P.; García-Fernández, C.; Font-Porterias, N.; Illescas, M.J.; Valverde, L.; Tassi, F.; Ghirotto, S.; Férec, C.; Rouault, K.; et al. Analysis of the R1b-DF27 haplogroup shows that a large fraction of Iberian Y-chromosome lineages originated recently in situ. Sci. Rep. 2017, 7, 1–13. [Google Scholar] [CrossRef]
- Gnecchi-Ruscone, G.A.; Sarno, S.; De Fanti, S.; Gianvincenzo, L.; Giuliani, C.; Boattini, A.; Bortolini, E.; Corcia, T.; Di Mellado, C.S.; Francia, T.J.D.; et al. Dissecting the pre-Columbian genomic ancestry of Native Americans along the Andes–Amazonia divide. Mol. Biol. Evol. 2019, 36, 1254–1269. [Google Scholar] [CrossRef]
- Tarazona-Santos, E.; Carvalho-Silva, D.R.; Pettener, D.; Luiselli, D.; De Stefano, G.F.; Labarga, C.M.; Rickards, O.; Tyler-Smith, C.; Pena, S.D.J.; Santos, F.R. Genetic differentiation in South Amerindians is related to environmental and cultural diversity: Evidence from the Y chromosome. Am. J. Hum. Genet. 2001, 68, 1485–1496. [Google Scholar] [CrossRef]


Publisher’s Note: MDPI stays neutral with regard to jurisdictional claims in published maps and institutional affiliations. |
© 2021 by the authors. Licensee MDPI, Basel, Switzerland. This article is an open access article distributed under the terms and conditions of the Creative Commons Attribution (CC BY) license (https://creativecommons.org/licenses/by/4.0/).
Share and Cite
Simão, F.; Ribeiro, J.; Vullo, C.; Catelli, L.; Gomes, V.; Xavier, C.; Huber, G.; Bodner, M.; Quiroz, A.; Ferreira, A.P.; et al. The Ancestry of Eastern Paraguay: A Typical South American Profile with a Unique Pattern of Admixture. Genes 2021, 12, 1788. https://doi.org/10.3390/genes12111788
Simão F, Ribeiro J, Vullo C, Catelli L, Gomes V, Xavier C, Huber G, Bodner M, Quiroz A, Ferreira AP, et al. The Ancestry of Eastern Paraguay: A Typical South American Profile with a Unique Pattern of Admixture. Genes. 2021; 12(11):1788. https://doi.org/10.3390/genes12111788
Chicago/Turabian StyleSimão, Filipa, Julyana Ribeiro, Carlos Vullo, Laura Catelli, Verónica Gomes, Catarina Xavier, Gabriela Huber, Martin Bodner, Alfredo Quiroz, Ana Paula Ferreira, and et al. 2021. "The Ancestry of Eastern Paraguay: A Typical South American Profile with a Unique Pattern of Admixture" Genes 12, no. 11: 1788. https://doi.org/10.3390/genes12111788
APA StyleSimão, F., Ribeiro, J., Vullo, C., Catelli, L., Gomes, V., Xavier, C., Huber, G., Bodner, M., Quiroz, A., Ferreira, A. P., Carvalho, E. F., Parson, W., & Gusmão, L. (2021). The Ancestry of Eastern Paraguay: A Typical South American Profile with a Unique Pattern of Admixture. Genes, 12(11), 1788. https://doi.org/10.3390/genes12111788