
Cross-Amplification in Strigiformes: A New STR Panel for Forensic Purposes

 , ,
, ,  , , ,
, , ,  , and
, and
Abstract
1. Introduction
- To evaluate the reliability of a unique panel of microsatellite loci for several species of Strigiformes;
- To test its use for conservation and forensic purposes;
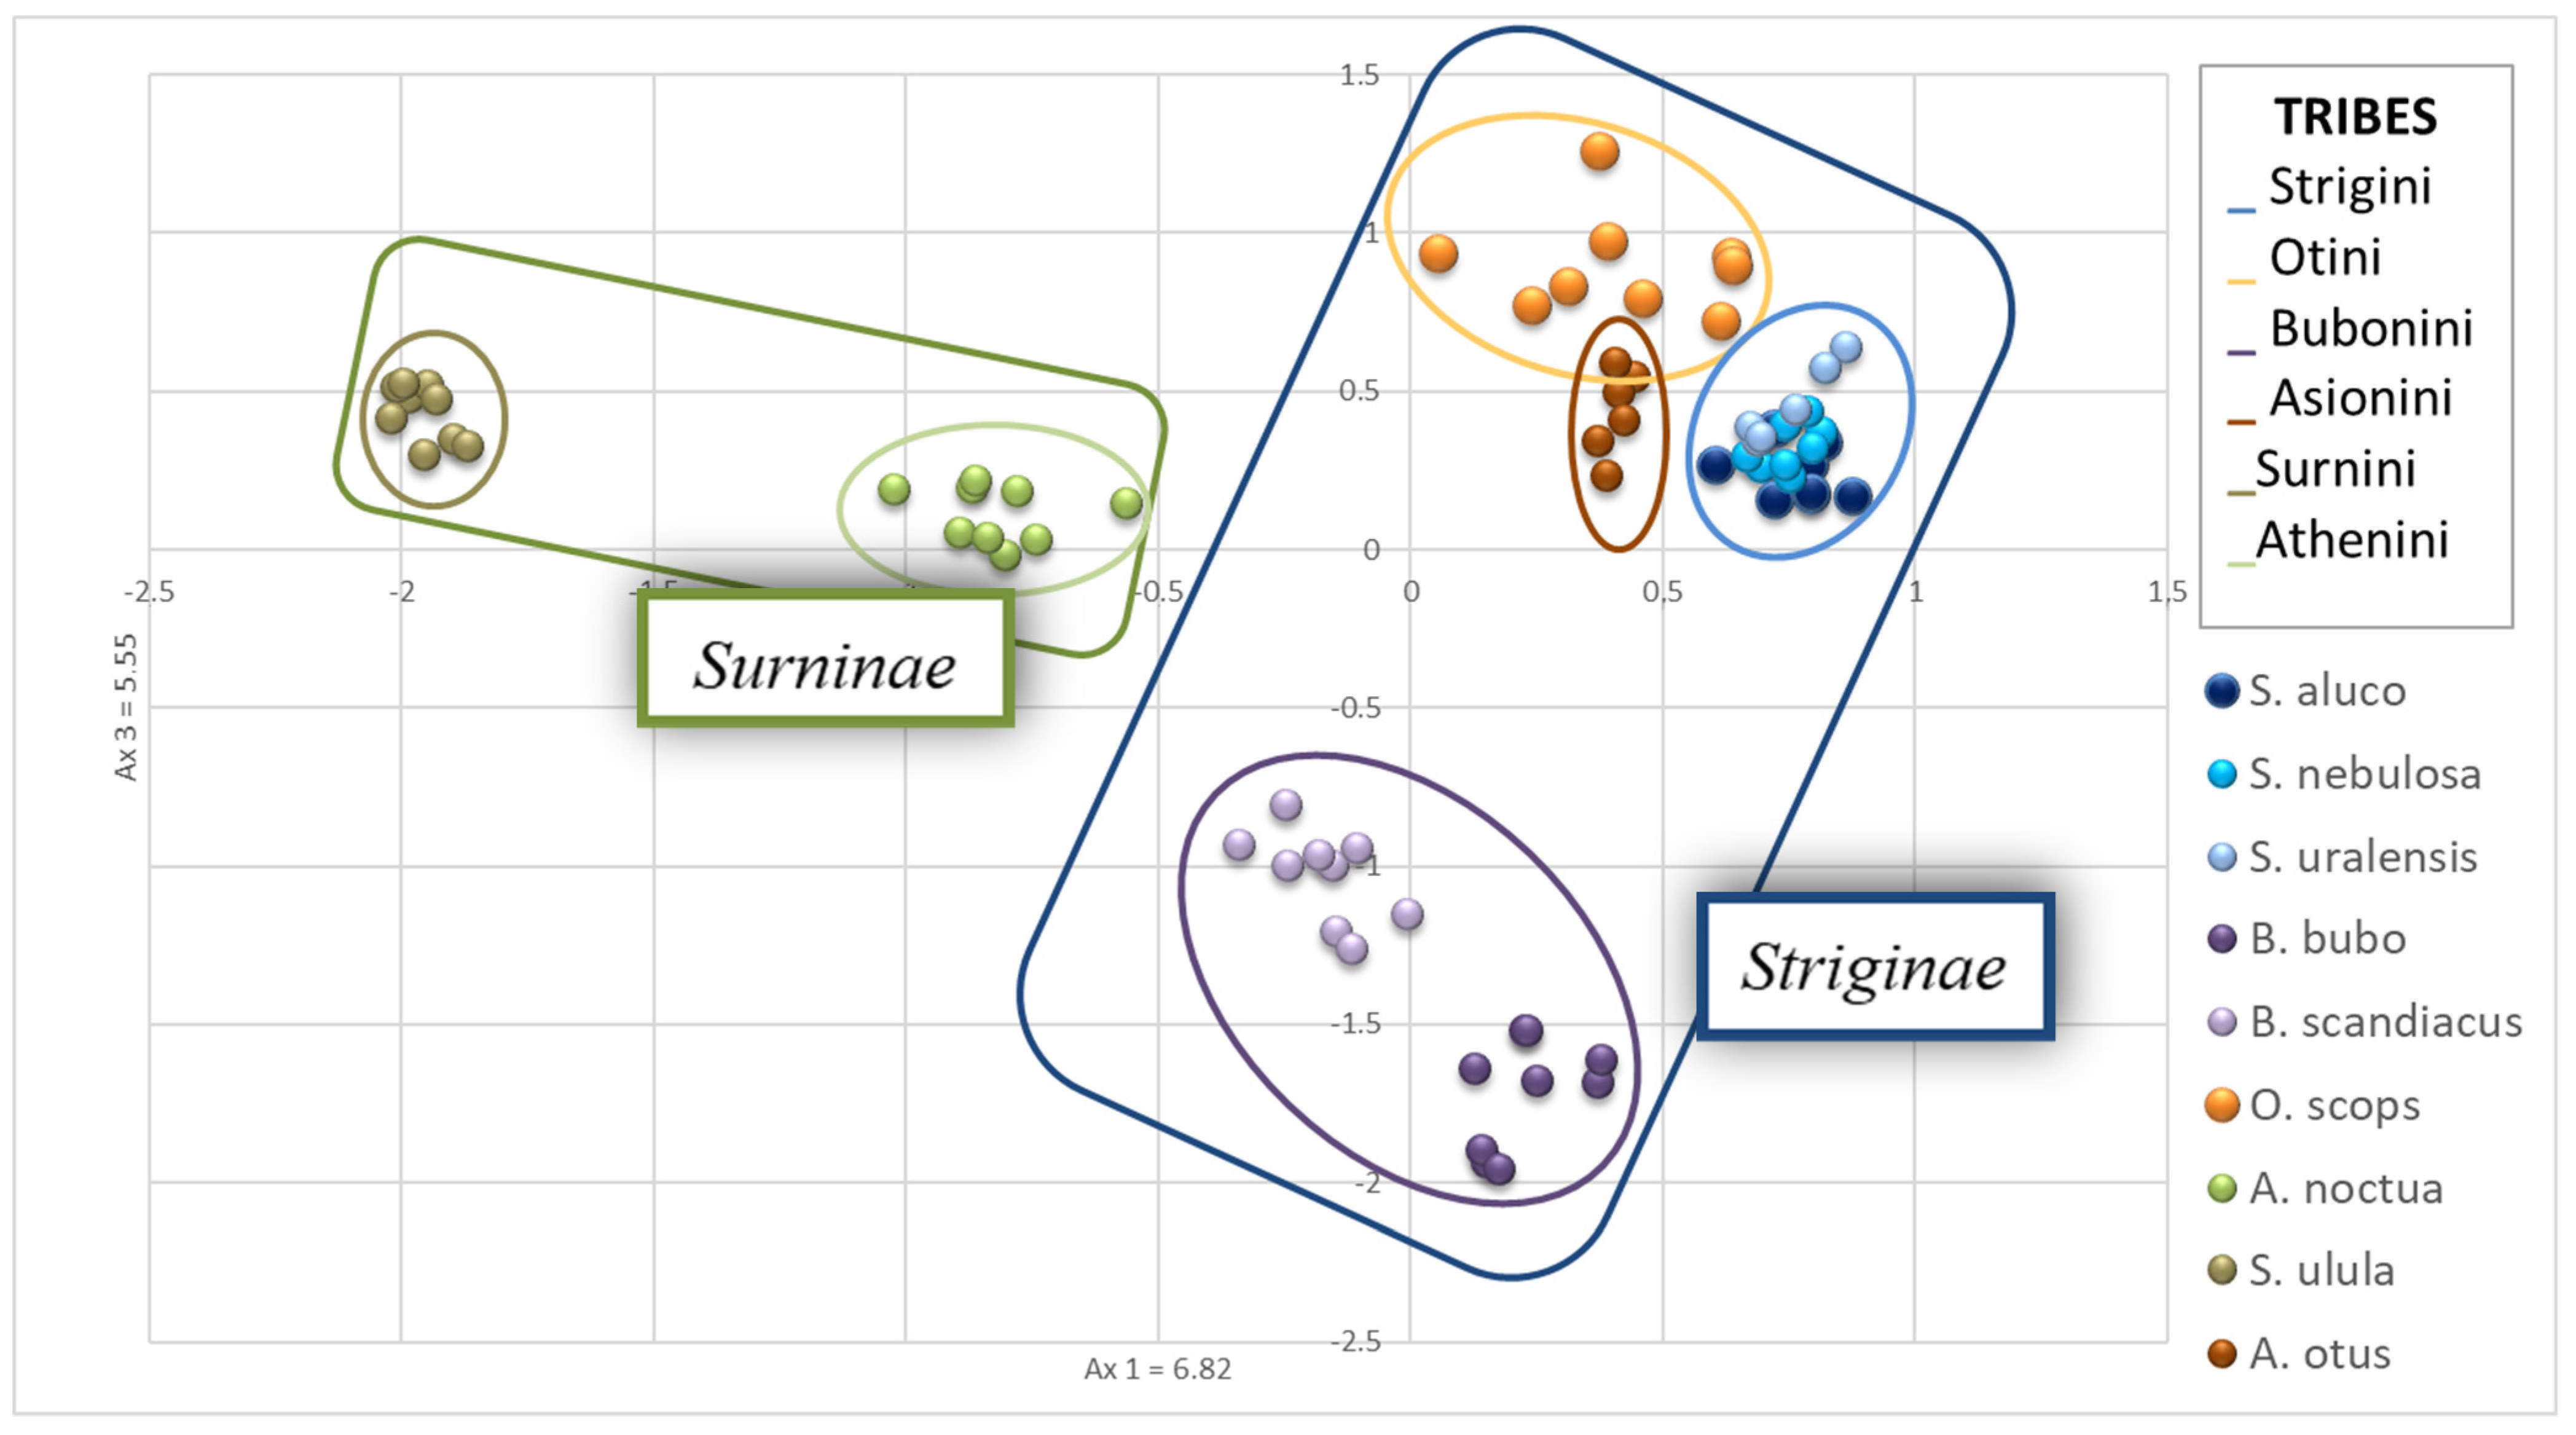
- To assess the use of the panel in confirming phylogenetic relationships among species.
2. Materials and Methods
3. Results
3.1. Preliminary Screening of STR Polymorphic Loci
3.2. Evaluation of the STR Potential in Family Groups
3.3. Evaluation of the STR Potential in Other Subfamilies of Strigidae
3.4. Genetic Variability between and within Species
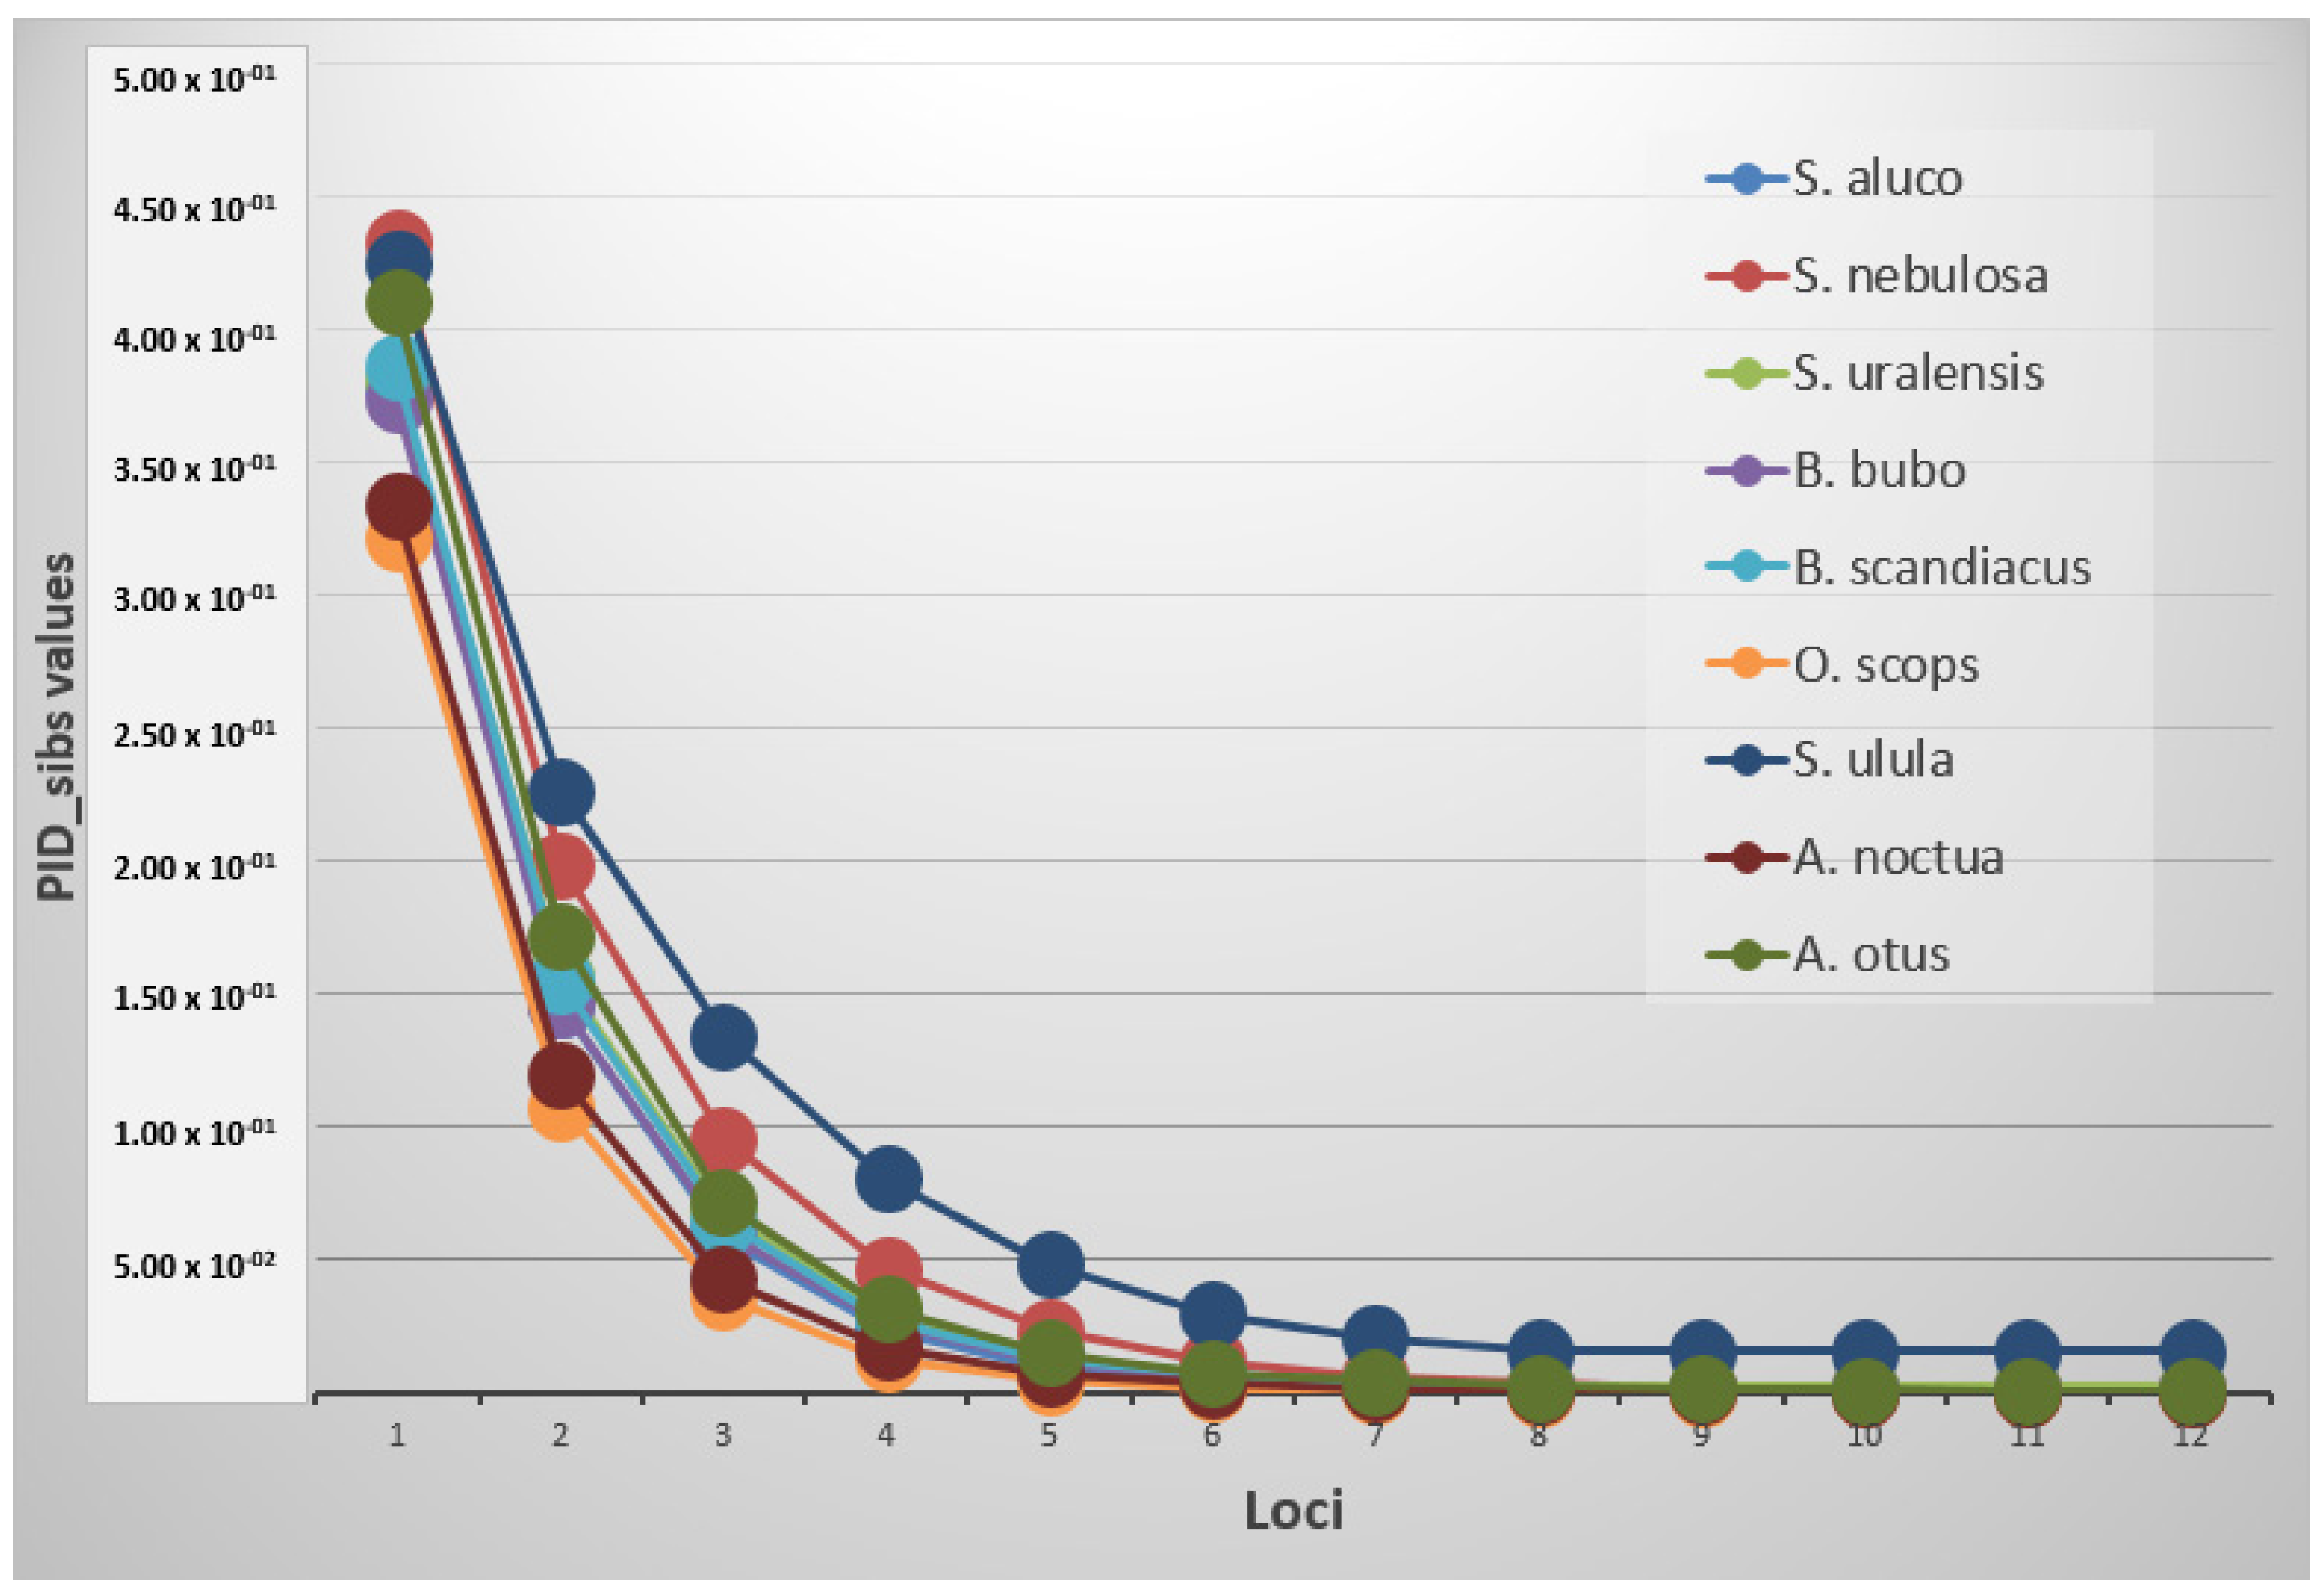
3.5. Evaluation of the STR Potential Panel for Parentage Analysis in Family Groups
4. Discussion
5. Conclusions
Supplementary Materials
Author Contributions
Funding
Institutional Review Board Statement
Informed Consent Statement
Acknowledgments
Conflicts of Interest
References
- Anderson, S.C.; Elsen, P.R.; Hughes, B.B.; Tonietto, R.K.; Bletz, M.C.; Gill, D.A.; Holgerson, M.A.; Kuebbing, S.E.; McDonough MacKenzie, C.; Meek, M.H.; et al. Trends in ecology and conservation over eight decades. Front. Ecol. Environ. 2021, 19, 274–282. [Google Scholar] [CrossRef]
- Bishop, J.M.; Leslie, A.J.; Bourquin, S.L.; O’Ryan, C. Reduced effective population size in an overexploited population of the Nile crocodile (Crocodylus niloticus). Biol. Conserv. 2009, 142, 2335–2341. [Google Scholar] [CrossRef]
- Betancourth-Cundar, M.; Palacios-Rodríguez, P.; Mejía-Vargas, D.; Paz, A.; Amézquita, A. Genetic differentiation and overexploitation history of the critically endangered Lehmann’s Poison Frog: Oophaga lehmanni. Conserv. Genet. 2020, 21, 453–465. [Google Scholar] [CrossRef]
- Righi, T.; Splendiani, A.; Fioravanti, T.; Casoni, E.; Gioacchini, G.; Carnevali, O.; Barucchi, V.C. Loss of mitochondrial genetic diversity in overexploited mediterranean swordfish (Xiphias gladius, 1759) population. Diversity 2020, 12, 170. [Google Scholar] [CrossRef]
- Baker, S.E.; Cain, R.; Kesteren, F.V.; Zommers, Z.A.; D’Cruze, N.; MacDonald, D.W. Rough trade: Animal welfare in the global wildlife trade. BioScience 2013, 63, 928–938. [Google Scholar] [CrossRef]
- Tingley, M.W.; Harris, J.B.C.; Hua, F.; Wilcove, D.S. The pet trade’s role in defaunation. Science 2017, 356, 1–916. [Google Scholar] [CrossRef] [PubMed]
- Panter, C.T.; Atkinson, E.D.; White, R.L. Retraction: Quantifying the global legal trade in live CITES-listed raptors and owls for commercial purposes over a 40-year period. Avocetta 2019, 43, 23–36. [Google Scholar] [CrossRef]
- Vall-Llosera, M.; Su, S. Trends and characteristics of imports of live CITES-listed bird species into Japan. Ibis 2019, 161, 590–604. [Google Scholar] [CrossRef]
- Brochet, A.L.; Van Den Bossche, W.; Jbour, S.; Ndang’Ang’A, P.K.; Jones, V.R.; Abdou, W.A.L.I.; Al-Hmoud, A.R.; Asswad, N.G.; Atienza, J.C.; Atrash, I.; et al. Preliminary assessment of the scope and scale of illegal killing and taking of birds in the Mediterranean. Bird Conserv. Int. 2016, 26, 1–28. [Google Scholar] [CrossRef]
- Domínguez, M.; Tiedemann, R.; Reboreda, J.C.; Segura, L.; Tittarelli, F.; Mahler, B. Genetic structure reveals management units for the yellow cardinal (Gubernatrix cristata), endangered by habitat loss and illegal trapping. Conserv. Genet. 2017, 18, 1131–1140. [Google Scholar] [CrossRef]
- Harris, J.B.C.; Green, J.M.H.; Prawiradilaga, D.M.; Giam, X.; Giyanto; Hikmatullah, D.; Putra, C.A.; Wilcove, D.S. Using market data and expert opinion to identify overexploited species in the wild bird trade. Biol. Conserv. 2015, 187, 51–60. [Google Scholar] [CrossRef]
- Evans, S.R.; Sheldon, B.C. Interspecific patterns of genetic diversity in birds: Correlations with extinction risk. Conserv. Biol. 2008, 22, 1016–1025. [Google Scholar] [CrossRef] [PubMed]
- Enríquez, P.L.; Eisermann, K.; Mikkola, H.; Motta-Junior, J.C. A review of the systematics of Neotropical owls (Strigiformes). Neotrop. Owls Divers. Conserv. 2017, 1–670. [Google Scholar] [CrossRef]
- Wink, M.; El-Sayed, A.A.; Sauer-Gürth, H.; Gonzalez, J. Molecular phylogeny of owls (Strigiformes) inferred from DNA sequences of the mitochondrial cytochrome b and the nuclear RAG-1 gene. Ardea 2009, 97, 581–591. [Google Scholar] [CrossRef]
- Abdel Rabou, A.F.N. On the Owls (Order Strigiformes) Inhabiting the Gaza Strip—Palestine. JOJ Wildl. Biodivers. 2020, 3, 1–11. [Google Scholar] [CrossRef]
- Wan, H.Y.; Ganey, J.L.; Vojta, C.D.; Cushman, S.A. Managing emerging threats to spotted owls. J. Wildl. Manag. 2018, 82, 682–697. [Google Scholar] [CrossRef]
- Li, L.; Jiang, Z. International trade of CITES listed bird species in China. PLoS ONE 2014, 9, e85012. [Google Scholar] [CrossRef]
- Ribeiro, J.; Reino, L.; Schindler, S.; Strubbe, D.; Vall-llosera, M.; Araújo, M.B.; Capinha, C.; Carrete, M.; Mazzoni, S.; Monteiro, M.; et al. Trends in legal and illegal trade of wild birds: A global assessment based on expert knowledge. Biodivers. Conserv. 2019, 28, 3343–3369. [Google Scholar] [CrossRef]
- Nijman, V.; Nekaris, K.A.I. The Harry Potter effect: The rise in trade of owls as pets in Java and Bali, Indonesia. Glob. Ecol. Conserv. 2017, 11, 84–94. [Google Scholar] [CrossRef]
- Siriwat, P.; Nekaris, K.A.I.; Nijman, V. Digital media and the modern-day pet trade: A test of the ‘Harry Potter effect‘ and the owl trade in Thailand. Endanger. Species Res. 2020, 41, 7–16. [Google Scholar] [CrossRef]
- Isaksson, M.; Tegelström, H. Characterization of polymorphic microsatellite markers in a captive population of the eagle owl (Bubo bubo) used for supportive breeding. Mol. Ecol. Notes 2002, 2, 91–93. [Google Scholar] [CrossRef]
- Hsu, Y.C.; Li, S.H.; Lin, Y.S.; Severinghaus, L.L. Microsatellite loci from Lanyu scops owl (Otus elegans botelensis) and their cross-species application in four species of strigidae. Conserv. Genet. 2006, 7, 161–165. [Google Scholar] [CrossRef]
- Proudfoot, G.; Honeycutt, R.; Douglas Slack, R. Development and characterization of microsatellite DNA primers for ferruginous pygmy-owls (Glaucidium brasilianum). Mol. Ecol. Notes 2005, 5, 90–92. [Google Scholar] [CrossRef]
- Hull, J.M.; Keane, J.J.; Tell, L.A.; Ernest, H.B. Development of 37 microsatellite loci for the great gray owl (Strix nebulosa) and other Strix spp. owls. Conserv. Genet. 2008, 9, 1357–1361. [Google Scholar] [CrossRef]
- Klein, A.; Horsburgh, G.J.; Kupper, C.; Major, A.; Lee, P.L.M.; Hoffmann, G.; Matics, R.; Dawson, D.A. Microsatellite markers characterized in the barn owl (Tyto alba) and high utility in the other owls (Strigiformes: AVES). Mol. Ecol. Resour. 2009, 9, 1513–1519. [Google Scholar] [CrossRef]
- Burri, R.; Antoniazza, S.; Siverio, F.; Klein, Á.; Roulin, A.; Fumagalli, L. Isolation and characterization of 21 microsatellite markers in the barn owl (Tyto alba). Mol. Ecol. Resour. 2008, 8, 977–979. [Google Scholar] [CrossRef] [PubMed]
- Hogan, F.E.; Cooke, R.; Norman, J.A. Reverse ascertainment bias in microsatellite allelic diversity in owls (Aves, Strigiformes). Conserv. Genet. 2009, 10, 635–638. [Google Scholar] [CrossRef]
- Kleven, O.; Dawson, D.A.; Gjershaug, J.O.; Horsburgh, G.J.; Jacobsen, K.O.; Wabakken, P. Isolation, characterization and predicted genome locations of Eurasian eagle-owl (Bubo bubo) microsatellite loci. Conserv. Genet. Resour. 2013, 5, 723–727. [Google Scholar] [CrossRef][Green Version]
- Hsu, Y.C.; Severinghaus, L.L.; Lin, Y.S.; Li, S.H. Isolation and characterization of microsatellite DNA markers from the Lanyu scops owl (Otus elegans botelensis). Mol. Ecol. Notes 2003, 3, 595–597. [Google Scholar] [CrossRef]
- Thode, A.B.; Maltbie, M.; Hansen, L.A.; Green, L.D.; Longmire, J.L. Microsatellite markers for the Mexican spotted owl (Strix occidentalis lucida). Mol. Ecol. Notes 2002, 2, 446–448. [Google Scholar] [CrossRef]
- Topinka, J.R.; May, B. Development of polymorphic microsatellite loci in the northern goshawk (Accipiter gentilis) and cross-amplification in other raptor species. Conserv.Genet. 2004, 5, 861–864. [Google Scholar] [CrossRef]
- Peakall, R.; Smouse, P.E. GenAlEx 6.5: Genetic analysis in Excel. Population genetic software for teaching and research--an update. Bioinformatics 2012, 28, 2537–2539. [Google Scholar] [CrossRef] [PubMed]
- Valière, N. GIMLET: A computer program for analysing genetic individual identification data. Mol. Ecol. Notes 2002, 2, 377–379. [Google Scholar] [CrossRef]
- Jones, O.R.; Wang, J. COLONY: A program for parentage and sibship inference from multilocus genotype data. Mol. Ecol. Resour. 2010, 10, 551–555. [Google Scholar] [CrossRef]
- Marshall, T.C.; Slate, J.; Kruuk, L.E.B.; Pemberton, J.M. Statistical confidence for likelihood-based paternity inference in natural populations. Mol. Ecol. 1998, 7, 639–655. [Google Scholar] [CrossRef]
- Kalinowski, S.T.; Taper, M.L.; Marshall, T.C. Revising how the computer program CERVUS accommodates genotyping error increases success in paternity assignment. Mol. Ecol. 2007, 16, 1099–1106. [Google Scholar] [CrossRef] [PubMed]
- Belkhir, K.; Borsa, P.; Chikhi, L.; Raufaste, N.; Bonhomme, F. Genetix 4.05, Logiciel Sous Windows Tm Pour La Génétique Des Populations; Laboratoire Genome, Populations, Interactions, CNRS UMR 5000, Universite de Montpellier II: Montpellier, France, 1996–2004.
- Smart, U.; Cihlar, J.C.; Budowle, B. International Wildlife Trafficking: A perspective on the challenges and potential forensic genetics solutions. Forensic Sci. Int. Genet. 2021, 54, 102551. [Google Scholar] [CrossRef] [PubMed]
- Potoczniak, M.J.; Chermak, M.; Quarino, L.; Tobe, S.S.; Conte, J. Development of a multiplex, PCR-based genotyping assay for African and Asian elephants for forensic purposes. Int. J. Leg. Med. 2020, 134, 55–62. [Google Scholar] [CrossRef]
- Fitzsimmons, N.N.; Tanksley, S.; Forstner, M.R.J.; Louis, E.E.; Daglish, R.; Gratten, J.; Davis, S. Microsatellite markers for Crocodylus: New genetic tools for population genetics, mating system studies and forensics. Crocodilian Biol. Evol. 2001, 51–57. [Google Scholar]
- Jan, C.; Fumagalli, L. Polymorphic DNA microsatellite markers for forensic individual identification and parentage analyses of seven threatened species of parrots (family Psittacidae). PeerJ 2016, 2016, 1–7. [Google Scholar] [CrossRef]
- Mucci, N.; Giangregorio, P.; Cirasella, L.; Isani, G.; Mengoni, C. A new STR panel for parentage analysis in endangered tortoises. Conserv. Genet. Resour. 2020, 12, 67–75. [Google Scholar] [CrossRef]
- Zhou, Z.; Shao, C.; Xie, J.; Xu, H.; Liu, Y.; Zhou, Y.; Liu, Z.; Zhao, Z.; Tang, Q.; Sun, K. Genetic polymorphism and phylogenetic analyses of 21 non-CODIS STR loci in a Chinese Han population from Shanghai. Mol. Genet. Genom. Med. 2020, 8, 1–8. [Google Scholar] [CrossRef] [PubMed]
- Kumar, A.; Kumar, R.; Kumawat, R.K.; Shrivastava, P.; Chaubey, G. Genomic diversity at 22 STR loci (extended CODIS STR) in the population of Rajasthan, India. Gene Rep. 2021, 23, 101150. [Google Scholar] [CrossRef]
- Rocco, F.D.; Anello, M. The Use of Forensic DNA on the Conservation of Neotropical Mammals. In Molecular Ecology and Conservation Genetics of Neotropical Mammals; Springer Nature Switzerland AG: Cham, Switzerland, 2021; pp. 85–98. [Google Scholar]
- Gebhardt, K.J.; Waits, L.P. Cross-species amplification and optimization of microsatellite markers for use in six Neotropical parrots. Mol. Ecol. Resour. 2008, 8, 835–839. [Google Scholar] [CrossRef] [PubMed]
- Dawson, D.A.; Horsburgh, G.J.; Küpper, C.; Stewart, I.R.K.; Ball, A.D.; Durrant, K.L.; Hansson, B.; Bacon, I.; Bird, S.; Klein, Á.; et al. New methods to identify conserved microsatellite loci and develop primer sets of high cross-species utility—As demonstrated for birds. Mol. Ecol. Resour. 2010, 10, 475–494. [Google Scholar] [CrossRef] [PubMed]
- Maulidi, A.; Fatchiyah, F.; Hamidy, A.; Kurniawan, N. Microsatellite Marker for Cross-Species Amplification: Study Case for Indonesian Sundaland Python (Serpentes: Pythonidae). J. Exp. Life Sci. 2018, 8, 61–65. [Google Scholar] [CrossRef]
- Du Toit, Z.; Dalton, D.L.; du Plessis, M.; Jansen, R.; Grobler, J.P.; Kotzé, A. Isolation and characterization of 30 STRs in Temminck’s ground pangolin (Smutsia temminckii) and potential for cross amplification in other African species. J. Genet. 2020, 99. [Google Scholar] [CrossRef]
- Barbará, T.; Palma-Silva, C.; Paggi, G.M.; Bered, F.; Fay, M.F.; Lexer, C. Cross-species transfer of nuclear microsatellite markers: Potential and limitations. Mol. Ecol. 2007, 16, 3759–3767. [Google Scholar] [CrossRef]
- König, C.; Weick, F. Owls of the World; AandC Black Publishers Ltd.: London, UK, 2008. [Google Scholar]
- Prum, R.O.; Berv, J.S.; Dornburg, A.; Field, D.J.; Townsend, J.P.; Lemmon, E.M.; Lemmon, A.R. A comprehensive phylogeny of birds (Aves) using targeted next-generation DNA sequencing. Nature 2015, 526, 569–573. [Google Scholar] [CrossRef] [PubMed]
- Wink, M.; Sauer-Gurth, H. Molecular taxonomy and systematics of owls (Strigiformes)—An update. Airo 2021, 29, 487–500. [Google Scholar]
- Aliabadian, M.; Alaei-Kakhki, N.; Mirshamsi, O.; Nijman, V.; Roulin, A. Phylogeny, biogeography, and diversification of barn owls (Aves: Strigiformes). Biol. J. Linn. Soc. 2016, 119, 904–918. [Google Scholar] [CrossRef]
- Dial, C.R.; Talbot, S.L.; Sage, G.K.; Seidensticker, M.T.; Holt, D.W. Cross-species Amplification of Microsatellite Markers in the Great Horned Owl Bubo virginianus, Short-eared Owl Asio flammeus and Snowy Owl B. scandiacus for Use in Population Genetics, Individual Identification and Parentage Studies. J. Yamashina Inst. Ornithol. 2012, 44, 1–12. [Google Scholar] [CrossRef]
- Delport, W.; Grant, T.J.; Ryan, P.G.; Bloomer, P. Ten microsatellite loci for evolutionary research on Nesospiza buntings. Mol. Ecol. Notes 2006, 6, 1180–1183. [Google Scholar] [CrossRef]
- Pellegrino, I.; Negri, A.; Boano, G.; Cucco, M.; Kristensen, T.N.; Pertoldi, C.; Randi, E.; Šálek, M.; Mucci, N. Evidence for strong genetic structure in European populations of the little owl Athene noctua. J. Avian Biol. 2015, 46, 462–475. [Google Scholar] [CrossRef]
- Pertoldi, C.; Pellegrino, I.; Cucco, M.; Mucci, N.; Randi, E.; Laursen, J.T.; Sunde, P.; Loeschcke, V.; Kristensen, T.N.; du Toit, Z.; et al. Genetic consequences of population decline in the Danish population of the little owl (Athene noctua). Mol. Ecol. 2020, 14, 358–367. [Google Scholar] [CrossRef]
- Macías-Duarte, A.; Conway, C.J.; Holroyd, G.L.; Valdez-Gómez, H.E.; Culver, M. Genetic Variation among Island and Continental Populations of Burrowing Owl (Athene cunicularia) Subspecies in North America. J. Raptor Res. 2019, 53, 127–133. [Google Scholar] [CrossRef]
- Biello, R.; Zampiglia, M.; Corti, C.; Deli, G.; Biaggini, M.; Crestanello, B.; Delaugerre, M.; Di Tizio, L.; Leonetti Francesco, L.; Stefano, C.; et al. Mapping the geographic origin of captive and confiscated Hermann’s tortoises: A genetic toolkit for conservation and forensic analyses. Forensic Sci. Int. Genet. 2021, 51, 102447. [Google Scholar] [CrossRef] [PubMed]
- Glenn, T.C. Field guide to next-generation DNA sequencers. Mol. Ecol. Resour. 2011, 11, 759–769. [Google Scholar] [CrossRef]
- Fordyce, S.L.; Ávila-Arcos, M.C.; Rockenbauer, E.; Børsting, C.; Frank-Hansen, R.; Petersen, F.T.; Willerslev, E.; Hansen, A.J.; Morling, N.; Gilbert, T.P. High-throughput sequencing of core STR loci for forensic genetic investigations using the Roche Genome Sequencer FLX platform. BioTechniques 2011, 51, 127–133. [Google Scholar] [CrossRef] [PubMed]
- Bornman, D.M.; Hester, M.E.; Schuetter, J.M.; Kasoji, M.D.; Minard-Smith, A.; Barden, C.A.; Faith, S.A. Short-read, high-throughput sequencing technology for STR genotyping. BioTechniques. Rapid Dispatches 2012, 23, 1–7. [Google Scholar] [CrossRef]
- Van Neste, C.; Van Nieuwerburgh, F.; Van Hoofstat, D.; Deforce, D. Forensic STR analysis using massive parallel sequencing. Forensic Sci. Int. Genet. 2012, 6, 810–818. [Google Scholar] [CrossRef]
- Stoeckle, B.C.; Theuerkauf, J.; Rouys, S.; Gula, R.; Lorenzo, A.; Lambert, C.; Kaeser, T.; Kuehn, R. Identification of polymorphic microsatellite loci for the endangered Kagu (Rhynochetos jubatus) by high-throughput sequencing. J. Ornithol. 2012, 153, 249–253. [Google Scholar] [CrossRef]
- Pimentel, J.S.M.; Carmo, A.O.; Rosse, I.C.; Martins, A.P.V.; Ludwig, S.; Facchin, S.; Pereira, A.H.; Brandão-Dias, P.F.P.; Abreu, N.L.; Kalapothakis, E. High-throughput sequencing strategy for microsatellite genotyping using neotropical fish as a model. Front. Genet. 2018, 9, 1–8. [Google Scholar] [CrossRef]
- Qi, W.H.; Lu, T.; Zheng, C.L.; Jiang, X.M.; Jie, H.; Zhang, X.Y.; Yue, B.S.; Zhao, G.J. Distribution patterns of microsatellites and development of its marker in different genomic regions of forest musk deer genome based on high throughput sequencing. Aging 2020, 12, 4445–4462. [Google Scholar] [CrossRef] [PubMed]
- Song, C.; Feng, Z.; Li, C.; Sun, Z.; Gao, T.; Song, N.; Liu, L. Profile and development of microsatellite primers for Acanthogobius ommaturus based on high-throughput sequencing technology. J. Oceanol. Limnol. 2020, 38, 1880–1890. [Google Scholar] [CrossRef]
- De Barba, M.; Miquel, C.; Lobréaux, S.; Quenette, P.Y.; Swenson, J.E.; Taberlet, P. High-throughput microsatellite genotyping in ecology: Improved accuracy, efficiency, standardization and success with low-quantity and degraded DNA. Mol. Ecol. Resour. 2017, 17, 492–507. [Google Scholar] [CrossRef] [PubMed]


| Family | Subfamily | Tribe | Species | ID | Gender | Relationships | Family Group |
|---|---|---|---|---|---|---|---|
| Strigidae | Striginae | Strigini | Strix aluco | S_al 1 | Male | Father | 1 |
| S_al 2 | Female | Mother | |||||
| S_al 3 | unknown | Offspring | |||||
| S_al 4 | Male | Father | 2 | ||||
| S_al 5 | Female | Mother | |||||
| S_al 6 | unknown | Offspring | |||||
| S_al 7 | Male | Father | 3 | ||||
| S_al 8 | Female | Mother | |||||
| S_al 9 | unknown | Offspring | |||||
| Bubonini | Bubo bubo | B_bu 1 | Male | Father | 4 | ||
| B_bu 2 | Female | Mother | |||||
| B_bu 3 | unknown | Offspring | |||||
| B_bu 4 | Male | Father | 5 | ||||
| B_bu 5 | Female | Mother | |||||
| B_bu 6 | unknown | Offspring | |||||
| B_bu 7 | Male | Father | 6 | ||||
| B_bu 8 | Female | Mother | |||||
| B_bu 9 | unknown | Offspring | |||||
| Surninae | Athenini | Athene noctua | A_no 1 | Male | Father | 7 | |
| A_no 2 | Female | Mother | |||||
| A_no 3 | unknown | Offspring | |||||
| A_no 4 | Male | Father | 8 | ||||
| A_no 5 | Female | Mother | |||||
| A_no 6 | unknown | Offspring | |||||
| A_no 7 | Male | Father | 9 | ||||
| A_no 8 | Female | Mother | |||||
| A_no 9 | unknown | Offspring | |||||
| Striginae | Strigini | Strix nebulosa | S_ne 1 | Male | Father | 10 | |
| S_ne 2 | Female | Mother | |||||
| S_ne 3 | unknown | Offspring | |||||
| S_ne 4 | Male | Father | 11 | ||||
| S_ne 5 | Female | Mother | |||||
| S_ne 6 | unknown | Offspring | |||||
| S_ne 7 | Male | Father | 12 | ||||
| S_ne 8 | Female | Mother | |||||
| S_ne 9 | unknown | Offspring | |||||
| Strix uralensis | S_ur 1 | Male | Father | 13 | |||
| S_ur 2 | Female | Mother | |||||
| S_ur 3 | unknown | Offspring | |||||
| S_ur 4 | Male | Father | 14 | ||||
| S_ur 5 | Female | Mother | |||||
| S_ur 6 | unknown | Offspring | |||||
| Bubonini | Bubo scandiacus | B_sc 1 | Male | Father | 15 | ||
| B_sc 2 | Female | Mother | |||||
| B_sc 3 | unknown | Offspring | |||||
| B_sc 4 | Male | Father | 16 | ||||
| B_sc 5 | Female | Mother | |||||
| B_sc 6 | unknown | Offspring | |||||
| B_sc 7 | Male | Father | 17 | ||||
| B_sc 8 | Female | Mother | |||||
| B_sc 9 | unknown | Offspring | |||||
| Otini | Otus scops | O_sc 1 | Male | Father | 18 | ||
| O_sc 2 | Female | Mother | |||||
| O_sc 3 | unknown | Offspring | |||||
| O_sc 4 | Male | Father | 19 | ||||
| O_sc 5 | Female | Mother | |||||
| O_sc 6 | unknown | Offspring | |||||
| O_sc 7 | Male | Father | 20 | ||||
| O_sc 8 | Female | Mother | |||||
| O_sc 9 | unknown | Offspring | |||||
| Asionini | Asio otus | A_ot 1 | Male | Father | 21 | ||
| A_ot 2 | Female | Mother | |||||
| A_ot 3 | unknown | Offspring | |||||
| A_ot 4 | Male | Father | 22 | ||||
| A_ot 5 | Female | Mother | |||||
| A_ot 6 | unknown | Offspring | |||||
| Surninae | Surnini | Surnia ulula | S_ul 1 | Male | Father | 23 | |
| S_ul 2 | Female | Mother | |||||
| S_ul 3 | unknown | Offspring | |||||
| S_ul 4 | Male | Father | 24 | ||||
| S_ul 5 | Female | Mother | |||||
| S_ul 6 | unknown | Offspring | |||||
| S_ul 7 | Male | Father | 25 | ||||
| S_ul 8 | Female | Mother | |||||
| S_ul 9 | unknown | Offspring | |||||
| Glaucidium passerinum | G_pa 1 | Male | Father | 26 | |||
| G_pa 2 | Female | Mother | |||||
| G_pa 3 | unknown | Offspring | |||||
| G_pa 4 | Male | Father | 27 | ||||
| G_pa 5 | Female | Mother | |||||
| G_pa 6 | unknown | Offspring | |||||
| Tytonidae | Tytoninae | Tyto alba | T_al 1 | Male | Father | 28 | |
| T_al 2 | Female | Mother | |||||
| T_al 3 | unknown | Offspring |
| Primer ID | Forward Primer Sequence | Reverse Primer Sequence | Original Species | References |
|---|---|---|---|---|
| 54f2 | GAGAGATGTTGGGCTCTTGTG | TGTTAATTGCATTGAATGTCAGC | Passerine and shorebird species | [25] |
| BOOW19 | GGAAACTTACTAGAAAATAAATGACTGG | CTTTCTAACTTTCCCATGCAAC | Passerine and shorebird species | [25] |
| Calex05 | TCCAGCTGAAGTCTTCCGTGAAT | TCCACACCTGTTCGACAGTTCAATA | Passerine and shorebird species | [25] |
| HvoB1 | AAGCAAGGACTTTCCTTCCAG | TCTCAAATTGGAACAGAGAAAGG | Passerine and shorebird species | [25] |
| Tgu06 | CGAGTAGCGTATTTGTAGCGA | AGGAGCGGTGATTGTTCAGT | Passerine and shorebird species | [25] |
| TG04-061 | GACAATGGCTATGAAATAAATTAGGC | AGAAGGGCATTGAAGCACAC | Passerine and shorebird species | [25] |
| BbuS027 | TCATGAGGAACTTTCAGTGCTC | GAAGAAAGGCAGCTCTCACC | Bubo bubo | [28] |
| BbuS102 | AACTGATTTGGAAACCACCATC | CTGGAACACCCAGTGTTTGTC | Bubo bubo | [28] |
| Bbus116 | GTTTCTGCAGCTGGGTCAG | AAACAGTTTCCATGCCTTACG | Bubo bubo | [28] |
| BbuS132 | TCATTGTAGGTCCCATCCAAC | CCATATCTATCAAGCAACCTTGG | Bubo bubo | [28] |
| Oe050 | AGAGTTGTCCTTGGTTGG | TTCTAGTAACCTCATCTGC | Otus elegans | [29] |
| Oe054 | TCAGAAAGAAAACTTCAGCAACC | CATATATGTATACACAGGCACATGC | Otus elegans | [29] |
| 15A6 | ACCTCAGAAGCAGACAGAACC | CCTTTGCGATTGCTGTAAC | Strix occidentalis | [30] |
| Age5 | ACGTTACAGACACCGATTACTTCC | AGCCACGCGTCTGATACTTT | Accipiter gentilis | [31] |
| Bb101 | AATAACCCCAATAGAAGC | ACCAGAAGGAGATGAGACC | Bubo bubo | [21] |
| Bb126 | TCTCCAGAAGGGTTGTCATC | TGCTAAAACCTTACAGAATAACAG | Bubo bubo | [21] |
| Oe142 | TGAATCAGCAAACCTGTGCCTG | AGCTAACCTAGAGTCAGCCAGC | Otus elegans | [29] |
| Oe171 | TTTTACAAACTACTAGTGCATGTCTCC | AGATGTTGTATTTCAGTGTCAG | Otus elegans | [29] |
| Oe3-21 | GATTAGAGACCCGATTCCACA | TTATCTGAGTGGAAGGGTAGTGC | Otus elegans | [29] |
| Oe3-7 | GTGGGTTTATTGCCCCCTCG | CAGATGAATGAATGGATAGATGG | Otus elegans | [22] |
| Oe149 | CACACATCCATTTTGGGGTGC | GGATGCTGGAACTGACCTGC | Otus elegans | [22] |
| Oe081 | GTAAGGGAAGTAGACGTCTGTTGG | CAACTTTGTGTCATCTGAAAGG | Otus elegans | [22] |
| Oe084 | GGGCATAGTTAGACCTTTGCAG | CACATCTGTTGTTCTCCGTGTTACC | Otus elegans | [22] |
| SneD105 | AGCCTTGGGAGGTTAAGTCCT | ACACGCAATCACTGAAGCAGT | Strix nebulosa | [24] |
| SneD113 | AGCTCTTTCCCGACAGTGTCTA | GCCAAAAAACCCCATATCCTAG | Strix nebulosa | [24] |
| SneD202 | GCTGGGCTTAGAAATTACATGG | CTCTGCCCTAATCAGGAACACT | Strix nebulosa | [24] |
| SneD211 | TAGCCCTGTGGATTTGCATTAG | TCACCAGAAGTTCAAAGCAGGTAG | Strix nebulosa | [24] |
| SneD218 | GGGTGTGAGAATGACCTACCTG | AGCAGACAGGAGATGGCTTTTA | Strix nebulosa | [24] |
| Fepo42 | CGTATACATCGAAATAAATACC | CGAATAAAACATCCCTAACC | Glaucidium brasilianum | [23] |
| Oe053 | CTCTGCATCTTAACGCACAGGAC | CCTCCAAGTGGACAGGAAAAGC | Otus elegans | [29] |
| Oe128 | CGTTGTAAATGATGAATCGCCTAGTGC | ATGCATGTATACATACAAACCTGG | Otus elegans | [29] |
| Oe129 | GTCACCTCTTGACATCCGAGTAGC | GCTAAGAGTCCATTTGCCCATCTG | Otus elegans | [29] |
| Species | NA | NE | HO | HE | uHE | P% |
|---|---|---|---|---|---|---|
| Strix aluco | 3.6 (±0.5) | 2.8 (±0.4) | 0.528 (±0.091) | 0.525 (±0.083) | 0.556 (±0.087) | 83.33% |
| Strix nebulosa | 3.0 (±0.3) | 2.2 (±0.2) | 0.565 (±0.096) | 0.471 (±0.074) | 0.499 (±0.079) | 83.33% |
| Strix uralensis | 3.0 (±0.5) | 2.3 (±0.4) | 0.528 (±0.119) | 0.429 (±0.092 | 0.468 (±0.100) | 75.00% |
| Bubo bubo | 4.2 (±0.6) | 2.6 (±0.4) | 0.539 (±0.090) | 0.545 (±0.068) | 0.578 (±0.072) | 91.67% |
| Bubo scandiacus | 3.3 (±0.4) | 2.6 (±0.3) | 0.515 (±0.092) | 0.550 (±0.061) | 0.584 (±0.065) | 91.67% |
| Otus scops | 6.3 (±0.6) | 4.6 (±0.5) | 0.733 (±0.049) | 0.750 (±0.027) | 0.798 (±0.030) | 100.00% |
| Athene noctua | 4.1 (±0.5) | 3.3 (±0.5) | 0.620 (±0.061) | 0.604 (±0.060) | 0.641 (±0.064) | 100.00% |
| Asio otus | 3.2 (±0.4) | 2.5 (±0.3) | 0.681 (±0.097) | 0.529 (±0.062) | 0.590 (±0.070) | 91.67% |
| Surnia ulula | 2.2 (±0.3) | 1.70 (±0.21) | 0.356 (±0.088) | 0.318 (±0.074) | 0.338 (±0.079) | 66.67% |
| Mean | 3.7 (±0.2) | 2.8 (±0.14) | 0.566 (±0.030) | 0.525 (±0.025) | 0.561 (±0.026) | 87.04 (±3.70)% |
| Strix aluco | Strix nebulosa | Strix uralensis | ||||||
| locus | PID | PID_sib | locus | PID | locus | PID | PID_sib | |
| Oe149 | 8.16 × 10−02 | 3.78 × 10−01 | 15a6 | 1.40 × 10−01 | 4.33 × 10−01 | Oe128 | 8.16 × 10−02 | 3.82 × 10−01 |
| 15a6 | 6.98 × 10−03 | 1.46 × 10−01 | Oe53 | 2.38 × 10−02 | 1.99 × 10−01 | Oe53 | 9.28 × 10−03 | 1.57 × 10−01 |
| SneD218 | 7.10 × 10−04 | 5.87 × 10−02 | SneD218 | 4.82 × 10−03 | 9.54 × 10−02 | Oe142 | 1.25 × 10−03 | 6.72 × 10−02 |
| Oe53 | 7.22 × 10−05 | 2.36 × 10−02 | Oe149 | 1.01 × 10−03 | 4.68 × 10−02 | Oe149 | 1.86 × 10−04 | 2.96 × 10−02 |
| Oe142 | 7.77 × 10−06 | 9.59 × 10−03 | Fepo42 | 2.28 × 10−04 | 2.35 × 10−02 | SneD218 | 3.23 × 10−05 | 1.38 × 10−02 |
| Oe128 | 1.45 × 10−06 | 4.56 × 10−03 | Oe142 | 5.18 × 10−05 | 1.18 × 10−02 | 15a6 | 7.33 × 10−06 | 6.93 × 10−03 |
| Oe129 | 3.52 × 10−07 | 2.42 × 10−03 | SneD113 | 1.24 × 10−05 | 6.07 × 10−03 | Oe129 | 2.14 × 10−06 | 3.82 × 10−03 |
| SneD113 | 9.97 × 10−08 | 1.33 × 10−03 | Oe129 | 3.17 × 10−06 | 3.20 × 10−03 | Fepo42 | 1.20 × 10−06 | 2.87 × 10−03 |
| Oe321 | 3.77 × 10−08 | 7.97 × 10−04 * | Oe128 | 1.14 × 10−06 | 1.99 × 10−03 | Tgu06 | 8.74 × 10−07 | 2.46 × 10−03 |
| Tgu06 | 2.11 × 10−08 | 5.99 × 10−04 | Tgu06 | 7.53 × 10−07 | 1.62 × 10−03 | Oe054 | 8.74 × 10−07 | 2.46 × 10−03 |
| Fepo42 | 2.11 × 10−08 | 5.99 × 10−04 | Oe054 | 7.53 × 10−07 | 1.62 × 10−03 | Oe321 | 8.74 × 10−07 | 2.46 × 10−03 |
| Oe054 | 2.11 × 10−08 | 5.99 × 10−04 | Oe321 | 7.53 × 10−07 | 1.62 × 10−03 | SneD113 | 8.74 × 10−07 | 2.46 × 10−03 |
| Bubo bubo | Bubo scandiacus | Otus scops | ||||||
| locus | PID | PID_sib | locus | PID | PID_sib | locus | PID | PID_sib |
| SneD218 | 7.65 × 10−02 | 3.74 × 10−01 | Oe53 | 8.79 × 10−02 | 3.86 × 10−01 | Oe054 | 2.99 × 10−02 | 3.22 × 10−01 |
| Oe53 | 7.26 × 10−03 | 1.46 × 10−01 | SneD218 | 8.94 × 10−03 | 1.55 × 10−01 | Oe149 | 1.18 × 10−03 | 1.08 × 10−01 |
| 15a6 | 8.09 × 10−04 | 6.01 × 10−02 | SneD113 | 1.01 × 10−03 | 6.48 × 10−02 | SneD113 | 4.70 × 10−05 | 3.60 × 10−02 |
| Oe142 | 9.11 × 10−05 | 2.56 × 10−02 | Oe142 | 1.36 × 10−04 | 2.76 × 10−02 | 15a6 | 2.73 × 10−06 | 1.28 × 10−02 |
| Fepo42 | 1.48 × 10−05 | 1.16 × 10−02 | Oe128 | 2.52 × 10−05 | 1.31 × 10−02 | Fepo42 | 1.85 × 10−07 | 4.70 × 10−03 |
| SneD113 | 2.70 × 10−06 | 5.77 × 10−03 | Oe054 | 5.84 × 10−06 | 6.70 × 10−03 | Oe142 | 1.48 × 10−08 | 1.79 × 10−03 |
| Oe128 | 8.03 × 10−07 | 3.16 × 10−03 | Tgu06 | 1.50 × 10−06 | 3.49 × 10−03 | SneD218 | 1.47 × 10−09 | 7.19 × 10−04* |
| Oe149 | 2.23 × 10−07 | 1.78 × 10−03 | Oe149 | 4.68 × 10−07 | 2.03 × 10−03 | Oe128 | 1.48 × 10⁻¹⁰ | 2.93 × 10−04 |
| Oe054 | 6.17 × 10−08 | 1.00 × 10−03 | Fepo42 | 1.68 × 10−07 | 1.26 × 10−03 | Oe53 | 2.49 × 10⁻¹¹ | 1.34 × 10−04 |
| Tgu06 | 2.33 × 10−08 | 5.98 × 10−04 * | 15a6 | 6.83 × 10−08 | 7.92 × 10−04 * | Oe321 | 4.46 × 10⁻¹² | 6.45 × 10−05 |
| Oe321 | 1.55 × 10−08 | 4.89 × 10−04 | Oe129 | 2.78 × 10−08 | 4.99 × 10−04 | Tgu06 | 8.29 × 10⁻¹³ | 3.13 × 10−05 |
| Oe129 | \ | \ | Oe321 | 2.78 × 10−08 | 4.99 × 10−04 | Oe129 | 1.76 × 10⁻¹³ | 1.54 × 10−05 |
| Surnia ulula | Athene noctua | Asio otus | ||||||
| locus | PID | PID_sib | locus | PID | PID_sib | locus | PID | PID_sib |
| SneD218 | 1.34 × 10−01 | 4.26 × 10−01 | SneD113 | 3.94 × 10−02 | 3.34 × 10−01 | Tgu06 | 1.14 × 10−01 | 4.10 × 10−01 |
| Oe142 | 3.56 × 10−02 | 2.27 × 10−01 | Oe149 | 2.42 × 10−03 | 1.20 × 10−01 | SneD218 | 1.36 × 10−02 | 1.72 × 10−01 |
| 15a6 | 1.34 × 10−02 | 1.35 × 10−01 | Oe129 | 1.51 × 10−04 | 4.30 × 10−02 | Fepo42 | 1.62 × 10−03 | 7.20 × 10−02 |
| Fepo42 | 4.63 × 10−03 | 8.06 × 10−02 | SneD218 | 1.46 × 10−05 | 1.71 × 10−02 | Oe129 | 2.41 × 10−04 | 3.17 × 10−02 |
| Oe128 | 1.77 × 10−03 | 4.86 × 10−02 | Oe142 | 1.96 × 10−06 | 7.27 × 10−03 | Oe128 | 4.70 × 10−05 | 1.50 × 10−02 |
| SneD113 | 5.87 × 10−04 | 2.95 × 10−02 | 15a6 | 3.66 × 10−07 | 3.38 × 10−03 | 15a6 | 9.91 × 10−06 | 7.33 × 10−03 |
| Tgu06 | 2.86 × 10−04 | 2.06 × 10−02 | Fepo42 | 6.59 × 10−08 | 1.59 × 10−03 | Oe149 | 3.24 × 10−06 | 4.31 × 10−03 |
| Oe149 | 1.60 × 10−04 | 1.55 × 10−02 | Oe321 | 1.34 × 10−08 | 7.88 × 10−04 * | SneD113 | 1.24 × 10−06 | 2.60 × 10−03 |
| Oe054 | 1.60 × 10−04 | 1.55 × 10−02 | Oe054 | 5.22 × 10−09 | 4.80 × 10−04 | Oe321 | 5.04 × 10−07 | 1.64 × 10−03 |
| Oe129 | 1.60 × 10−04 | 1.55 × 10−02 | Oe128 | 2.59 × 10−09 | 3.39 × 10−04 | Oe054 | 2.00 × 10−07 | 1.06 × 10−03 |
| Oe321 | 1.60 × 10−04 | 1.55 × 10−02 | Tgu06 | 1.36 × 10−09 | 2.50 × 10−04 | Oe53 | 9.20 × 10−08 | 7.18 × 10−04 * |
| Oe53 | 1.60 × 10−04 | 1.55 × 10−02 | Oe53 | 7.63 × 10⁻¹⁰ | 1.87 × 10−04 | Oe142 | 9.20 × 10−08 | 7.18 × 10−04 |
| Parent Pair Probability | Single Parent Probability | |||||
|---|---|---|---|---|---|---|
| Offspring | Father | Mother | Probability Value | Main Probability | Second Probability | |
| S_al 3 | S_al 1 | S_al 2 | 1.00 | |||
| S_al 6 | S_al 4 | S_al 5 | 1.00 | |||
| S_al 9 | S_al 7 | S_al 8 | 1.00 | |||
| S_ne 3 | S_ne 1 | S_ne 2 | 1.00 | S_ne 2 | 0.907 | S_ne 8 |
| S_ne 6 | S_ne 4 | S_ne 5 | 1.00 | S_ne 4 | 0.992 | S_ne 1 |
| S_ne 9 | S_ne 7 | S_ne 8 | 1.00 | |||
| S_ur 3 | S_ur 1 | S_ur 2 | 1.00 | S_ur 2 | 0.997 | S_ur 5 |
| S_ur 6 | S_ur 4 | S_ur 5 | 1.00 | S_ur 5 | 0.500 | S_ur 2 |
| B_bu 3 | B_bu 1 | B_bu 2 | 1.00 | |||
| B_bu 6 | B_bu 4 | B_bu 5 | 1.00 | |||
| B_bu 9 | B_bu 7 | B_bu 8 | 1.00 | |||
| B_sc 3 | B_sc 1 | B_sc 2 | 1,00 | |||
| B_sc 6 | B_sc 4 | B_sc 5 | 1.00 | B_sc 6 | 0.999 | |
| B_sc 9 | B_sc 7 | B_sc 8 | 1,00 | |||
| O_sc 3 | O_sc 1 | O_sc 2 | 1.00 | |||
| O_sc 6 | O_sc 4 | O_sc 5 | 1.00 | |||
| O_sc 9 | O_sc 7 | O_sc 8 | 1.00 | |||
| A_no 3 | A_no 1 | A_no 2 | 1.00 | |||
| A_no 6 | A_no 4 | A_no 5 | 1.00 | |||
| A_no 9 | A_no 7 | A_no 8 | 1.00 | |||
| S_ul 3 | S_ul 1 | S_ul 2 | 1.00 | S_ul 1 | 0.500 | S_ul 4 |
| S_ul 6 | S_ul 4 | S_ul 5 | 1.00 | S_ul 4 | 0.983 | S_ul 7 |
| S_ul 5 | 0.753 | S_ul 2 | ||||
| S_ul 9 | S_ul 7 | S_ul 8 | 1.00 | |||
| A_ot 3 | A_ot 1 | A_ot 2 | 1.00 | |||
| A_ot 6 | A_ot 7 | A_ot 8 | 1.00 | |||
| LOD | Delta | |||||||||
|---|---|---|---|---|---|---|---|---|---|---|
| Offspring | Candidate Mother | Pair Confidence | Candidate Father | Pair Confidence | Trio Confidence | Offspring | Candidate Mother | Pair Confidence | Candidate Father | Pair Confidence |
| S_al 3 | S_al 1 | * | S_al 2 | * | * | S_al 3 | S_al 1 | * | S_al 2 | * |
| S_al 6 | S_al 3 | * | S_al 4 | * | * | S_al 6 | S_al 3 | * | S_al 4 | * |
| S_al 9 | S_al 7 | * | S_al 8 | * | * | S_al 9 | S_al 7 | * | S_al 8 | * |
| S_ne 3 | S_ne 1 | * | S_ne 2 | * | * | S_ne 3 | S_ne 1 | * | S_ne 2 | * |
| S_ne 6 | S_ne 4 | * | S_ne 5 | * | * | S_ne 6 | S_ne 4 | * | S_ne 5 | * |
| S_ne 9 | S_ne 7 | * | S_ne 8 | * | * | S_ne 9 | S_ne 7 | * | S_ne 8 | * |
| S_ur 3 | S_ur 1 | * | S_ur 2 | * | * | S_ur 3 | S_ur 1 | * | S_ur 2 | * |
| S_ur 6 | S_ur 4 | S_ur 5 | * | * | S_ur 6 | S_ur 4 | S_ur 5 | * | ||
| B_bu 3 | B_bu 1 | * | B_bu 2 | * | * | B_bu 3 | B_bu 1 | * | B_bu 2 | * |
| B_bu 6 | B_bu 4 | * | B_bu 5 | * | * | B_bu 6 | B_bu 4 | * | B_bu 5 | * |
| B_bu 9 | B_bu 7 | * | B_bu 8 | * | * | B_bu 9 | B_bu 7 | * | B_bu 8 | * |
| B_sc 3 | B_sc 1 | * | B_sc 2 | * | * | B_sc 3 | B_sc 1 | * | B_sc 2 | * |
| B_sc 6 | B_sc 4 | * | B_sc 5 | * | * | B_sc 6 | B_sc 4 | * | B_sc 5 | * |
| B_sc 9 | B_sc 7 | * | B_sc 8 | * | * | B_sc 9 | B_sc 7 | * | B_sc 8 | * |
| O_sc 3 | O_sc 1 | * | O_sc 2 | * | * | O_sc 3 | O_sc 1 | * | O_sc 2 | * |
| O_sc 6 | O_sc 4 | * | O_sc 5 | * | * | O_sc 6 | O_sc 4 | * | O_sc 5 | * |
| O_sc 9 | O_sc 7 | * | O_sc 8 | * | * | O_sc 9 | O_sc 7 | * | O_sc 8 | * |
| A_no 3 | A_no 1 | * | A_no 2 | * | * | A_no 3 | A_no 1 | * | A_no 2 | * |
| A_no 6 | A_no 4 | * | A_no 5 | * | * | A_no 6 | A_no 4 | * | A_no 5 | * |
| A_no 9 | A_no 7 | * | A_no 8 | * | * | A_no 9 | A_no 7 | * | A_no 8 | * |
| S_ul 3 | S_ul 1 | * | S_ul 5 | * | * | S_ul 3 | S_ul 1 | * | S_ul 5 | * |
| S_ul 6 | S_ul 4 | * | S_ul 5 | * | * | S_ul 6 | S_ul 4 | * | S_ul 5 | * |
| S_ul 9 | S_ul 7 | * | S_ul 8 | * | * | S_ul 9 | S_ul 7 | * | S_ul 8 | * |
| A_ot 3 | A_ot 1 | * | A_ot 2 | * | * | A_ot 3 | A_ot 1 | * | A_ot 2 | * |
| A_ot 6 | A_ot 7 | * | A_ot 8 | * | * | A_ot 6 | A_ot 7 | * | A_ot 8 | * |
Publisher’s Note: MDPI stays neutral with regard to jurisdictional claims in published maps and institutional affiliations. |
© 2021 by the authors. Licensee MDPI, Basel, Switzerland. This article is an open access article distributed under the terms and conditions of the Creative Commons Attribution (CC BY) license (https://creativecommons.org/licenses/by/4.0/).
Share and Cite
Giangregorio, P.; Naldi, L.; Mengoni, C.; Greco, C.; Padula, A.; Zaccaroni, M.; Fani, R.; Argenti, G.; Mucci, N. Cross-Amplification in Strigiformes: A New STR Panel for Forensic Purposes. Genes 2021, 12, 1721. https://doi.org/10.3390/genes12111721
Giangregorio P, Naldi L, Mengoni C, Greco C, Padula A, Zaccaroni M, Fani R, Argenti G, Mucci N. Cross-Amplification in Strigiformes: A New STR Panel for Forensic Purposes. Genes. 2021; 12(11):1721. https://doi.org/10.3390/genes12111721
Chicago/Turabian StyleGiangregorio, Patrizia, Lorenzo Naldi, Chiara Mengoni, Claudia Greco, Anna Padula, Marco Zaccaroni, Renato Fani, Giovanni Argenti, and Nadia Mucci. 2021. "Cross-Amplification in Strigiformes: A New STR Panel for Forensic Purposes" Genes 12, no. 11: 1721. https://doi.org/10.3390/genes12111721
APA StyleGiangregorio, P., Naldi, L., Mengoni, C., Greco, C., Padula, A., Zaccaroni, M., Fani, R., Argenti, G., & Mucci, N. (2021). Cross-Amplification in Strigiformes: A New STR Panel for Forensic Purposes. Genes, 12(11), 1721. https://doi.org/10.3390/genes12111721