Article

An Integrative Transcriptomic and Metabolomic Analysis of Red Pitaya (Hylocereus polyrhizus) Seedlings in Response to Heat Stress

1
Guangdong Provincial Key Laboratory of Applied Botany & Key Laboratory of South China Agricultural Plant Molecular Analysis and Genetic Improvement, South China Botanical Garden, Chinese Academy of Sciences, Guangzhou 510650, China
2
University of Chinese Academy of Sciences, Beijing 100049, China
3
Wenshan Academy of Agricultural Sciences, Wenshan 663000, China
4
CAS Engineering Laboratory for Vegetation Ecosystem Restoration on Islands and Coastal Zones, South China Botanical Garden, Chinese Academy of Sciences, Guangzhou 510650, China
5
Research Station of Vegetation Ecosystems on Coral Islands in South China Sea, Guangzhou 510650, China
*
Author to whom correspondence should be addressed.
Contributed equally to this work.
Genes 2021, 12(11), 1714; https://doi.org/10.3390/genes12111714
Submission received: 7 October 2021 / Revised: 20 October 2021 / Accepted: 23 October 2021 / Published: 27 October 2021
(This article belongs to the Section Plant Genetics and Genomics)

Abstract

:
Red pitaya (Hylocereus polyrhizus) is a significant functional food that is largely planted in Southeast Asia. Heat stress (HS) induced by high temperatures is likely to restrict the growth and survival of red pitaya. Although pitaya can tolerate temperatures as high as 40 °C, little is known of how it can withstand HS. In this study, the transcriptomic and metabolomic responses of red pitaya seedlings to HS were analyzed. A total of 198 transcripts (122 upregulated and 76 downregulated) were significantly differentially expressed after 24 h and 72 h of exposure to 42 °C compared with a control grown at 28 °C. We also identified 64 differentially accumulated metabolites in pitaya under HS (37 increased and 27 decreased). These differential metabolites, especially amino acids, organic acids, and sugars, are involved in metabolic pathways and the biosynthesis of amino acids. Interaction network analysis of the heat-responsive genes and metabolites suggested that similar pathways and complex response mechanisms are involved in the response of pitaya to HS. Overexpression of one of the upregulated genes (contig10820) in Arabidopsis, which is a homolog of PR-1 and named HuPR-1, significantly increased tolerance to HS. This is the first study showing that HuPR-1 plays a role in the response of pitaya to abiotic stress. These findings provide valuable insights that will aid future studies examining adaptation to HS in pitaya.

1. Introduction

Global ambient temperature has gradually increased because of greenhouse gases such as CO2, methane, chlorofluorocarbons, and nitrous oxides. Heat stress (HS) is usually defined as a temperature increase above a threshold level for a period of time sufficient to cause irreversible damage to plant growth and development. It occurs in response to a transient increase in temperature, usually 10–15 °C above environmental temperature. HS associated with increases in ambient temperature globally poses a serious threat to the growth and production of plants. Plants have evolved various physiological and biochemical adaptations to avoid or reduce the damage caused by HS [1]. HS is one of the most crucial forms of abiotic stress, as it disrupts homeostasis, limits plant growth and development, and even leads to death [2,3]. Elucidating the mechanisms by which plants respond to HS is thus critically important.
HS has independent effects on the physiology and metabolism of plant tissues and cells. Many types of physiological damage are observed under heat stress, such as the scorching of leaves and stems, leaf abscission and senescence, shoot and root growth inhibition, and fruit damage, all of which decrease plant productivity [4]. Higher plants undergo a series of cellular and metabolic reactions to withstand high temperatures, which include changes in the cellular structure and organization, such as organelles and cytoskeleton, as well as membrane functions [5]; reductions in normal protein synthesis; increases in the transcription and translation of heat shock proteins (HSPs) and heat shock transcription factors (HSFs) [6]; and production of phytohormones such as abscisic acid (ABA), antioxidant substances, and other protective molecules [7]. Some secondary metabolites are also involved in the responses of plants to HS, such as phenolics (e.g., flavonoids, anthocyanins, and plant steroids) [1]. HS activates MAPKs, which regulate HSP gene expression; MAPK activation may be related to heat-induced changes in membrane fluidity and calcium signaling, which are significant for HSP gene expression and heat tolerance [8]. HS causes changes in respiration and photosynthesis, leading to shortened life cycles and reduced plant productivity [9]. High temperature alters the activities of carbon metabolism enzymes, starch accumulation, and sucrose synthesis by downregulating specific genes that participate in carbohydrate metabolism [10].
Pitaya (Cactaceae: Hylocereus) is a nutritious tropical fruit with high commercial and medical value [11,12]. It has recently begun to be cultivated in Thailand, the Philippines, Vietnam, Malaysia, and China. Pitaya can be cultivated in diverse climates because of its tolerance of various types of environmental stress, such as drought, heat, salt, and poor soil [13]. Most research on pitaya in previous decades has mostly concentrated in the betaine synthesis process, mainly including their purification and identification [14,15], their physical and chemical properties [16], and their antioxidant and radical-scavenging capacity [17]. Metabolite profiling of pitayas has led to the identification of several betalain biosynthesis-related compounds [18]. In addition, transcriptomic analysis has led to the identification of several key genes in the betalain biosynthesis pathway [19]. Recently, transcriptome and proteomics levels have been used to investigate the molecular mechanism of pitaya response to different types of abiotic stress such as salt, drought, and cold stress [20,21,22]. Proteomic analysis of pitaya led to the identification of 116 differentially abundant proteins, which were mainly related to chloroplast and mitochondria metabolism, indicating that they play a critical role in coping with cold stress [22]. Until now, only a few stress-associated genes, including miR396b-GRF, HuCAT3, and HuERF1 in pitaya, have been proved to enhance tolerance to cold, drought, and salt stress [23,24,25]. However, genomic resources and genetic information of pitaya are still scarce. More genetic data are needed to aid studies examining the resistance of pitaya to abiotic and biotic stress and crop breeding.
The physiological and molecular mechanisms underlying the response of plants to HS are complex and depend on diverse signal transduction pathways, genes, and metabolites [26,27]. Transcriptomic analysis is an effective and widely used technique to identify genes associated with heat tolerance [28,29,30]. Many heat-responsive genes have been identified, including HSPs, HSFs, WRKYs, MYBs, and NACs [31,32,33]. Metabolomic analysis has become an effective means to study plant responses to biotic and abiotic stress [34,35,36]. An integrative transcriptomic and metabolomic analysis of pitaya in response to HS could provide novel insights into the mechanism by which plants respond to HS.
The optimum temperature for the growth of pitaya is 20 to 30 °C, and it can tolerate temperatures as high as 40 °C. However, little is known about how pitaya can withstand such high temperatures. Here, we analyzed the transcriptomic and metabolomic responses of pitaya seedlings after 24 h and 72 h of exposure to 42 °C and 28 °C to identify heat tolerance genes and metabolites and characterize the mechanisms underlying the response of pitaya to HS (Figure 1). Our study suggests that many heat-responsive genes and metabolites are participating in the response to HS and that overexpression of up-regulated genes (HuPR-1) can improve the heat tolerance of transgenic Arabidopsis plants.

2. Materials and Methods

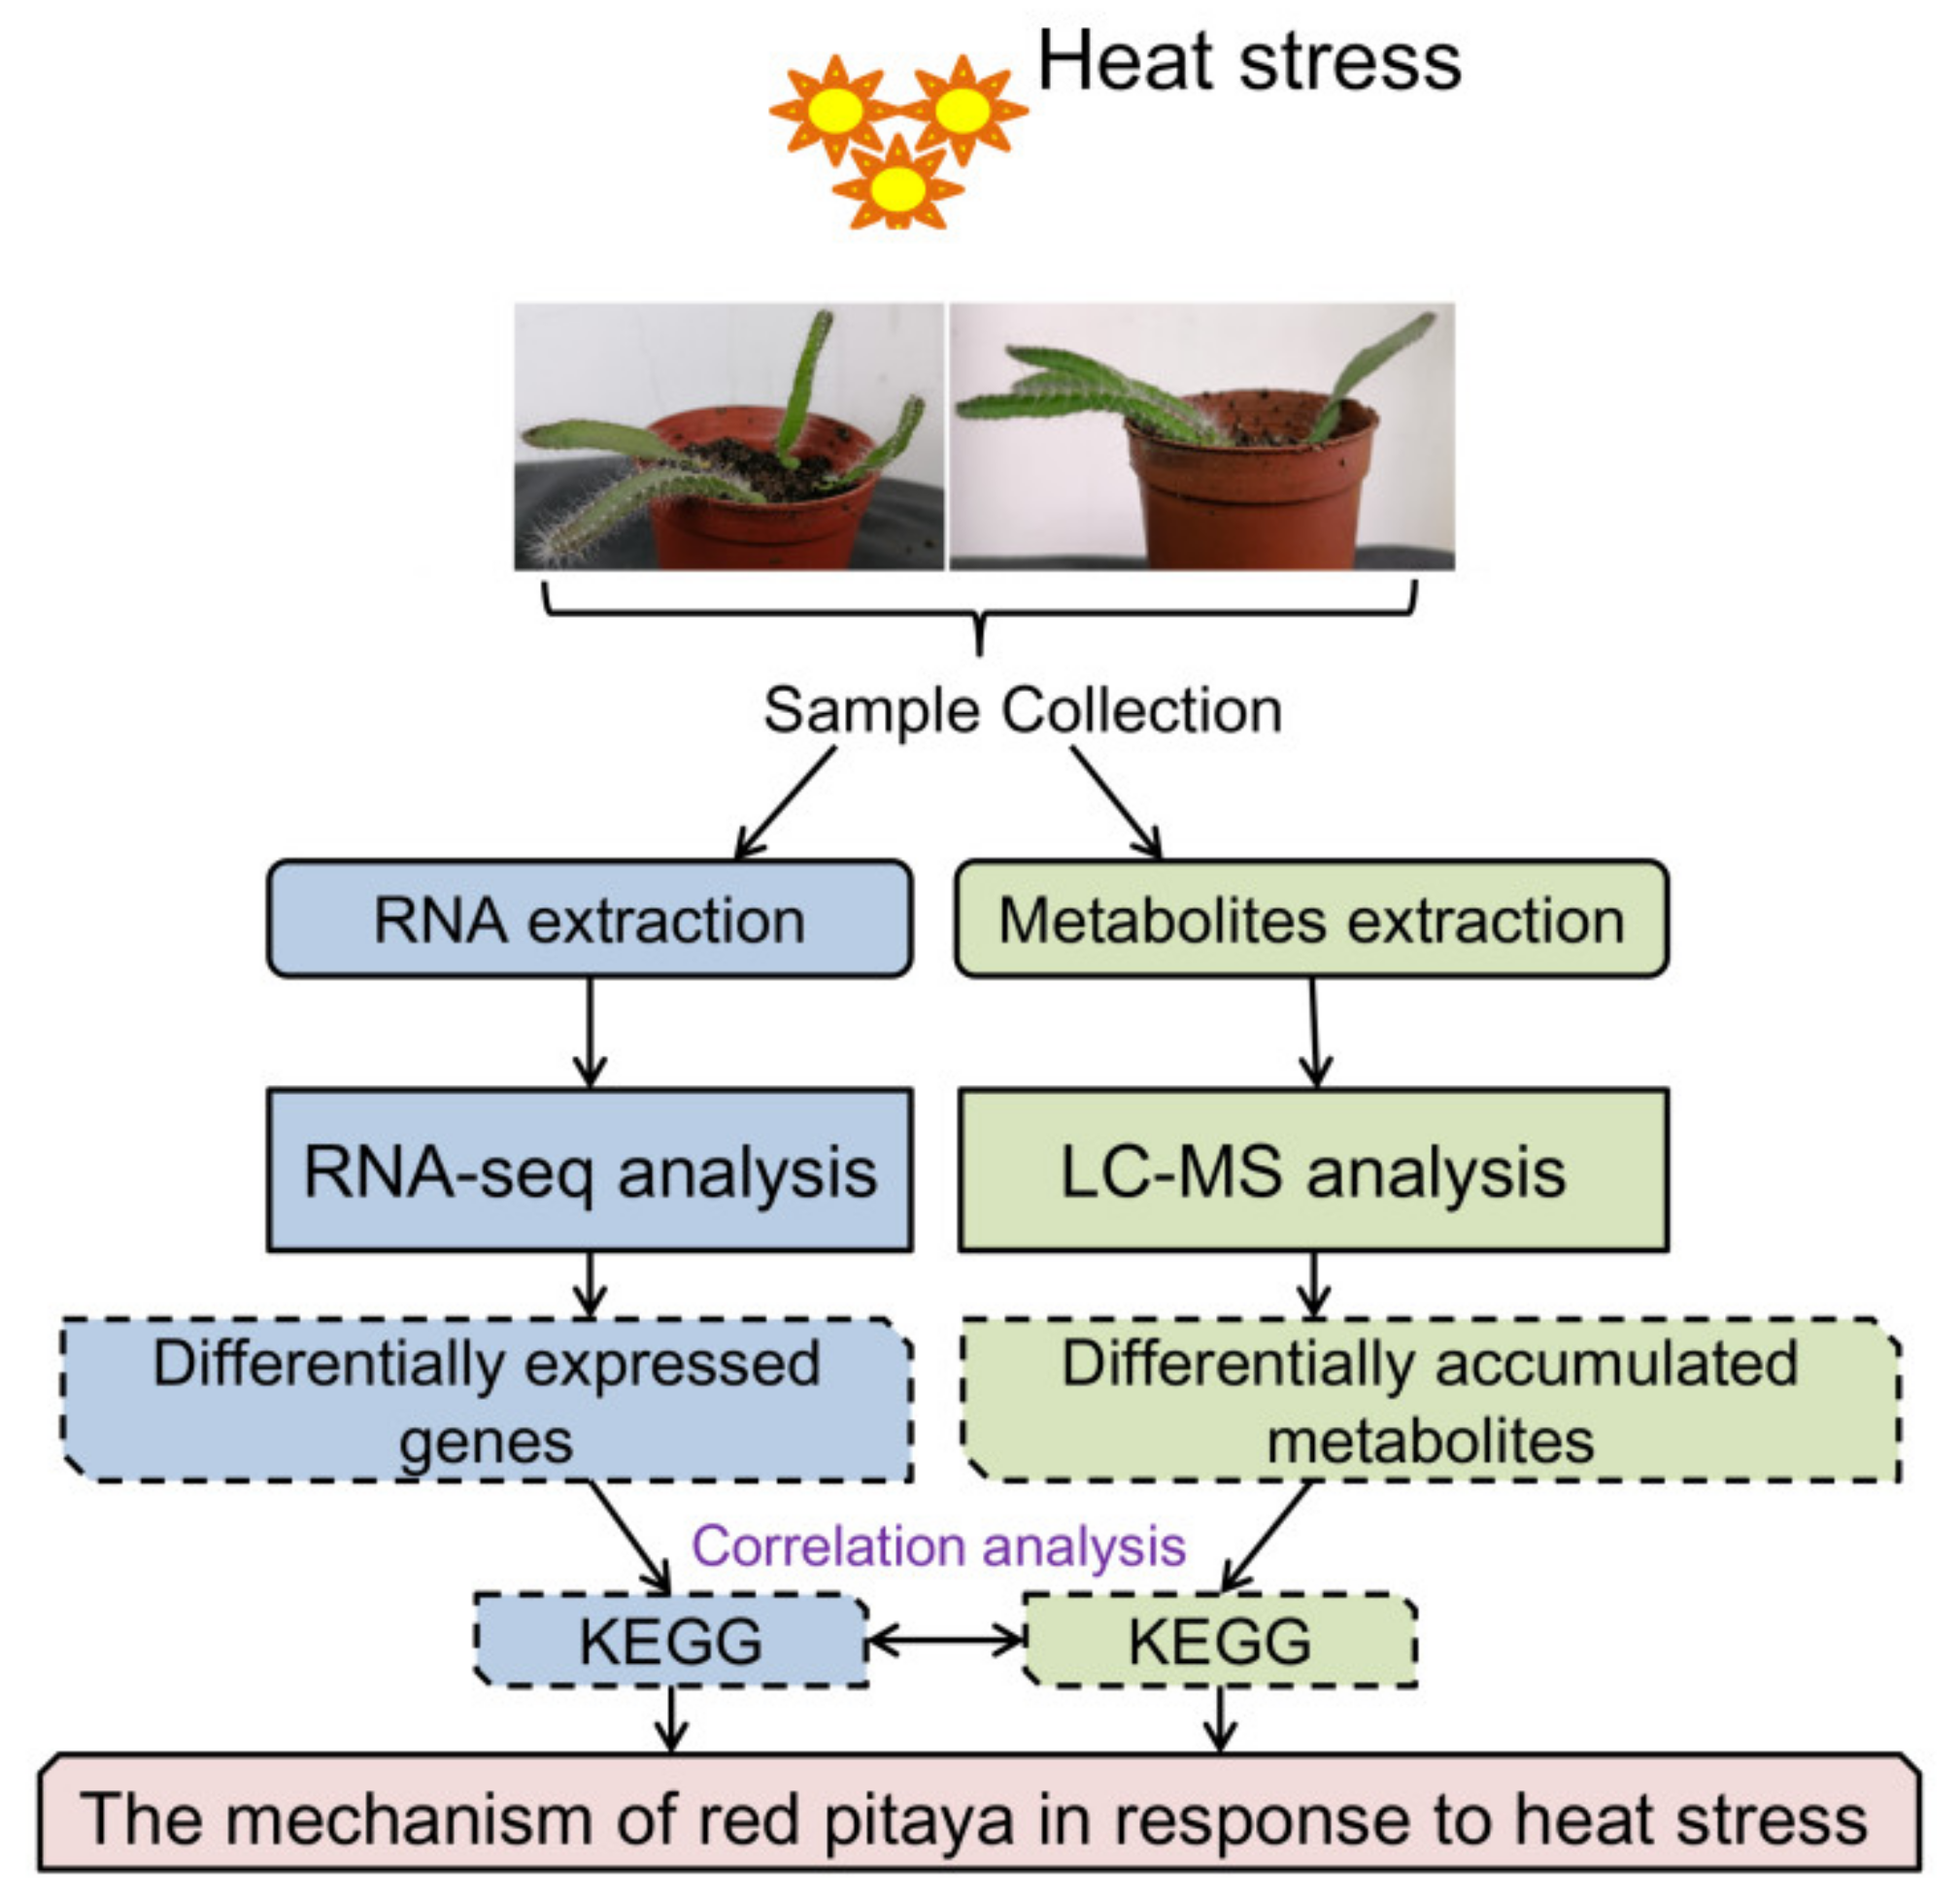
2.1. Plant Materials and Heat Treatments

Red pitaya (Hylocereus polyrhizus) were purchased online. After surface-sterilization, seeds of pitaya were sown in the soil in plastic pots and grown to the three-month-old seedling stage in a greenhouse under controlled conditions (14 h/10 h day/night cycle, 28 ± 1 °C, and 60% ± 5% relative humidity). For heat treatments, plants were subjected to 42 °C for 24 h and 72 h, and control plants were cultivated under normal conditions. Both heat stress and control treatments consisted of three independent biological replicates. A total of 9 samples were harvested in liquid nitrogen and stored at −80 °C for RNA extraction.

2.2. RNA Isolation and Library Preparation for Transcriptomic Analysis

Total RNA from different samples was extracted using TRIzol reagent (Invitrogen, Waltham, MA, USA) according to the manufacturer’s instructions. RNA quality and quantity, including the RNA integrity number (RIN), were analyzed using 1% agarose gel electrophoresis and an RNA Nano 6000 Assay Kit with an Agilent Bioanalyzer 2100 system (Agilent Technologies, Santa Clara, CA, USA), respectively [37]. mRNA was purified with oligo (dT) beads; these cleaved RNA fragments were then used as templates to synthesize first-strand cDNA using random hexamer primers, followed by second-strand cDNA synthesis using RNaseH and DNA polymerase I. Illumina Hiseq platform was used for paired-end cluster generation and sequencing [37].

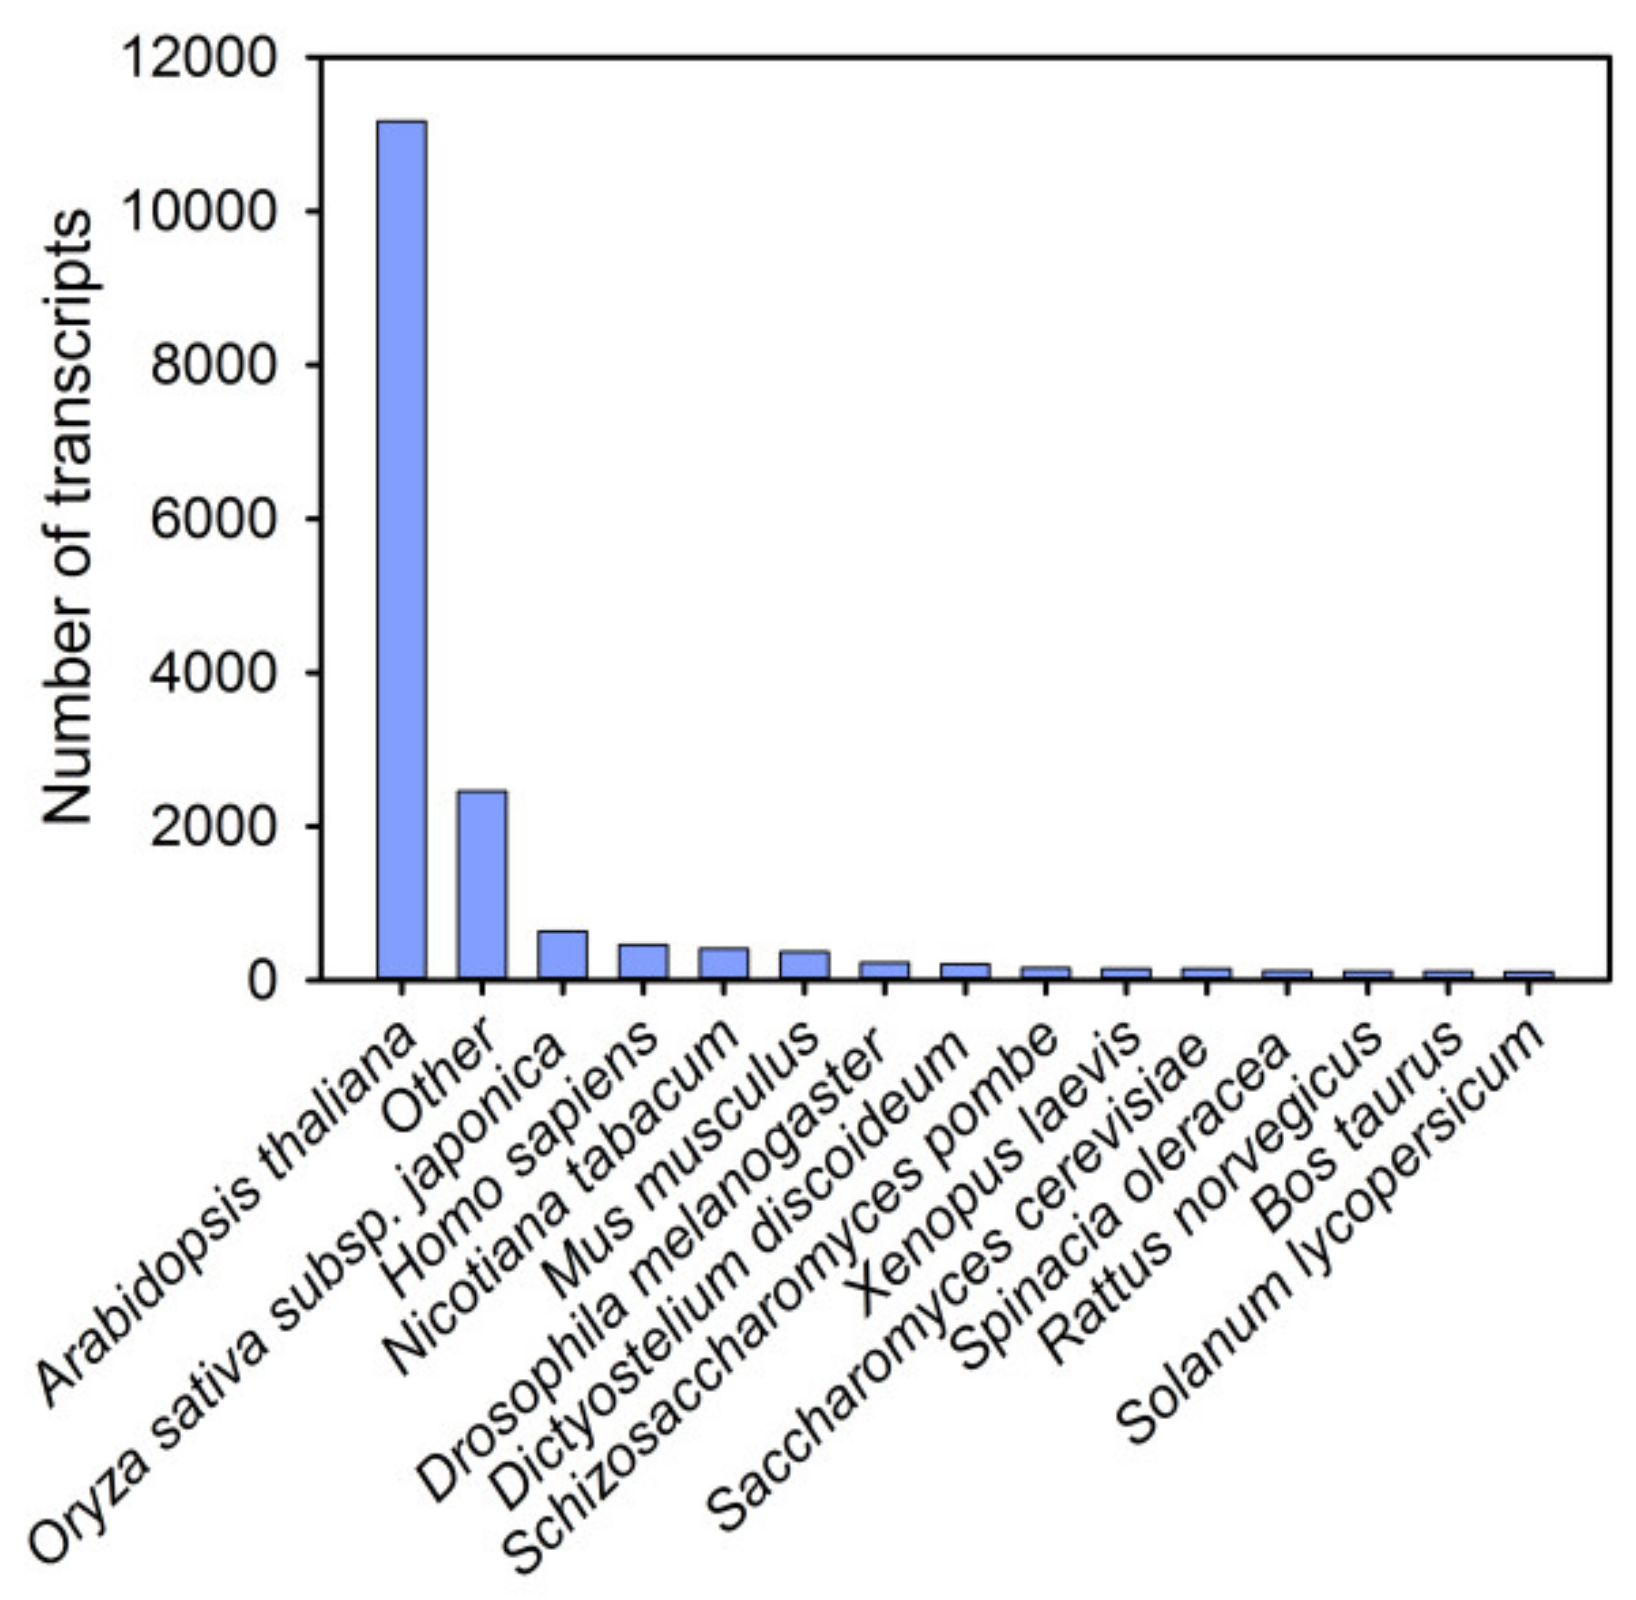
2.3. Sequencing, De Novo Assembly, and Annotation

RNA sequencing libraries were generated using the NEBNext® Ultra™ RNA Library Prep Kit for Illumina® (New England Biolabs, Ipswich, MA, USA) according to the manufacturer’s instructions. The produced libraries were sequenced using Illumina HiSeqTM 2500 at Biomarker Technologies Co. Ltd. (Beijing, China). Raw sequencing data in FASTQ format were processed by NGSToolkits (version.2.3.3) using default parameters [38]. Clean high-quality data were obtained by removing reads containing adapters, poly-Ns, or low-quality reads from the raw data. The Trinity method was used for the de novo assembly of high-quality data to generate unigenes [39].
The unigenes were aligned to a series of databases (the NCBI non-redundant (Nr) protein database (NR, Jan, 2013), Swiss-Prot protein database (Swissprot, The European, Bioinformatics Institute, Cambridge, UK), Cluster of Orthologous Genes database (NCBI, Bethesda, MD, USA), KEGG pathway database (Kanehisa Laboratories, Kyoto, Japan), and the GO database) using BLASTx to obtain annotation and classification information.

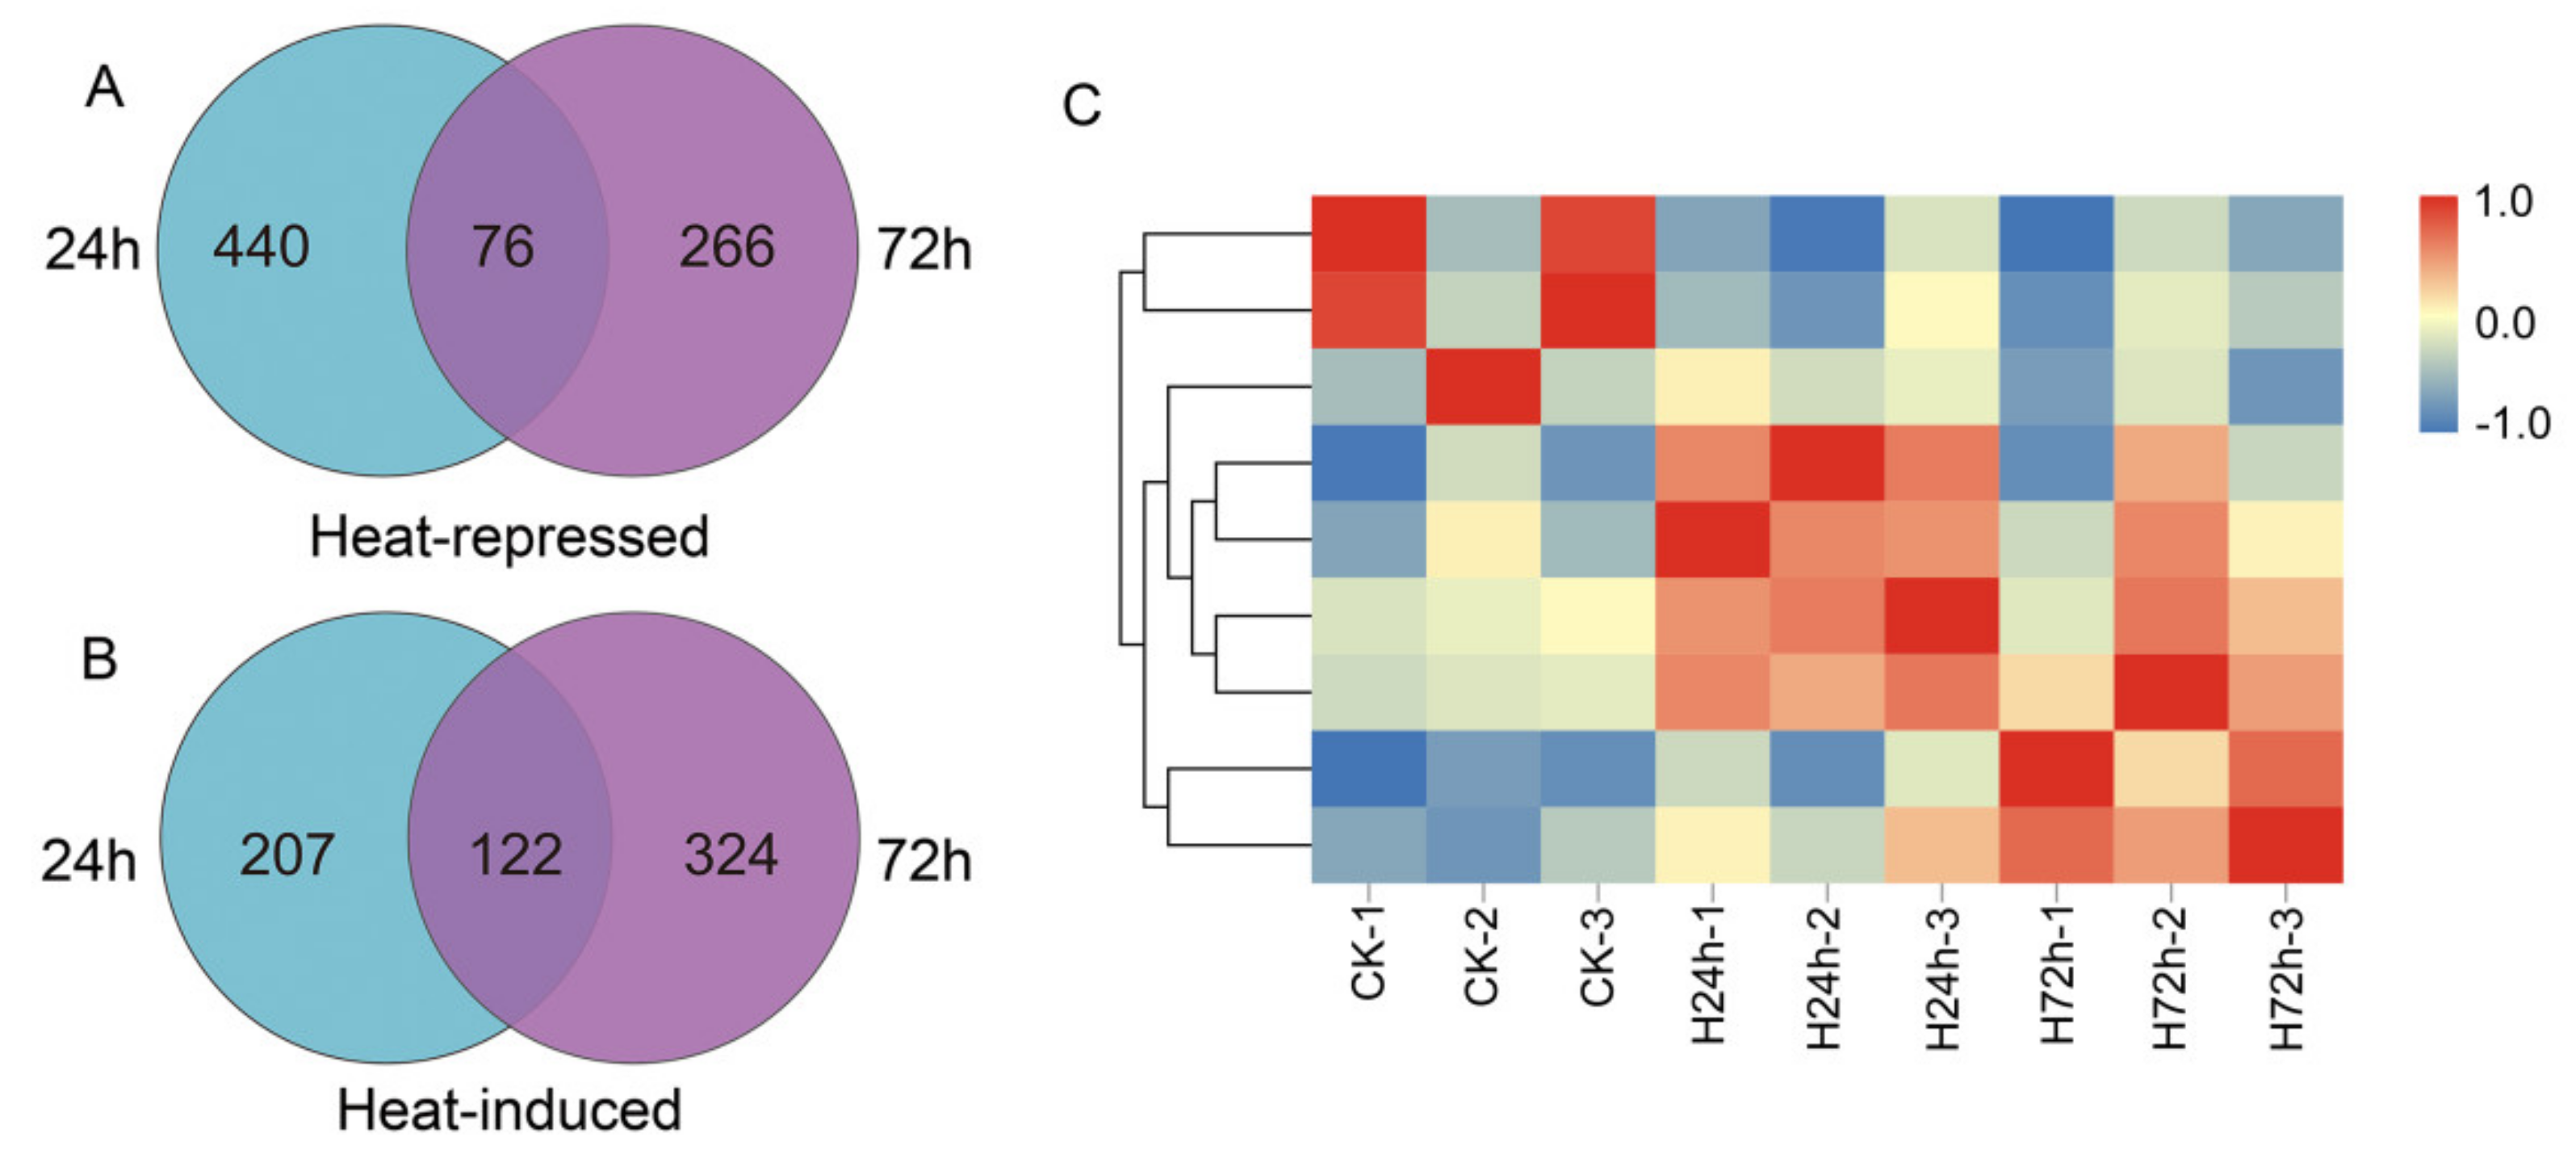
2.4. Identification of DEGs

DEGs (differentially expressed genes) were identified by following previously described methods [37]. The TopHat program (http://tophat.cbcb.umd.edu/, accessed on 13 February 2021) was used to map the clean data to the de novo assembled reference transcriptome. DEGs of different libraries were analyzed using edgeR software [40]. Data were considered high quality on the basis of the following criteria: log2 FC (fold change) ≥ 1, the count value for each gene in the two datasets > 20, and the adjusted p-value FDR (false discovery rate) ≤ 0.001.

2.5. Transcriptome Assembly and DEG Validation

To validate the accuracy of the assembly, we amplified the CDS regions of nine randomly selected transcripts from the de novo transcriptome by PCR. PCR reactions procedures followed those of Nong et al. (2019). qRT-PCR amplification was conducted using a Roche LightCycler 480 Gene Scanning system (Roche, Basel, Basel-Stadt, Switzerland) to validate the accuracy of the RNA-seq data following previously described methods [41]. The expression levels of selected DEGs were normalized by comparison with the internal reference gene UBQ [42]. The relative expression levels of each transcript were calculated using the 2−ΔΔCt method [43]. There were three biological and three technical replicates per treatment. The primers used for PCR and qRT-PCR were designed using Primer Premier 5 (Premier Biosoft, San Francisco, CA, USA). All primers are listed in Table S1.

2.6. Extraction of Metabolites

Metabolites were extracted and detected by Biomarker Technologies (Beijing, China). Control and 24 h heat-treated seedlings of red pitaya were collected, ground to a uniform powder using liquid nitrogen, and stored at −80 °C. Samples were thawed at 4 °C on ice, and 100 mg was placed in a 1.5 mL centrifuge tube. After extraction with 300 μL methanol, 20 μL of internal standard substances was added, followed by vortexing for 30 s. The mixtures were then treated with ultrasound for 10 min (incubation with ice water) and incubated for 1 h at −20 °C. The supernatant was transferred to a new 1.5 mL centrifuge tube. After centrifugation at 13,000 rpm for 15 min (4 °C), 200 μL of the supernatant was transferred to a conical insert of a 2 mL LC–MS glass vial. A total of 20 μL of the supernatant from each sample was mixed as a pooled QC sample. Finally, 200 μL of the supernatant was used for the UHPLC–QTOF–MS analysis.

2.7. LC–MS/MS Analysis

LC–MS/MS analysis was performed on an UHPLC system (1290, Agilent Technologies, Santa Clara, CA, USA) with a UPLC BEH Amide column (1.7 μm, 2.1 × 100 mm, WatersMilford, MA, USA) combined with a TripleTOF 5600 system (Q-TOF, AB Sciex, Framingham, MA, USA). The mobile phase consisted of 25 mM NH4OAc and 25 mM NH4OH in water (pH = 9.75) (A) and acetonitrile (B), and the elution gradient was as follows: 0 min, 95% B; 7 min, 65% B; 9 min, 40% B; 9.1 min, 95% B; 12 min, 95% B. The flow rate was 0.5 mL/min, and the injection volume was 3 μL. The Triple TOF mass spectrometer was used to obtain MS/MS spectra through information-dependent acquisition during LC–MS experiments. In this mode, the acquisition software (Analyst TF 1.7, AB Sciex, Framingham, MA, USA) can continuously evaluate the full scan survey MS data, as the MS/MS spectra are obtained on the basis of preselected criteria. In each cycle, 12 precursor ions with intensities greater than 100 were fragmented with a collision energy (CE) of 30 V (15 MS/MS events with a product ion accumulation time of 50 millisecond each). ESI source conditions were set as follows: ion source gas 1, 60 Psi; ion source gas 2, 60 Psi; curtain gas, 35 Psi; source temperature, 650 °C; and ion spray voltage floating, 5000 V or −4000 V in positive or negative modes, respectively.

2.8. Data Preprocessing and OPLS-DA

We used ProteoWizard to convert MS raw data files into the mzXML format and processed them by R package XCMS (version 3.2). The preprocessing results generated a data matrix consisting of the retention time (RT), mass-to-charge ratio (m/z) values, and peak intensity. After XCMS data processing, R package CAMERA was used for peak annotation, and metabolites were identified using the in-house MS2 database.
OPLS-DA was used to analyze the data. The prediction parameters of the evaluation model were R2X, R2Y, and Q2, where R2X and R2Y represent the interpretation rate of the model and the X and Y matrixes, respectively, and Q2 represents the prediction ability of the model. The model is more stable the closer the three indicators are to 1. The model can be considered valid if Q2 > 0.5 and excellent if Q2 > 0.9. For samples with biological replicates, the p-value of Student’s t-test and the VIP value of the OPLS-DA model were combined to screen the differential metabolites. The criteria were p < 0.05 and VIP > 1.

2.9. DNA Constructs and Plant Transformation

To obtain a recombinant vector for the overexpression assay in transgenic Arabidopsis, we PCR amplified the full-length cDNA of HuPR-1 using the primer pair HuPR-1-F and HuPR-1-R (Table S1) by PCR. Then, the PCR product was cloned into the BglII and SpeI sites of the pCAMBIA1302-v plasmid (modified from pCAMBIA1302) by homologous recombination, with an expression cassette controlled by the CaMV 35S promoter. The construct was sequenced correctly and transferred into Agrobacterium tumefaciens strain GV3101, and the positive clone was selected and cultured. The T-DNA region containing the HuPR-1 and NPTII expression cassette was transformed into Arabidopsis using the floral dip method. Seeds of the T1 and T2 generations were germinated on MS agar medium containing 50 mg/L kanamycin to obtain homozygous lines [25]. Positive transgenic plants were selected according to the segregation ratio (sensitive: resistant = 1:3) and were confirmed by genomic PCR with the primer pair 1302-F/1302-R. The expression levels of HuPR-1 were detected using qRT-PCR analysis as described above [25].

2.10. HS Tolerance Assays in Transgenic Arabidopsis

WT and transgenic seeds were germinated simultaneously on MS medium plates. Plants of each genotype were planted in a greenhouse as mentioned above. For the survival assay, 7-day-old seedlings were heat-treated at 44 °C for 2 h, then returned to 22 °C to grow for 2 days, then photographed, and survival rates were calculated. More than 40 plants of each line were analyzed.

2.11. Statistical Analysis

All the experiments in this study were repeated three times, and the data were expressed as mean ± SD. Differences between each transgenic line and WT plants were assessed by Student’s t-test in Excel (Microsoft Office 2010). Asterisks indicate significant differences (* p < 0.05, ** p < 0.01).

3. Results

3.1. Sequencing and De Novo Assembly of the Pitaya Transcriptome

Nine transcriptome libraries were constructed using Poly-A+ RNA isolated from three-month-old red pitaya seedlings showing normal growth under control conditions (28 °C) or heat treatment (42 °C). These transcriptome libraries were sequenced using the Illumina HiSeqTM 2500 platform, and 78,871,914 paired-end raw reads were generated. The high-quality reads were assembled into 73,589 transcripts with an average length of 2141 bp and an N50 value of 2848 bp by Trinity software. The total sequence length was 96.3 Mb, and the transcript length range was 206–40,937 bp (Table 1 and Table S2).
In total, 16,856 unique transcripts were successfully mapped to 6215 protein sequences in the Swiss-Prot database, which was associated with 427 species. The species with the most hits was Arabidopsis thaliana (66.2%), followed by Oryza sativa subsp. japonica (3.8%), Homo sapiens (2.7%), and Nicotiana tabacum (2.4%) (Figure 2 and Table S3). This result indicates that red pitaya is closely related to Arabidopsis thaliana, as expected. Similar results were obtained after performing a query against the NCBI RefSeq RNA database, and 17,194 transcripts were successfully mapped (Table S4).
Nine transcripts were randomly selected for sequencing to confirm the sequence assembly. The coding sequence (CDS) length ranged from 594 bp to 1572 bp. The amplified CDS regions showed a 99–100% identity with their associated pitaya transcripts (Table S5).

3.2. Identification of Differentially Expressed Genes (DEGs) under HS

We identified 845 DEGs between the control and heat-treated samples under the 24 h treatment, and 788 DEGs between the control and heat-treated samples under the 72 h treatment. The expression of 329 and 446 genes was upregulated, and that of 516 and 342 genes was downregulated after 24 h and 72 h of high temperature stress, respectively (Figure 3A,B). Following heat treatment, the expression of 122 transcripts was induced at 24 h and 72 h, and the expression of 76 transcripts was suppressed (Figure 3A,B). To obtain an integral transcriptional profile of the different expressed transcripts under different phases of heat stress, we performed the hierarchical clustering analysis and found that heat stress affected the transcriptional profiles and the number of downregulated/upregulated genes (Figure 3C). Photosynthesis is one of the physiological processes most sensitive to heat. Under HS, the photochemical reaction in the thylakoid sheet and the carbon metabolism in the chloroplast matrix are vulnerable to damage [44,45]. HS disrupts the thylakoid membrane, thereby inhibiting the activities of the membrane-associated electron carriers and enzymes and reducing the rate of photosynthesis [46]. In our study, several DEGs related to the electron carriers and enzymes in the photosynthesis pathway were identified (Table 2).
Transcription factors (TFs) play a significant role in plants response to HS by regulating the expression of target genes. The major TFs identified from the DEGs involved in the response to HS in this study included 15 HSPs, 8 MYBs, 5 AP2/ERFs, 3 HSFs, 2 bZIPs, and 1 MBF1C gene (Table S6); the expression of seven MYB TFs was suppressed (Table 3), and the expression of 13 HSPs was induced (Table 4).
To verify the RNA-Seq data, we randomly chose seven contigs (genes) from the dataset and verified them by qRT-PCR. The qRT-PCR results showed that the patterns of expression of the selected contigs were consistent with the RNA-Seq dataset (Figure S1). These findings confirm the reliability of the obtained data.
To investigate the mechanisms underlying the expression of DEGs in response to HS, we analyzed their functions through Gene Ontology (GO) analysis. A total of 1434 DEGs were mapped to 888 protein sequences in Swiss-Prot, of which 546 DEGs were uncharacterized transcripts (Table S7). These DEGs were assigned to three classes (molecular function, biological process, and cell component) of GO categories (Table S7 and Figure S2). Among the classified GO groups, the terms such as catalytic activity (GO:0003824), metabolic process (GO:0008152), and cell part (GO:0044464) were dominant in each of the three main categories (Figure S2). We also observed a high level of enrichment of genes in the following functional groups: binding (GO:0005488), cellular process (GO:0009987), response to stimulus (GO:0050896), and organelle (GO:0043226) (Figure S2).
The Kyoto Encyclopedia of Genes and Genomes (KEGG) pathway analysis provided insight into the complex biological functions of these genes under HS. DEGs in the heat treatment were significantly enriched in the following pathways: “metabolic pathways,” “biosynthesis of secondary metabolites,” “carbon metabolism,” “biosynthesis of antibiotics,” and “protein processing in endoplasmic reticulum” (Figure 4, Table S8). These DEGs were also enriched in “photosynthesis,” “MAPK signaling pathway,” and “plant hormone signal transduction” (Figure 4, Table S8). The above results showed that red pitaya undergoes complex metabolic and enzymatic reactions under HS.

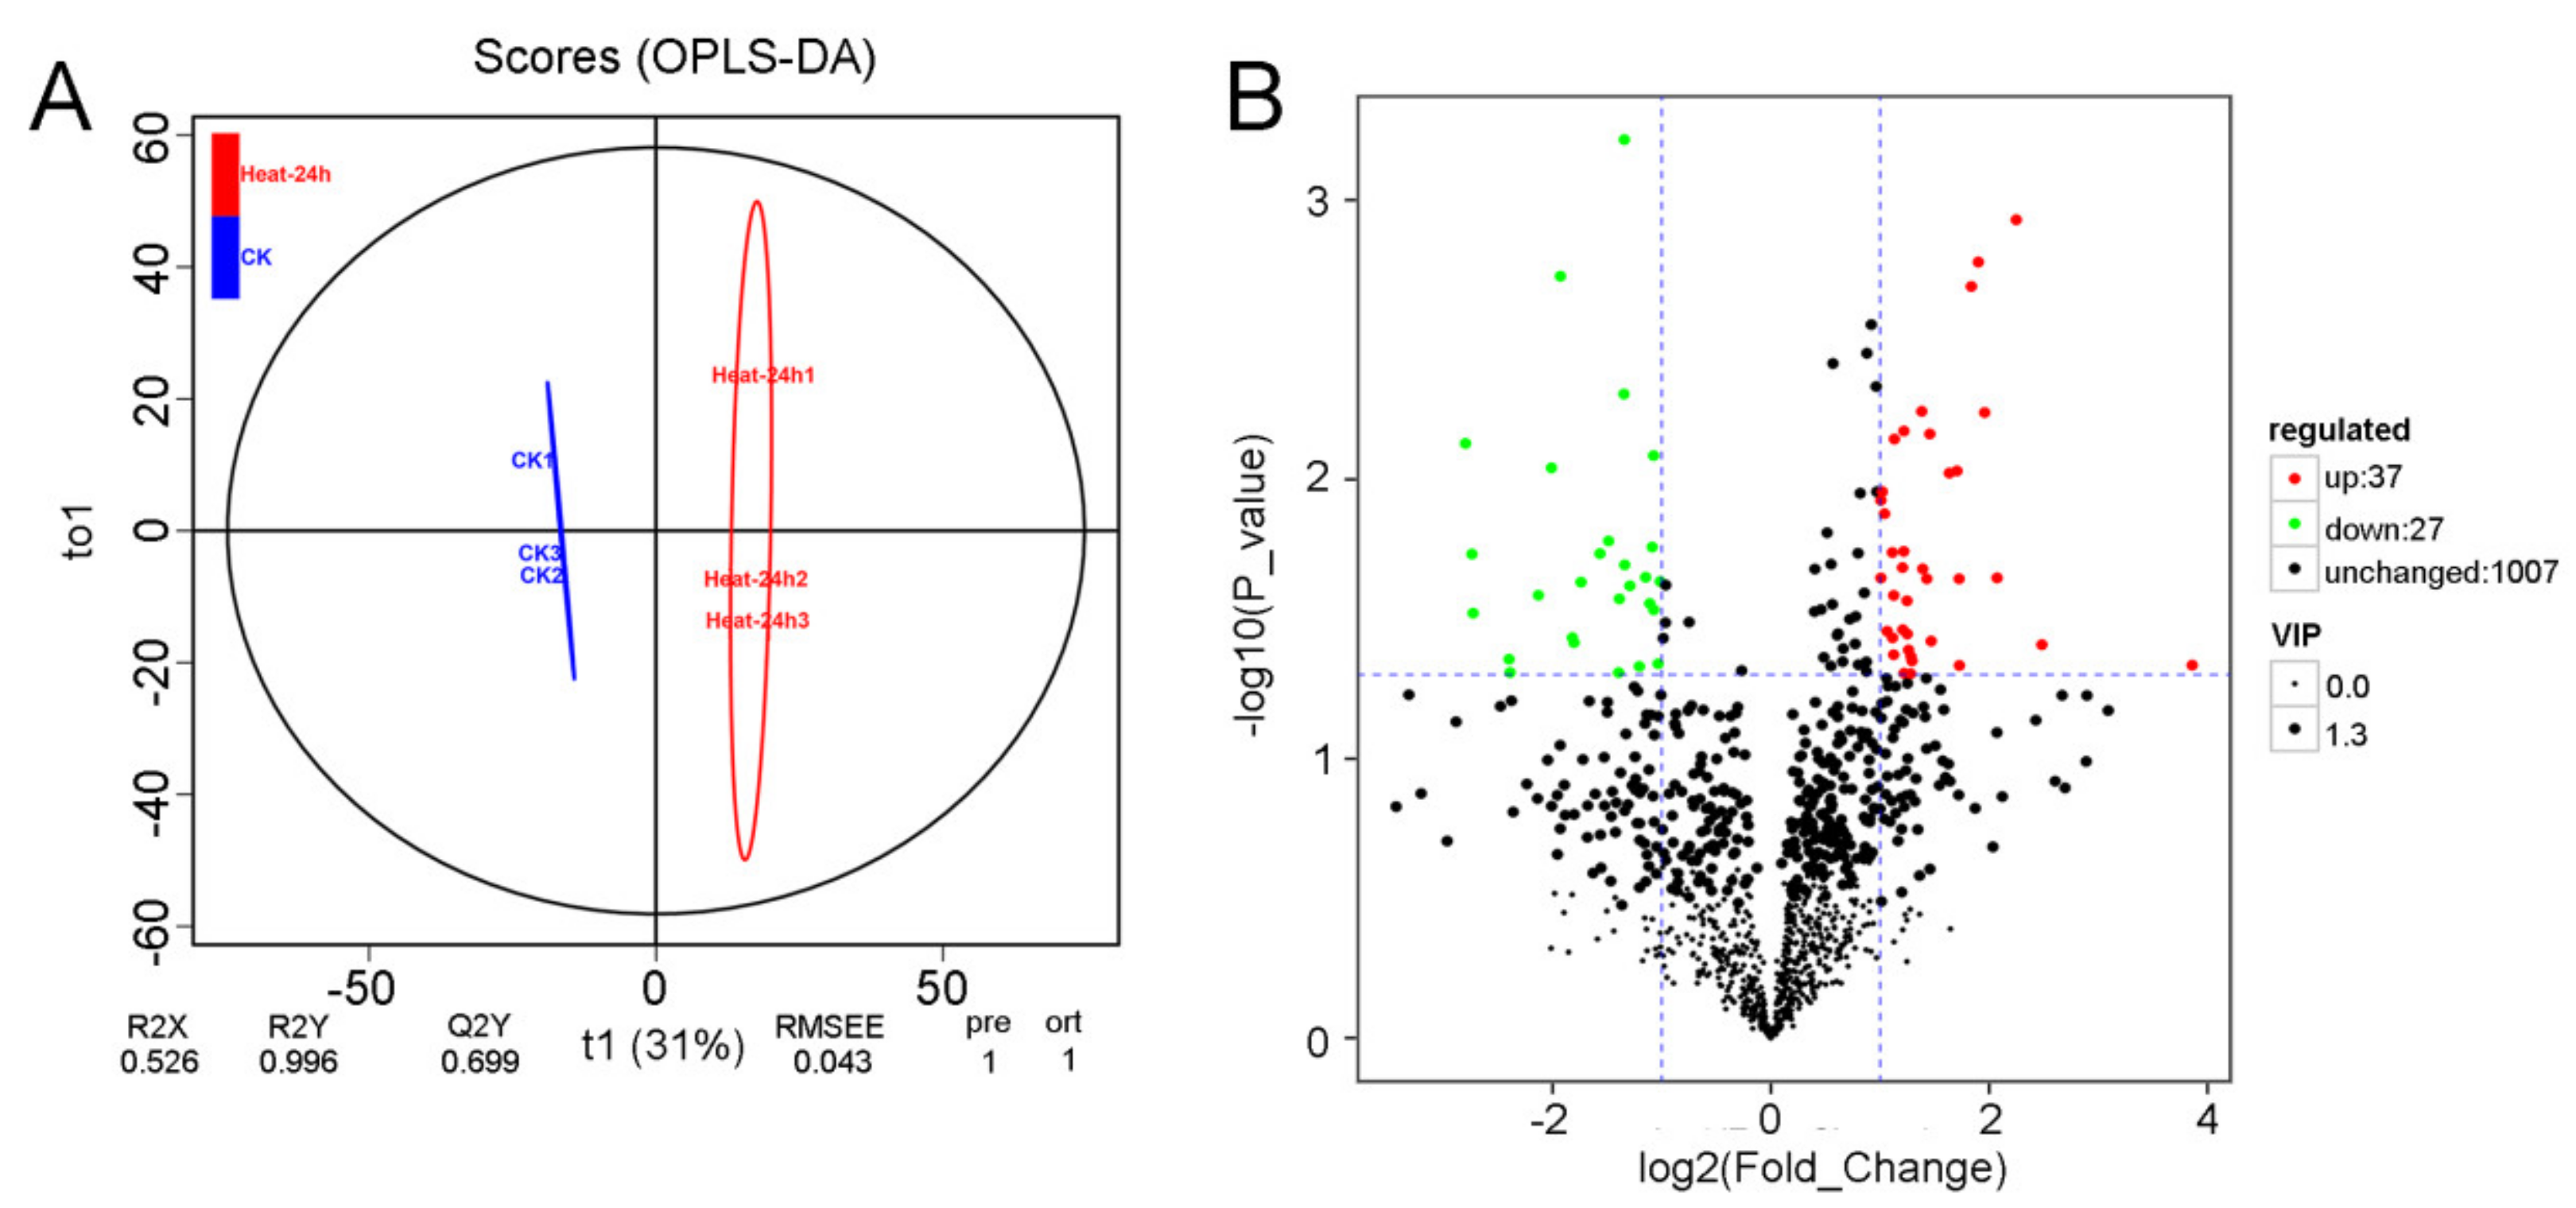
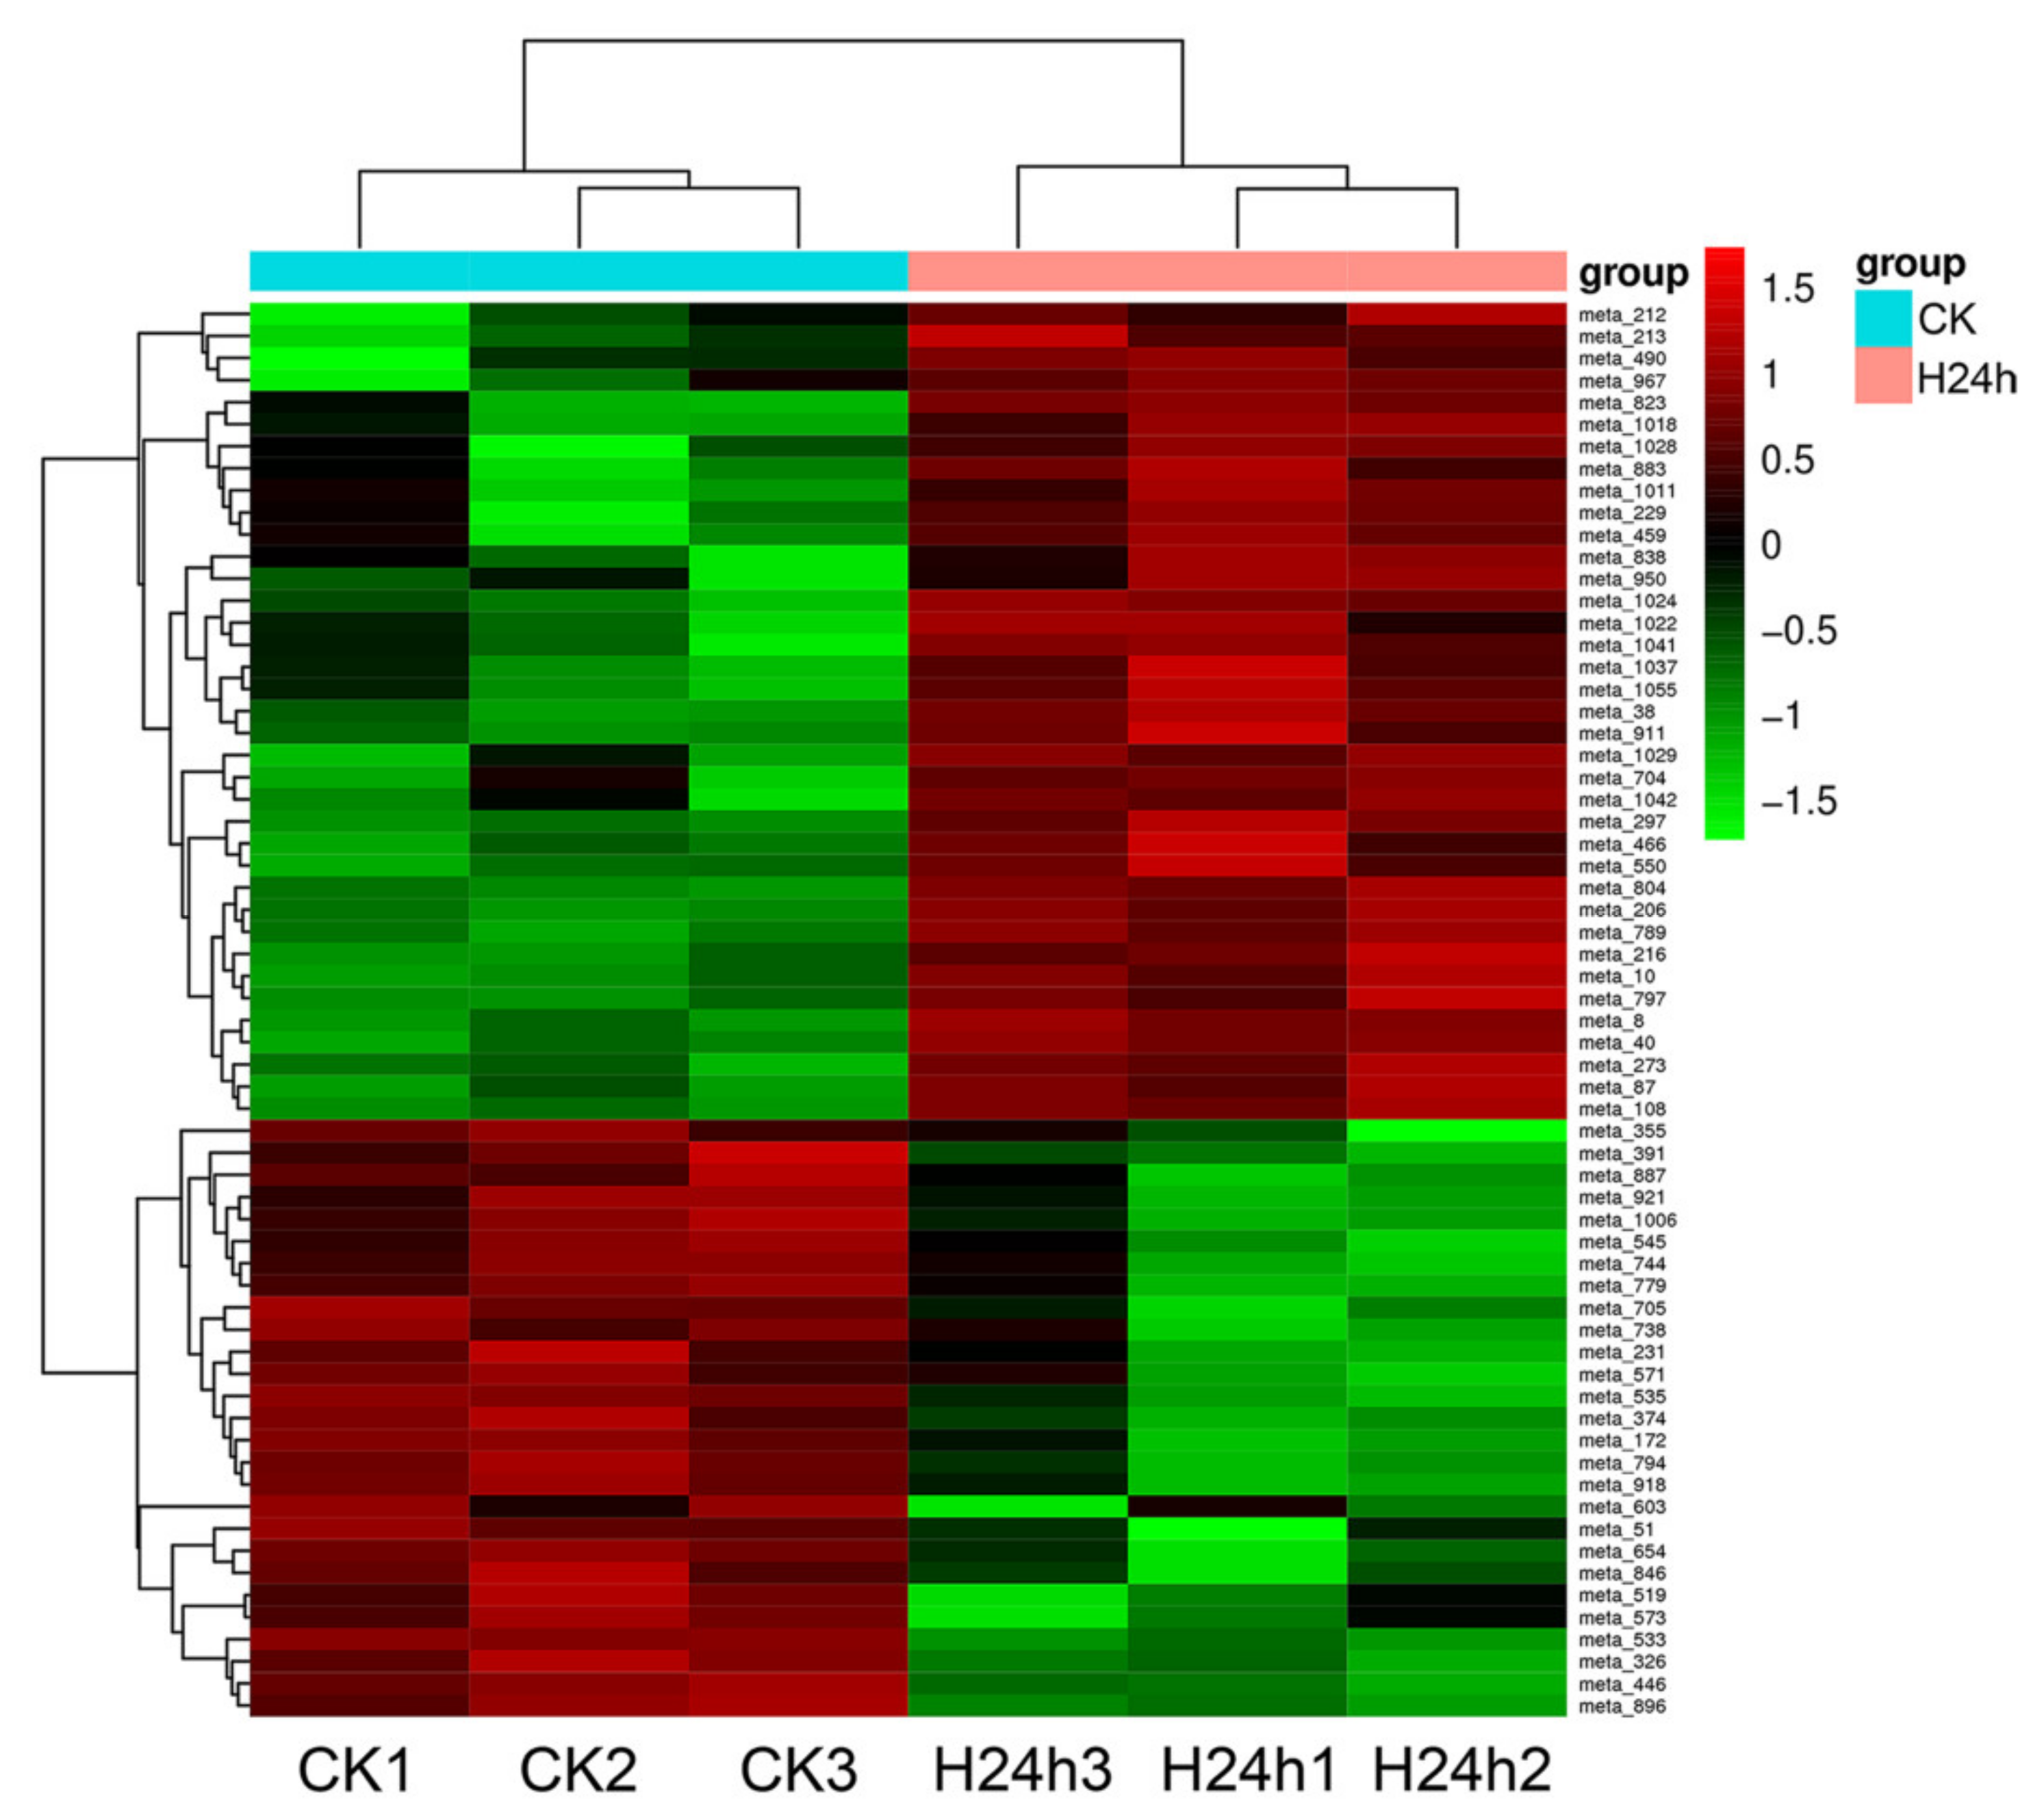
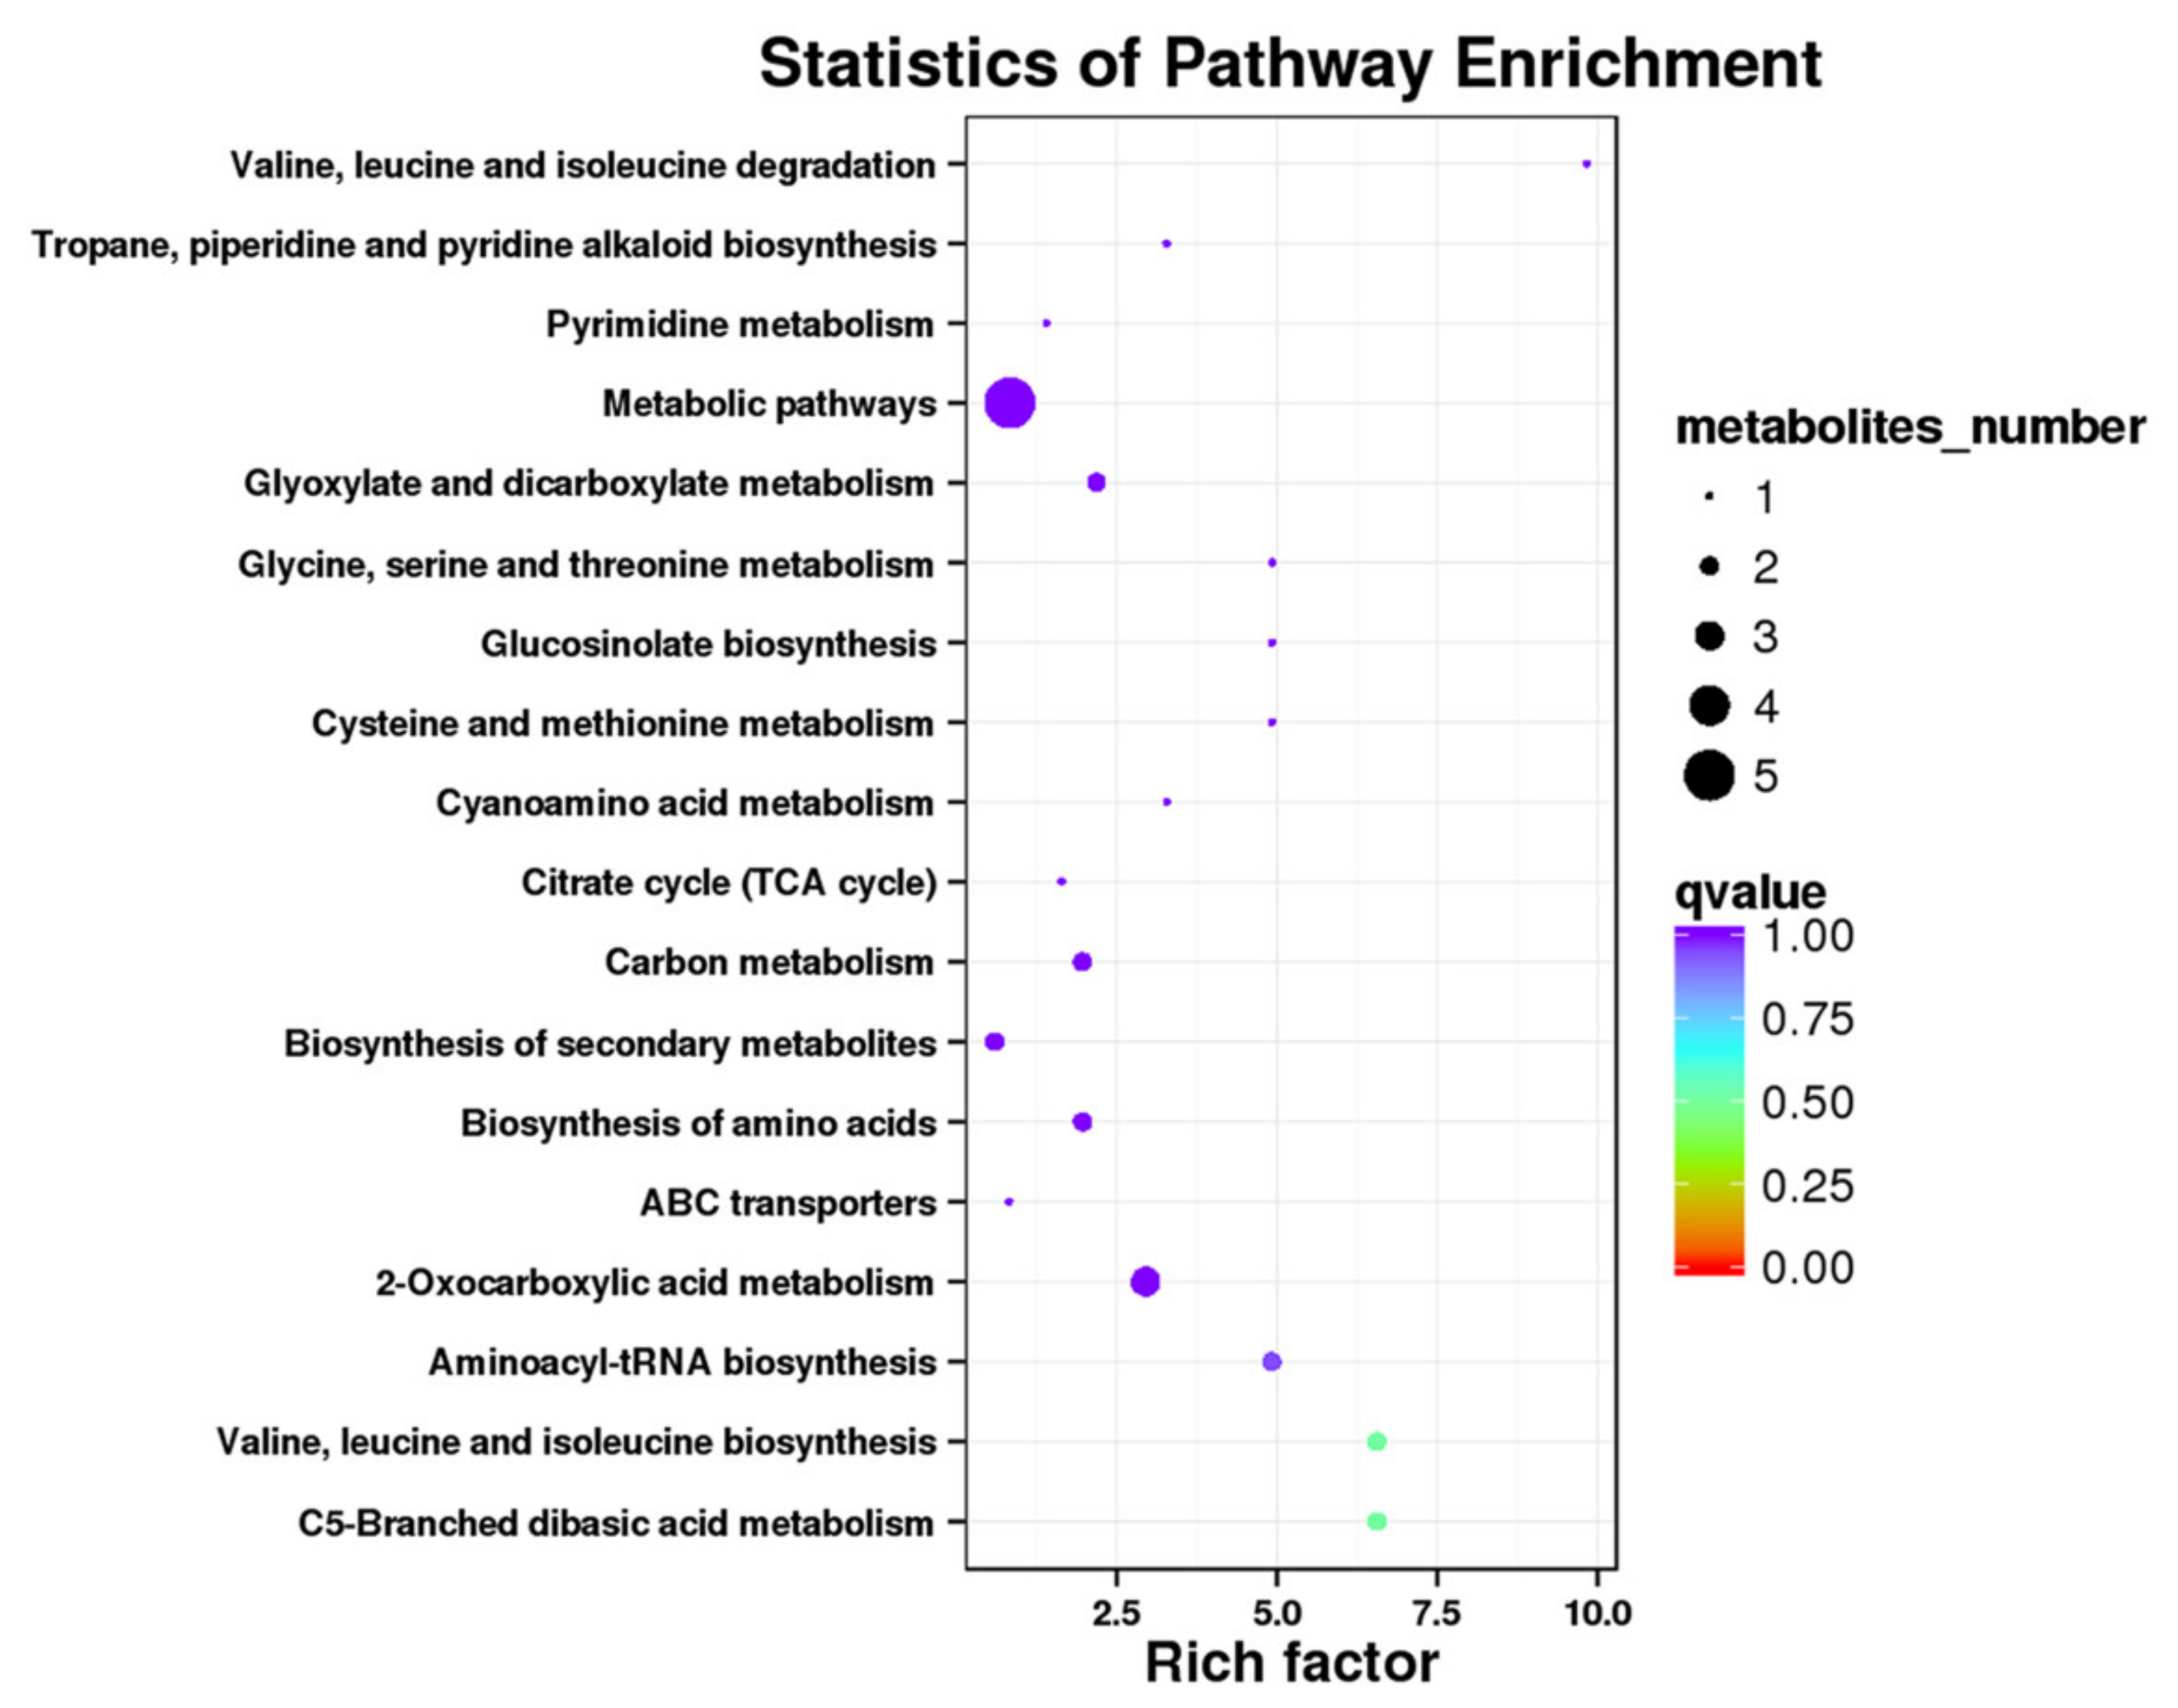
3.3. Analysis of the Metabolites in Red Pitaya Seedlings under HS

Metabolic pathway analysis can provide insights into the main biochemical and signal transduction pathways involved in the response of red pitaya to HS. To identify the metabolites in response to heat treatment, we compared the metabolic profiles between normal pitaya seedlings and seedlings subjected to heat treatment for 24 h using LC–MS/MS. We detected a total of 1071 metabolic peaks, with 450 non-target metabolites and 621 target metabolites (Table S9). In the orthogonal projections to latent structures discriminant analysis (OPLS-DA) model, the score (T1) of the main component in the OSC process was 31% (Figure 5A). Compared with the control group (CK), 64 metabolites (37 upregulated and 27 downregulated) were identified to be differentially accumulated under HS (Figure 5B, Table S9). We also generated a heatmap of all differentially accumulated metabolites under HS to display changes in metabolites compared with CK group (Figure 6). Metabolites that increased in content mainly included meta_206, meta_40, meta_10, and meta_8, which represented glycerol tributanoate, cis-aconitate, L-isoleucine, and mesaconic acid, respectively. However, some metabolites were unmapped, including meta_1028, meta_1029, and meta_1037 (Table S9).
To obtain a better understanding of the characteristics of the compounds involved in metabolic processes, we conducted a KEGG enrichment analysis for the detected metabolites. The differentially accumulated metabolites were mapped to different pathways (Table 5 and Table S9). Among these pathways, “metabolic pathways (ko01100),” “biosynthesis of secondary metabolites (ko01110),” “2-oxocarboxylic acid metabolism (ko01210),” “carbon metabolism (ko01200),” and “biosynthesis of amino acids (ko01230)” were the top five enriched pathways (Figure 7).

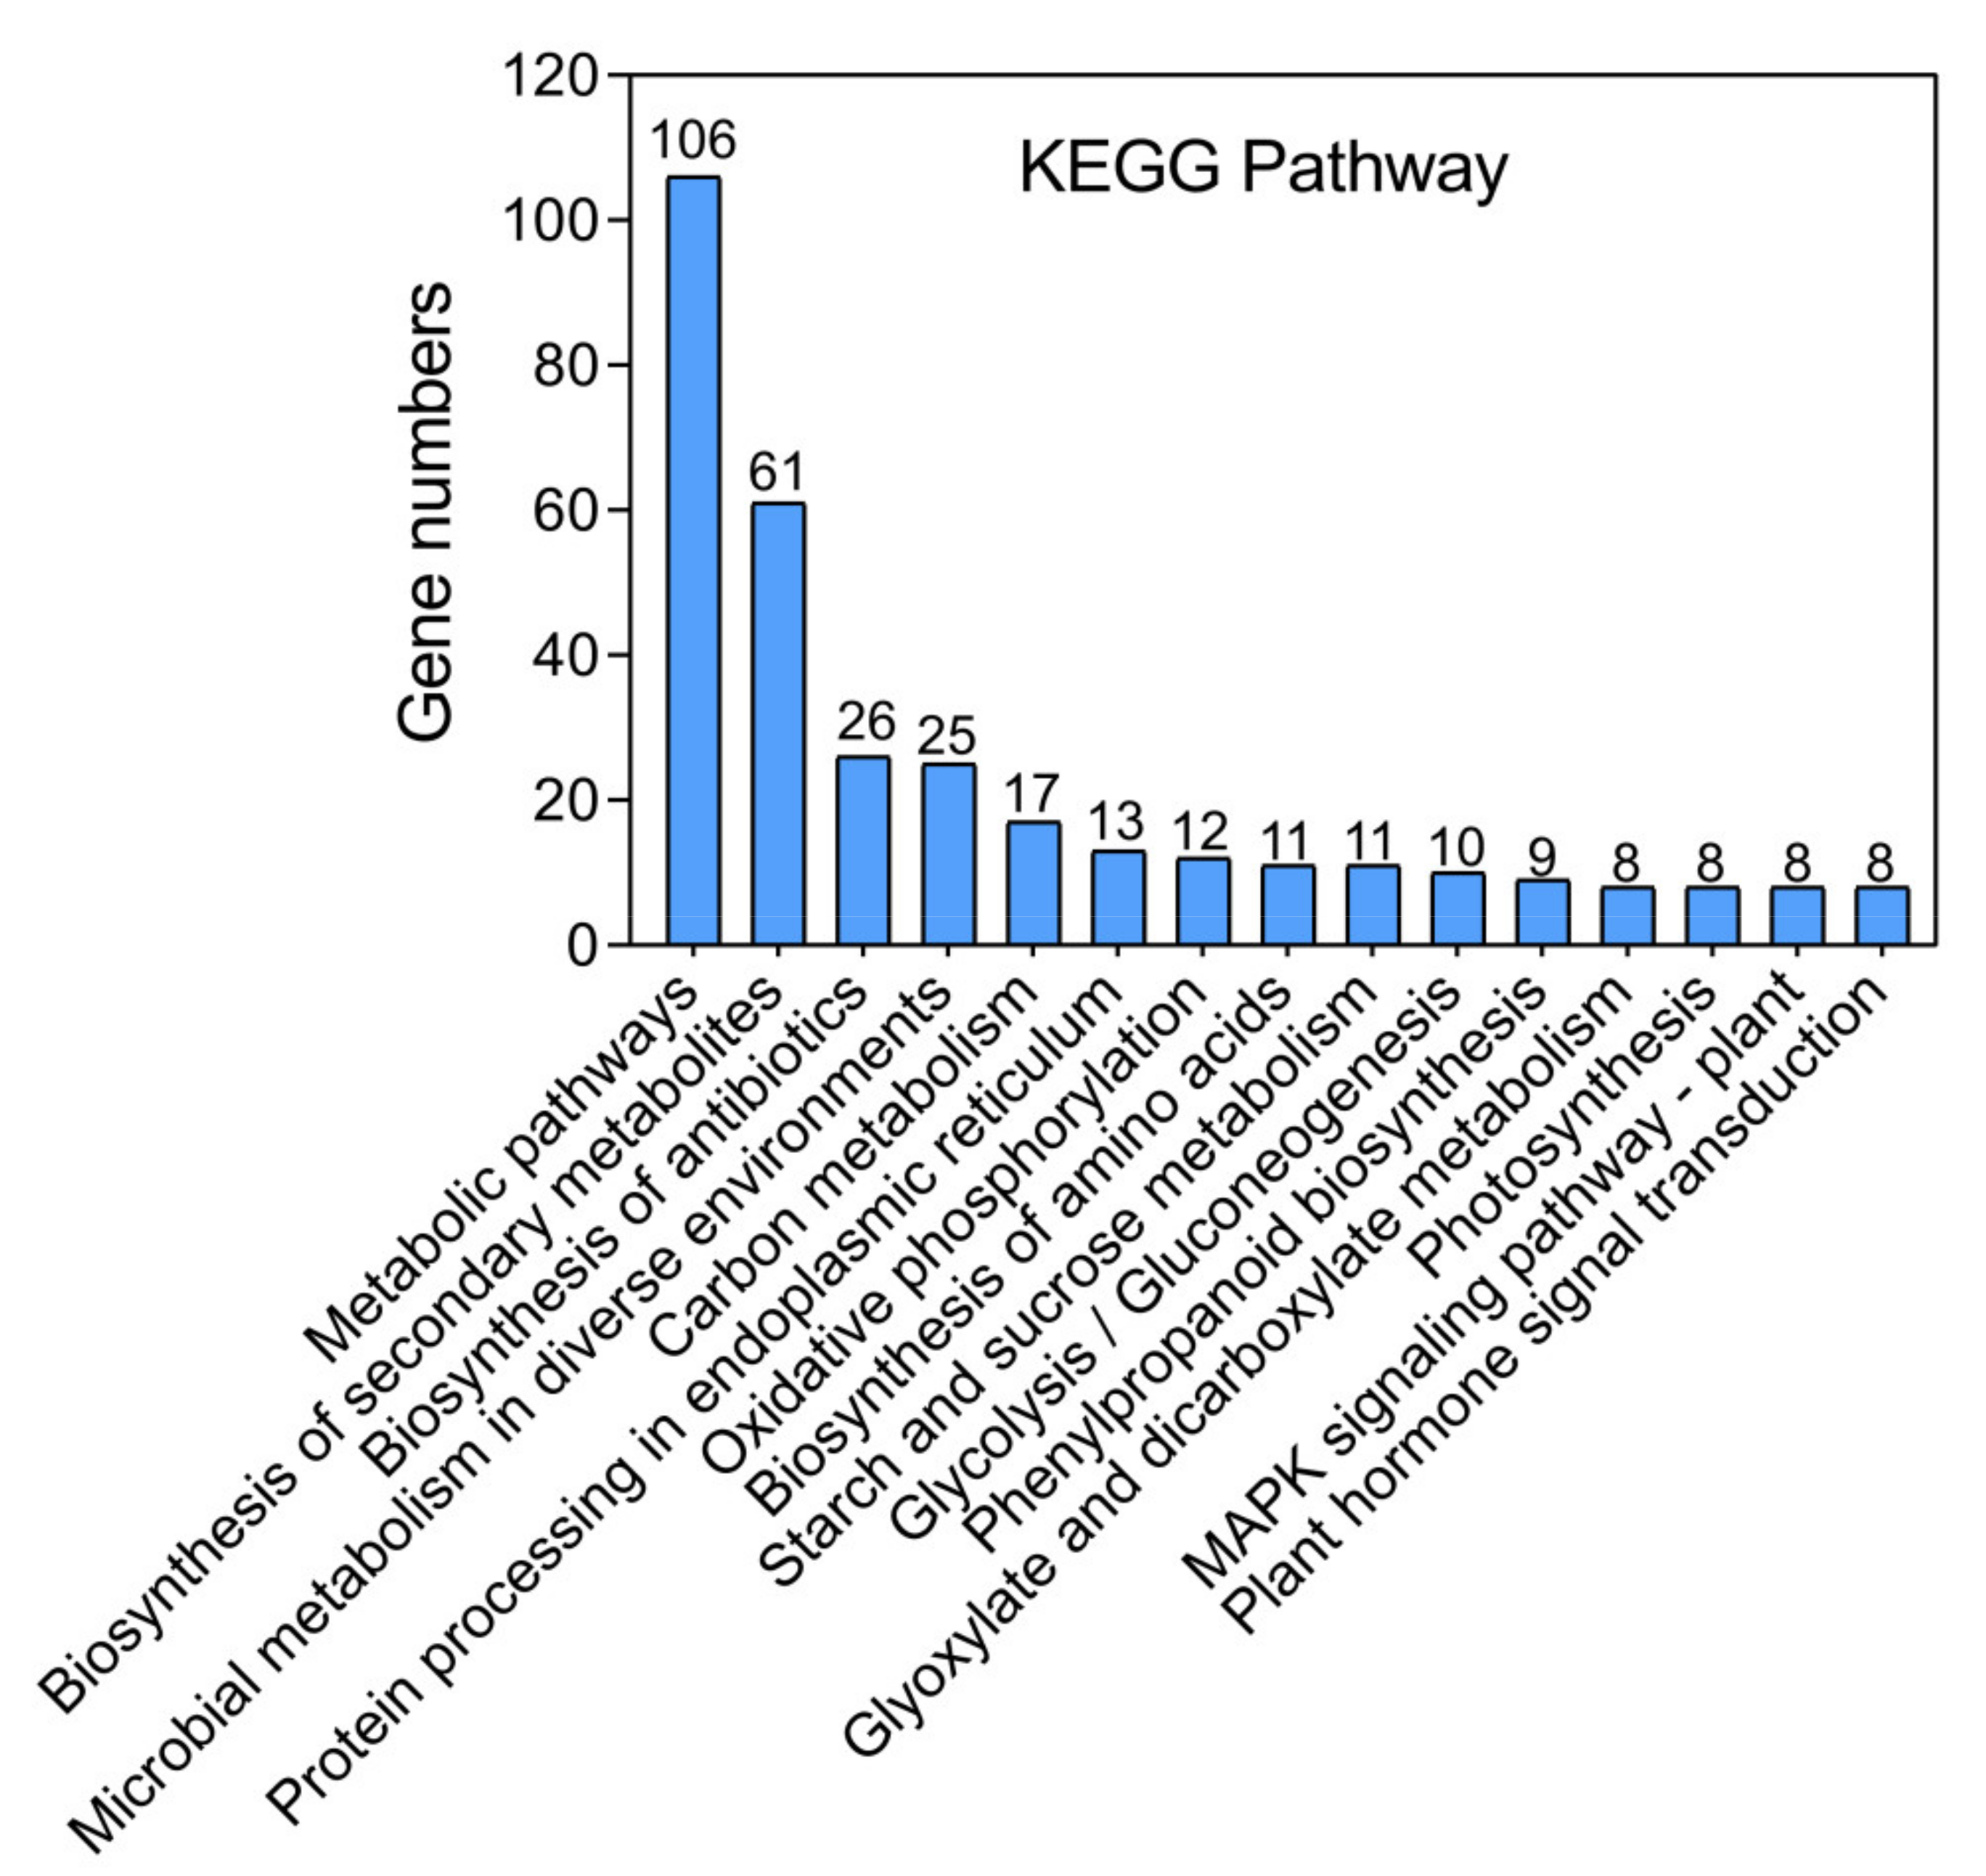
3.4. Interaction Network Analysis between Heat-Regulated Genes and Metabolites

Gene–metabolite interaction networks can provide insight into the functional relationships between genes and metabolites and aid in the identification of new regulatory elements [47]. The KEGG analysis showed that the top three pathways were metabolic pathways (ko01100), biosynthesis of secondary metabolites (ko01110), and carbon metabolism (ko01200) (Table S9). Metabonomic analysis revealed that the known differential compounds mainly included meta_40 (cis-aconitate), meta_10 (L-Isoleucine), meta_8 (mesaconic acid), meta_51 (3-phosphoserine), and meta_212 (uridine). Metabolites are the final products of cell activities that directly reflect the effects of environmental changes or physiological and pathological changes on plants. In this study, meta_40 (cis-aconitate) accumulated under HS, which is localized in mitochondria and is an intermediate product of the isomerization of citric acid to isocitrate (ko00020 and ko00630) by aconitase hydratase. The KEGG analysis showed that contig582 (ACOC) encoded aconitate hydratase (ACO; aconitate hydratase (EC: 4.2.1.3)) in the citrate cycle (TCA cycle) and was upregulated under HS (Table S6). Therefore, the expression of the aconitic acid hydratase gene contig582 was upregulated under HS; this gene promotes the conversion of citric acid to isocitric acid and thus increases the accumulation of the intermediate product cis-aconitic acid. Meta 40 also participates in other important pathways, including the biosynthesis of secondary metabolites (ko01110), metabolic pathways (ko01100), 2-oxocarboxylic acid metabolism (ko01210), C5-branched dibasic acid metabolism (ko00660), and glyoxylate and dicarboxylate metabolism (ko00630). These findings indicated that cis-aconitate may play an important role in response of red pitaya to HS through its effects on different pathways. The content of other metabolites was also altered under HS, such as meta_51 (3-phosphoserine), which participates in glycine, serine, and threonine metabolism (ko00260). The content of 3-phosphoserine decreased under HS, and affected the expression of the downstream gene contig28686, which encodes trpB (tryptophan synthase β chain, (EC: 4.2.1.20)) and catalyzes the transformation of serine to L-tryptophane. We also found several other genes upregulated in this signaling pathway, but their roles in the response to HS remain unclear. The expression of contig11990 (ODBA1, 2-oxoisovalerate dehydrogenase subunit α1) was upregulated under HS in valine, leucine, and isoleucine degradation (ko00280) (Table S6), and the content of meta_10 (L-isoleucine) increased according to the metabolomic analysis; thus, HS might lead to an increase in the content of L-isoleucine and induce the expression of the downstream gene contig11990.

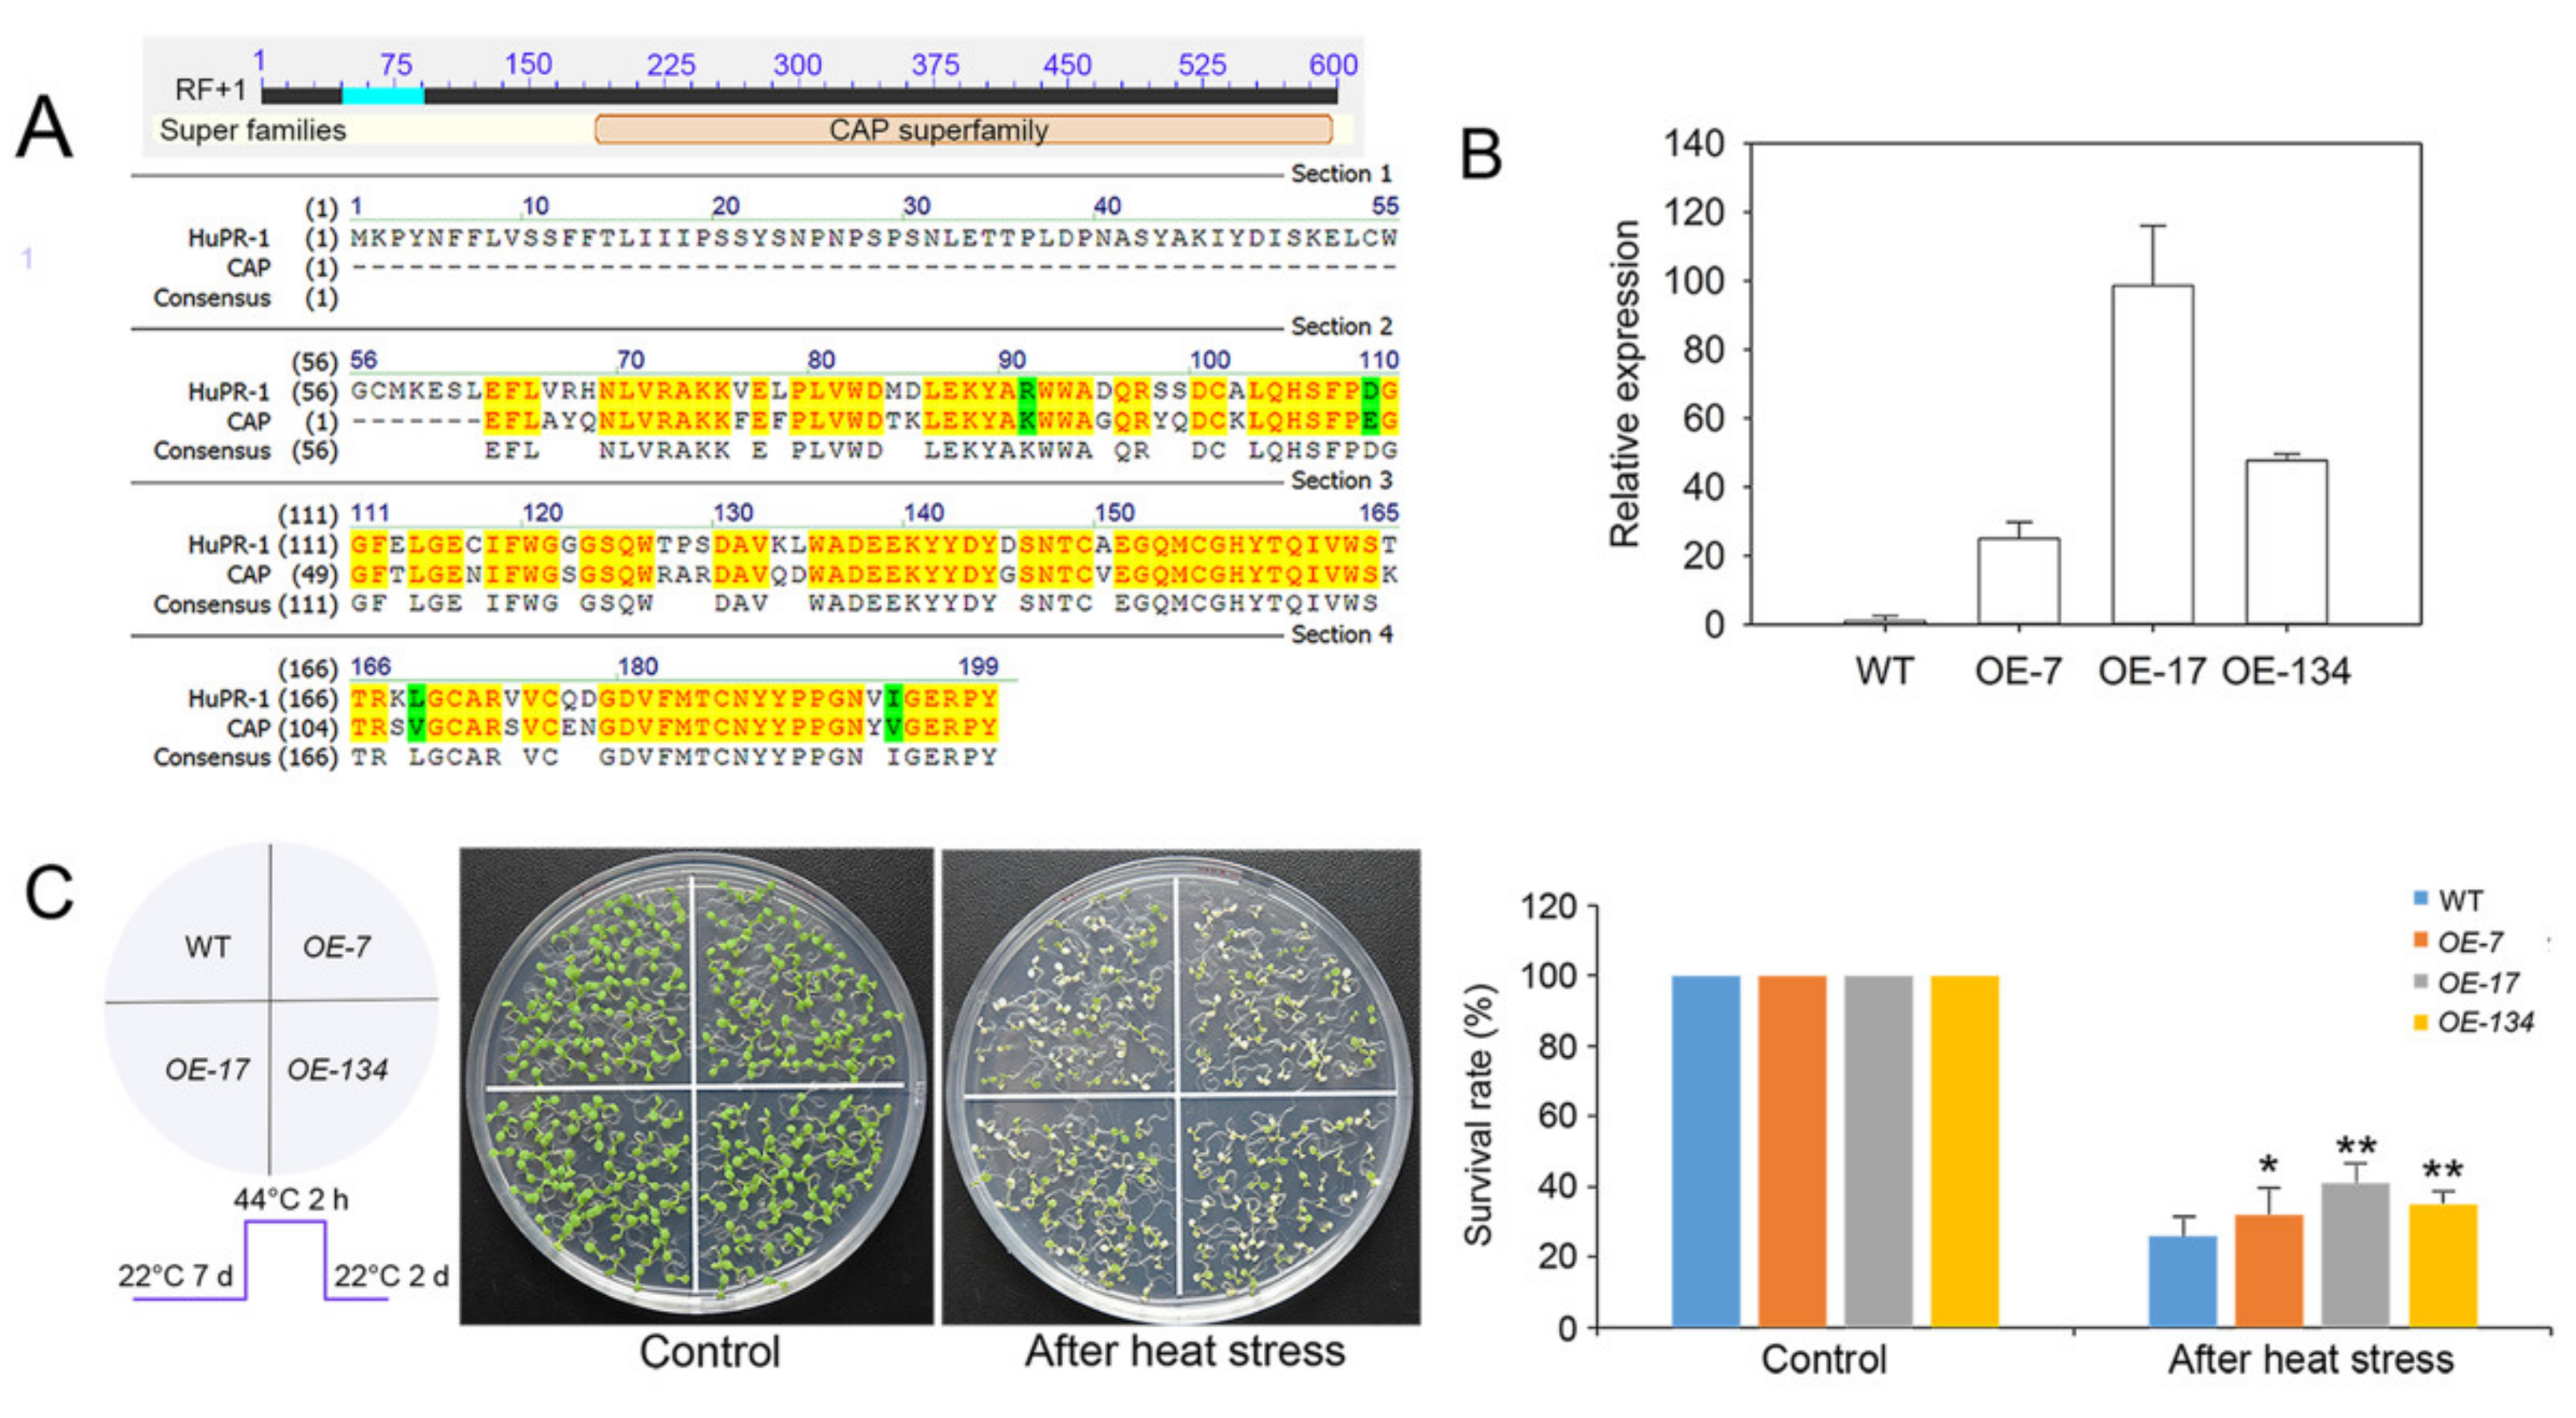
3.5. Overexpression of HuPR-1 in Arabidopsis Increased Heat Tolerance

To verify the genes upregulated in the response of red pitaya to HS, we selected the candidate gene contig10820 for functional verification; this gene is also upregulated in response to salt stress according to the salt transcriptome database [37]. The expression of contig10820 was increased by 3.47 times when induced by high temperature and increased by 3.01 times when induced by salt. The CDS of contig10820 is 594 bp and is a homolog of PR-1 (pathogenesis-related protein 1) family genes. On the basis of the Pfam database, we found that HuPR-1 contained the CAP superfamily (cysteine-rich secretory proteins, antigen 5, and pathogenesis-related 1 proteins (CAP)) domain structure (PF00188) (Figure 8A). To determine its biological function, we generated transgenic Arabidopsis plants overexpressing HuPR-1 that were driven by the CaMV 35S promoter. Three homozygous T3 lines (OE-4, OE-17, and OE-134) were selected for HuPR-1, and qRT-PCR was performed. HuPR-1 was highly expressed in all transgenic Arabidopsis lines (Figure 8B), and they were used for phenotypic analyses (Figure 8C). For the survival assay under HS, 7-day-old seedlings of wild type (WT) and transgenic lines were heat-treated at 44 °C for 2 h, and then recovered under normal conditions (22 °C) for 2 days (Figure 8C). The survival rates of all transgenic lines were significantly higher than those of WT plants (Figure 8C). These data indicated that HuPR-1 may play a critical role in the response of pitaya to HS.

4. Discussion

Temperature is one of the most significant factors limiting plant growth and development. When plants are subjected to HS, the transcription and translation of proteins involved in normal metabolic activities are reduced, and the synthesis of HSP proteins is stimulated; in addition, osmotic adjustment substances, such as inorganic ions, soluble sugars, proline, and betaine, accumulate to decrease heat-induced injury [48]. In this study, the response of red pitaya to HS was explored.

4.1. Roles of Heat-Responsive TFs

Previous studies have shown that HS signals are transduced through multiple signaling pathways to activate TFs, which induces the expression of many HSPs and other HS-responsive genes to respond to HS. TFs have an important effect on the response of plants to HS by regulating the expression of target genes. Studies have showed that there are more than 50 TFs families in plants, of which AP2/EREBP, NAC, MYB, WRKY, bHLH, HSF, and bZIP, are mainly involved in the response of plant to abiotic stress. AP2/EREBP is a large family of TFs found in plants, among which DREBs belong to the EREBP subfamily and participate in the response of plants to different abiotic stresses. For example, rice OsDREB2B and maize ZmDREB2A are induced to express in response to high temperature stress [49,50]. WRKYs is a kind of plant-specific transcription factor. WRKY protein can positively regulate the heat tolerance of plants. For instance, CaWRKY40 participates in plant response to high temperature stresses in pepper, and rice OsWRKY11 participates in resistance to heat shock stress [51,52]. NACs is also one of the plant-specific and largest transcription factor family, and involved in multiple processes in response to abiotic stress. Among them, wheat TaNAC2L can improve heat tolerance by regulating the expression of stress response genes [53].
The major TFs identified from the DEGs involved in response to HS in this study included MYBs (8), AP2/ERFs (5), bZIPs (2), MBF1C (1), HSPs (15), and HSFs (3), indicating that these TFs play a key role in response to HS. MBF1C is a highly conserved transcriptional coactivator and a key regulator of heat resistance. The expression of DREB2A and HSFBs under HS was reduced in an mbf1c mutant [54]. MYB TFs occur in all eukaryotes. MYBs are known to be involved in plant development, metabolism, and stress responses. To date, AtMYB68, LeAN2, and OsMYB55 have been proposed to play an essential role in heat tolerance. In Arabidopsis, compared with WT plants, the Atmyb68 mutant was significantly inhibited in vegetative growth at high temperature [55]. The overexpression of LeAN2 in tomato resulted in anthocyanin accumulation and enhanced tolerance to HS by maintaining low levels of reactive oxygen species and high non-enzymatic antioxidant activity [56]. Overexpression of OsMYB55 improves the tolerance of rice plants to high temperature by increasing the expression of the downstream genes OsGS1;2, GAT1, and GAD3, which are involved in amino acid metabolism [57]. In addition, transgenic Arabidopsis plants overexpressing TaMYB80 showed enhanced tolerance to heat and drought stress, which might be due to the increased levels of cellular ABA [58]. In Arabidopsis, MYB30 regulates the response to HS through ANNEXIN (ANN)-mediated cytosolic calcium signals [59]. MYB30 binds to the promoters of ANN1 and ANN4 and inhibits their expression. Hereafter, ANNs regulate the increase in heat-induced [Ca2+]cyt, triggering downstream responses to HS, and contig25252, which encodes MYB30, was also upregulated in our study. The expression of seven other MYB TFs was markedly inhibited by HS (Table 3 and Table S6), indicating that they may play negative regulatory roles in response to HS.
HSPs are known to play key roles in protecting the cell metabolic apparatus as well as the response of plants to HS [1]. In this study, HSPs were markedly induced by HS (Table 4 and Table S6). The overproduction of Hsp70 confers resistance to heat and other types of abiotic stress in Arabidopsis [60]. Mitochondrial Hsp70 may suppress programmed cell death of rice protoplasts by inhibiting the amplification of reactive oxygen species [61]. In this study, the mRNA levels of contig13847, which belongs to the Hsp70 gene family, were increased after heat treatment. HSFs are the terminal components of signal transduction and mediate the expression of HSPs and other HS-induced transcripts [62,63]. In addition, two DEGs (contig26416 and contig26417) belonging to the HSF family were upregulated in this study. HsfA2 plays an important role in preventing oxidative damage and cell death in plant organelles and is vital regulators of plant stress responses [64]. Overexpression AtHsfA2 not only improved heat resistance but also improved the resistance to oxidative stress and hypoxia caused by salt [65]. Overall, the findings of this study enhance our understanding of the roles of HSPs and HSFs in response to HS in pitaya.

4.2. Mechanism Underlying the Response of Red Pitaya to HS

Various physiological processes, such as photosynthesis, respiration, transpiration, membrane thermostability, and osmotic regulation, are all adversely affected by HS. We conducted a comprehensive analysis of the transcriptome and metabolome to elucidate the regulatory networks of red pitaya involved in response to HS. The differential expressions of the most common heat-responsive genes were related to metabolic pathways (106 genes), biosynthesis of secondary metabolites (61 genes), carbon metabolism (17 genes), and biosynthesis of amino acids (11 genes) according to the KEGG analysis; similar results were also obtained from our analysis of metabolome data (Table S10). Meanwhile, the top 20 differentially expressed genes (Table 2) are mainly involved in photosynthesis and enzyme activity regulation in plant chloroplasts (such as contig32725, FER2; contig21847, PFE; and contig785, PFK3), and protein synthesis and activation of transporters (contig20699, contig2725, contig29974, etc.), which indicated that photosynthetic-related genes are more sensitive in response to heat stress.
Homeostasis, including the biosynthesis and compartmentalization of metabolites, is disturbed in plant tissues subjected to high temperatures [7]. Because heat tolerance is a polygenic trait, many biochemical and metabolic pathways are involved in the development and maintenance of heat tolerance, including antioxidant activity, membrane lipid unsaturation, gene expression and translation, protein stability, and the accumulation of compatible solutes [66]. In addition, flavonoids, anthocyanins, and plant steroids and other secondary metabolites play a considerable role in the response of plants to HS [1]. For example, HS in tomato plants causes the accumulation of soluble phenols; increases phenylalanine ammonia-lyase activity; and decreases the activity of peroxidase and polyphenol oxidase, which may be the mechanism of tomato plants to adapt to HS [67]. High temperature alters the activities of carbon metabolism enzymes, starch accumulation, and sucrose synthesis by downregulating specific genes involved in carbohydrate metabolism [10]. Moreover, “photosynthesis,” “MAPK signaling pathway,” and “plant hormone signal transduction” were also enriched (Figure 5, Table S8) according to the transcriptome analysis. Several lines of evidence suggest that plant growth regulators such as ABA, SA, ET, and BRs play a vital part in plant heat tolerance [62]. In tomato and Arabidopsis, brassinosteroids cause tolerance to heat stress by promoting the biosynthesis of major HSPs [68,69]. In sum, high temperatures have a negative impact on the photosynthesis, primary and secondary metabolism, and hormonal signal transduction and other physiological processes of red pitaya.

4.3. HuPR-1 Plays an Active Role in the Response to HS

The pathogenesis-related protein 1 (PR-1) gene family plays a significant part in response to biotic and abiotic stress in plants. To protect themselves against pathogens, plants have developed sophisticated mechanisms to adapt to their environment. Pathogenesis-related (PR) genes play essential roles in these mechanisms and are activated in response to pathogen attacks [70]. With their antifungal activities, PR-1 proteins are the main group of PR proteins induced by pathogens or salicylic acid. PR-1 genes also play vital roles in response to abiotic stress. In wheat, TaPR-1-1 expression is induced by freezing, salinity, and osmotic stress, and TaPR-1-1 overexpression confers tolerance to these different types of stress in yeast and Arabidopsis [71]. Di19 (drought-induced) upregulates the expression of pathogenesis-related PR-1, PR-2, and PR-5 genes in Arabidopsis [72]. Thirteen novel SlPR-1 genes were identified, each of which produce a protein belonging to the CAP superfamily in tomato, and drought stress leads to the upregulation of all SlPR-1 genes (as high as 50-fold) [70]. In this study, the expression of HuPR-1 was up-regulated up to 3.47-fold by HS (Table S6); the expression of this gene can also be induced by salt stress [37]. Overexpression of this gene greatly increased the tolerance of Arabidopsis to HS (Figure 8B,C), indicating that HuPR-1 plays an active role in response to heat and salt stress. In short, the findings of this study provide new insights into the regulatory mechanism of heat stress that could aid future studies to examine the role of PR-1 genes in response of plants to different types of abiotic stress.

5. Conclusions

We performed the transcriptomic and metabolomic analysis to characterize the molecular mechanism underlying the response of red pitaya to HS. The changes in numerous genes and metabolites indicated that the mechanisms involved in response to HS are complex and closely related in pitaya.

Supplementary Materials

The following are available online at https://www.mdpi.com/article/10.3390/genes12111714/s1, Figure S1: RNA-Seq dataset validation by using qRT-PCR. Seven DEG contigs (x-axis) were randomly selected from the RNA-Seq dataset and validated by qRT-PCR. The y-axis displays natural log2-transformed fold changes for both datasets. HuUBQ was used as the internal standard. Mean values and SDs of three biological replicates are shown. Figure S2: GO classifications of DEGs using the PANTHER database. The obtained 1434 annotated DEGs were divided into three GO categories: molecular function (A), biological process (B), and cellular component (C). The percentages shown are based on the numbers of genes in a given GO category. Table S1: Primers used in this study. Table S2: Dragon_fruit_rnaseq_count_heat_stress at 0, 24, and 72 h. Table S3: Dragon_fruit_trinity_combined_v2_fasta_cap_contigs_uniprot_annotation. Table S4: Dragon_fruit_trinity_combined_v2_fasta_cap_contigs_blastn. Table S5: CDS amplification and sequencing results for confirm the sequence assembly. Table S6: DEGs genes annotation. Table S7: All DEG pathways in KEGG KAAS-2. Table S8: All DEG pathways in KEGG-2. Table S9: N0_vs_N24 metabolites in this study. Table S10: Integrated analysis between differentially accumulated metabolites and DEGs.

Author Contributions

Z.J., W.X., and Q.N. performed the experiments. Z.J. and Q.N. analyzed the data. Z.J., W.X. drafted the manuscript. W.X. analyzed some data and performed the heat stress experiment in Arabidopsis. J.C. and H.L. helped in the sample collection. M.Z. (Mei Zhang) and S.J. helped in the analysis of data. M.Z. (Mingyong Zhang) helped to edit the manuscript. K.X. contributed to the experimental design and edition of the manuscript. Z.J. and W.X. contributed to writing—original draft preparation. All authors have read and agreed to the published version of the manuscript.

Funding

This research was supported by grants from the Guangdong Science and Technology Program (2019B121201005, 2019A1515011975); the Institution of South China Sea Ecology and Environmental Engineering, Chinese Academy of Sciences (no. ISEE2021ZD04); and the National Natural Science Foundation of China (31971816). The funding body had no role in study design, data analyses and interpretation, decision to publish, or preparation of the manuscript.

Institutional Review Board Statement

Not applicable.

Informed Consent Statement

Not applicable.

Data Availability Statement

The deep sequencing data of total RNA were submitted to NCBI Sequence Read Archive (SRA) with accession number Bioproject: PRJNA747865.

Acknowledgments

We thank Xia Junhong (J.X.) for his support in conducting the RNA-seq analysis, his comments, and his suggestions regarding the manuscript.

Conflicts of Interest

The authors declare no conflict of interest.

References

  1. Wahid, A.; Gelani, S.; Ashraf, M.; Foolad, M.R. Heat tolerance in plants: An overview. Environ. Exp. Bot. 2007, 61, 199–223. [Google Scholar] [CrossRef]
  2. Fedoroff, N.V.; Battisti, D.S.; Beachy, R.N.; Cooper, P.J.M.; Fischhoff, D.A.; Hodges, C.N.; Knauf, V.C.; Lobell, D.; Mazur, B.J.; Molden, D.; et al. Radically rethinking agriculture for the 21st century. Science 2010, 327, 833–834. [Google Scholar] [CrossRef] [PubMed] [Green Version]
  3. Tubiello, F.N.; Soussana, J.F.; Howden, S.M. Crop and pasture response to climate change. Proc. Natl. Acad. Sci. USA 2007, 104, 19686–19690. [Google Scholar] [CrossRef] [PubMed] [Green Version]
  4. Vollenweider, P.; Gunthardt-Goerg, M.S. Diagnosis of abiotic and biotic stress factors using the visible symptoms in foliage. Environ. Pollut. 2005, 137, 455–465. [Google Scholar] [CrossRef]
  5. Guy, C. Molecular responses of plants to cold shock and cold acclimation. J. Mol. Microbiol. Biotechnol. 1999, 1, 231–242. [Google Scholar]
  6. Scharf, K.D.; Berberich, T.; Ebersberger, I.; Nover, L. The plant heat stress transcription factor (Hsf) family: Structure, function and evolution. Biochim. Biophys. Acta 2012, 1819, 104–119. [Google Scholar] [CrossRef]
  7. Maestri, E.; Klueva, N.; Perrotta, C.; Gulli, M.; Nguyen, H.T.; Marmiroli, N. Molecular genetics of heat tolerance and heat shock proteins in cereals. Plant Mol. Biol. 2002, 48, 667–681. [Google Scholar] [CrossRef]
  8. Sangwan, V.; Orvar, B.L.; Beyerly, J.; Hirt, H.; Dhindsa, R.S. Opposite changes in membrane fluidity mimic cold and heat stress activation of distinct plant MAP kinase pathways. Plant J. 2002, 31, 629–638. [Google Scholar] [CrossRef] [Green Version]
  9. Barnabas, B.; Jager, K.; Feher, A. The effect of drought and heat stress on reproductive processes in cereals. Plant Cell Environ. 2008, 31, 11–38. [Google Scholar] [CrossRef]
  10. Ruan, Y.L.; Jin, Y.; Yang, Y.J.; Li, G.J.; Boyer, J.S. Sugar input, metabolism, and signaling mediated by invertase: Roles in development, yield potential, and response to drought and heat. Mol. Plant 2010, 3, 942–955. [Google Scholar] [CrossRef]
  11. Zhuang, Y.L.; Zhang, Y.F.; Sun, L.P. Characteristics of fibre-rich powder and antioxidant activity of pitaya (Hylocereus undatus) peels. Int. J. Food Sci. Tech. 2012, 47, 1279–1285. [Google Scholar] [CrossRef]
  12. Adnan, L.; Osman, A.; Hamid, A.A. Antioxidant activity of different extracts of red pitaya (Hylocereus polyrhizus) seed. Int. J. Food Prop. 2011, 14, 1171–1181. [Google Scholar] [CrossRef] [Green Version]
  13. Lim, T.K. Edible Medicinal and Non-Medicinal Plants; Springer: Berlin/Heidelberg, Germany, 2012; Volume 1, pp. 643–655. [Google Scholar]
  14. Wybraniec, S.; Stalica, P.; Jerz, G.; Klose, B.; Gebers, N.; Winterhalter, P.; Spórna-Kucab, A.; Szaleniec, M.; Mizrahi, Y. Separation of polar betalain pigments from cacti fruits of Hylocereus polyrhizus by ion-pair high-speed countercurrent chromatography. J. Chromatogr. A 2009, 1216, 6890–6899. [Google Scholar] [CrossRef]
  15. Sogi, D.S.; Sharma, S.; Oberoi, D.P.S.; Wani, I.A. Effect of extraction parameters on curcumin yield from turmeric. J. Food Sci. Tech. 2010, 47, 300–304. [Google Scholar] [CrossRef] [Green Version]
  16. Woo, K.K.; Wong, F.N.F.; Chua, H.S.C.; Tang, P.Y. Stability of the spray-dried pigment of red dragon fruit [Hylocereus polyrhizus (Weber) Britton and Rose] as a function of organic acid additives and storage conditions. Philipp. Agric. Sci. 2011, 94, 264–269. [Google Scholar]
  17. Garcia-Cruz, L.; Valle-Guadarrama, S.; Salinas-Moreno, Y.; Joaquin-Cruz, E. Physical, chemical, and antioxidant activity characterization of Pitaya (Stenocereus pruinosus) fruits. Plant Food Hum. Nutr. 2013, 68, 403–410. [Google Scholar] [CrossRef]
  18. Suh, D.H.; Lee, S.; Heo, D.Y.; Kim, Y.S.; Cho, S.K.; Lee, S. Metabolite profiling of red and white pitayas (Hylocereus polyrhizus and Hylocereus undatus) for comparing betalain biosynthesis and antioxidant activity. J. Agr. Food Chem. 2014, 62, 8764–8771. [Google Scholar] [CrossRef]
  19. Hua, Q.Z.; Chen, C.J.; Chen, Z.; Chen, P.K.; Ma, Y.W.; Wu, J.Y.; Zheng, J.; Hu, G.; Zhao, J.; Qin, Y. Transcriptomic analysis reveals key genes related to betalain biosynthesis in pulp coloration of Hylocereus polyrhizus. Front. Plant Sci. 2016, 6, 1179. [Google Scholar]
  20. Zhao, Q.; Zhang, H.; Wang, T.; Chen, S.X.; Dai, S.J. Proteomics-based investigation of salt-responsive mechanisms in plant roots. J. Proteom. 2013, 82, 230–253. [Google Scholar] [CrossRef]
  21. Fan, Q.J.; Yan, F.X.; Qiao, G.; Zhang, B.X.; Wen, X.P. Identification of differentially-expressed genes potentially implicated in drought response in pitaya (Hylocereus undatus) by suppression subtractive hybridization and cDNA microarray analysis. Gene 2014, 533, 322–331. [Google Scholar] [CrossRef]
  22. Zhou, J.L.; Wang, Z.; Mao, Y.Y.; Wang, L.J.; Xiao, T.J.; Hu, Y.; Zhang, Y.; Ma, Y. Proteogenomic analysis of pitaya reveals cold stress-related molecular signature. PeerJ 2020, 8, e8540. [Google Scholar] [CrossRef] [PubMed]
  23. Li, A.L.; Wen, Z.; Yang, K.; Wen, X.P. Conserved miR396b-GRF regulation is involved in abiotic stress responses in pitaya (Hylocereus polyrhizus). Int. J. Mol. Sci. 2019, 20, 2501. [Google Scholar] [CrossRef] [PubMed] [Green Version]
  24. Nie, Q.; Gao, G.-L.; Fan, Q.-J.; Qiao, G.; Wen, X.-P.; Liu, T.; Peng, Z.-J.; Cai, Y.-Q. Isolation and characterization of a catalase gene "HuCAT3" from pitaya (Hylocereus undatus) and its expression under abiotic stress. Gene 2015, 563, 63–71. [Google Scholar] [CrossRef] [PubMed]
  25. Qu, Y.J.; Nong, Q.D.; Jian, S.G.; Lu, H.F.; Zhang, M.Y.; Xia, K.F. An AP2/ERF gene, HuERF1, from Pitaya (Hylocereus undatus) positively regulates salt tolerance. Int. J. Mol. Sci. 2020, 21, 4586. [Google Scholar] [CrossRef]
  26. Zhu, J.K. Abiotic stress signaling and responses in plants. Cell 2016, 167, 313–324. [Google Scholar] [CrossRef] [Green Version]
  27. Mittler, R.; Finka, A.; Goloubinoff, P. How do plants feel the heat? Trends Biochem. Sci. 2012, 37, 118–125. [Google Scholar] [CrossRef]
  28. Xin, C.; Wang, X.; Cai, J.; Zhou, Q.; Liu, F.; Dai, T.; Cao, W.; Jiang, D. Changes of transcriptome and proteome are associated with the enhanced post-anthesis high temperature tolerance induced by pre-anthesis heat priming in wheat. Plant Growth Regul. 2016, 79, 135–145. [Google Scholar] [CrossRef]
  29. Mangelsen, E.; Kilian, J.; Harter, K.; Jansson, C.; Wanke, D.; Sundberg, E. Transcriptome analysis of high-temperature stress in developing barley caryopses: Early stress responses and effects on storage compound biosynthesis. Mol. Plant. 2011, 4, 97–115. [Google Scholar] [CrossRef]
  30. Qin, D.D.; Wu, H.Y.; Peng, H.R.; Yao, Y.Y.; Ni, Z.F.; Li, Z.X.; Zhou, C.; Sun, Q. Heat stress-responsive transcriptome analysis in heat susceptible and tolerant wheat (Triticum aestivum L.) by using wheat genome array. BMC Genom. 2008, 9, 432. [Google Scholar] [CrossRef] [Green Version]
  31. Fang, Y.; Liao, K.; Du, H.; Xu, Y.; Song, H.; Li, X.; Xiong, L. A stress-responsive NAC transcription factor SNAC3 confers heat and drought tolerance through modulation of reactive oxygen species in rice. J. Exp. Bot. 2015, 66, 6803–6817. [Google Scholar] [CrossRef] [Green Version]
  32. Akhter, D.; Qin, R.; Nath, U.K.; Eshag, J.; Jin, X.L.; Shi, C.H. A rice gene, OsPL, encoding a MYB family transcription factor confers anthocyanin synthesis, heat stress response and hormonal signaling. Gene 2019, 699, 62–72. [Google Scholar] [CrossRef]
  33. Li, S.J.; Fu, Q.T.; Huang, W.D.; Yu, D.Q. Functional analysis of an Arabidopsis transcription factor WRKY25 in heat stress. Plant Cell Rep. 2009, 28, 683–693. [Google Scholar] [CrossRef]
  34. Angelcheva, L.; Mishra, Y.; Antti, H.; Kjellsen, T.D.; Funk, C.; Strimbeck, R.G.; Schröder, W.P. Metabolomic analysis of extreme freezing tolerance in Siberian spruce (Picea obovata). New Phytol. 2014, 204, 545–555. [Google Scholar] [CrossRef]
  35. Yang, D.S.; Zhang, J.; Li, M.X.; Shi, L.X. Metabolomics analysis reveals the salt-tolerant mechanism in glycine soja. J. Plant Growth Regul. 2017, 36, 460–471. [Google Scholar] [CrossRef]
  36. Shulaev, V.; Cortes, D.; Miller, G.; Mittler, R. Metabolomics for plant stress response. Physiol. Plant 2008, 13, 199–208. [Google Scholar] [CrossRef]
  37. Nong, Q.D.; Zhang, M.Y.; Chen, J.T.; Zhang, M.; Cheng, H.P.; Jian, S.G.; Lu, H.; Xia, K. RNA-Seq de novo assembly of red pitaya (Hylocereus polyrhizus) roots and differential transcriptome analysis in response to salt stress. Trop. Plant Biol. 2019, 12, 55–66. [Google Scholar] [CrossRef]
  38. Fumagalli, M.; Vieira, F.G.; Linderoth, T.; Nielsen, R. ngsTools: Methods for population genetics analyses from next-generation sequencing data. Bioinformatics 2014, 30, 1486–1487. [Google Scholar] [CrossRef]
  39. Grabherr, M.G.; Haas, B.J.; Yassour, M.; Levin, J.Z.; Thompson, D.A.; Amit, I.; Adiconis, X.; Fan, L. Full-length transcriptome assembly from RNA-Seq data without a reference genome. Nat. Biotechnol. 2011, 29, 644–652. [Google Scholar] [CrossRef] [Green Version]
  40. Robinson, M.D.; McCarthy, D.J.; Smyth, G.K. edgeR: A bioconductor package for differential expression analysis of digital gene expression data. Bioinformatics 2010, 26, 139–140. [Google Scholar] [CrossRef] [Green Version]
  41. Xia, K.F.; Ou, X.J.; Tang, H.D.; Wang, R.; Wu, P.; Jia, Y.X.; Wei, X.; Xu, X.; Kang, S.H.; Kim, S.K.; et al. Rice microRNA osa-miR1848 targets the obtusifoliol 14α-demethylase gene OsCYP51G3 and mediates the biosynthesis of phytosterols and brassinosteroids during development and in response to stress. New Phytol. 2015, 208, 790–802. [Google Scholar] [CrossRef] [Green Version]
  42. Nong, Q.D.; Yang, Y.C.; Zhang, M.Y.; Zhang, M.; Chen, J.T.; Jian, S.G.; Lu, H.; Xia, K. RNA-seq-based selection of reference genes for RT-qPCR analysis of pitaya. FEBS Open Bio 2019, 9, 1403–1412. [Google Scholar] [CrossRef] [PubMed] [Green Version]
  43. Livak, K.J.; Schmittgen, T.D. Analysis of relative gene expression data using real-time quantitative PCR and the 2−ΔΔCT method. Methods 2001, 25, 402–408. [Google Scholar] [CrossRef] [PubMed]
  44. Hasanuzzaman, M.; Nahar, K.; Alam, M.M.; Roychowdhury, R.; Fujita, M. Physiological, biochemical, and molecular mechanisms of heat stress tolerance in plants. Int. J. Mol. Sci. 2013, 14, 9643–9684. [Google Scholar] [CrossRef] [PubMed]
  45. Hu, S.S.; Ding, Y.F.; Zhu, C. Sensitivity and responses of chloroplasts to heat stress in plants. Front. Plant Sci. 2020, 11, 375. [Google Scholar] [CrossRef] [Green Version]
  46. Zhao, J.G.; Lu, Z.G.; Wang, L.; Jin, B. Plant responses to heat stress: Physiology, transcription, noncoding RNAs, and epigenetics. Int. J. Mol. Sci. 2021, 22, 117. [Google Scholar]
  47. Wu, Z.G.; Jiang, W.; Chen, S.L.; Mantri, N.; Tao, Z.M.; Jiang, C.X. Insights from the cold transcriptome and metabolome of dendrobium officinale: Global reprogramming of metabolic and gene regulation networks during cold acclimation. Front. Plant Sci. 2016, 7, e0121658. [Google Scholar] [CrossRef] [Green Version]
  48. Zou, M.Q.; Yuan, L.Y.; Zhu, S.D.; Liu, S.; Ge, J.T.; Wang, C.G. Response of osmotic adjustment and ascorbate-glutathione cycle to heat stress in a heat-sensitive and a heat-tolerant genotype of wucai (Brassica campestris L.). Sci. Hortic. 2016, 211, 87–94. [Google Scholar] [CrossRef]
  49. Matsukura, S.; Mizoi, J.; Yoshida, T.; Todaka, D.; Ito, Y.; Maruyama, K.; Shinozaki, K.; Yamaguchi-Shinozaki, K. Comprehensive analysis of rice DREB2-type genes that encode transcription factors involved in the expression of abiotic stress-responsive genes. Mol. Genet. Genom. 2010, 283, 185–196. [Google Scholar] [CrossRef]
  50. Qin, F.; Kakimoto, M.; Sakuma, Y.; Maruyama, K.; Osakabe, Y.; Tran, L.S.; Shinozaki, K.; Yamaguchi-Shinozaki, K. Regulation and functional analysis of ZmDREB2A in response to drought and heat stresses in Zea mays L. Plant J. 2010, 50, 54–69. [Google Scholar] [CrossRef]
  51. Cai, H.Y.; Yang, S.; Yan, Y.; Xiao, Z.L.; Cheng, J.B.; Wu, J.; Qiu, A.L.; Lai, Y.; Mou, S.L.; Guan, D.Y. CaWRKY6 transcriptionally activates CaWRKY40, regulates Ralstonia solanacearum resistance, and confers high-temperature and high-humidity tolerance in pepper. J. Exp. Bot. 2015, 66, 3163–3174. [Google Scholar] [CrossRef] [Green Version]
  52. Wu, X.L.; Shiroto, Y.; Kishitani, S.; Ito, Y.; Toriyama, K. Enhanced heat and drought tolerance in transgenic rice seedlings overexpressing OsWRKY11 under the control of HSP101 promoter. Plant Cell Rep. 2009, 28, 21–30. [Google Scholar] [CrossRef]
  53. Guo, W.W.; Zhang, J.X.; Zhang, N.; Xin, M.M.; Peng, H.R.; Hu, Z.R.; Ni, Z.F.; Du, J.K. The wheat NAC transcription factor TaNAC2L is regulated at the transcriptional and post-translational levels and promotes heat stress tolerance in transgenic Arabidopsis. PLoS ONE 2015, 10, e0135667. [Google Scholar] [CrossRef]
  54. Suzuki, N.; Sejima, H.; Tam, R.; Schlauch, K.; Mittler, R. Identification of the MBF1 heat-response regulon of Arabidopsis thaliana. Plant J. 2011, 66, 844–851. [Google Scholar] [CrossRef] [Green Version]
  55. Feng, C.P.; Andreasson, E.; Maslak, A.; Mock, H.P.; Mattsson, O.; Mundy, J. Arabidopsis MYB68 in development and responses to environmental cues. Plant Sci. 2004, 167, 1099–1107. [Google Scholar] [CrossRef]
  56. Meng, X.; Wang, J.R.; Wang, G.D.; Liang, X.Q.; Li, X.D.; Meng, Q.W. An R2R3-MYB gene, LeAN2, positively regulated the thermo-tolerance in transgenic tomato. J. Plant Physiol. 2015, 175, 1–8. [Google Scholar] [CrossRef]
  57. El-kereamy, A.; Bi, Y.M.; Ranathunge, K.; Beatty, P.H.; Good, A.G.; Rothstein, S.J. The rice R2R3-MYB transcription factor OsMYB55 is involved in the tolerance to high temperature and modulates amino acid metabolism. PLoS ONE 2012, 7, e52030. [Google Scholar] [CrossRef] [Green Version]
  58. Zhaorong, H.; Tian, X.; Wang, F.; Zhang, L.; Xin, M.; Hu, Z.; Yao, Y.; Ni, Z.; Sun, Q.; Peng, H. Characterization of wheat MYB genes responsive to high temperatures. BMC Plant Biol. 2017, 17, 208. [Google Scholar]
  59. Liao, C.C.; Zheng, Y.; Guo, Y. MYB30 transcription factor regulates oxidative and heat stress responses through ANNEXIN-mediated cytosolic calcium signaling in Arabidopsis. New Phytol. 2017, 216, 163–177. [Google Scholar] [CrossRef] [Green Version]
  60. Montero-Barrientos, M.; Hermosa, R.; Cardoza, R.E.; Gutierrez, S.; Nicolas, C.; Monte, E. Transgenic expression of the Trichoderma harzianum hsp70 gene increases Arabidopsis resistance to heat and other abiotic stresses. J. Plant Physiol. 2010, 167, 659–665. [Google Scholar] [CrossRef]
  61. Qi, Y.C.; Wang, H.J.; Zou, Y.; Liu, C.; Liu, Y.Q.; Wang, Y.; Zhang, W. Over-expression of mitochondrial heat shock protein 70 suppresses programmed cell death in rice. FEBS Lett. 2011, 585, 231–239. [Google Scholar] [CrossRef] [Green Version]
  62. Kotak, S.; Larkindale, J.; Lee, U.; von Koskull-Doring, P.; Vierling, E.; Scharf, K.D. Complexity of the heat stress response in plants. Curr. Opin. Plant Biol. 2007, 10, 310–316. [Google Scholar] [CrossRef]
  63. Penfield, S. Temperature perception and signal transduction in plants. New Phytol. 2008, 179, 615–628. [Google Scholar] [CrossRef]
  64. Zhang, L.R.; Li, Y.S.; Xing, D.; Gao, C.J. Characterization of mitochondrial dynamics and subcellular localization of ROS reveal that HsfA2 alleviates oxidative damage caused by heat stress in Arabidopsis. J. Exp. Bot. 2009, 60, 2073–2091. [Google Scholar] [CrossRef] [PubMed] [Green Version]
  65. Banti, V.; Mafessoni, F.; Loreti, E.; Alpi, A.; Perata, P. The heat-inducible transcription factor HsfA2 enhances anoxia tolerance in Arabidopsis. Plant Physiol. 2010, 152, 1471–1483. [Google Scholar] [CrossRef] [PubMed] [Green Version]
  66. Kaya, H.; Shibahara, K.; Taoka, K.; Iwabuchi, M.; Stillman, B.; Araki, T. FASCIATA genes for chromatin assembly factor-1 in Arabidopsis maintain the cellular organization of apical meristems. Cell 2001, 104, 131–142. [Google Scholar] [CrossRef] [Green Version]
  67. Rivero, R.M.; Ruiz, J.M.; Garcia, P.C.; Lopez-Lefebre, L.R.; Sanchez, E.; Romero, L. Resistance to cold and heat stress: Accumulation of phenolic compounds in tomato and watermelon plants. Plant Sci. 2001, 160, 315–321. [Google Scholar] [CrossRef]
  68. Ogweno, J.O.; Song, X.S.; Shi, K.; Hu, W.H.; Mao, W.H.; Zhou, Y.H.; Yu, J.Q.; Nogués, S. Brassinosteroids alleviate heat-induced inhibition of photosynthesis by increasing carboxylation efficiency and enhancing antioxidant systems in Lycopersicon esculentum. J. Plant Growth Regul. 2008, 27, 49–57. [Google Scholar] [CrossRef]
  69. Bajguz, A.; Hayat, S. Effects of brassinosteroids on the plant responses to environmental stresses. Plant Physiol. Biochem. 2009, 47, 1–8. [Google Scholar] [CrossRef]
  70. Akbudak, M.A.; Yildiz, S.; Filiz, E. Pathogenesis related protein-1 (PR-1) genes in tomato (Solanum lycopersicum L.): Bioinformatics analyses and expression profiles in response to drought stress. Genomics 2020, 112, 4089–4099. [Google Scholar] [CrossRef]
  71. Wang, J.; Mao, X.; Wang, R.; Li, A.; Zhao, G.; Zhao, J.; Jing, R. Identification of wheat stress-responding genes and TaPR-1-1 function by screening a cDNA yeast library prepared following abiotic stress. Sci. Rep. 2019, 9, 141. [Google Scholar] [CrossRef]
  72. Liu, W.X.; Zhang, F.C.; Zhang, W.Z.; Song, L.F.; Wu, W.H.; Chen, Y.F. Arabidopsis Di19 functions as a transcription factor and modulates PR1, PR2, and PR5 expression in response to drought stress. Mol. Plant 2013, 6, 1487–1502. [Google Scholar] [CrossRef] [Green Version]
Figure 1. Flow chart of the experimental process. Blue represents the transcriptome process, and green represents the metabolome process.
Genes 12 01714 g001
Figure 2. Species distribution of the top BLAST hits for total homologous sequences. Among them, the species with the most hits was Arabidopsis thaliana.
Genes 12 01714 g002
Figure 3. Overview of transcriptome analysis. (A) Venn graph for 24 h and 72 h based on heat downregulated (repressed) genes. (B) Venn graph for 24 h and 72 h based on upregulated (induced) genes. (C) The heatmap of the DEGs in RNA-seq analysis. CK: control for 0 h; H24h: heat stress for 1 h; H72h: heat stress for 72 h.
Genes 12 01714 g003
Figure 4. Top 15 of the pathway assignments of red pitaya genes according to the Kyoto Encyclopedia of Genes and Genomes (KEGG) database. DEGs in the heat stress were significantly enriched in the metabolic pathways, biosynthesis of secondary metabolites, biosynthesis of antibiotics, etc.
Genes 12 01714 g004
Figure 5. Identification of differentially accumulated metabolites. (A) Metabolic analysis using an OPLS-DA model. (B) Volcano plots of differentially accumulated metabolites under HS compared with the control group. The green indicates downregulated metabolites, red indicates upregulated metabolites, and black indicates no significant change.
Genes 12 01714 g005
Figure 6. Heatmap of all differentially accumulated metabolites for H24h. CK, the control group; H24h, the 24 h heat stress group.
Genes 12 01714 g006
Figure 7. Top 18 enriched pathways for heat-responsive compounds.
Genes 12 01714 g007
Figure 8. Sequence analysis of HuPR-1 and its overexpression conferred heat tolerance to transgenic Arabidopsis plants. (A) Protein sequence alignment result of HuPR-1 in NCBI and protein alignment by Vector NTI Advance 11. (B) The qRT-PCR was used to measure the expression levels of HuPR-1 in transgenic Arabidopsis plants. (C) Survival rates (%) of WT and transgenic seedlings after heat treatment. Seven-day-old seedlings were heat-treated at 44 °C for 2 h and returned to 22 °C to grow for 2 days, and then photographed; following this, the survival rates were calculated. More than 50 plants of each line were analyzed. Bars represent standard deviations. Asterisks indicate statistically significant differences compared with wild type by Student’s t-test (* p < 0.05, ** p < 0.01).
Genes 12 01714 g008
Table 1. De novo assembly and annotations metrics for the transcriptome of pitaya.
ItemStatistic Value
Total sequences36,842
Total bases78,871,914
Min sequence length206
Max sequence length40,937
Average sequence length2141.82
Median sequence length1749.00
N25 length4210
N50 length2848
N75 length1799
N90 length1107
N95 length827
As29.40%
Ts29.33%
Gs20.79%
Cs20.48%
(A + T)s58.72%
(G + C)s41.28%
Ns0.00%
Table 2. Top 20 DEGs in red pitaya after heat stress.
Gene IDLog2 FCp-ValueAnnotation
Contig191297.633.08 × 10−6GRXC11; glutathione-disulfide oxidoreductase activity in the presence of NADPH and glutathione reductase.up
Contig208257.262.29 × 10−5NAup
Contig327255.013.76 × 10−10FER2, chloroplastic; stores iron in a soluble, non-toxic, readily available form. Important for iron homeostasis. Has ferroxidase activity.up
Contig327244.981.03 × 10−9N/A, chloroplastic; stores iron in a soluble, non-toxic, readily available form. Important for iron homeostasis. Has ferroxidase activity.up
Contig218474.741.61 × 10−8PFE, chloroplastic; stores iron in a soluble, non-toxic, readily available form. Important for iron homeostasis.up
Contig23804.676.45 × 10−14ELIP1, chloroplastic; early light-induced protein 1; prevents excess accumulation of free chlorophyll by inhibiting the entire chlorophyll biosynthesis pathway, and then prevents photooxidative stress; involved in seed germinationup
Contig7854.631.25 × 10−10PFK3; catalyzes the phosphorylation of D-fructose 6-phosphate to fructose 1,6-bisphosphate by ATP, the first committing step of glycolysis.up
Contig93004.419.1 × 10−4NAup
Contig36964.391.63 × 10−21PGM1, 2,3-bisphosphoglycerate-independent phosphoglycerate mutase; catalyzes the interconversion of 2-phosphoglycerate and 3-phosphoglycerate.up
Contig99964.289.30 × 10−6NAup
Contig9364−5.294.08 × 10−5ART2; encoded on the antisense strand of the nuclear 25S rDNA.down
Contig17684−5.496.21 × 10−5PER72, peroxidase 72; removal of H2O2; oxidation of toxic reductants; biosynthesis and degradation of lignin; suberization; auxin catabolism; response to environmental stresses such as wounding, pathogen attack, and oxidative stress.down
Contig7023−5.511.27 × 10−8NAdown
Contig2725−6.293.73 × 10−18rbgA, ribosome biogenesis; GTPase A; essential protein that is required for a late step of 50S ribosomal subunit assembly.down
Contig16950−6.581.09 × 10−7NAdown
Contig18702−6.916.00 × 10−4ALMT2, aluminum-activated malate transporter 2.down
Contig31875−7.221.92 × 10−31LBD41, LOB domain-containing protein 41; cellular response to hypoxia; regulation of transcription.down
Contig29974−8.032.66 × 10−5ALMT10, aluminum-activated malate transporter 10.down
Contig20699−8.981.78 × 10−12RAB15, glycine-rich RNA-binding, abscisic acid-inducible protein.down
Contig352−10.554.34 × 10−18NAdown
NA, no annotation.
Table 3. MYB proteins regulated by heat stress in red pitaya.
Gene IDLog2 FCFunctional DescriptionHomologySpecies
Contig9674−1.66MYB domain-containing proteinMYBBXenopus laevis
Contig26304−1.58MYB domain-containing proteinMYBBXenopus laevis
Contig25078−2.38MYB-related protein 306MYB06Antirrhinum majus
Contig25077−2.70MYB-related protein 306MYB06Antirrhinum majus
Contig252521.66MYB domain protein 30MYB30Antirrhinum majus
Contig28175−1.79MYB domain protein 44MYB44Arabidopsis thaliana
Contig28176−1.77MYB domain protein 44MYB44Arabidopsis thaliana
Contig21877−1.37MYB domain protein 86MYB86Arabidopsis thaliana
Table 4. Heat-shock proteins and heat transcription factors regulated by heat stress in red pitaya.
Gene IDLog2 FCFunctional DescriptionHomologySpecies
Contig264161.86Heat shock factor A2HsfA2Arabidopsis thaliana
Contig264172.54Heat shock factor A2HsfA2Arabidopsis thaliana
Contig279521.67Heat shock factor R2HspR2Arabidopsis thaliana
Contig204861.13Heat shock protein 83Hsp83D. melanogaster
Contig18643.72Heat shock protein 16Hsp16Glycine max
Contig18984.91Heat-shock cognate 71 kDa proteinHsp7CPetunia hybrida
Contig18991.43Heat-shock cognate 71 kDa proteinHsp7CPetunia hybrida
Contig35062.20Heat-shock cognate 71 kDa proteinHsp7CPetunia hybrida
Contig136873.89Heat shock protein 41Hsp41Glycine max
Contig10214.67Heat shock protein 83Hsp83Ipomoea nil
Contig10222.34Heat shock protein 83Hsp83Ipomoea nil
Contig10232.27Heat shock protein 83Hsp83Ipomoea nil
Contig271326.29Heat-shock cognate 71 kDa proteinHsp7CRattus norvegicus
Contig226111.3770 kDa heat shock-related proteinHsp7SPisum sativum
Contig20223−1.94heat shock 70 kDa protein cognate 5Hsp7ESpinacia oleracea
Contig26216−1.31Heat shock protein 72Hsp72Solanum lycopersicum
Contig149354.2522.0 kDa class IV heat shock proteinHsp22 Ipomoea nil
Contig138471.59Heat shock protein 70Hsp70Arabidopsis thaliana
Table 5. KEGG classification of significantly enriched pathways, following metabolite analysis of differentially accumulated metabolites.
ID aTermDiff_MetabolitesMetabolite_id
ko00970Aminoacyl-tRNA biosynthesis2meta_51; meta_10
ko00630Glyoxylate and dicarboxylate metabolism2meta_40; meta_8
ko00960Tropane, piperidine, and pyridine alkaloid biosynthesis1meta_10
ko00460Cyanoamino acid metabolism1meta_10
ko00020Citrate cycle (TCA cycle)1meta_40
ko00240Pyrimidine metabolism1meta_212
ko00966Glucosinolate biosynthesis1meta_10
ko01200Carbon metabolism2meta_51; meta_8
ko00660C5-Branched dibasic acid metabolism2meta_8; meta_40
ko01110Biosynthesis of secondary metabolites2meta_10; meta_40
ko00260Glycine, serine, and threonine metabolism1meta_51
ko02010ABC transporters1meta_10
ko00280Valine, leucine, and isoleucine degradation1meta_10
ko012102-Oxocarboxylic acid metabolism3meta_8; meta_10; meta_40
ko00290Valine, leucine, and isoleucine biosynthesis2meta_10; meta_8
ko01230Biosynthesis of amino acids2meta_51; meta_10
ko00270Cysteine and methionine metabolism1meta_51
ko01100Metabolic pathways5meta_212; meta_8; meta_51; meta_40; meta_10
a Pathway-map ID. In the KEGG database (http://www.genome.jp/kegg/, accessed on 10 March 2021). Term, annotation of various metabolic pathways in plants; Diff_Metabolites, the number of differentially expressed compounds under heat treatment conditions compared with the control group.
Publisher’s Note: MDPI stays neutral with regard to jurisdictional claims in published maps and institutional affiliations.

