
Histone Variant H2A.J Is Enriched in Luminal Epithelial Gland Cells

 , , and
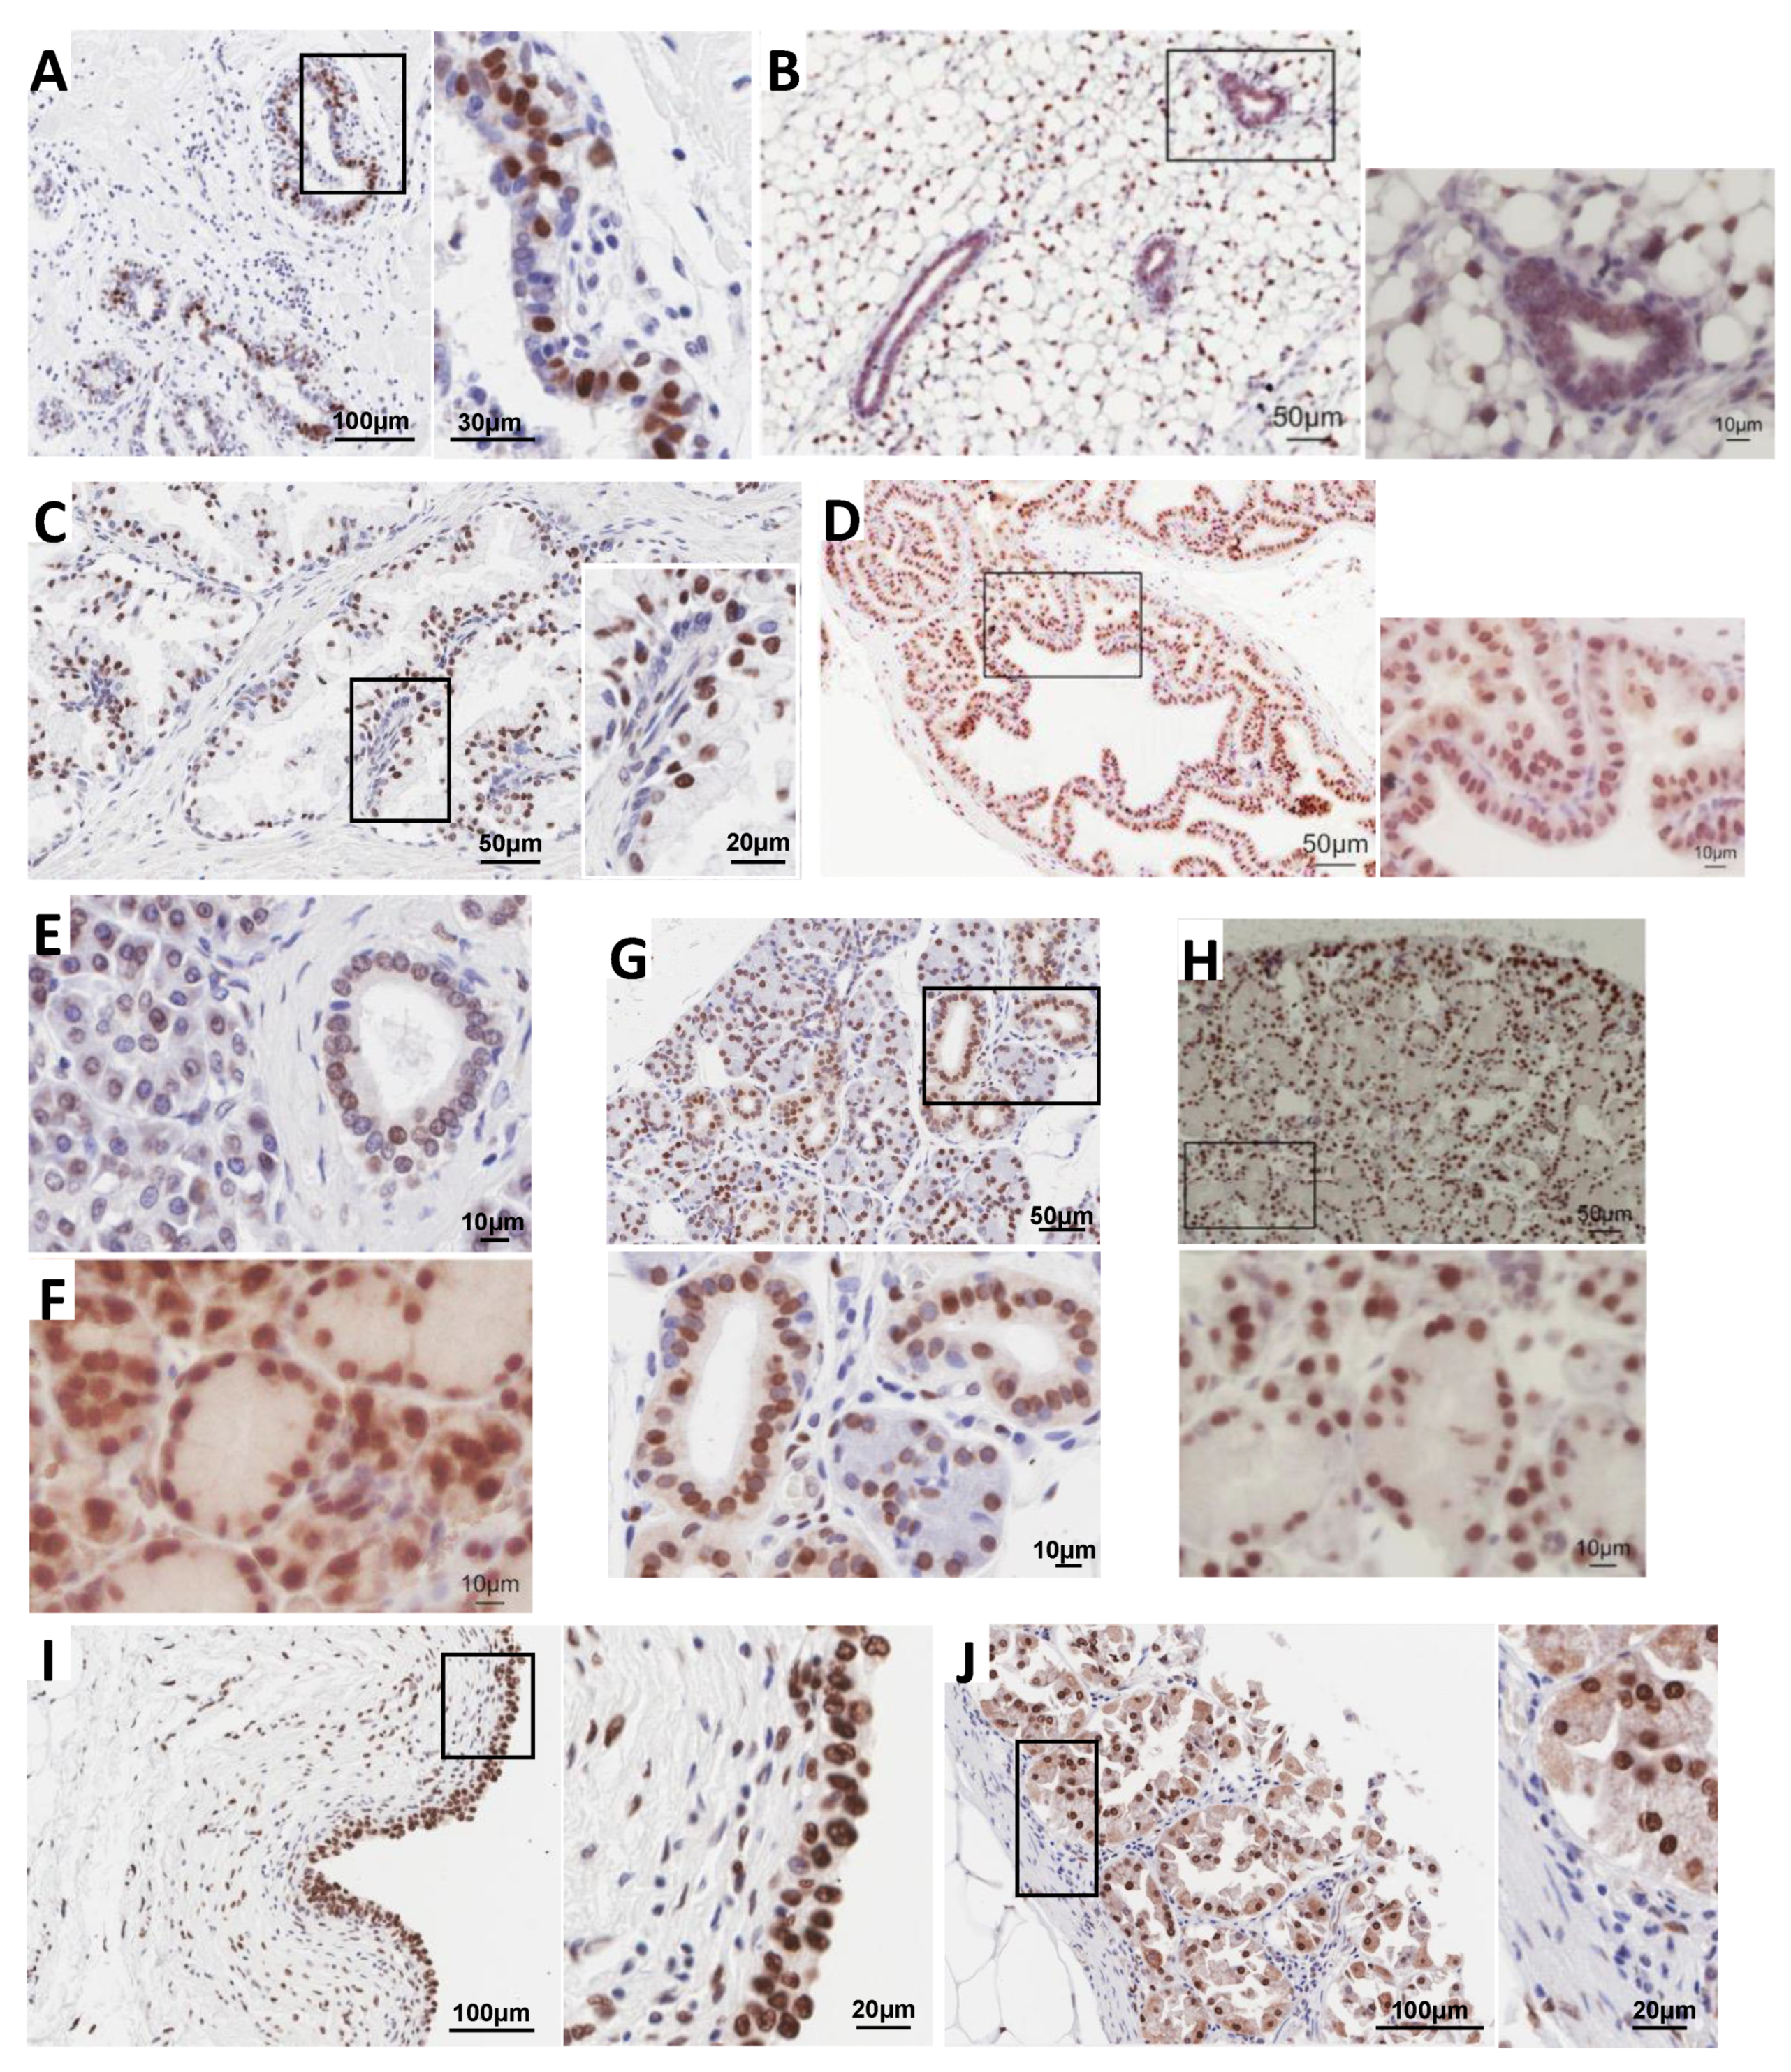
Abstract
:1. Introduction
2. Materials and Methods
2.1. Cell Culture and Reagents
2.2. Crispr-Cas9 Knock-Out of the H2AFJ Gene
2.3. Immunohistochemical Detection of H2A.J in Mouse and Human Tissue Sections
2.4. Immunofluorescent Detection of H2A.J in Cultured Cells
2.5. Western Blots
2.6. Isolation of H2A.J-KO Mice
2.7. RNA-seq of T47D and T47D-H2A.J-KO Cell Lines
2.8. Bioinformatic Analyses of T47D RNA-seq Data
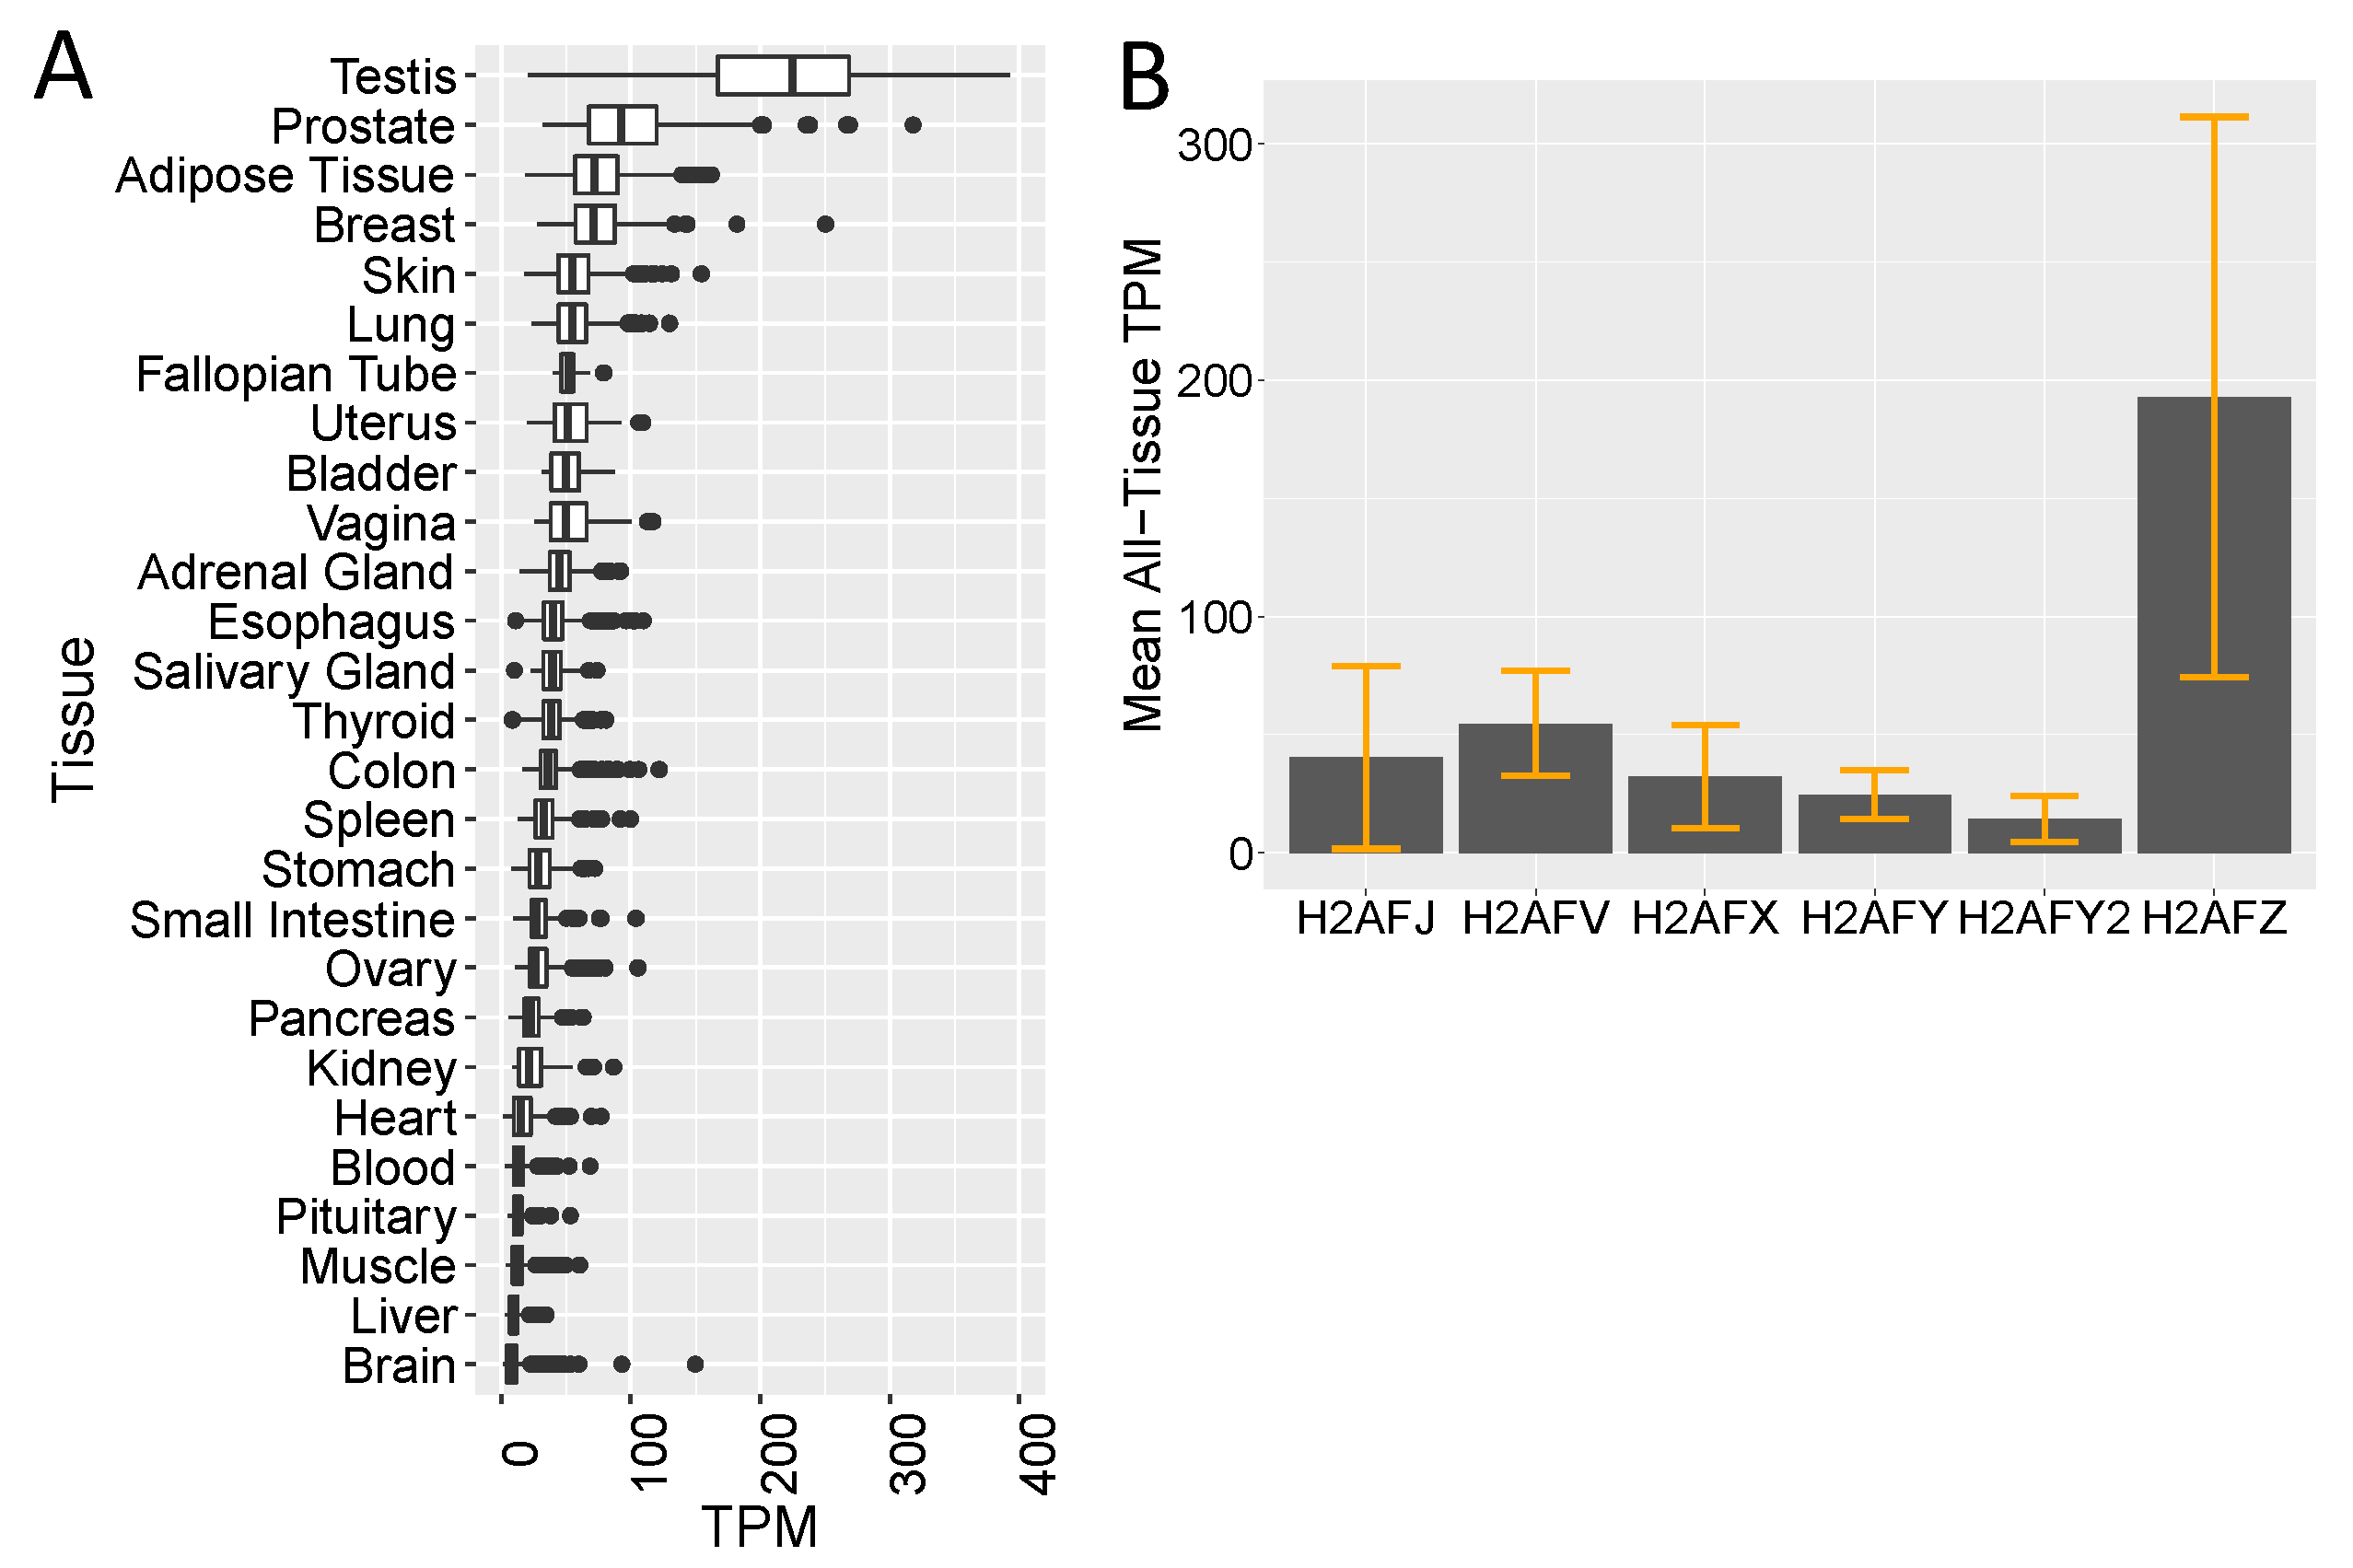
2.9. GTEx, TCGA and CCLE Transcriptome Analyses
2.10. Single-Cell RNA-seq Analyses
2.11. Cancer Survival Plots
3. Results
3.1. Immunolocalization Shows Enrichment of H2A.J in Luminal Epithelial Cells of Multiple Glands in Mice and Humans
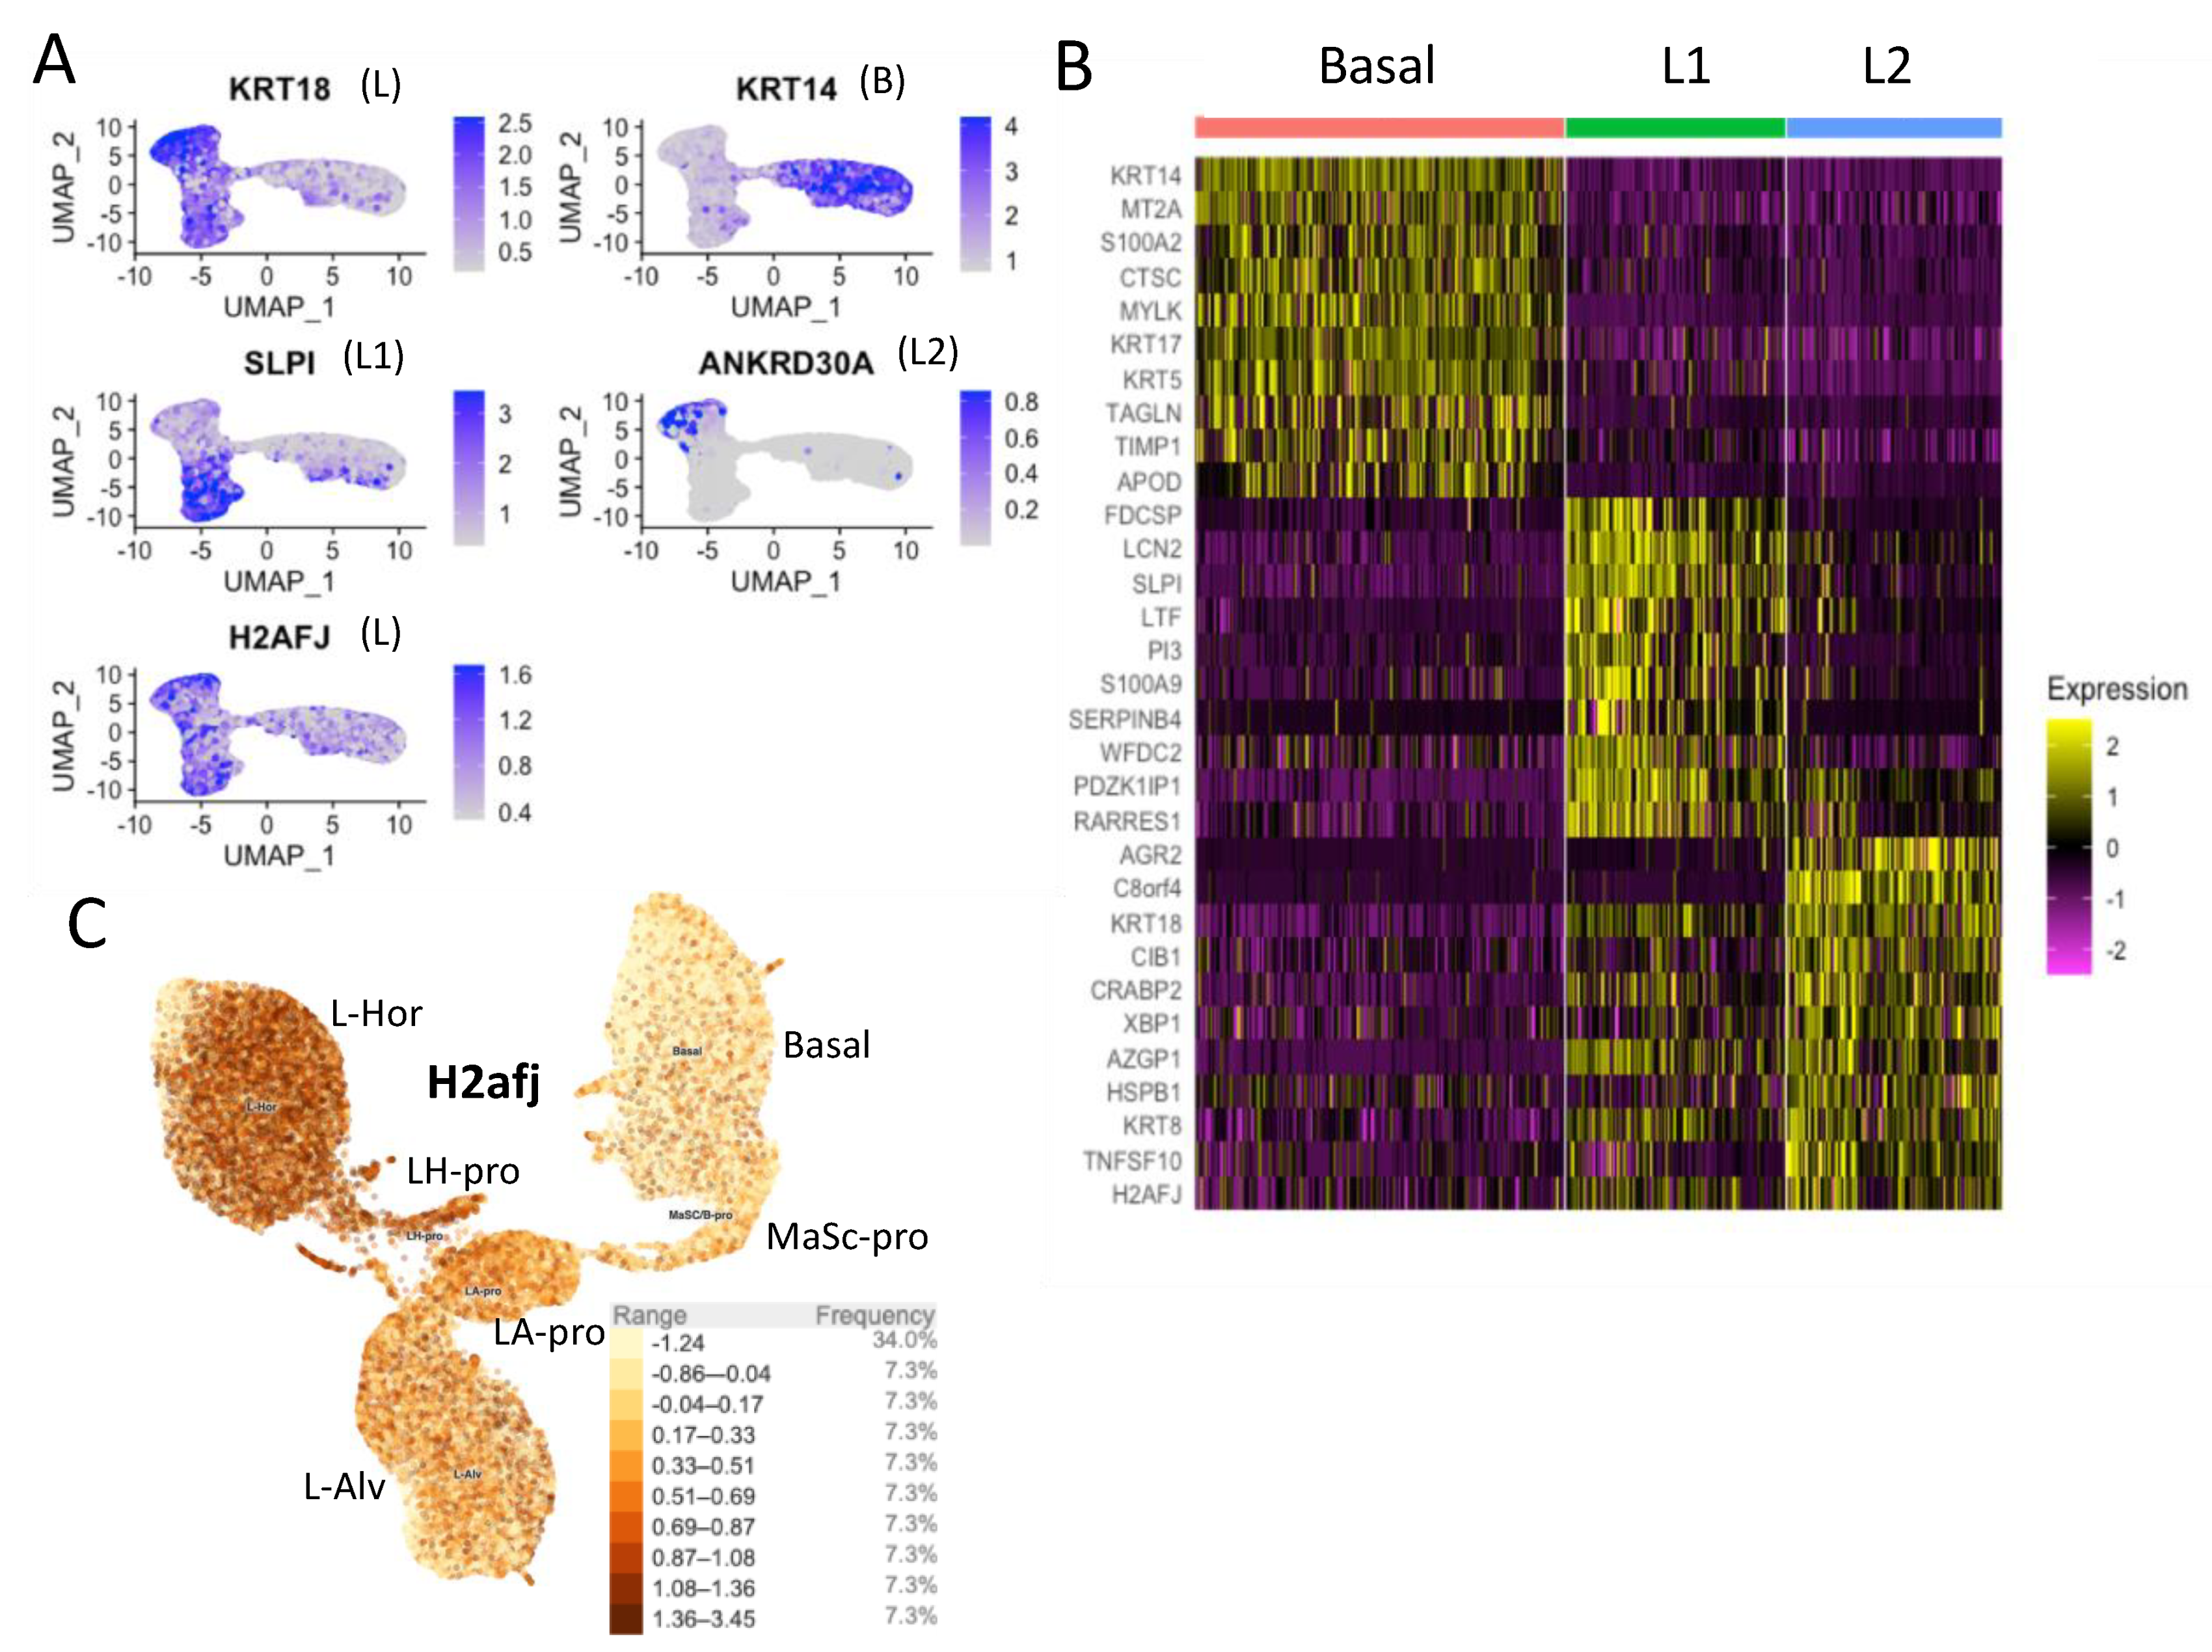
3.2. Single-Cell RNA-seq Data Show High H2AFJ RNA Expression in Mammary and Prostate Luminal Epithelial Cells
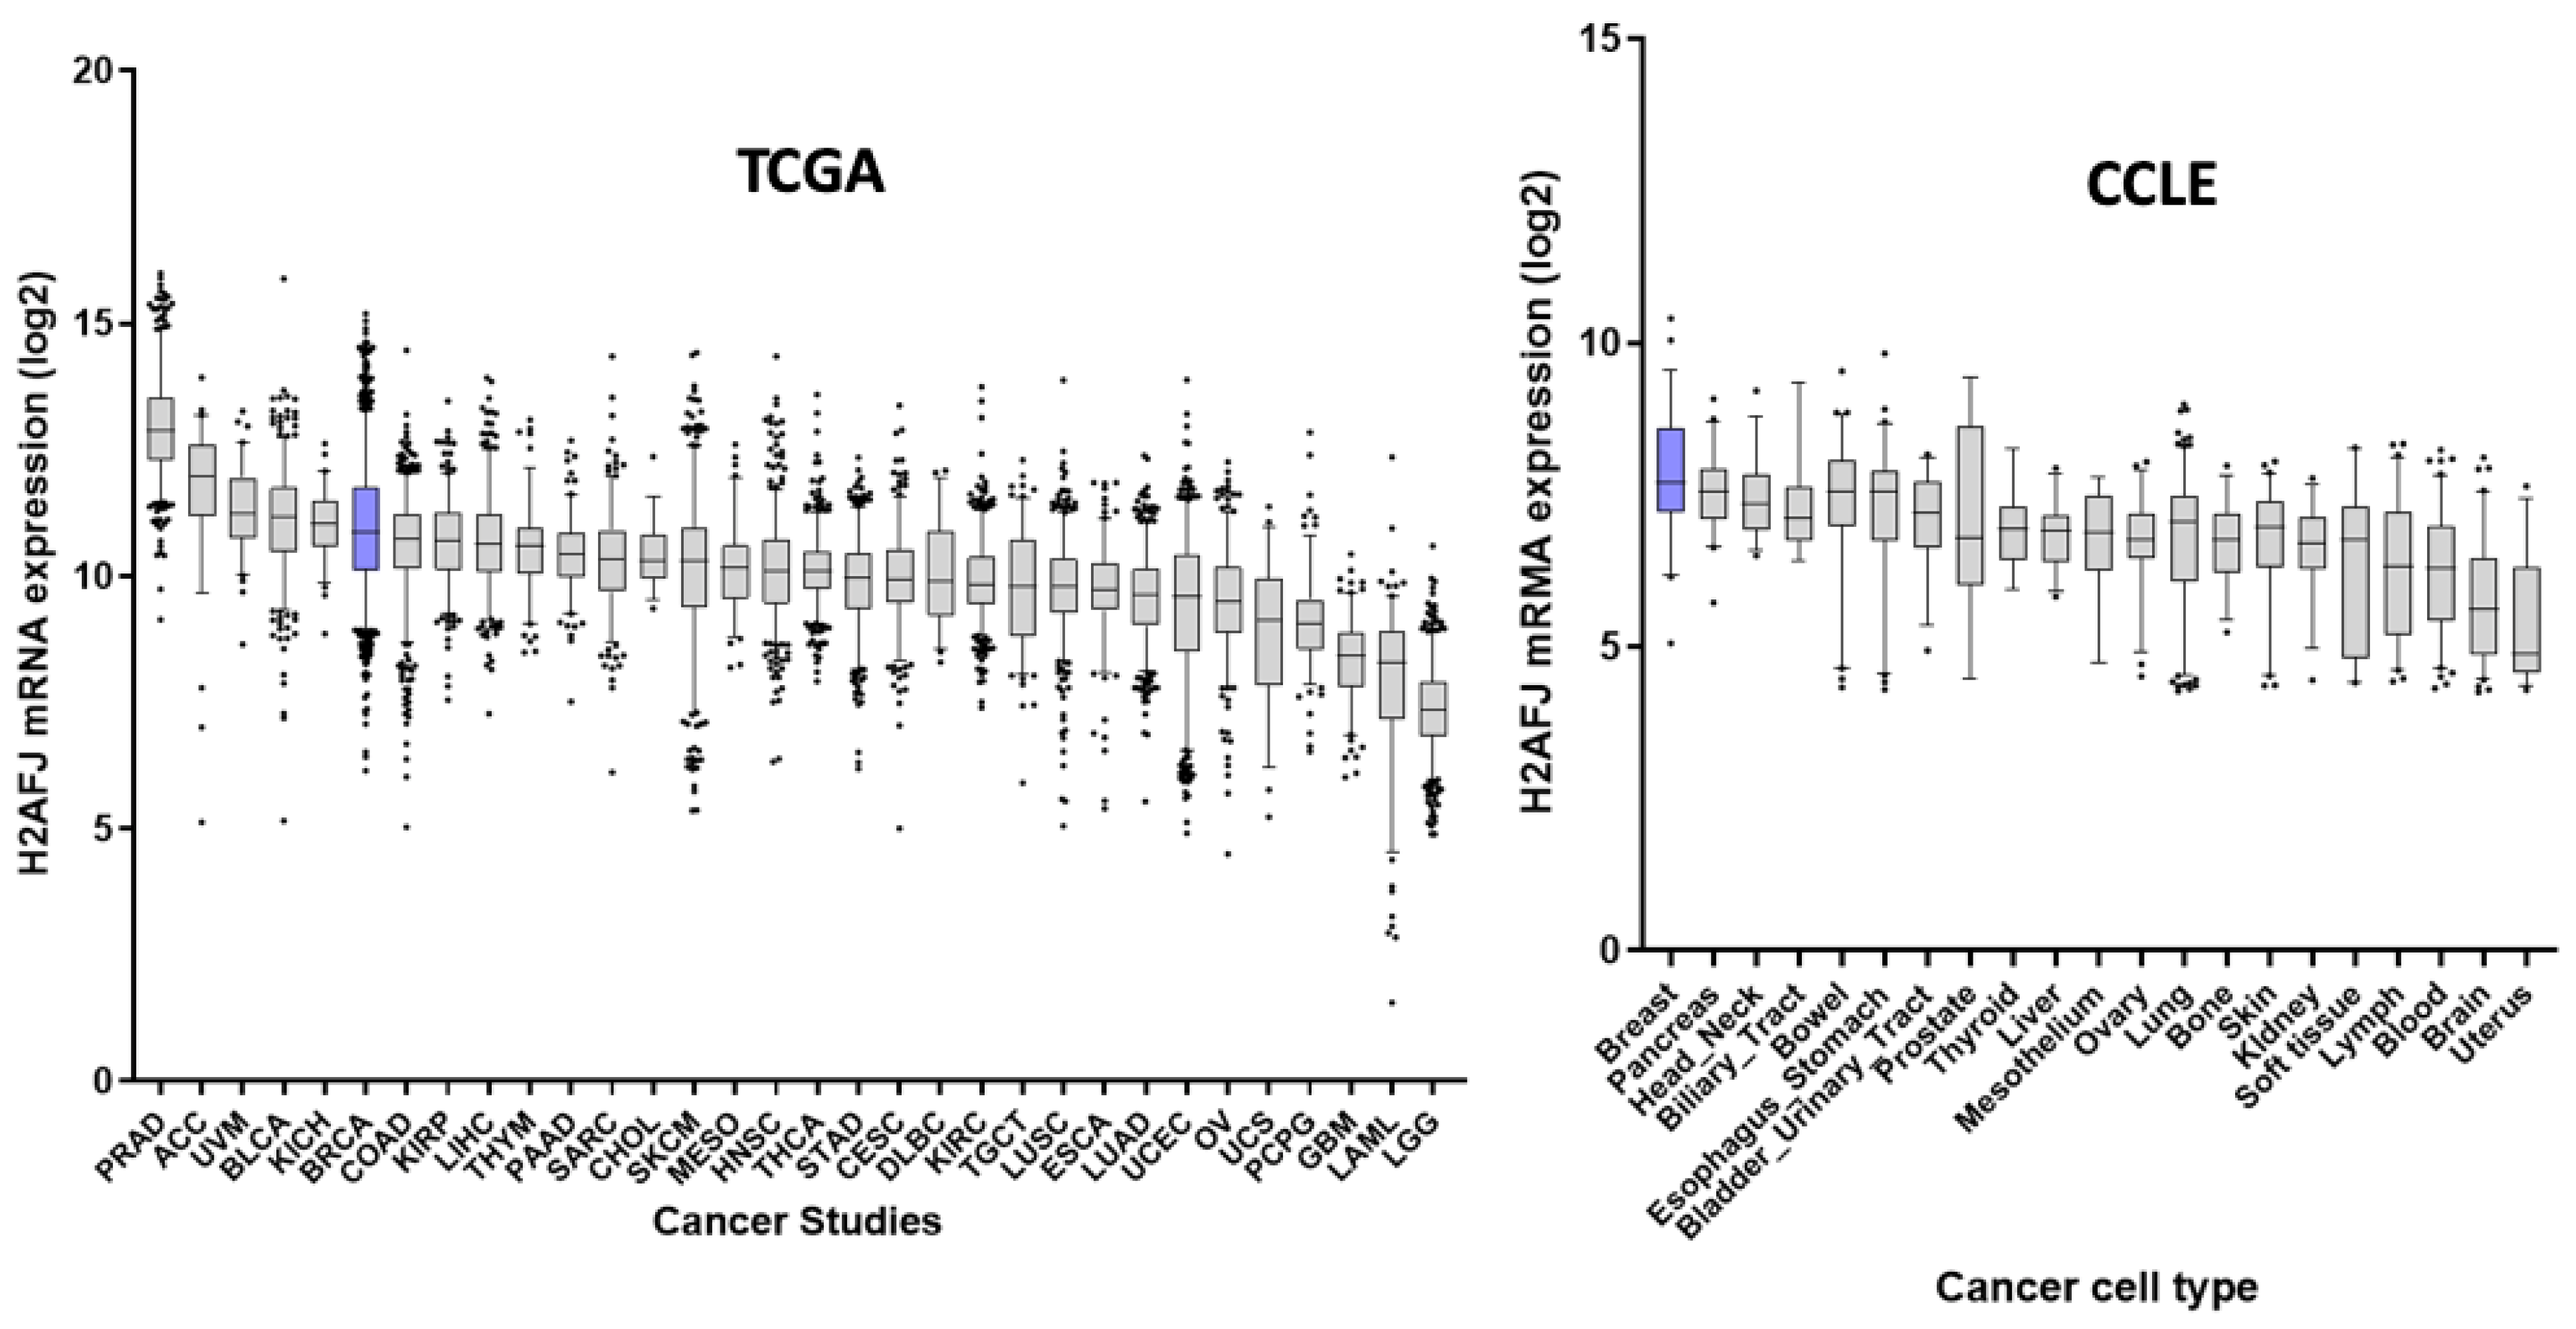
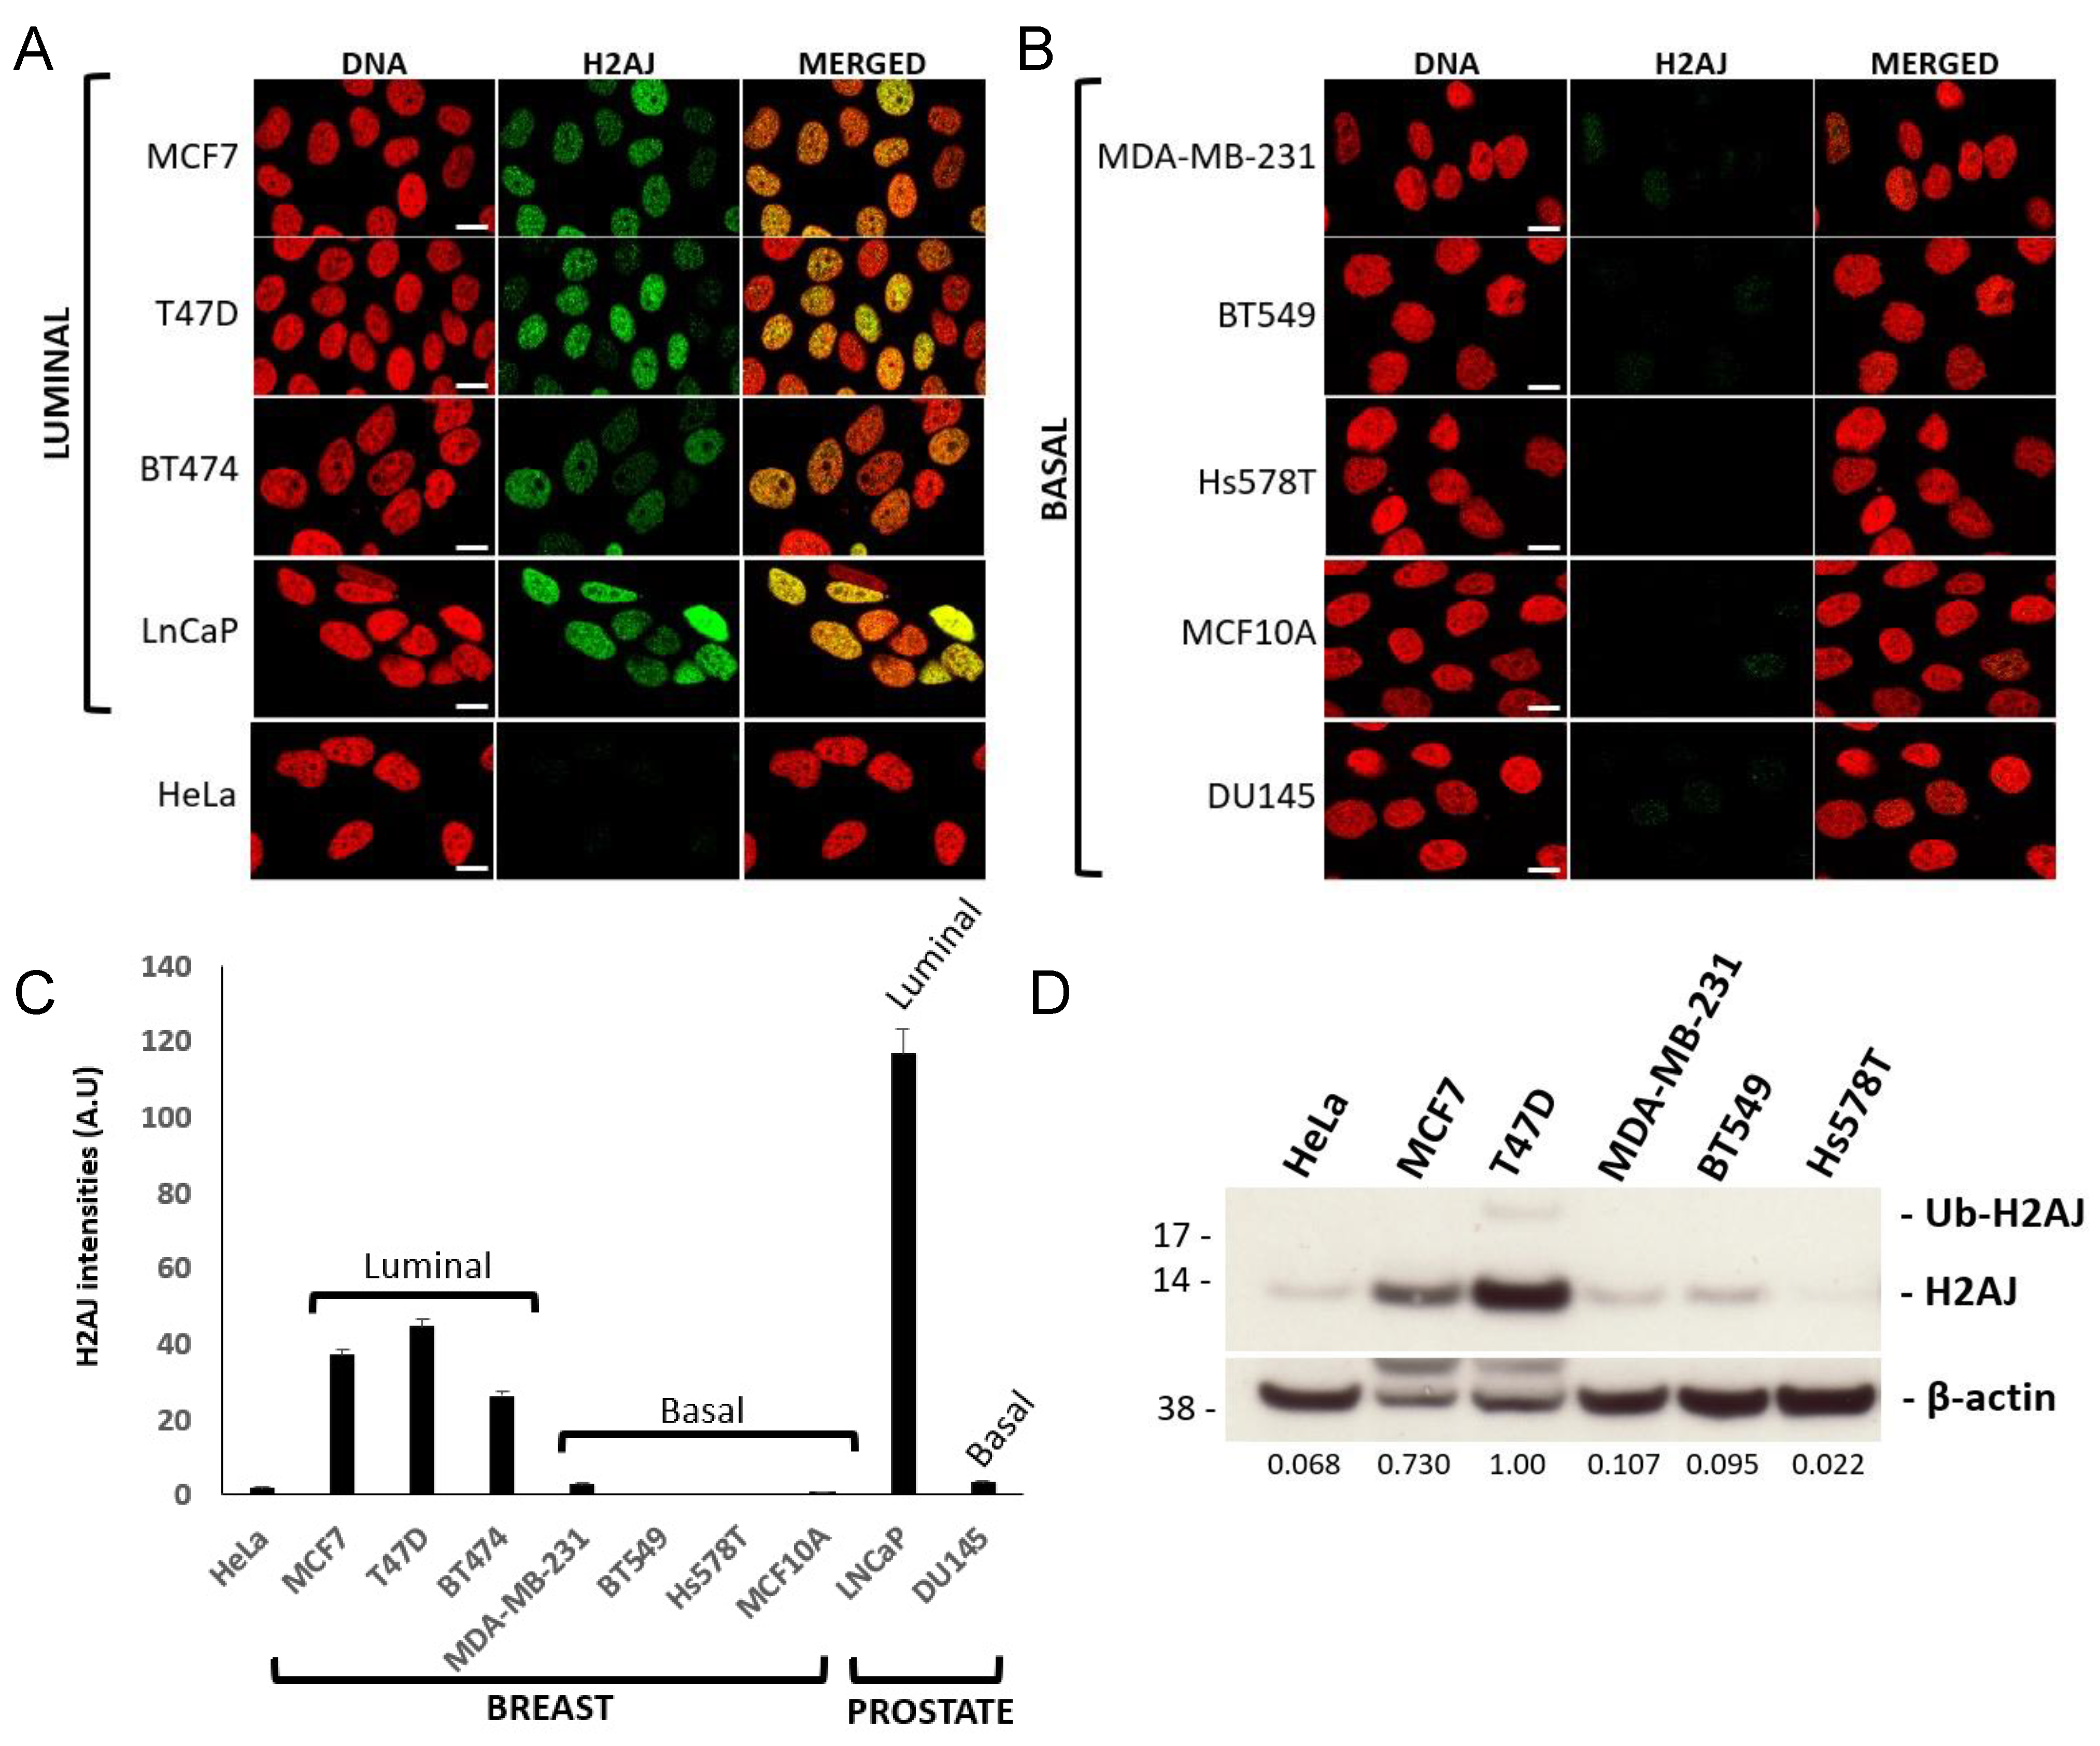
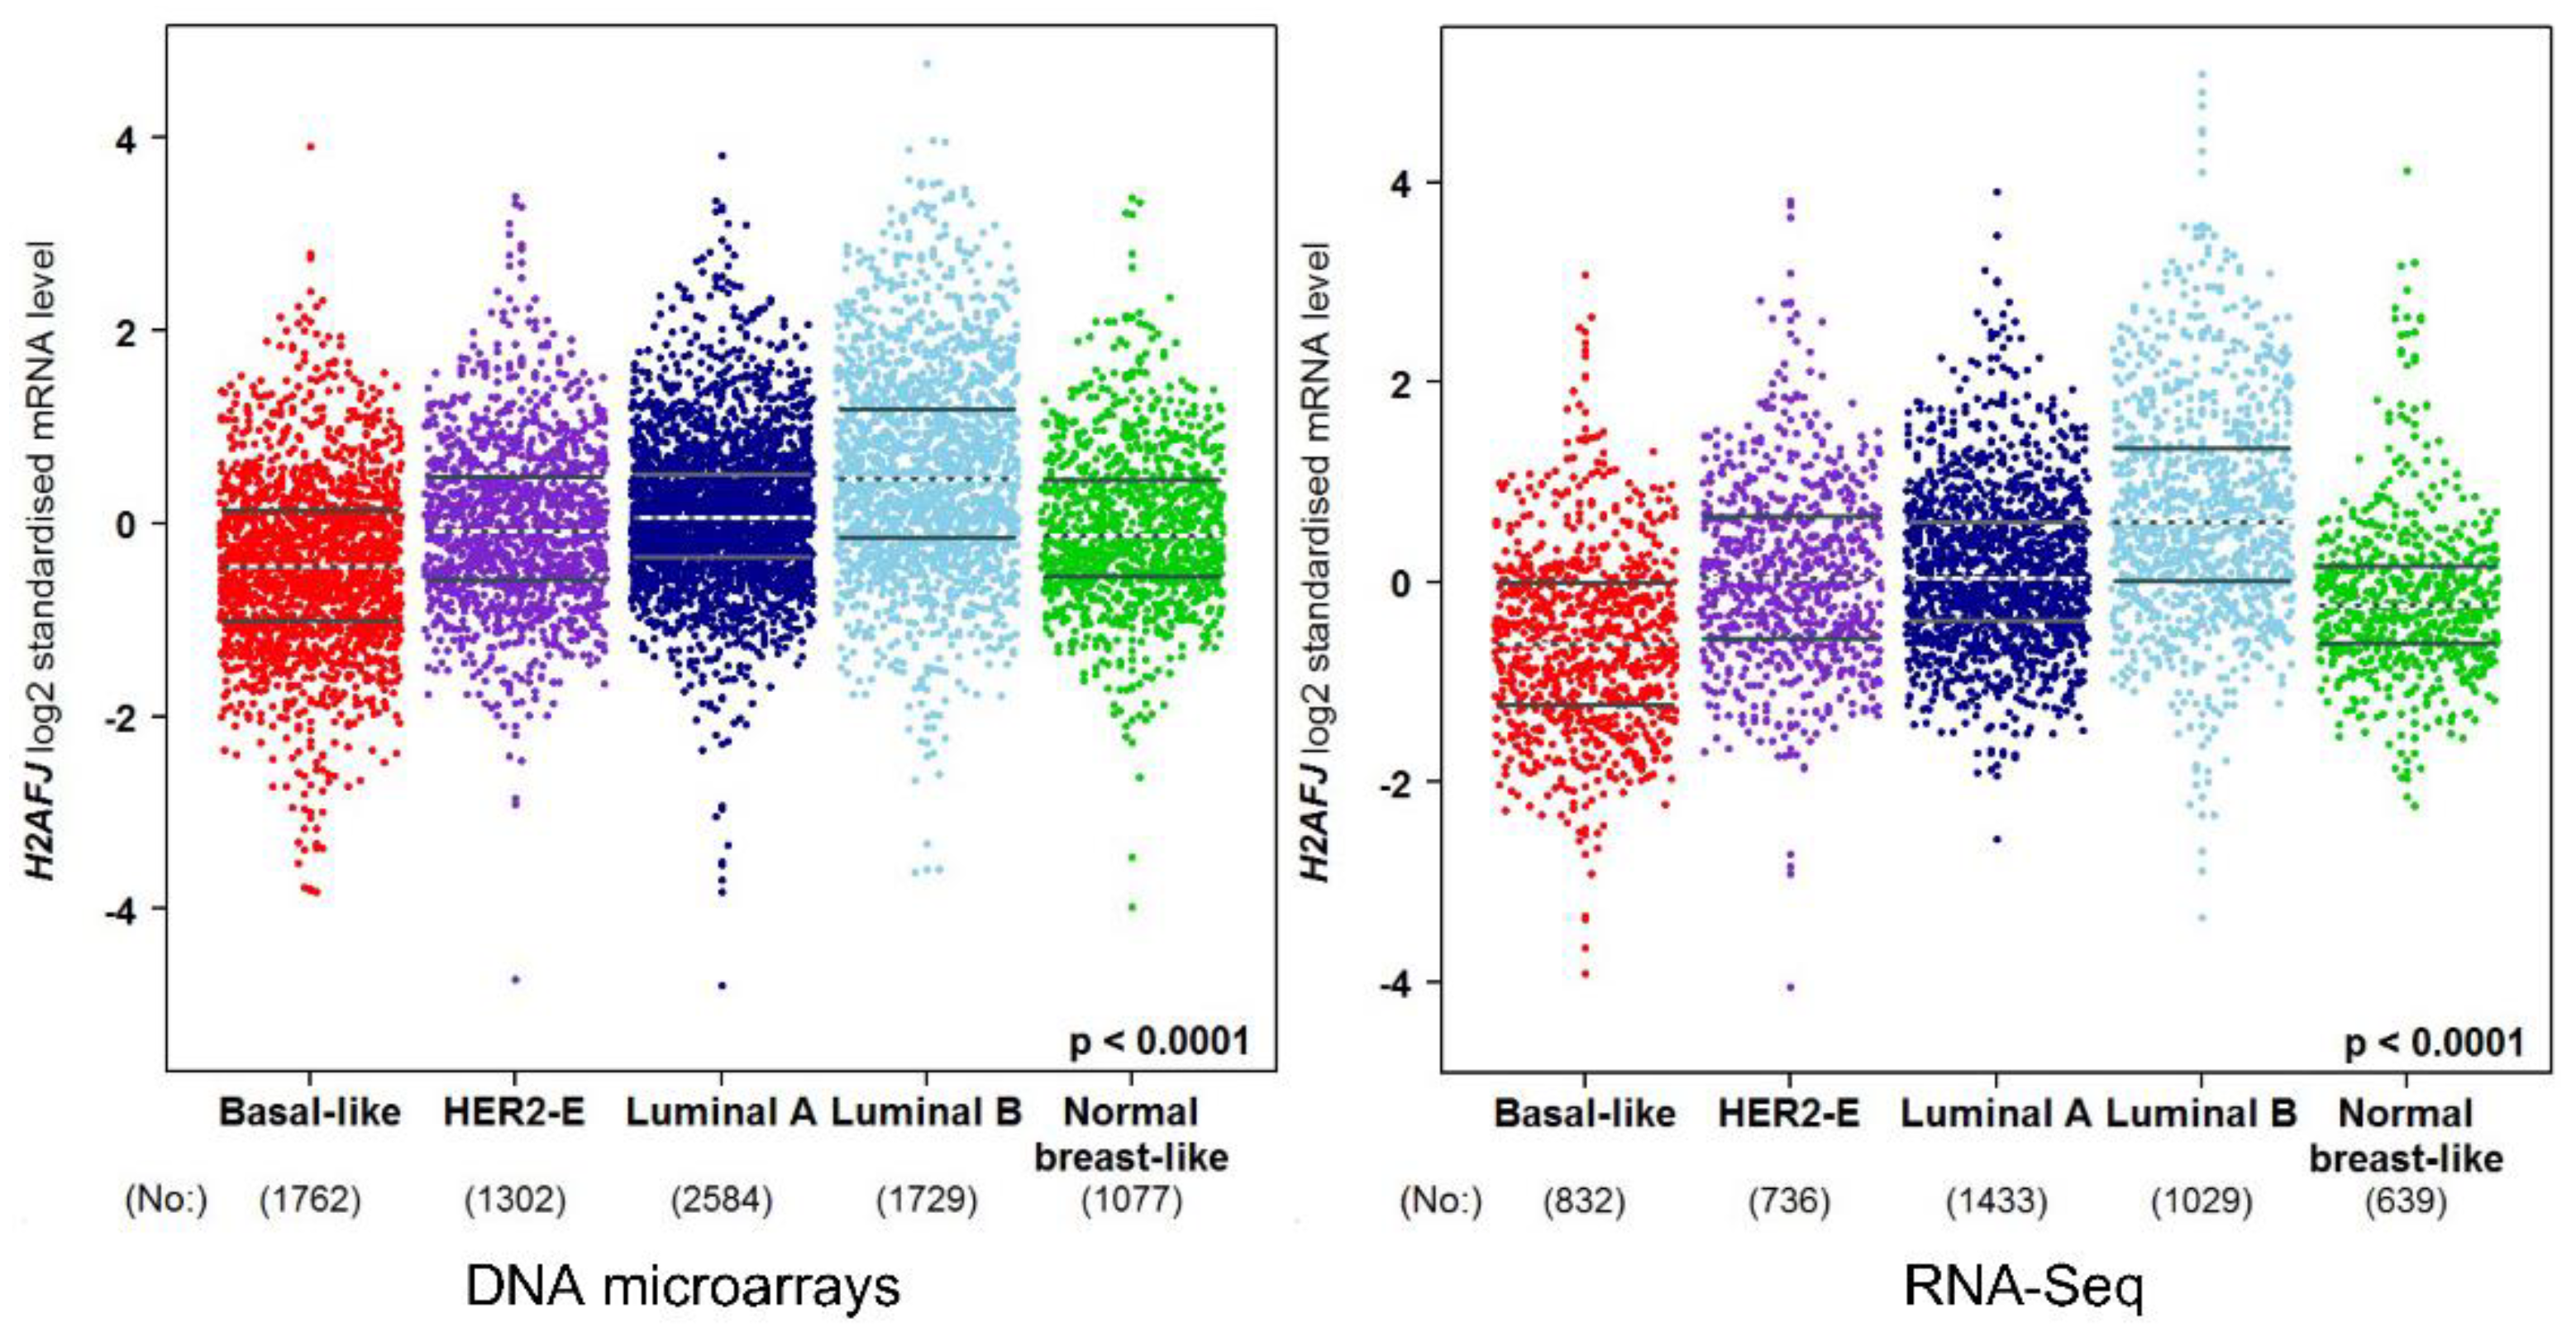
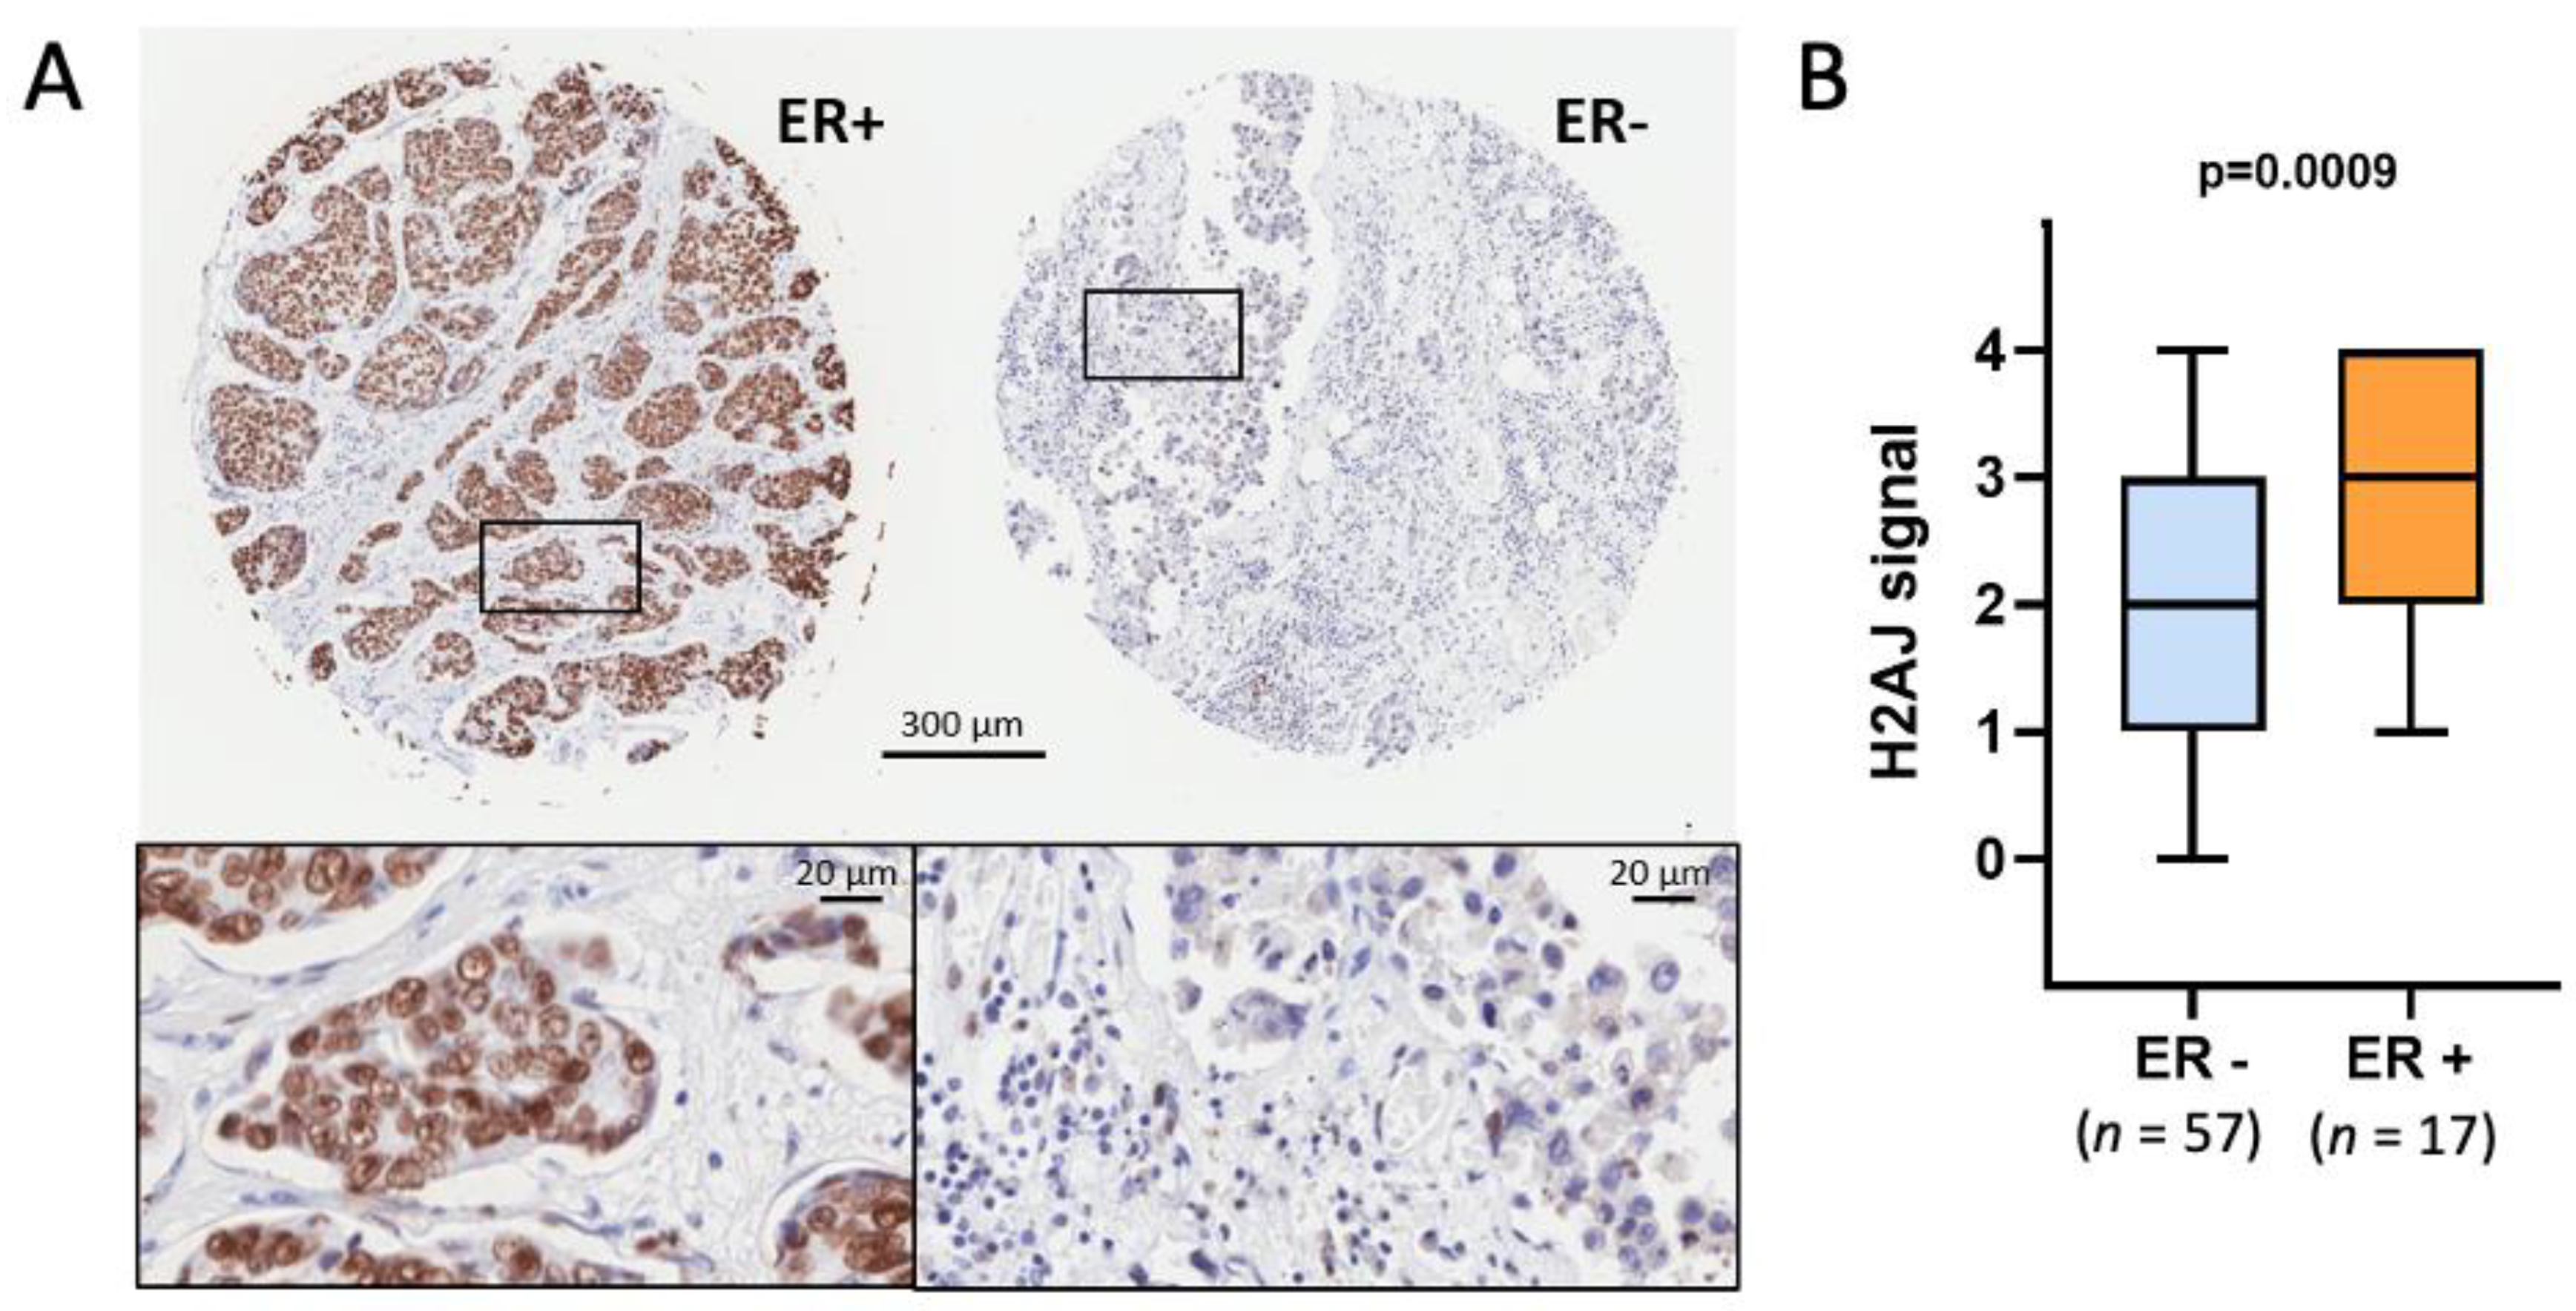
3.3. H2A.J Is a Marker of Luminal Breast and Prostate Cancer Cells
3.4. Single-Cell RNA Analaysis of H2AFJ Expression in Prostate Cancer Cells
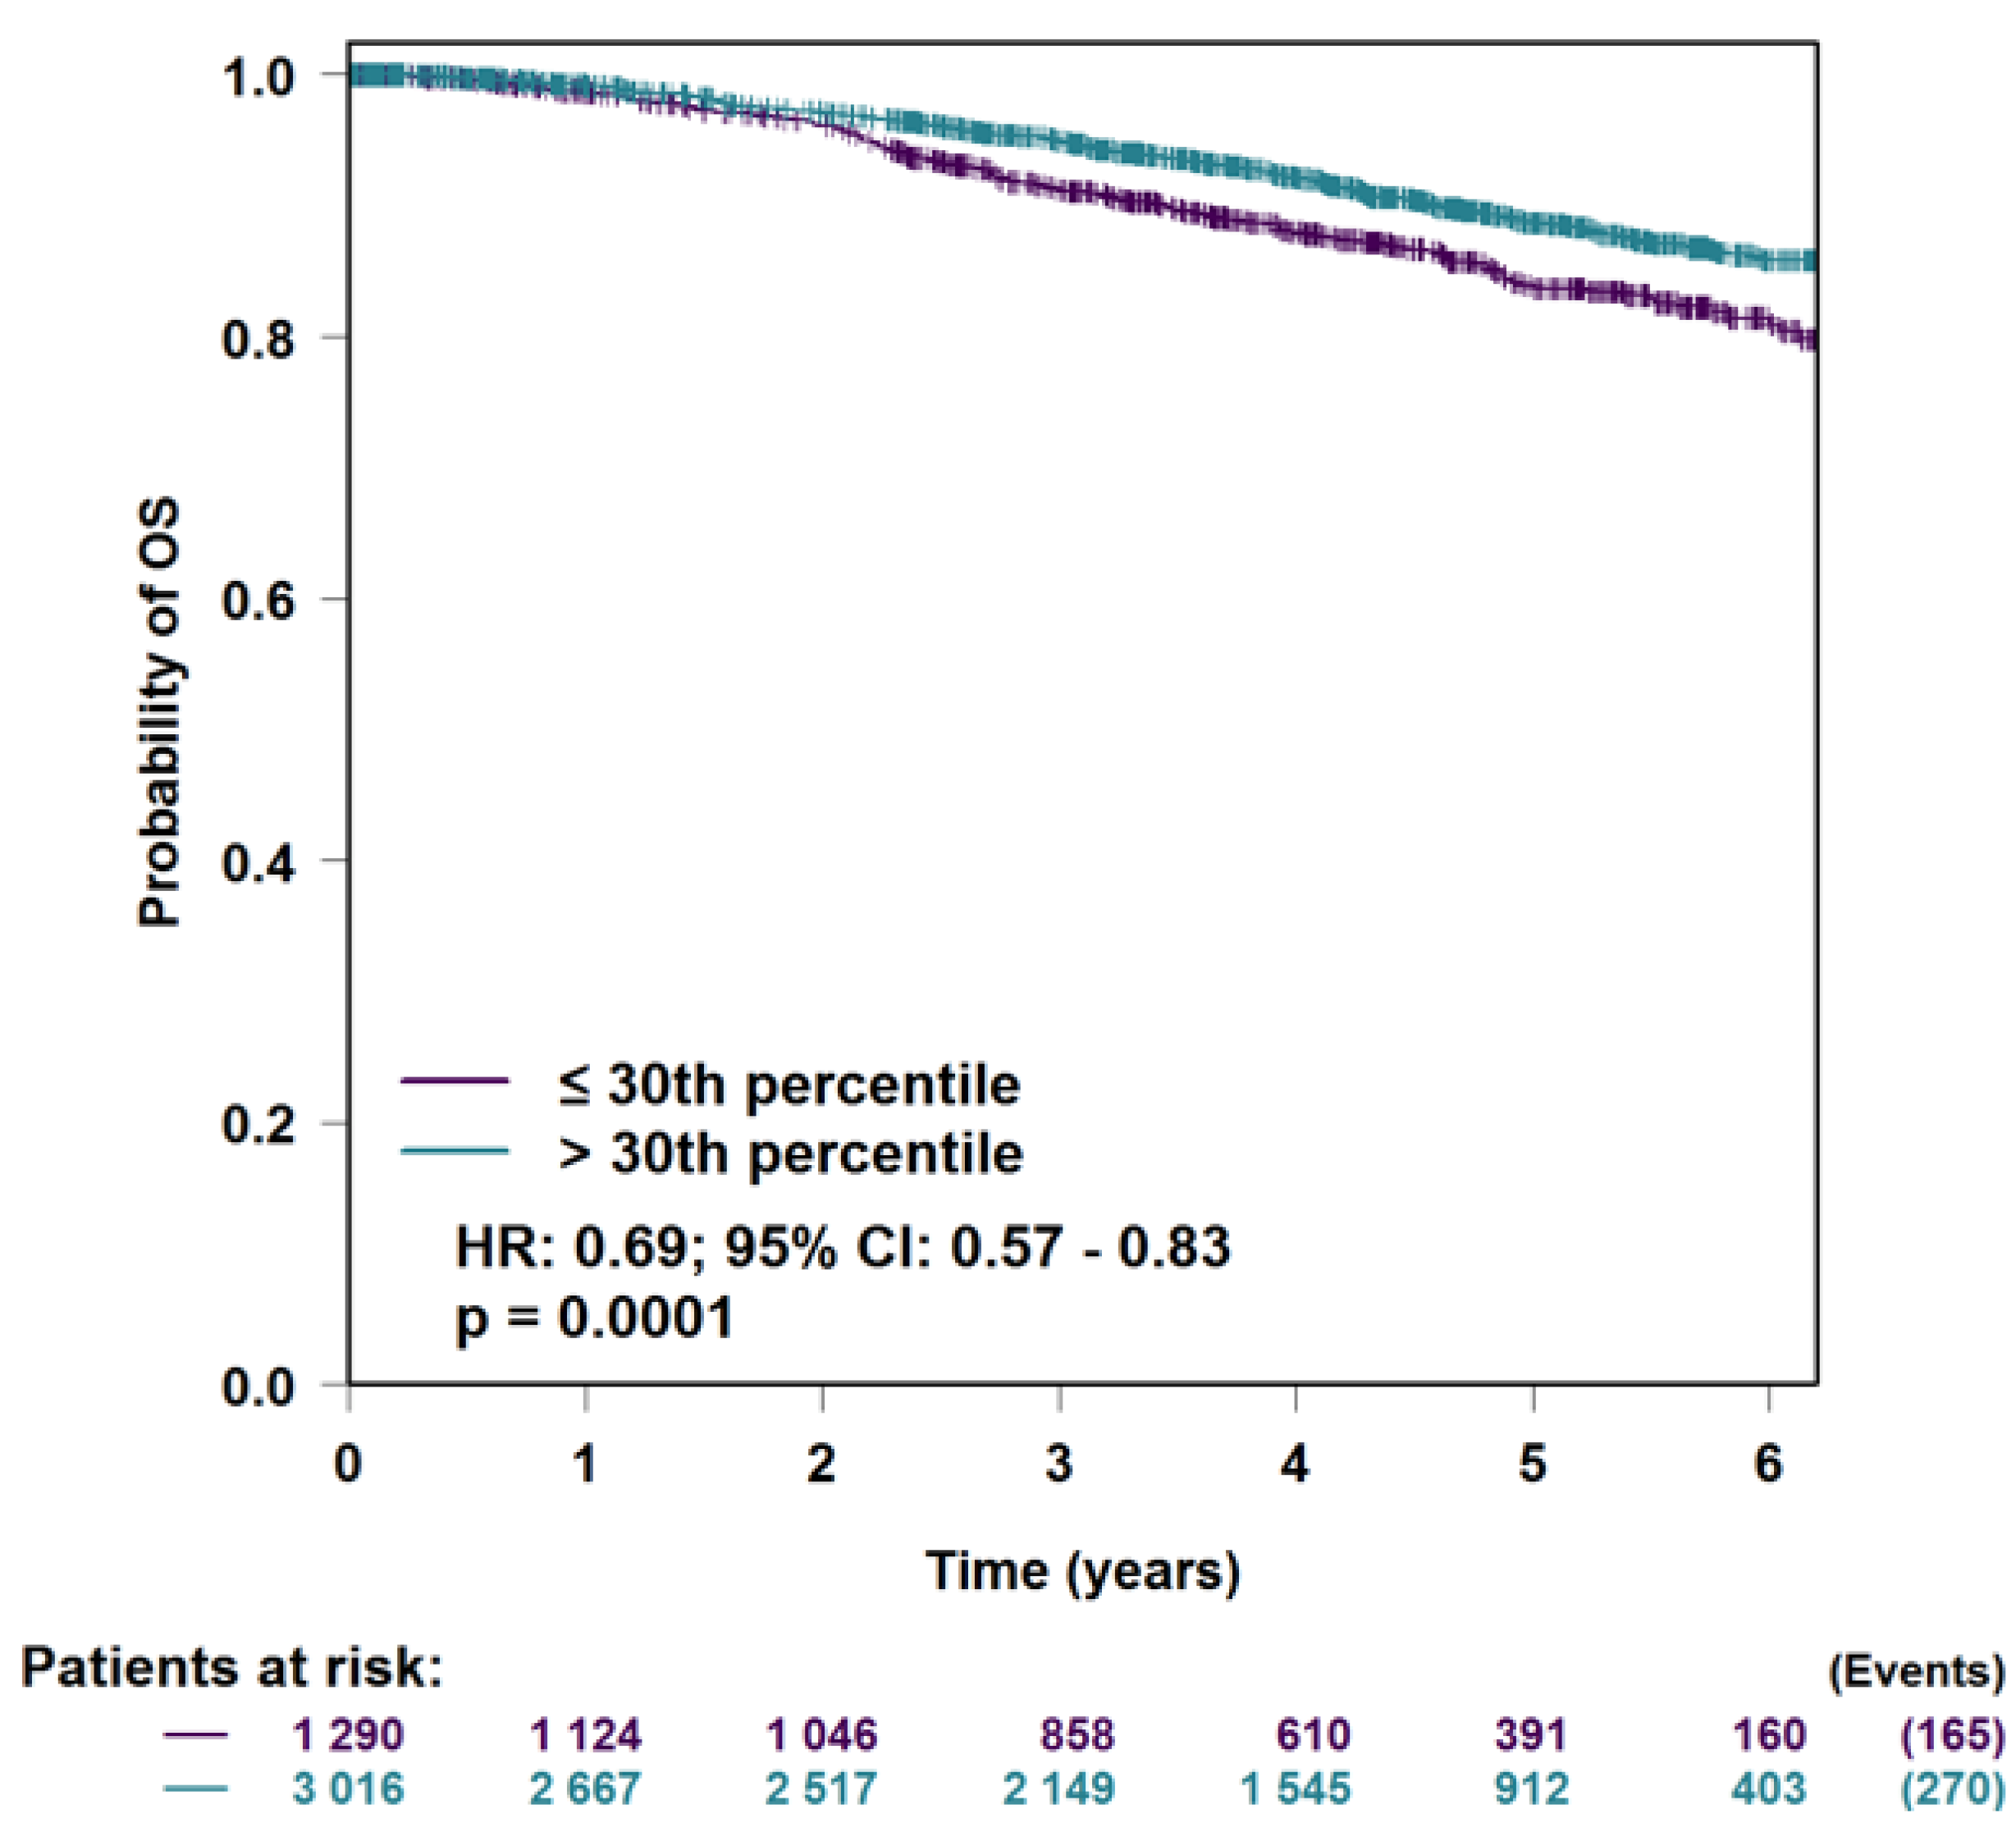
3.5. H2AFJ Expression in Relation to Breast Cancer Survival
3.6. H2AFJ Expression in Relation to Survival for Other TCGA Cancer Types
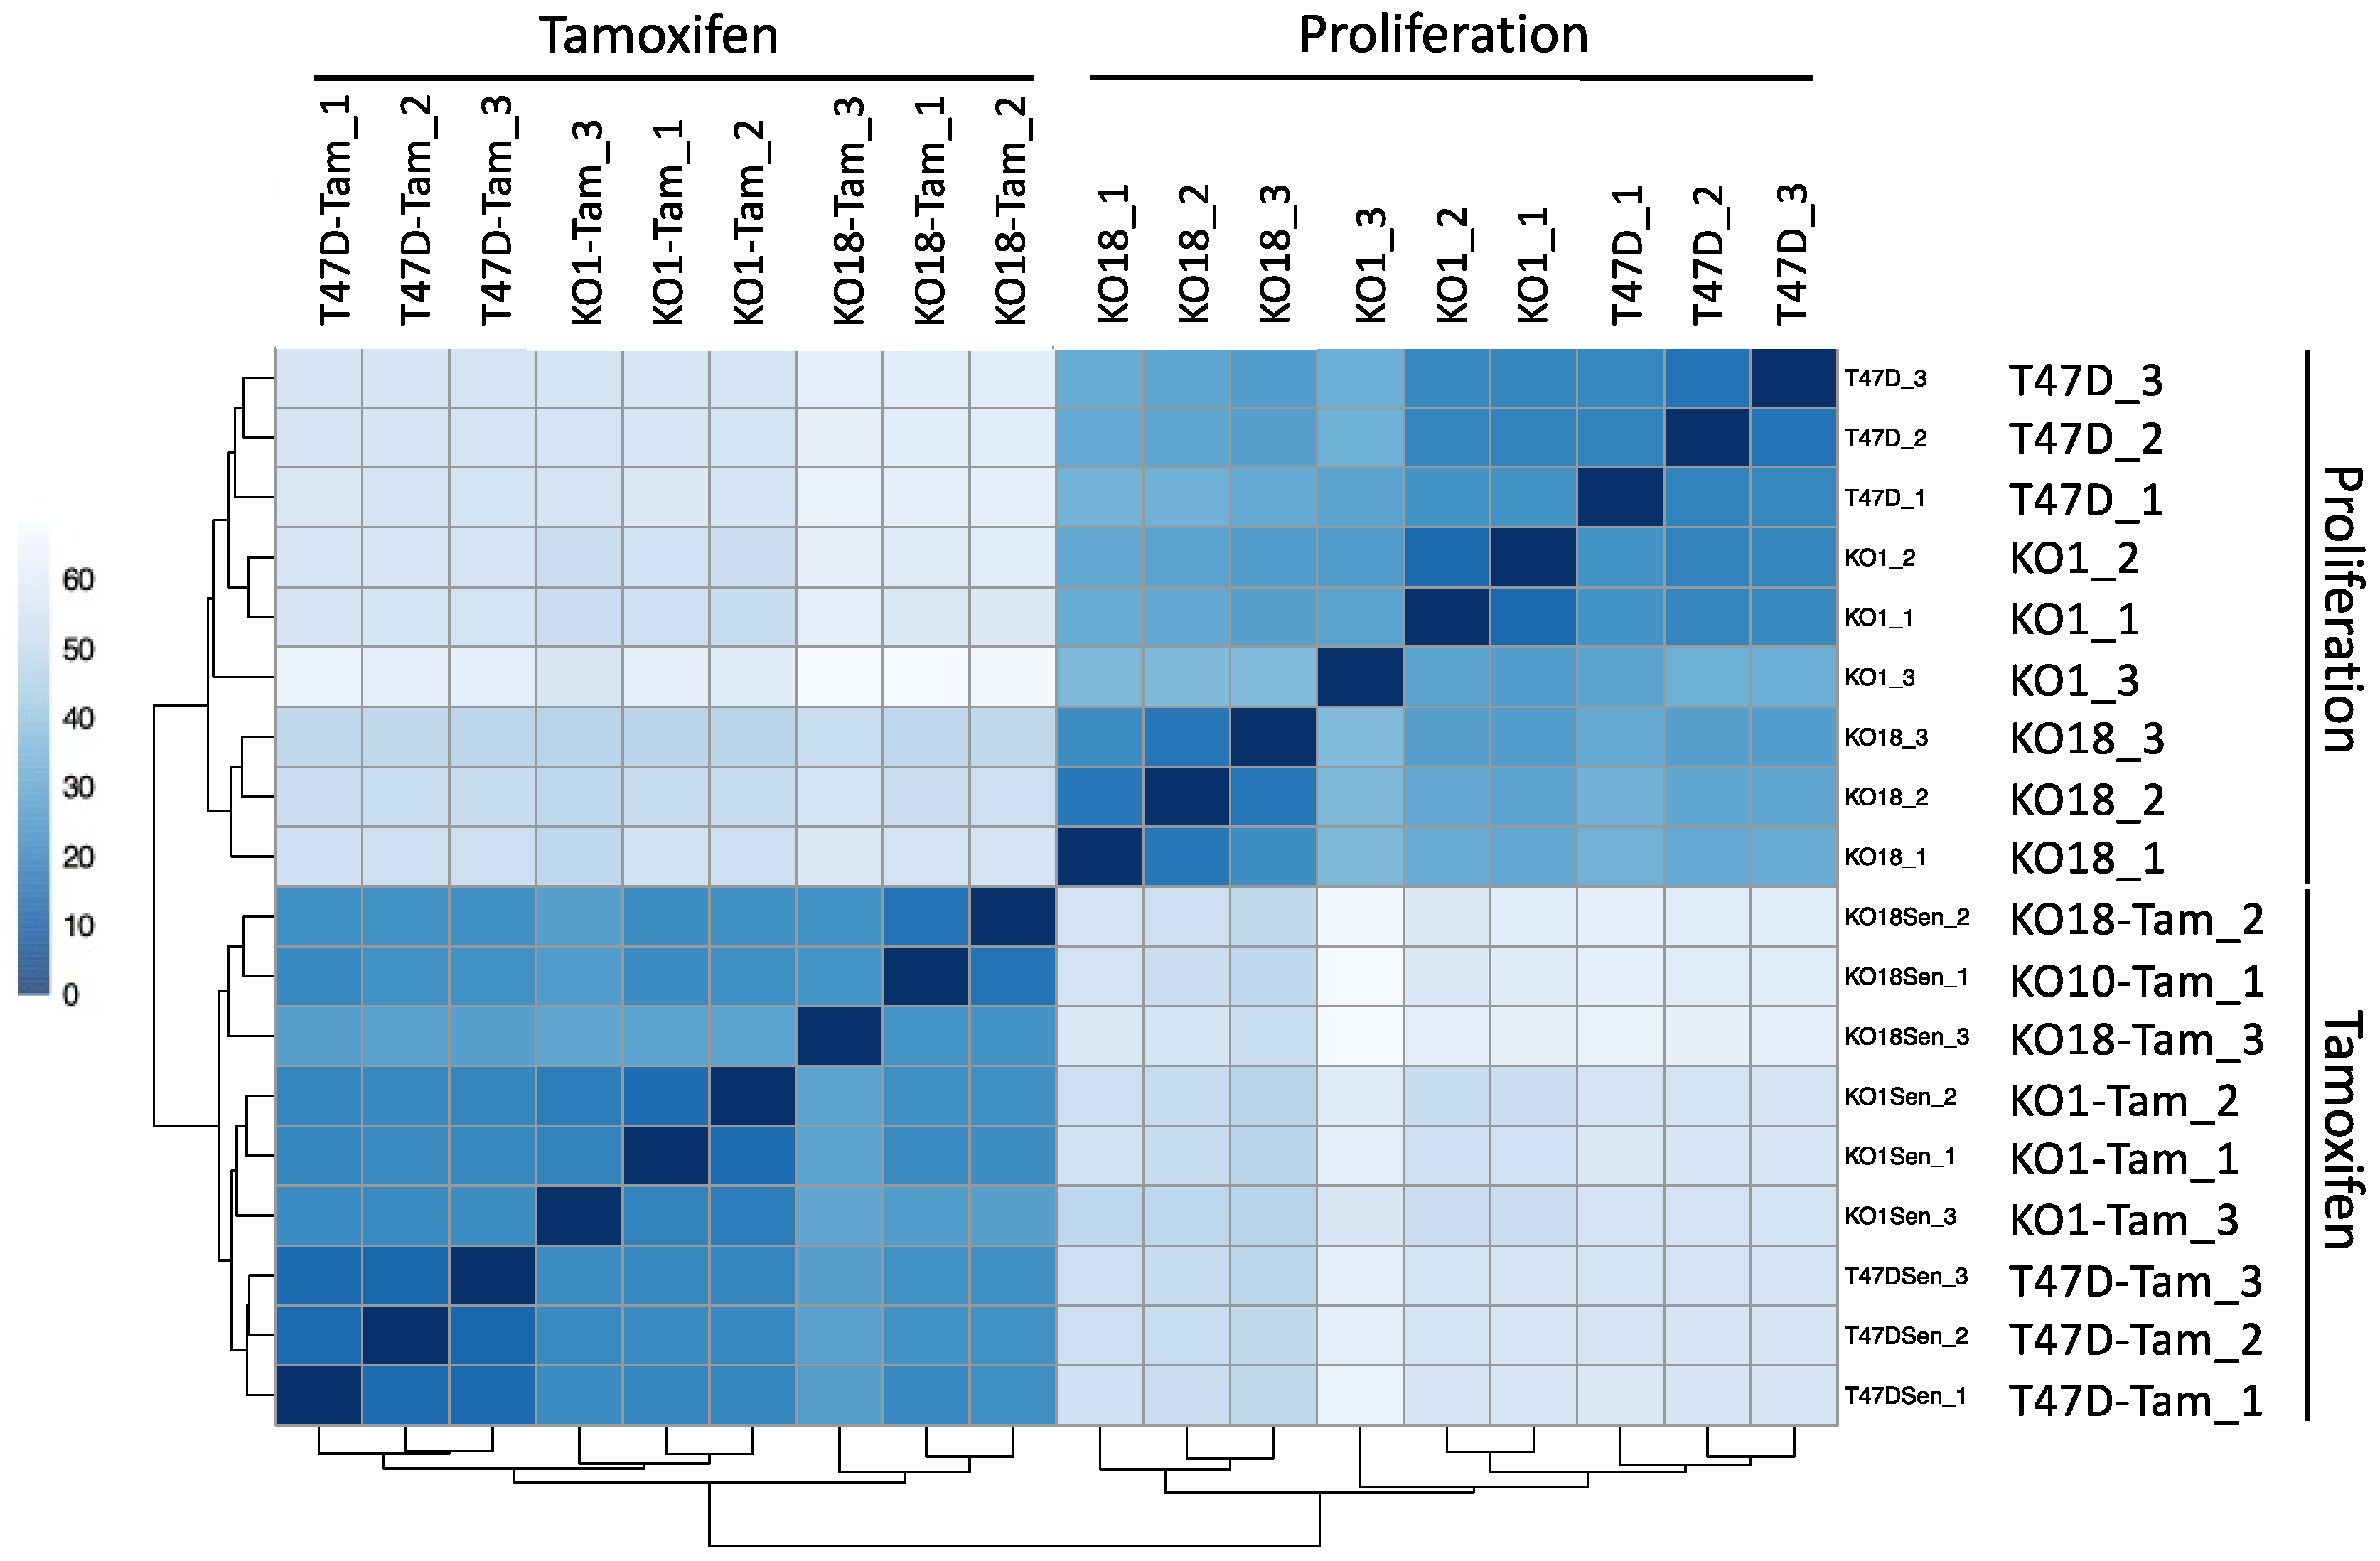
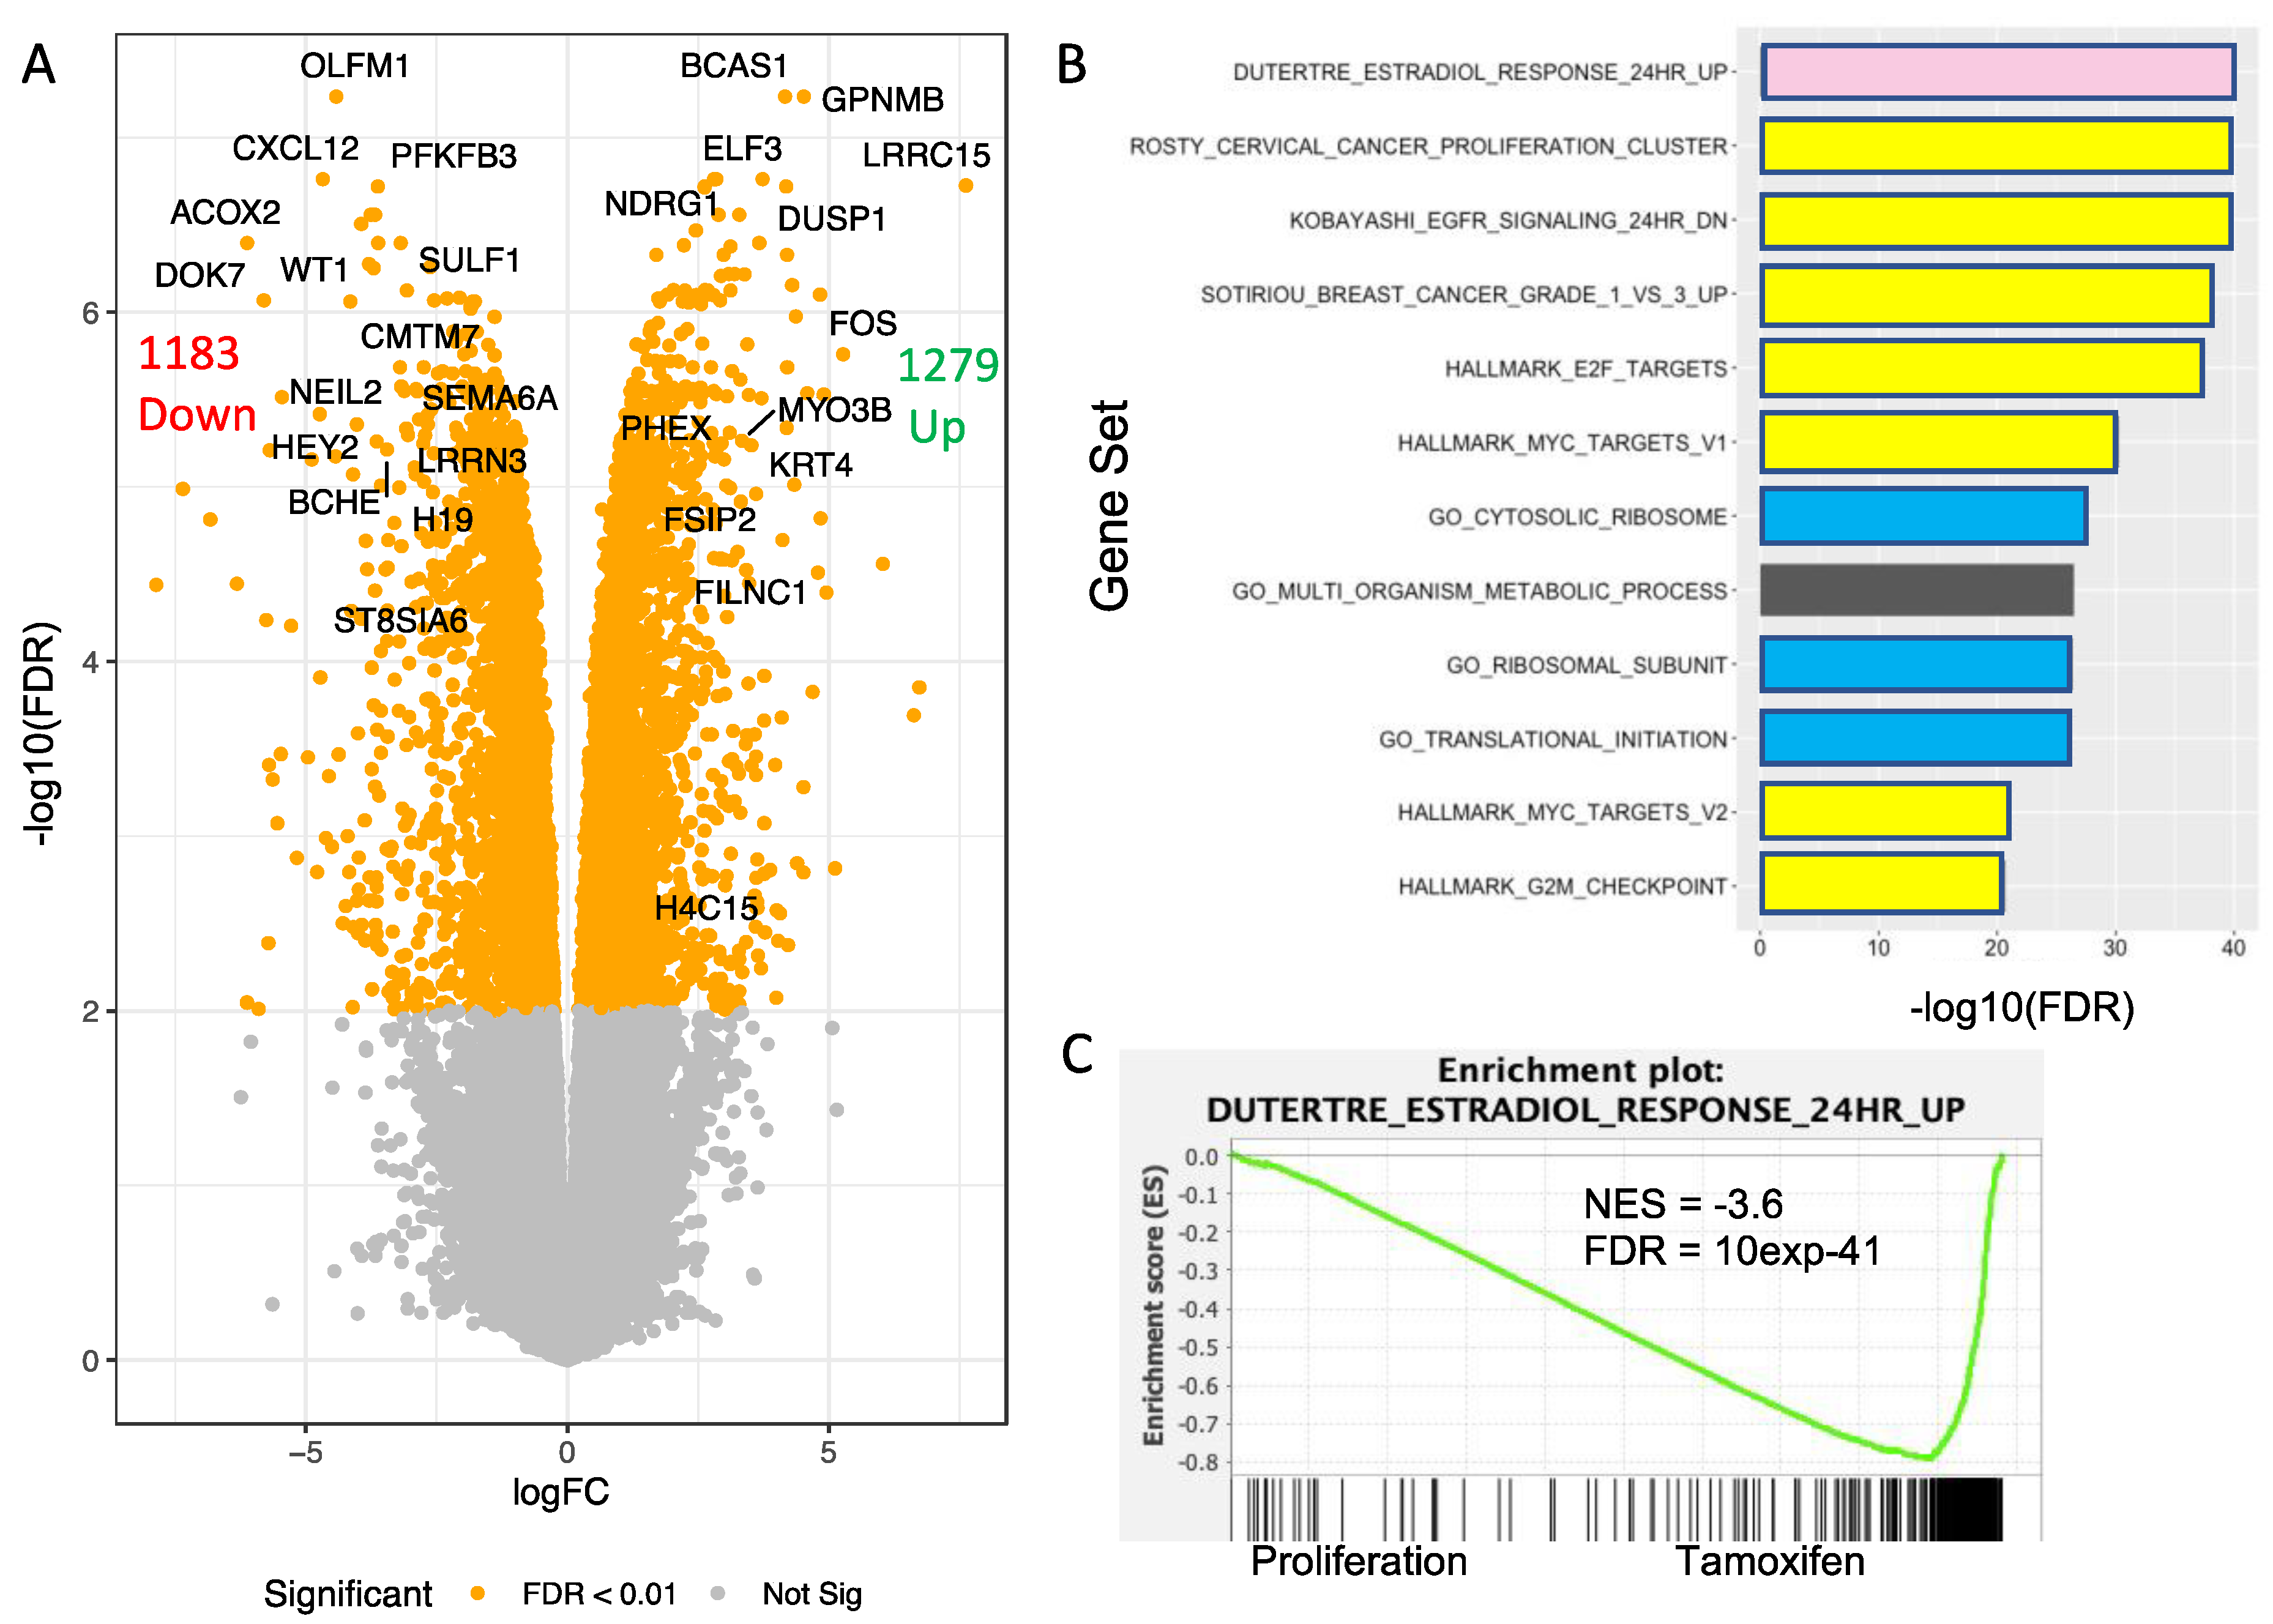
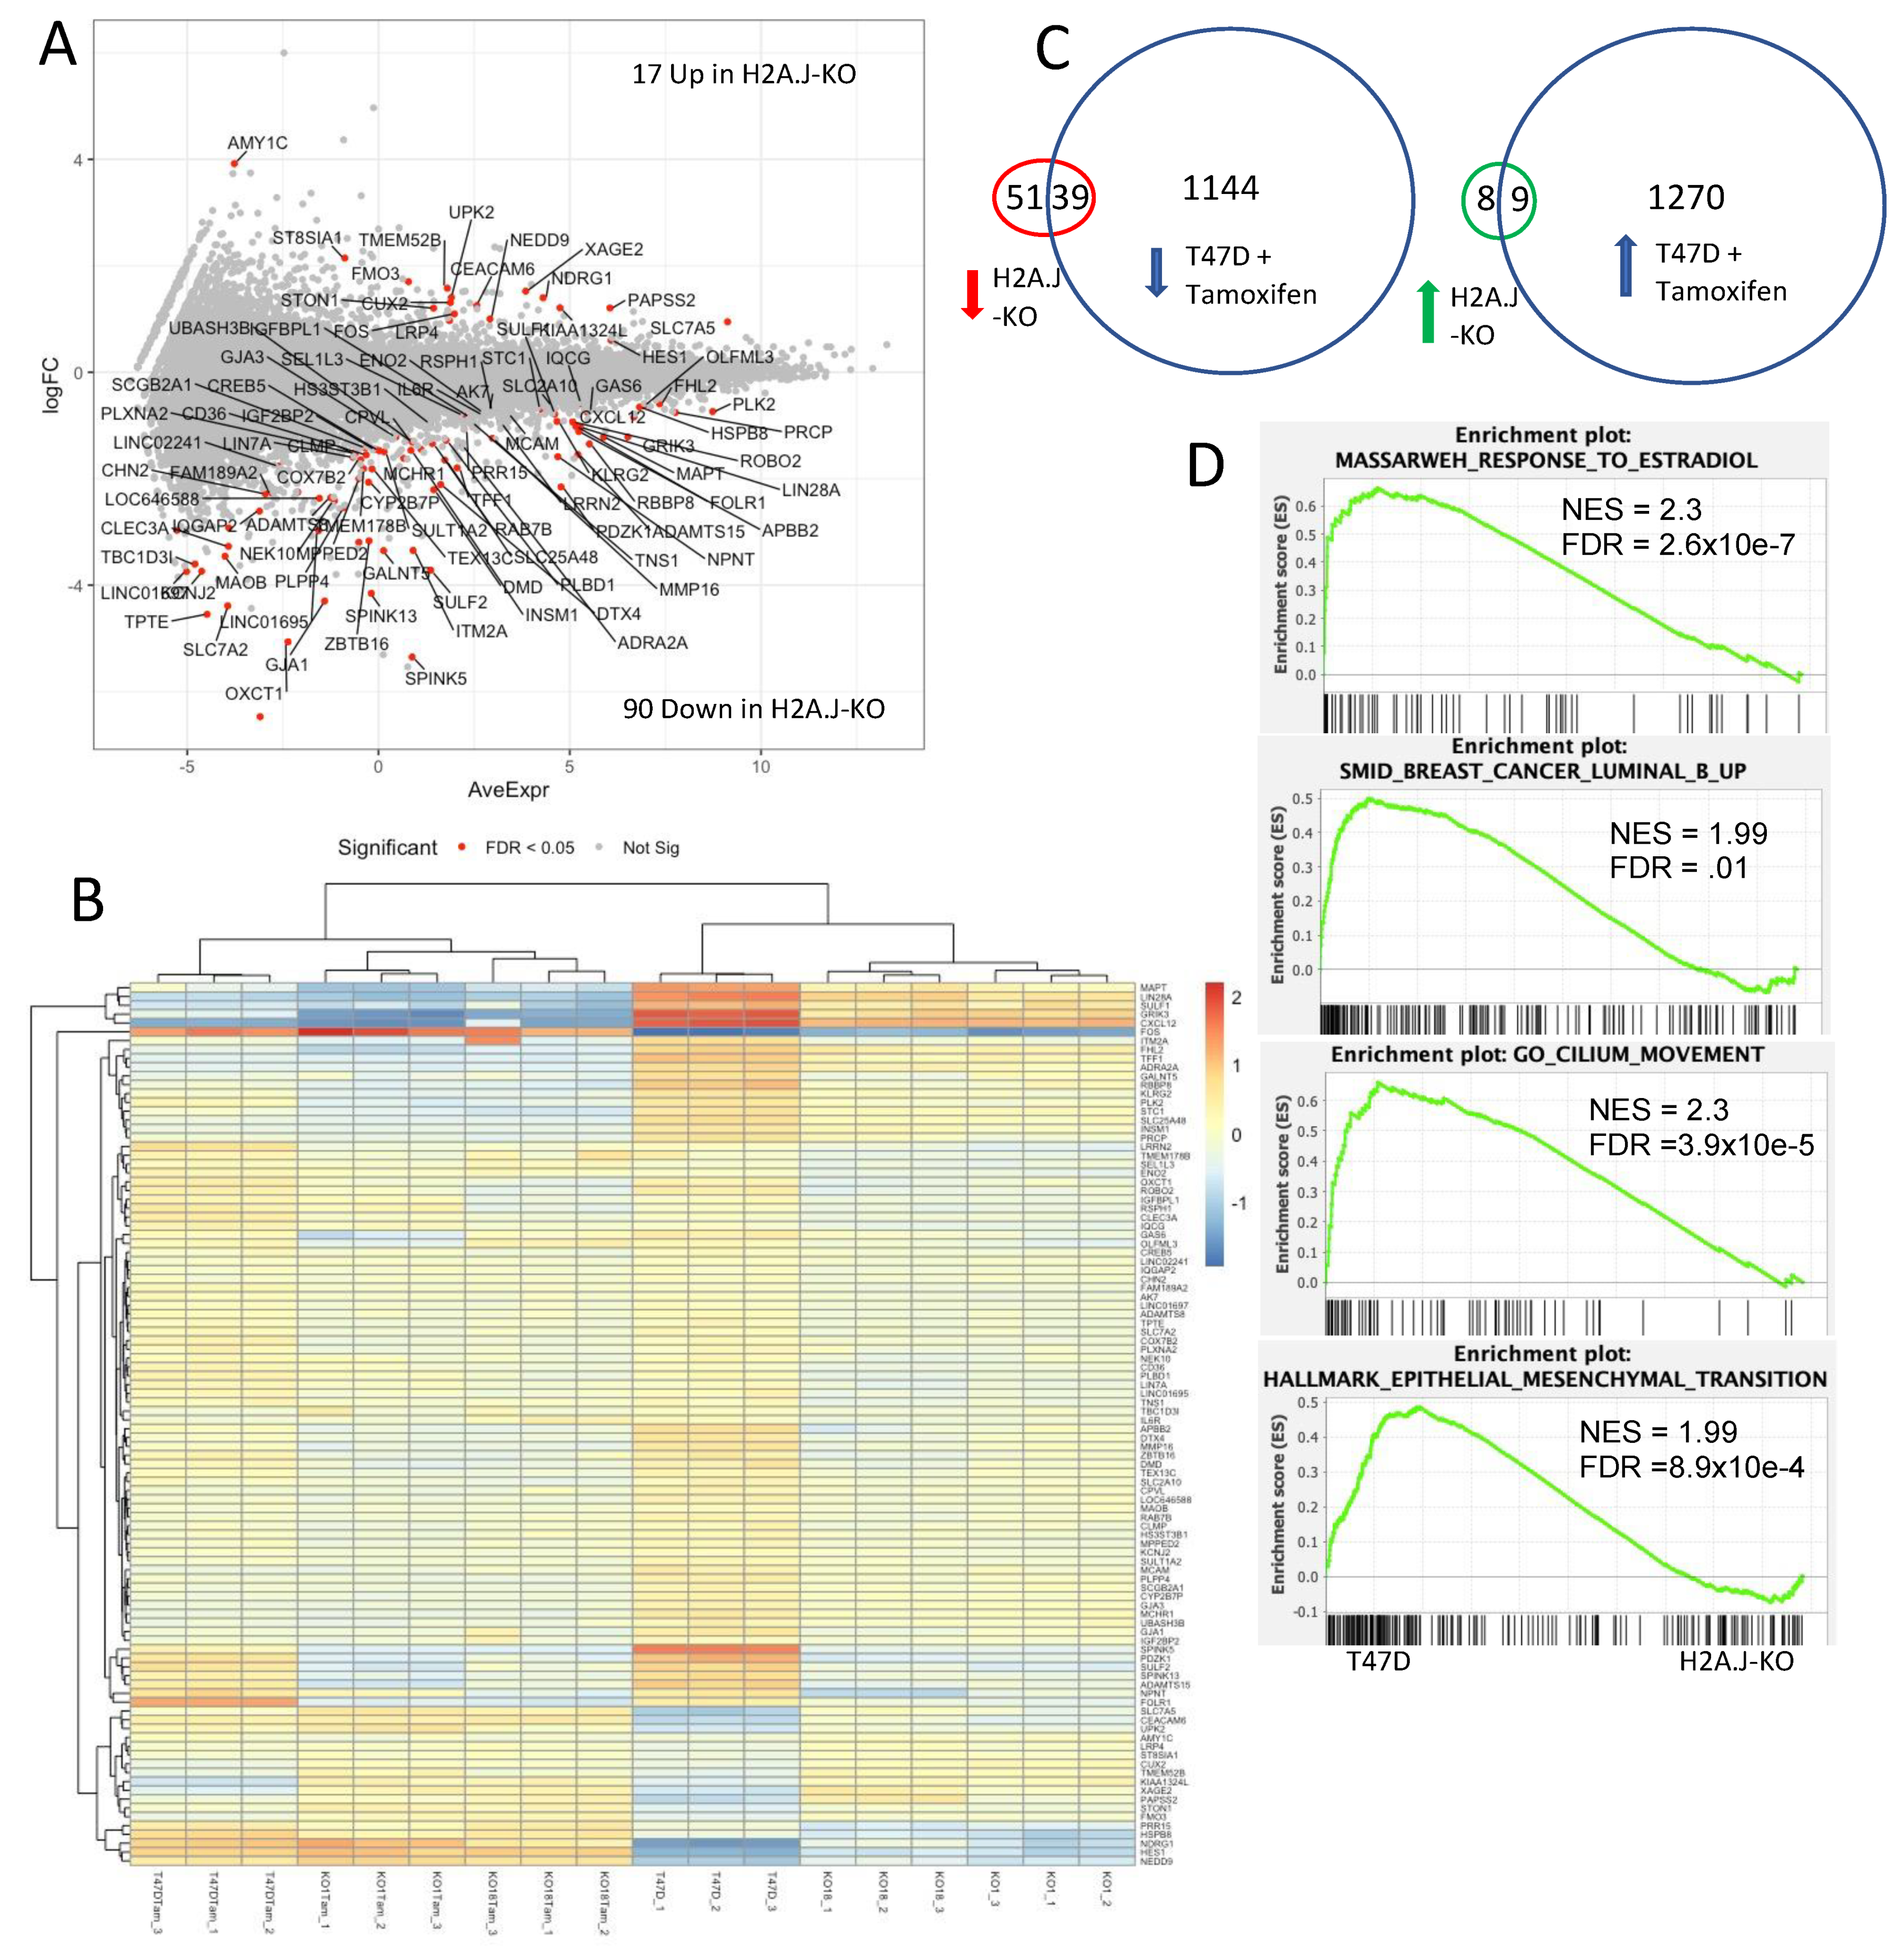
3.7. Transcriptomic Analysis of T47D H2A.J-KO Cells
4. Discussion
Supplementary Materials
Author Contributions
Funding
Institutional Review Board Statement
Informed Consent Statement
Data Availability Statement
Acknowledgments
Conflicts of Interest
References
- Marzluff, W.F.F.; Koreski, K.P.P. Birth and Death of Histone MRNAs. Trends Genet. 2017, 33, 745–759. [Google Scholar] [CrossRef]
- Romeo, V.; Schümperli, D. Cycling in the Nucleus: Regulation of RNA 3′ Processing and Nuclear Organization of Replication-Dependent Histone Genes. Curr. Opin. Cell Biol. 2016, 40, 23–31. [Google Scholar] [CrossRef] [Green Version]
- Talbert, P.B.; Henikoff, S. Histone Variants at a Glance. J. Cell Sci. 2021, 134, jcs244749. [Google Scholar] [CrossRef]
- Mangelinck, A.; Mann, C. DNA Methylation and Histone Variants in Aging and Cancer. Int. Rev. Cell Mol. Biol. 2021, 364, 1–110. [Google Scholar] [CrossRef] [PubMed]
- Contrepois, K.; Coudereau, C.; Benayoun, B.; Schuler, N.; Courbeyrette, R.; Thuret, J.-Y.; Ma, Z.; Derbois, C.; Nevers, M.; Snyder, M.; et al. A Novel Histone Variant H2A.J Accumulates in Senescent Human Cells with Persistent DNA Damage and Promotes Inflammatory Gene Expression. Nat. Commun. 2017, 8, 1–15. [Google Scholar] [CrossRef] [Green Version]
- Isermann, A.; Mann, C.; Rübe, C.E. Histone Variant H2A.J Marks Persistent DNA Damage and Triggers the Secretory Phenotype in Radiation-Induced Senescence. Int. J. Mol. Sci. 2020, 21, 9130. [Google Scholar] [CrossRef] [PubMed]
- Cornen, S.; Guille, A.; Adélaïde, J.; Addou-Klouche, L.; Finetti, P.; Saade, M.R.; Manai, M.; Carbuccia, N.; Bekhouche, I.; Letessier, A.; et al. Candidate Luminal B Breast Cancer Genes Identified by Genome, Gene Expression and DNA Methylation Profiling. PLoS ONE 2014, 9, e81843. [Google Scholar] [CrossRef]
- Yao, J.; Weremowicz, S.; Feng, B.; Gentleman, R.C.; Marks, J.R.; Gelman, R.; Brennan, C.; Polyak, K. Combined CDNA Array Comparative Genomic Hybridization and Serial Analysis of Gene Expression Analysis of Breast Tumor Progression. Cancer Res 2006, 66, 4065–4078. [Google Scholar] [CrossRef] [Green Version]
- Wang, X.; Ghareeb, W.M.; Lu, X.; Huang, Y.; Huang, S.; Chi, P. Coexpression Network Analysis Linked H2AFJ to Chemoradiation Resistance in Colorectal Cancer. J. Cell. Biochem. 2019, 120, 10351–10362. [Google Scholar] [CrossRef]
- Liu, J.; Qiu, W.; Shen, X.; Sun, G. Bioinformatics Analysis Revealed Hub Genes and Pathways Involved in Sorafenib Resistance in Hepatocellular Carcinoma. Math. Biosci. Eng. 2019, 16, 6319–6334. [Google Scholar] [CrossRef]
- Lee, H.H.; Lin, C.H.; Lin, H.Y.; Kuei, C.H.; Zheng, J.Q.; Wang, Y.H.; Lu, L.S.; Lee, F.P.; Hu, C.J.; Wu, D.; et al. Histone 2A Family Member j Drives Mesenchymal Transition and Temozolomide Resistance in Glioblastoma Multiforme. Cancers 2020, 12, 98. [Google Scholar] [CrossRef] [Green Version]
- Park, A.; Won, S.T.; Pentecost, M.; Bartkowski, W.; Lee, B. CRISPR/Cas9 Allows Efficient and Complete Knock-in of a Destabilization Domain-Tagged Essential Protein in a Human Cell Line, Allowing Rapid Knockdown of Protein Function. PLoS ONE 2014, 9, e95101. [Google Scholar] [CrossRef] [Green Version]
- Rübe, C.E.; Bäumert, C.; Schuler, N.; Isermann, A.; Schmal, Z.; Glanemann, M.; Mann, C.; Scherthan, H. Human Skin Aging Is Associated with Increased Expression of the Histone Variant H2A.J in the Epidermis. npj Aging Mech. Dis. 2021, 7, 1–11. [Google Scholar] [CrossRef] [PubMed]
- Redon, C.E.; Nakamura, A.J.; Gouliaeva, K.; Rahman, A.; Blakely, W.F.; Bonner, W.M. The Use of γ-H2AX as a Biodosimeter for Total-Body Radiation Exposure in Non-Human Primates. PLoS ONE 2010, 5, e15544. [Google Scholar] [CrossRef] [Green Version]
- Mangelinck, A.; Coudereau, C.; Courbeyrette, R.; Ourarhni, K.; Hamiche, A.; Redon, C.; Bonner, W.M.; van Dijk, E.; Derbois, C.; Olaso, R.; et al. The H2A.J Histone Variant Contributes to Interferon-Stimulated Gene Expression in Senescence by Its Weak Interaction with H1 and the Derepression of Repeated DNA Sequences. bioRxiv 2020. [Google Scholar] [CrossRef]
- Patro, R.; Duggal, G.; Love, M.I.; Irizarry, R.A.; Kingsford, C. Salmon Provides Fast and Bias-Aware Quantification of Transcript Expression. Nat. Methods 2017, 14, 417–419. [Google Scholar] [CrossRef] [PubMed] [Green Version]
- Love, M.I.; Soneson, C.; Hickey, P.F.; Johnson, L.K.; Pierce, N.T.; Shepherd, L.; Morgan, M.; Patro, R. Tximeta: Reference Sequence Checksums for Provenance Identification in RNA-Seq. PLoS Comput. Biol. 2020, 16, e1007664. [Google Scholar] [CrossRef] [Green Version]
- Love, M.I.; Anders, S.; Huber, W. Differential Analysis of Count Data—The DESeq2 Package. Genome Biol. 2014, 15, 550. [Google Scholar] [CrossRef] [Green Version]
- Lun, A.T.L.; Smyth, G.K. Csaw: A Bioconductor Package for Differential Binding Analysis of ChIP-Seq Data Using Sliding Windows. Nucleic Acids Res. 2016, 44, e45. [Google Scholar] [CrossRef]
- Anders, S.; McCarthy, D.J.; Chen, Y.; Okoniewski, M.; Smyth, G.K.; Huber, W.; Robinson, M.D. Count-Based Differential Expression Analysis of RNA Sequencing Data Using R and Bioconductor. Nat. Protoc. 2013, 8, 1765–1786. [Google Scholar] [CrossRef]
- Ritchie, M.E.; Phipson, B.; Wu, D.; Hu, Y.; Law, C.W.; Shi, W.; Smyth, G.K. Limma Powers Differential Expression Analyses for RNA-Sequencing and Microarray Studies. Nucleic Acids Res. 2015, 43, e47. [Google Scholar] [CrossRef] [PubMed]
- Law, C.W.; Chen, Y.; Shi, W.; Smyth, G.K. Voom: Precision Weights Unlock Linear Model Analysis Tools for RNA-Seq Read Counts. Genome Biol. 2014, 15, R29. [Google Scholar] [CrossRef] [PubMed] [Green Version]
- Saeki, K.; Chang, G.; Kanaya, N.; Wu, X.; Wang, J.; Bernal, L.; Ha, D.; Neuhausen, S.L.; Chen, S. Mammary Cell Gene Expression Atlas Links Epithelial Cell Remodeling Events to Breast Carcinogenesis. Commun. Biol. 2021, 4, 660. [Google Scholar] [CrossRef]
- Nguyen, Q.H.; Pervolarakis, N.; Blake, K.; Ma, D.; Davis, R.T.; James, N.; Phung, A.T.; Willey, E.; Kumar, R.; Jabart, E.; et al. Profiling Human Breast Epithelial Cells Using Single Cell RNA Sequencing Identifies Cell Diversity. Nat. Commun. 2018, 9, 2028. [Google Scholar] [CrossRef]
- Henry, G.H.; Malewska, A.; Joseph, D.B.; Malladi, V.S.; Lee, J.; Torrealba, J.; Mauck, R.J.; Gahan, J.C.; Raj, G.V.; Roehrborn, C.G.; et al. A Cellular Anatomy of the Normal Adult Human Prostate and Prostatic Urethra. Cell Rep. 2018, 25, 3530–3542.e5. [Google Scholar] [CrossRef] [Green Version]
- Karthaus, W.R.; Hofree, M.; Choi, D.; Linton, E.L.; Turkekul, M.; Bejnood, A.; Carver, B.; Gopalan, A.; Abida, W.; Laudone, V.; et al. Regenerative Potential of Prostate Luminal Cells Revealed by Single-Cell Analysis. Science 2020, 368, 497–505. [Google Scholar] [CrossRef] [PubMed]
- Jézéquel, P.; Campone, M.; Gouraud, W.; Guérin-Charbonnel, C.; Leux, C.; Ricolleau, G.; Campion, L. Bc-GenExMiner: An Easy-to-Use Online Platform for Gene Prognostic Analyses in Breast Cancer. Breast Cancer Res. Treat. 2012, 131, 765–775. [Google Scholar] [CrossRef]
- Anaya, J. OncoLnc: Linking TCGA Survival Data to MRNAs, MiRNAs, and LncRNAs. PeerJ Comput. Sci. 2016, 2, e67. [Google Scholar] [CrossRef] [Green Version]
- Aguet, F.; Barbeira, A.N.; Bonazzola, R.; Brown, A.; Castel, S.E.; Jo, B.; Kasela, S.; Kim-Hellmuth, S.; Liang, Y.; Oliva, M.; et al. The GTEx Consortium Atlas of Genetic Regulatory Effects across Human Tissues. Science 2020, 369, 1318–1330. [Google Scholar] [CrossRef]
- Dai, X.; Cheng, H.; Bai, Z.; Li, J. Breast Cancer Cell Line Classification and Its Relevance with Breast Tumor Subtyping. J. Cancer 2017, 8, 3131–3141. [Google Scholar] [CrossRef] [Green Version]
- Saranyutanon, S.; Deshmukh, S.K.; Dasgupta, S.; Pai, S.; Singh, S.; Singh, A.P. Cellular and Molecular Progression of Prostate Cancer: Models for Basic and Preclinical Research. Cancers 2020, 12, 2651. [Google Scholar] [CrossRef]
- Qu, Y.; Han, B.; Yu, Y.; Yao, W.; Bose, S.; Karlan, B.Y.; Giuliano, A.E.; Cui, X. Evaluation of MCF10A as a Reliable Model for Normal Human Mammary Epithelial Cells. PLoS ONE 2015, 10, e0131285. [Google Scholar] [CrossRef] [Green Version]
- Jézéquel, P.; Gouraud, W.; Ben Azzouz, F.; Guérin-Charbonnel, C.; Juin, P.P.; Lasla, H.; Campone, M. Bc-GenExMiner 4.5: New Mining Module Computes Breast Cancer Differential Gene Expression Analyses. Database 2021, 2021, baab007. [Google Scholar] [CrossRef] [PubMed]
- Chen, S.; Zhu, G.; Yang, Y.; Wang, F.; Xiao, Y.-T.; Zhang, N.; Bian, X.; Zhu, Y.; Yu, Y.; Liu, F.; et al. Single-Cell Analysis Reveals Transcriptomic Remodellings in Distinct Cell Types That Contribute to Human Prostate Cancer Progression. Nat. Cell Biol. 2021, 23, 87–98. [Google Scholar] [CrossRef]
- Andrahennadi, S.; Sami, A.; Manna, M.; Pauls, M.; Ahmed, S. Current Landscape of Targeted Therapy in Hormone Receptor-Positive and HER2-Negative Breast Cancer. Curr. Oncol. 2021, 28, 1803–1822. [Google Scholar] [CrossRef] [PubMed]
- De Santo, I.; McCartney, A.; Migliaccio, I.; Di Leo, A.; Malorni, L. The Emerging Role of ESR1 Mutations in Luminal Breast Cancer as a Prognostic and Predictive Biomarker of Response to Endocrine Therapy. Cancers 2019, 11, 1894. [Google Scholar] [CrossRef] [Green Version]
- Subramanian, A.; Tamayo, P.; Mootha, V.K.; Mukherjee, S.; Ebert, B.L.; Gillette, M.A.; Paulovich, A.; Pomeroy, S.L.; Golub, T.R.; Lander, E.S.; et al. Gene Set Enrichment Analysis: A Knowledge-Based Approach for Interpreting Genome-Wide Expression Profiles. Proc. Natl. Acad. Sci. USA 2005, 102, 15545–15550. [Google Scholar] [CrossRef] [Green Version]
- Dutertre, M.; Gratadou, L.; Dardenne, E.; Germann, S.; Samaan, S.; Lidereau, R.; Driouch, K.; de la Grange, P.; Auboeuf, D. Estrogen Regulation and Physiopathologic Significance of Alternative Promoters in Breast Cancer. Cancer Res. 2010, 70, 3760–3770. [Google Scholar] [CrossRef] [PubMed] [Green Version]
- Lachmann, A.; Xu, H.; Krishnan, J.; Berger, S.I.; Mazloom, A.R.; Ma’ayan, A. ChEA: Transcription Factor Regulation Inferred from Integrating Genome-Wide ChIP-X Experiments. Bioinformatics 2010, 26, 2438–2444. [Google Scholar] [CrossRef]
- Rouillard, A.D.; Gundersen, G.W.; Fernandez, N.F.; Wang, Z.; Monteiro, C.D.; McDermott, M.G.; Ma’ayan, A. The Harmonizome: A Collection of Processed Datasets Gathered to Serve and Mine Knowledge about Genes and Proteins. Database 2016, 2016, baw100. [Google Scholar] [CrossRef] [PubMed]
- Massarweh, S.; Osborne, C.K.; Creighton, C.J.; Qin, L.; Tsimelzon, A.; Huang, S.; Weiss, H.; Rimawi, M.; Schiff, R. Tamoxifen Resistance in Breast Tumors Is Driven by Growth Factor Receptor Signaling with Repression of Classic Estrogen Receptor Genomic Function. Cancer Res. 2008, 68, 826–833. [Google Scholar] [CrossRef] [PubMed] [Green Version]
- Smid, M.; Wang, Y.; Zhang, Y.; Sieuwerts, A.M.; Yu, J.; Klijn, J.G.M.; Foekens, J.A.; Martens, J.W.M. Subtypes of Breast Cancer Show Preferential Site of Relapse. Cancer Res. 2008, 68, 3108–3114. [Google Scholar] [CrossRef] [PubMed] [Green Version]
- Regua, A.T.; Arrigo, A.; Doheny, D.; Wong, G.L.; Lo, H.-W. Transgenic Mouse Models of Breast Cancer. Cancer Lett. 2021, 516, 73–83. [Google Scholar] [CrossRef] [PubMed]


Publisher’s Note: MDPI stays neutral with regard to jurisdictional claims in published maps and institutional affiliations. |
© 2021 by the authors. Licensee MDPI, Basel, Switzerland. This article is an open access article distributed under the terms and conditions of the Creative Commons Attribution (CC BY) license (https://creativecommons.org/licenses/by/4.0/).
Share and Cite
Redon, C.E.; Schmal, Z.; Tewary, G.; Mangelinck, A.; Courbeyrette, R.; Thuret, J.-Y.; Aladjem, M.I.; Bonner, W.M.; Rübe, C.E.; Mann, C. Histone Variant H2A.J Is Enriched in Luminal Epithelial Gland Cells. Genes 2021, 12, 1665. https://doi.org/10.3390/genes12111665
Redon CE, Schmal Z, Tewary G, Mangelinck A, Courbeyrette R, Thuret J-Y, Aladjem MI, Bonner WM, Rübe CE, Mann C. Histone Variant H2A.J Is Enriched in Luminal Epithelial Gland Cells. Genes. 2021; 12(11):1665. https://doi.org/10.3390/genes12111665
Chicago/Turabian StyleRedon, Christophe E., Zoe Schmal, Gargi Tewary, Adèle Mangelinck, Régis Courbeyrette, Jean-Yves Thuret, Mirit I. Aladjem, William M. Bonner, Claudia E. Rübe, and Carl Mann. 2021. "Histone Variant H2A.J Is Enriched in Luminal Epithelial Gland Cells" Genes 12, no. 11: 1665. https://doi.org/10.3390/genes12111665
APA StyleRedon, C. E., Schmal, Z., Tewary, G., Mangelinck, A., Courbeyrette, R., Thuret, J.-Y., Aladjem, M. I., Bonner, W. M., Rübe, C. E., & Mann, C. (2021). Histone Variant H2A.J Is Enriched in Luminal Epithelial Gland Cells. Genes, 12(11), 1665. https://doi.org/10.3390/genes12111665