Article

Genotyping Analysis by RAD-Seq Reads Is Useful to Assess the Genetic Identity and Relationships of Breeding Lines in Lavender Species Aimed at Managing Plant Variety Protection

1
Department of Agronomy Food Natural Resources Animals Environment, Campus of Agripolis, University of Padova, 35020 Legnaro, Italy
2
Gruppo Padana Ortofloricoltura S.S., Via Olimpia 41, 31038 Treviso, Italy
*
Author to whom correspondence should be addressed.
Genes 2021, 12(11), 1656; https://doi.org/10.3390/genes12111656
Submission received: 13 September 2021 / Revised: 16 October 2021 / Accepted: 18 October 2021 / Published: 21 October 2021
(This article belongs to the Special Issue Genetic Research and Plant Breeding)

Abstract

:
Lavender species are widely distributed in their wild forms around the Mediterranean Basin and they are also cultivated worldwide as improved and registered clonal varieties. The economic interest of the species belonging to the Lavandula genus is determined by their use as ornamental plants and important source of essential oils that are destinated to the production of cosmetics, pharmaceuticals and foodstuffs. Because of the increasing number of cases of illegal commercialization of selected varieties, the protection of plant breeders’ rights has become of main relevance for the recognition of breeding companies’ royalties. With this aim, genomic tools based on molecular markers have been demonstrated to be very reliable and transferable among laboratories, and also much more informative than morphological descriptors. With the rising of the next-generation sequencing (NGS) technologies, several genotyping-by-sequencing approaches are now available. This study deals with a deep characterization of 15 varietal clones, belonging to two distinct Lavandula species, by means of restriction-site associated DNA sequencing (RAD-Seq). We demonstrated that this technology screens single nucleotide variants that enable to assess the genetic identity of individual accessions, to reconstruct genetic relationships among related breeding lines, to group them into genetically distinguishable main subclusters, and to assign their molecular lineages to distinct ancestors. Moreover, a number of polymorphic sites were identified within genes putatively involved in biosynthetic pathways related to both tissue pigmentation and terpene production, useful for breeding and/or protecting newly registered varieties. Overall, the results highlighted the presence of pure ancestries and interspecific hybrids for the analyzed Lavandula species, and demonstrated that RAD-Seq analysis is very informative and highly reliable for characterizing Lavandula clones and managing plant variety protection.

1. Introduction

Lavender species Lavandula stoechas L. and Lavandula pedunculata (Mill.) Cav., belonging to the Lamiaceae family, include diploid plants (both 2n = 2x = 30 [1]). The wild forms of these species are widely distributed on the coast of countries around the Mediterranean Sea and are also cultivated worldwide using registered clonal varieties. The reproductive strategies of L. stoechas and L. pedunculata are prevalently allogamous and characterized by entomophilous pollination, although self-compatibility and autogamous events have also been reported [2]. Similar to many others belonging to the Lavandula genus, these species are known for their ornamental use and for the production of essential oils (EOs) rich in linalyl acetate, the fragrance of which is greatly appreciated for several purposes (i.e., cosmetics, lotions, soaps, room fragrances and food aromas) [3]. Moreover, lavender EOs are used in pharmacology, aromatherapy, and natural medicine, given their anti-inflammatory properties [4,5,6].
Given the growing economic interest around these species, the necessity for plant breeders and breeding companies to adequately register their varieties and to protect them from plagiarism is becoming increasingly important. Currently, the European guidelines for the registration and, thus, the protection of new Lavandula varieties are established by the Community Plant Variety Office (CPVO) CPVO/TP-194/1-Rev protocol [7]. This technical protocol applies to all varieties of Lavandula, but it is particularly adapted to four main sections namely Lavandula (e.g., Lavandula angustifolia), Stoechas (e.g., L. stoechas), Pterostoechas (e.g., L. pinnata) and Intersectional (that mainly includes interspecific hybrids such as Lavandula × allardii). In order to define the distinctness, uniformity and stability (DUS) requirements that should be met for the registration, the protocol provides a list of 40 morphological descriptors, including growth habit, plant size, leaf color intensity, leaf width, leaf length, spike length and flower color. The possibility of combining the morphological descriptors with molecular and/or biochemical profiles is never mentioned. As previously demonstrated in other crops, given the limits of phenotypic characterization and morphological markers, the use of molecular markers is becoming undeniably crucial [8,9,10,11]. The use of dominant markers has been reported in several studies to be helpful in assessing the genetic distinctiveness and uniformity of species belonging to the genus Lavandula [12,13,14,15]. However, the low reproducibility and the difficulty in associating these markers with phenotypic traits make them unsuitable for varietal registration processes. Codominant markers are instead able to overcome these limitations, and among them, SSR and SNP markers are the most commonly used markers. For example, previous studies successfully identified SSRs [16,17] strictly associated with genomic regions involved in the synthesis of Eos [18] or single nucleotide polymorphisms (SNPs) located within genes involved in the biosynthetic pathways of the main terpenes characterizing essential oils [18]. The analysis of genotypes linked to chemotypes [19,20] would allow researchers to identify the most suitable molecular markers to be used in screening analysis for breeding selection and variety registration. The use of molecular markers is also of relevant interest for marker-assisted selection (MAS) purposes: the association among molecular markers and genomic loci involved in the biosynthesis of flavonoids and other coloring compounds would allow for the correlation of specific phenotypes and genotypes.
Although different molecular approaches have been used to assess the distinctiveness of varieties of the Lavandula species, this genus suffers from the lack of annotated genome assemblies in international databases. However, according to Jingrui Li et al. [21], there is one genome assembly for L. angustifolia that is not publicly available that would simplify the identification of mapped molecular markers suitable for the above-described purposes.
The present study is focused on the application of the Restriction Site-Associated DNA (RAD) marker sequencing technology, not only to assess the extent of genetic similarity and heterozygosity/homozygosity of a core collection of 15 accessions belonging to two species of the Lavandula genus, but also to identify the genomic loci suitable for marker-assisted breeding (MAB) and for registration/protection of newly bred varieties. These aspects are of major interest for breeding companies and plant breeders when developing new commercial clones destined to the market.

2. Materials and Methods

2.1. Plant Materials

Fifteen samples belonging to as many breeding lines of lavender were kindly granted by Gruppo Padana S.S. (Paese, TV, Italy). Specifically, 13 L. stoechas and 2 L. pedunculata (identified as 2603 and 2605) plants were analyzed. Genomic DNA (gDNA) was isolated from 200 mg of fresh leaf tissue using the DNeasy Plant mini kit (Qiagen, Valencia, CA, USA) following the manufacturer’s protocol with a minor modification. Specifically, lysis and protein precipitation buffers were increased by 50% to facilitate the identification and, thus, the isolation of the supernatant phase containing oils, which was shown to deeply affect the quality of the gDNA in previous tests of DNA extraction. Both the quality and quantity of the genomic DNA samples were evaluated using a NanoDrop 2000c UV-Vis spectrophotometer (Thermo Fisher Scientific Inc., Pittsburgh, PA, USA) and by agarose gel electrophoresis (1% agarose/1 × TAE gel containing 1 × SybrSafe DNA stain (Life Technologies, Carlsbad, CA, USA)).

2.2. Restriction-Site Associated DNA Sequencing (RAD-Seq) and Data Analysis

The 15 gDNA samples were analyzed by means of restriction-site associated DNA sequencing (RAD-Seq) technology. One microgram of gDNA per individual sample was digested using the restriction enzyme MseI following the procedure described by Stevanato et al. [22]. For library preparation, digested DNA samples were diluted at a concentration of 3 ng/µL. Indexing, library preparation, sequencing, and bioinformatic analyses were performed according to the protocol described by Stevanato et al. [22]. Raw reads obtained through an Ion S5 sequencer (Thermo Fisher Scientific Inc., Waltham, MA, USA) were trimmed according to the restriction enzyme recognition motif. After quality assessment, all artifacts and Ns-containing reads were removed. Variants were called using Stacks v2.41 software [23]. SNPs were filtered to remove those meeting the following criteria: (1) SNPs with greater than 10% missing data, (2) SNPs with a sequence depth × 4, and (3) tri- and tetraallelic SNPs.
The obtained data were used for the construction of an unweighted pair group method with arithmetic mean (UPGMA) dendrogram based on Rohlf’s genetic similarity simple matching coefficient and a principal coordinate analysis (PCoA) centroid using NTSYS software v2.21 [24]. Additionally, a Bayesian clustering algorithm implemented in STRUCTURE v.2.2 [25] was used to model the genetic structure of the lavender core collection. The number of founding groups ranged from 1 to 20, and 10 replicate simulations were conducted for each value of K based on a burn-in of 20,000 and a final run of 100,000 Markov chain Monte Carlo (MCMC) steps. STRUCTURE HARVESTER [26] was used to estimate the most likely value of K, and the estimates of membership were plotted as a histogram using an Excel spreadsheet.

2.3. Identification of CDS-Mapping Reads and Reads Related to Terpene and Anthocyanin Biosynthesis Pathways

Reads with no missing data in the 15 samples analyzed were used to identify those sequences most likely belonging to genomic coding sequences (CDSs). No annotated assembly is available for Lavandula, but Jingrui Li et al. [21] reported that an assembly was deposited in NCBI. However, a search of the accession number yields no matches, and the authors did not answer our request at the time of the submission of this article. Thus, the genomes of the two phylogenetically closest species to this genus, namely, Sesamum indicum (GeneBank, GCF_000512975.1) and Salvia splendens (GeneBank: GCA_004379255.2), were considered. While the assembly of S. indicum was previously annotated, all the genomic loci and the resulting proteins from S. splendens were “hypothetical proteins” that required an additional step of annotation prior to their usage. This step was accomplished using the KAAS platform [27], the GHOSTX aligner [28] and the KEGG database for plant organisms [29]. The RAD tags were then aligned against both the S. indicum and S. splendens CDS datasets using a local BLASTn (BLAST+ 2.11.0 package) with an E-value threshold ≤1.0 × 10⁻¹⁰ and a percentage of identity ≥80%. The newly identified CDS-mapping reads were used for the construction of a UPGMA dendrogram and PCoA centroids as described in the previous section.
For reads matching genes involved in the biosynthetic pathways of terpenes and flavonoids, multiple Geneiuos alignments (Geneious software v2021.1.1, Biomatters Ltd., Auckland, New Zealand) among the 15 samples were performed to identify nonsynonymous SNPs.

2.4. DNA Barcoding through Sanger Sequencing for Species Determination

To highlight interspecific cross events between L. stoechas and L. pedunculata, DNA barcoding sequencing of all samples was accomplished using three chloroplast regions, namely, the psbA-trnH intergenic space region, the maturase K (matK) and ribonuclease large subunit (rbcL) genes. A nuclear region, namely, the internal transcribed region (ITS), was also considered. Genomic DNA amplification of the four samples considered was performed using a Veriti 96-Well Thermal Cycler (Applied Biosystems, Foster City, CA, USA) in a total volume of 25 μL of reaction mixture including 12.5 μL of MangoMix (Bioline, London, UK) with 1 μL of DNA (50 ng/μL), 2 μL of each primer (10 mM) and sterile water to reach the final volume. The following thermal conditions were adopted: 2 min at 95 °C; 35 cycles at 95 °C for 30 s, variable annealing temperature depending on the primer pair used (Table 1) for 45 s, and 72 °C for 45 s; and a final extension at 72 °C for 10 min. The PCR products were confirmed using 2% agarose/1 × TAE gels containing 1 × SYBR Safe DNA Gel Stain (Life Technologies), purified with ExoSAP-IT PCR Product Cleanup Reagent (Thermo Fisher) and sequenced on an ABI 3730XL Genetic Analyzer (Applied Biosystems). The obtained chromatograms were then assessed using Geneious Prime software, and sequences were trimmed at the 5′ and 3′ positions to remove the low-quality section were primers attached, and resulting ITS chromatograms were analyzed with “Heterozygote Plugin” version 2.0.0 (Biomatters) add-on to identify heterotic positions and then manually checked. The resulting sequences were aligned based on the barcoding region and concatenated for each sample. The resulting multiple alignment was used for the construction of a neighbor-joining tree using the Juke–Cantor algorithm, and polymorphic sites were used to create a logo graph. Bioinformatics analyses were conducted using Geneious Prime software plug-ins.

3. Results

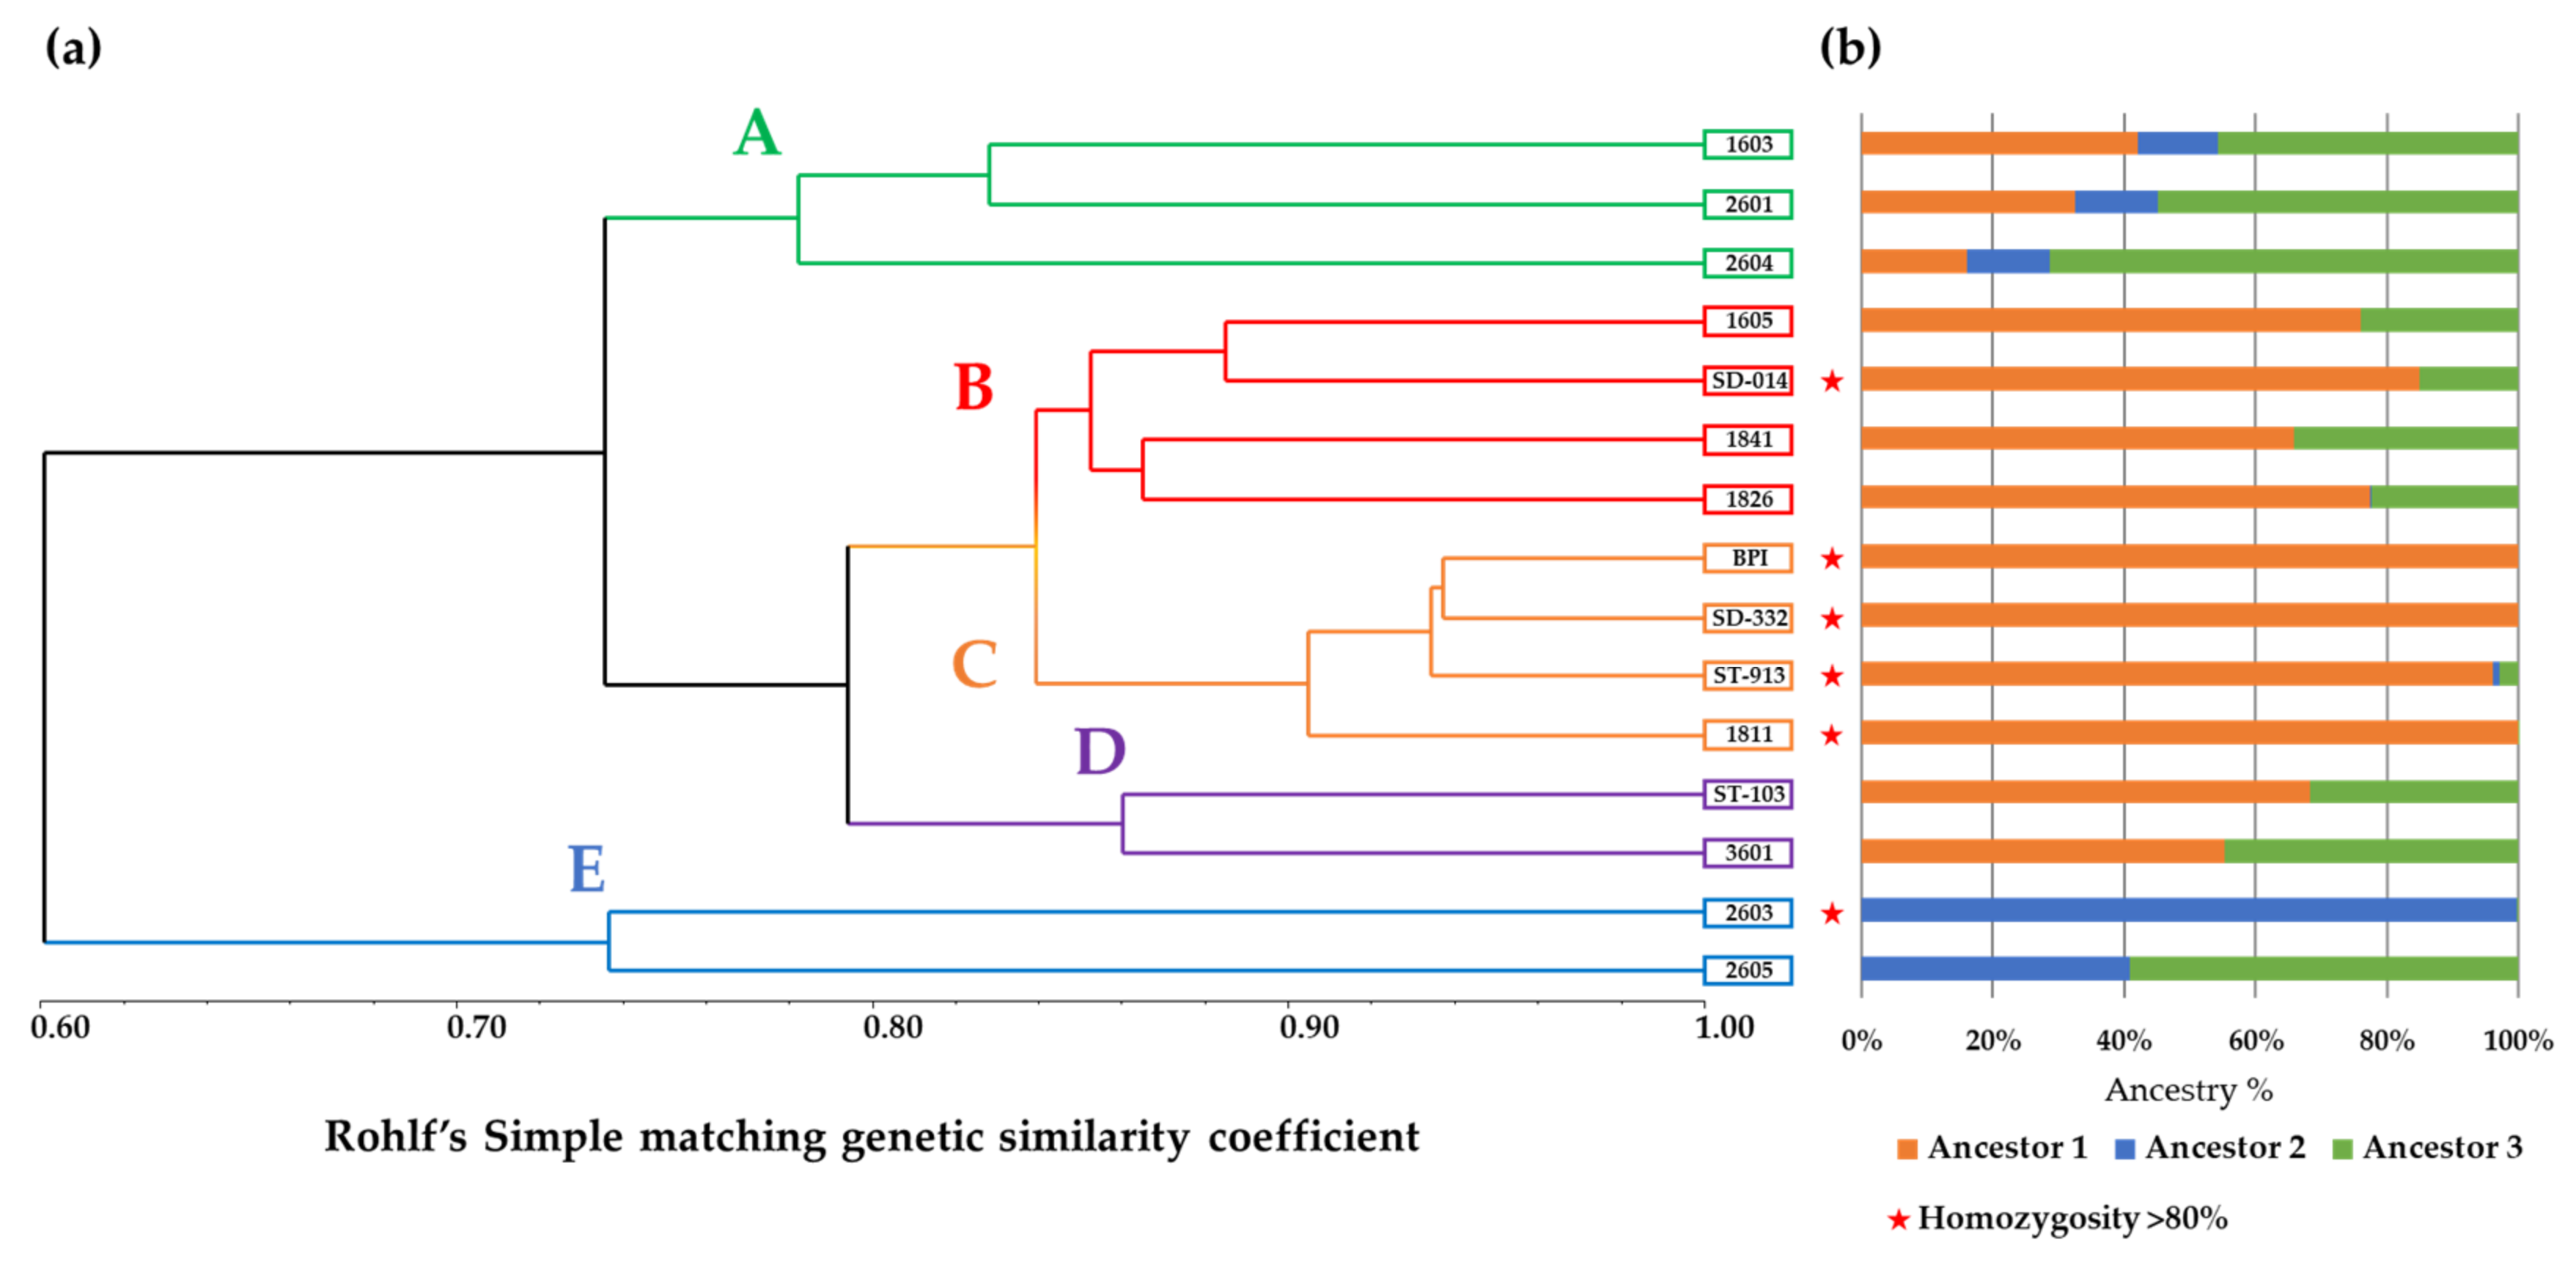
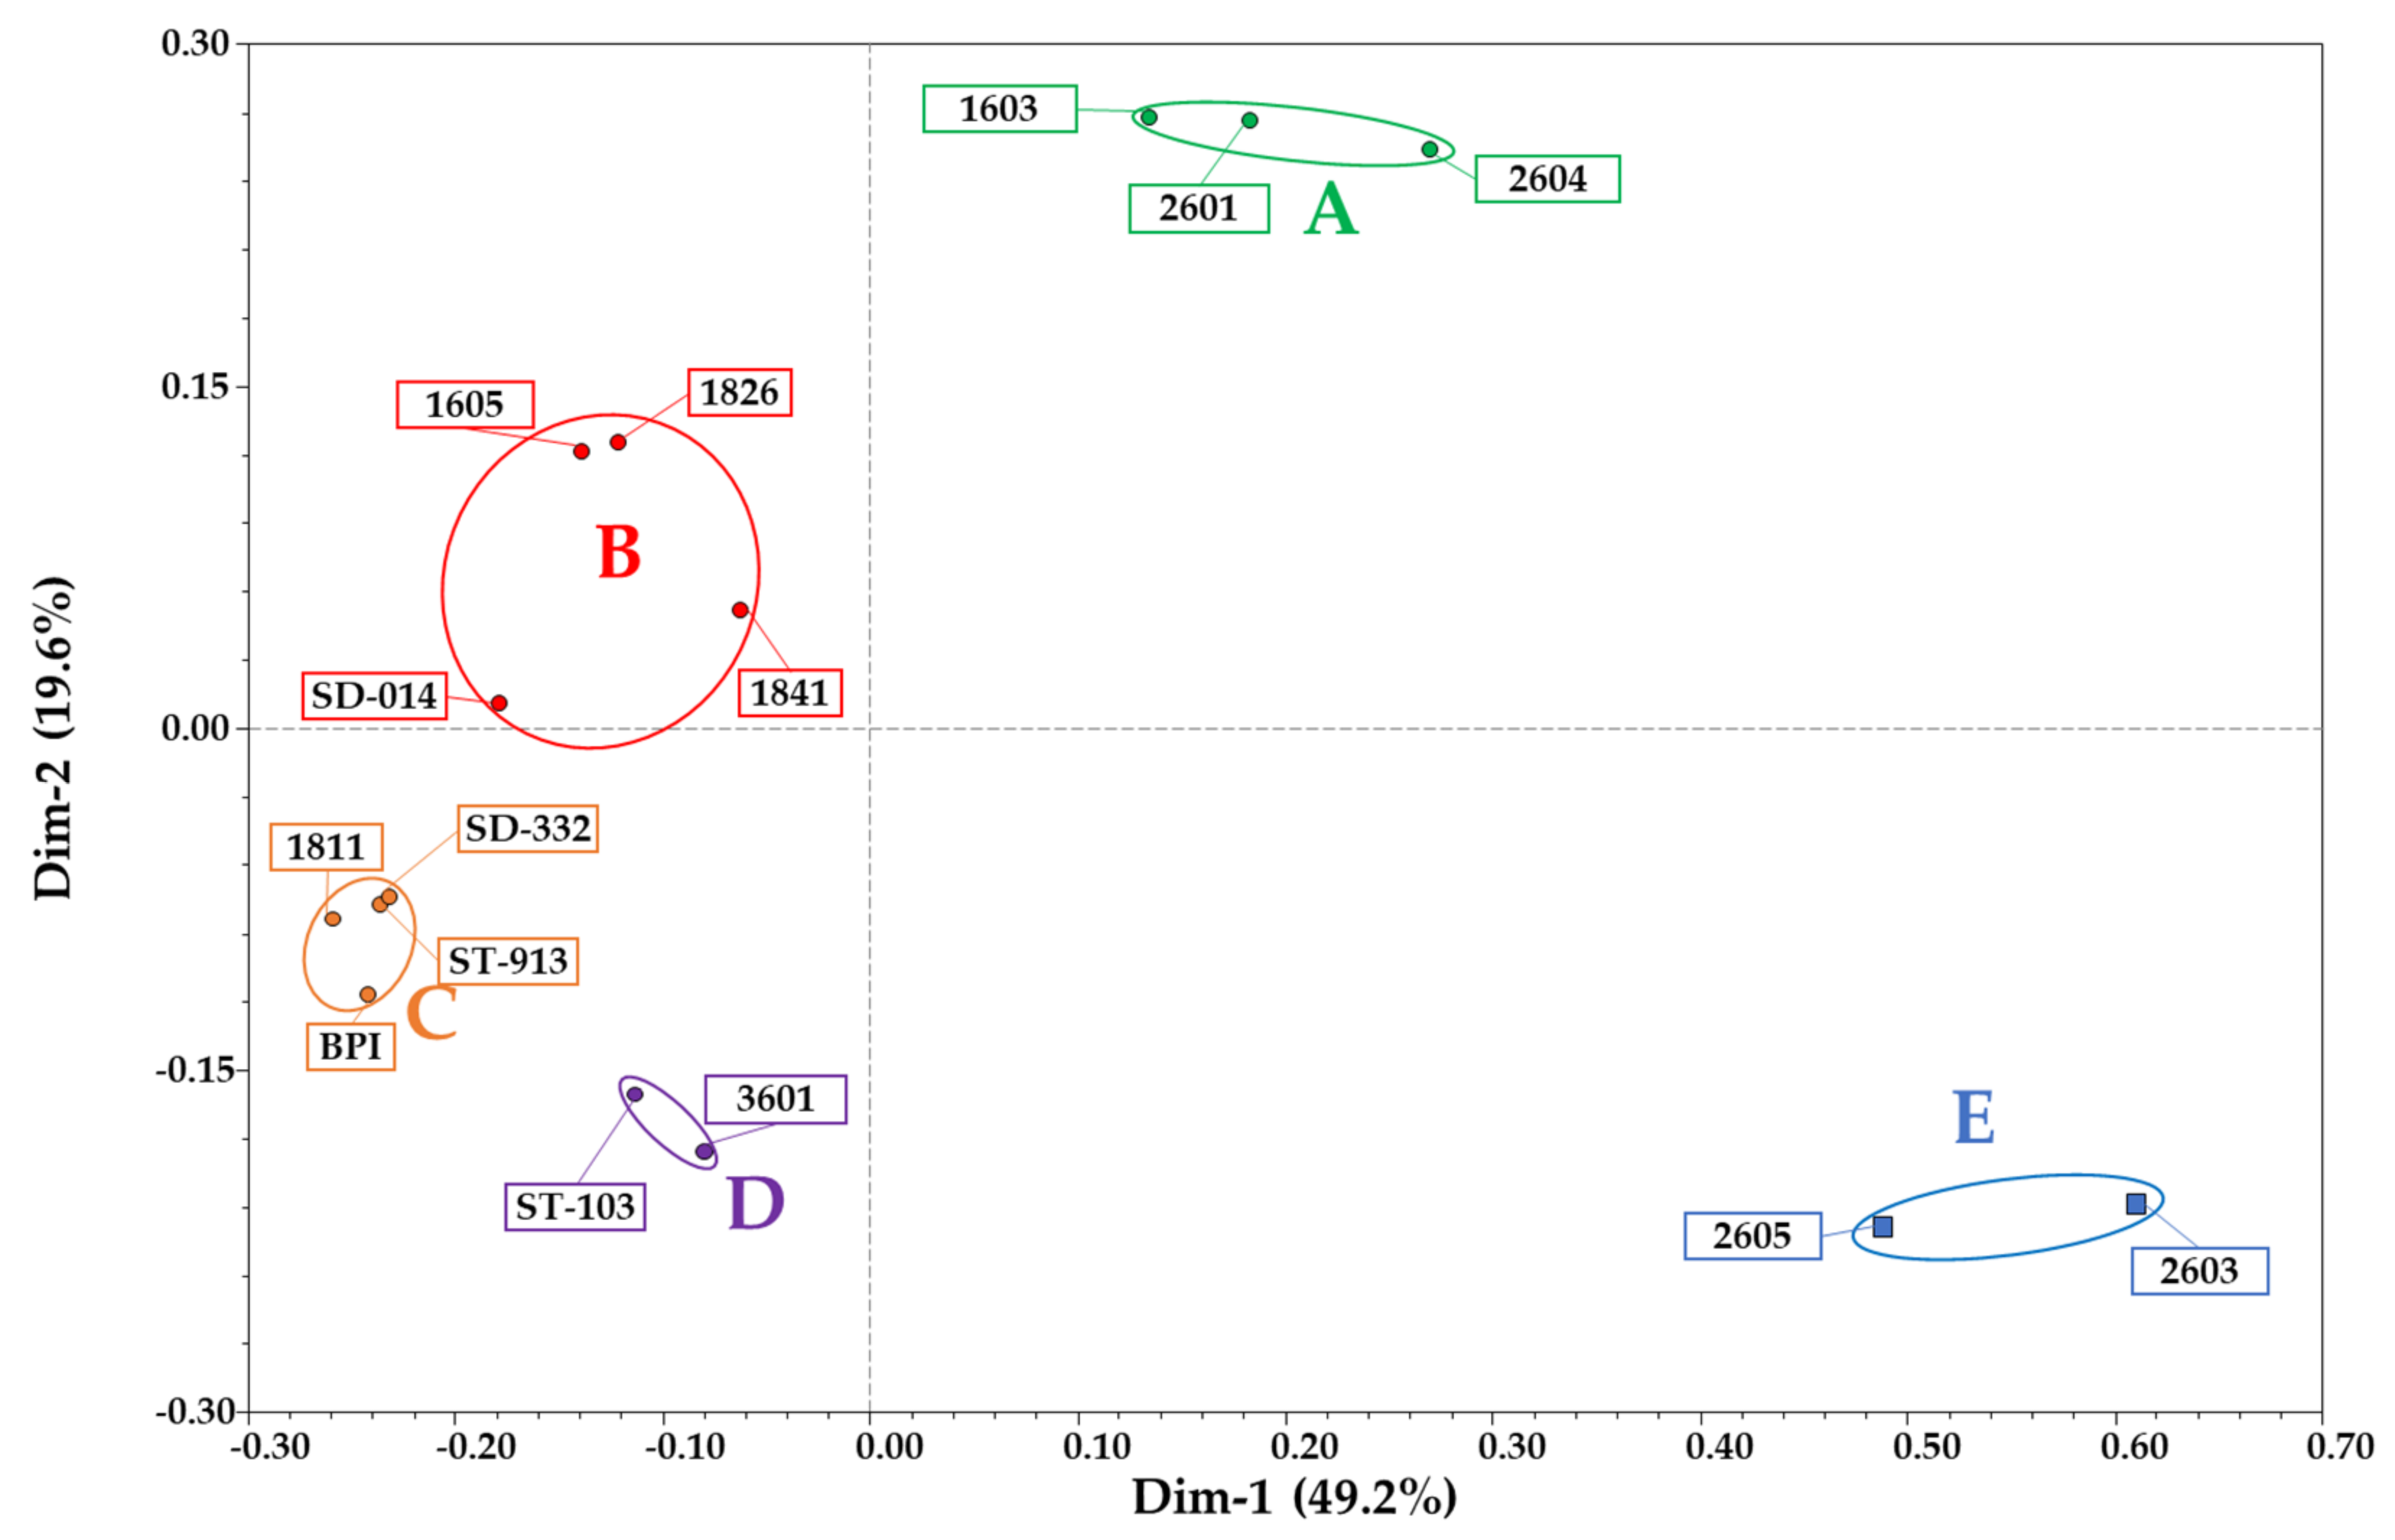
3.1. RAD-Seq and Genetic Similarity Analyses

A RAD-Seq analysis was performed using 15 samples obtained from an equal number of breeding lines that belong to a core collection of the Lavandula genus. The sequencing produced a total of 44,219,948 raw reads with an average of 2.9 million reads per sample. After quality assessment and adapter trimming, we obtained 42,610,020 reads that were used for the creation of a catalog of 622,153 consensus loci and then used for variant calling as a reference. An initial pool of 43,271 SNPs was first identified. Then, after the filtering step, in which sequences with at least one missing value in one sample were discarded, 16,228 SNPs distributed in 14,922 RAD sequence tags were retained as all of them were shared in all samples.
The analysis of the average genetic similarity (GS), which was calculated in all pairwise comparisons among the 15 sequenced samples, is reported in Table 2. Overall, GS ranged from 51.6 to 93.7% (1811 vs. 2603” and “BPI vs. SD-332”, respectively), whereas the average GS among the entire pool of samples was 74.8 ± 1.0%. The number of discriminative polymorphic sites among the most similar genotypes was 1966 SNPs, whereas that calculated among the most dissimilar was 9566 SNPs, both considering heterozygous loci. The UPGMA dendrogram grouped the 15 samples into five clusters named “Cluster A” to “Cluster E” (Figure 1), where the latter included the two L. pedunculata samples. From these findings, the mean genetic similarity was calculated among and between the identified groups, as reported in Table 3. The GS calculated within the clusters ranged from 73.7% in “Cluster E” to 92.0 ± 0.8% in “Cluster C”, whereas the GS among groups ranged from 56.6 ± 1.3% (“Cluster C” vs. “Cluster E”) to 83.9 ± 0.6% (“Cluster B” vs. “Cluster C”). Moreover, due to the low genetic similarity between “Cluster E” and the other four subgroups, as shown by the UPGMA dendrogram, a comparison between this cluster and the other main group of 13 samples was also made. “Cluster A + B + C + D”, which is located in one main arm of the dendrogram with a within mean genetic similarity of 79.7 ± 0.7%, exhibited an observed genetic similarity equal to 60.1 ± 1.0% when compared to “Cluster E”. Considering the number of SNPs with uncommon alleles between the L. stoechas and the L. pedunculata groups, 162 SNPs were found to have one allele in the 13 samples of “Cluster A + B + C + D” and the other allele in the two samples of “Cluster E”. The PCoA grouped samples in different spaces of the diagram with Dimensions 1 and 2 representing 49.2% and 19.6%, respectively, and overall, 68.8% of the molecular variation in total (Figure 2). From the ancestry composition reconstruction analysis, a maximum ΔK value at K = 3 was found (ΔK = 260.07, as shown in Supplementary Figure S1). Thus, an equal number of putative ancestors were hypothesized with a membership of ancestry ranging from 0 to 100%, 0 to 99.8% and from 0 to 71.3%, respectively. Notably, “Ancestor 1” had no membership in samples 2605 and 2603, for which “Ancestor 2” was greater than 40%. In contrast, “Ancestor 3” had no membership in samples BPI and ST-913 and less than 5% in samples 1811, SD-332 and 2603 (see Figure 1).
Beyond the genetic similarity estimates, the observed homozygosis (Obs. Ho) of each sample was also estimated (see Table 2). The highest homozygosity was observed in sample “BPI” (90.1%), and the lowest (60.1%) homozygosity was observed in sample “2601”. The mean homozygosity among all samples was 78.7 ± 2.2%. As for genetic similarity, homozygosity was also calculated for each of the five identified clusters (see Table 3) with values ranging from 66.4 ± 3.7% to 86.7 ± 1.9% (“Cluster A” and “Cluster C”, respectively) and a mean value for group “A + B + C + D” equal to 78.5 ± 2.4%.

3.2. CDS-Matching Reads Identification

16,228 RAD tags (filtered for missing data) were aligned against the exome of both S. indicum and S. splendens by means of BLASTn. Concerning the sesame exome, 2618 reads mapped on 2907 CDS, whereas, in the case of scarlet sage, a much higher number of reads (4239) aligned on 6534 CDS. Almost the totality of reads mapping on the sesame exome also mapped on the scarlet sage one (2286) (Table 4 and Supplementary Tables S1–S2).
CDS-mapping reads were then used to perform a more stringent genetic similarity analysis following the procedure previously described for the entire SNP dataset.
We created two subsets composed of those reads matching on sesame and scarlet sage exomes and we used them to calculate the pairwise genetic similarity amongst the 15 samples under study. Table 5 shows the pairwise genetic similarity matrix calculated based on sesame exome matching reads, whereas Table 6 illustrate the mean GS over clusters. Results obtained for scarlet sage are reported in Supplementary Figure S2. These estimates overall ranged from minimum values of 56.4% (sesame) and 55.5% (scarlet sage) detected comparing samples “1811” and “2603”, to maximum values of 94.2% (sesame) and 94.3% (scarlet sage) obtained from the comparison of samples “BPI” and “ST-913”. The average genetic similarity among all 15 samples was equal to 76.6 ± 0.9% for sesame-matching reads dataset and 76.2 ± 0.9% for the scarlet sage one. In general, the two genetic similarity analyses performed on datasets constituted by exome matching reads yielded highly similar results both in sample clustering and in pairwise genetic similarity percentages. The only differences observed were in the UPGMA dendrogram based on the dataset containing the reads that matched the S. splendens exome, in which the disposition of samples “1841” and “1826” changed from those constructed using the other two datasets (see “Cluster-Bb” in the Supplementary Figures S3–S6). Moreover, it was observed that the GS calculated within clusters was slightly higher in the matrices calculated using the exome matching read datasets than in those calculated using the no missing data containing dataset. Something similar was observed in the estimation of homozygosis, which was generally 0.5% higher in the analyses based on exome-matching reads than in those based on the whole 16,228 SNP dataset. The only exceptions were “Cluster D” and “Cluster E”, which showed homozygosity values slightly lower when considering the former dataset (see Table 5 and Table 6 and Supplementary Figure S2).

3.3. BLASTn Analysis for Terpene and Flavonoid Pathway-Related Gene Investigation

From the BLASTn analysis performed using the RAD tags of the 15 Lavandula accessions against the S. indicum and the S. splendens exomes, among the CDS-mapping reads, we selected a subgroup of sequences that aligned against genes involved in the biosynthetic pathways of terpenes and flavonoids.
In S. indicum, a total of nine matches were discovered for the flavonoid biosynthetic pathway and 20 for the terpene biosynthetic pathway. From the multiple alignments of the biallelic lavender reads of the 15 samples, six RAD tags presented synonymous mutations, 26 were nonsynonymous and four coded for STOP codons that were restored in three cases to a coding triplet. However, in one case, it was maintained for both alleles (RAD-tag encoded 8036 matching the 1,4-dihydroxy-2-naphthoyl-CoA synthase, accession ID: XP_011071094.1). Moreover, in S. splendens, 33 and 61 RAD tags matched sequences related to the flavonoid and terpene biosynthetic pathways, respectively. Similar to that performed for the matches identified in sesame pathways, multiple alignments were performed only considering the lavender RAD tags. From this investigation, 16 polymorphic sites coded for synonymous mutations, 62 were nonsynonymous and 2 coded for STOP codons. One mutation was restored in some samples to an arginine coding triplet, whereas the other maintained the missense triplet in the less frequent SNP. From the two analyses performed on the sesame and scarlet sage exomes, 7 and 17 matches were common for the flavonoid and terpene pathways, respectively. Summary statistics of the BLASTn analyses for the results of the biosynthetic pathway are reported in Table 4, BLASTN resulting matches against S. indicum for the biosynthetic pathways and amino acids substitutions after multiple alignments are reported in Table 7, BLASTN resulting matches against S. splendens for the biosynthetic pathways and amino acids substitutions after multiple alignments are reported in Supplementary Table S3, and complete BLASTN results are available in Supplementary Tables S4–S5.

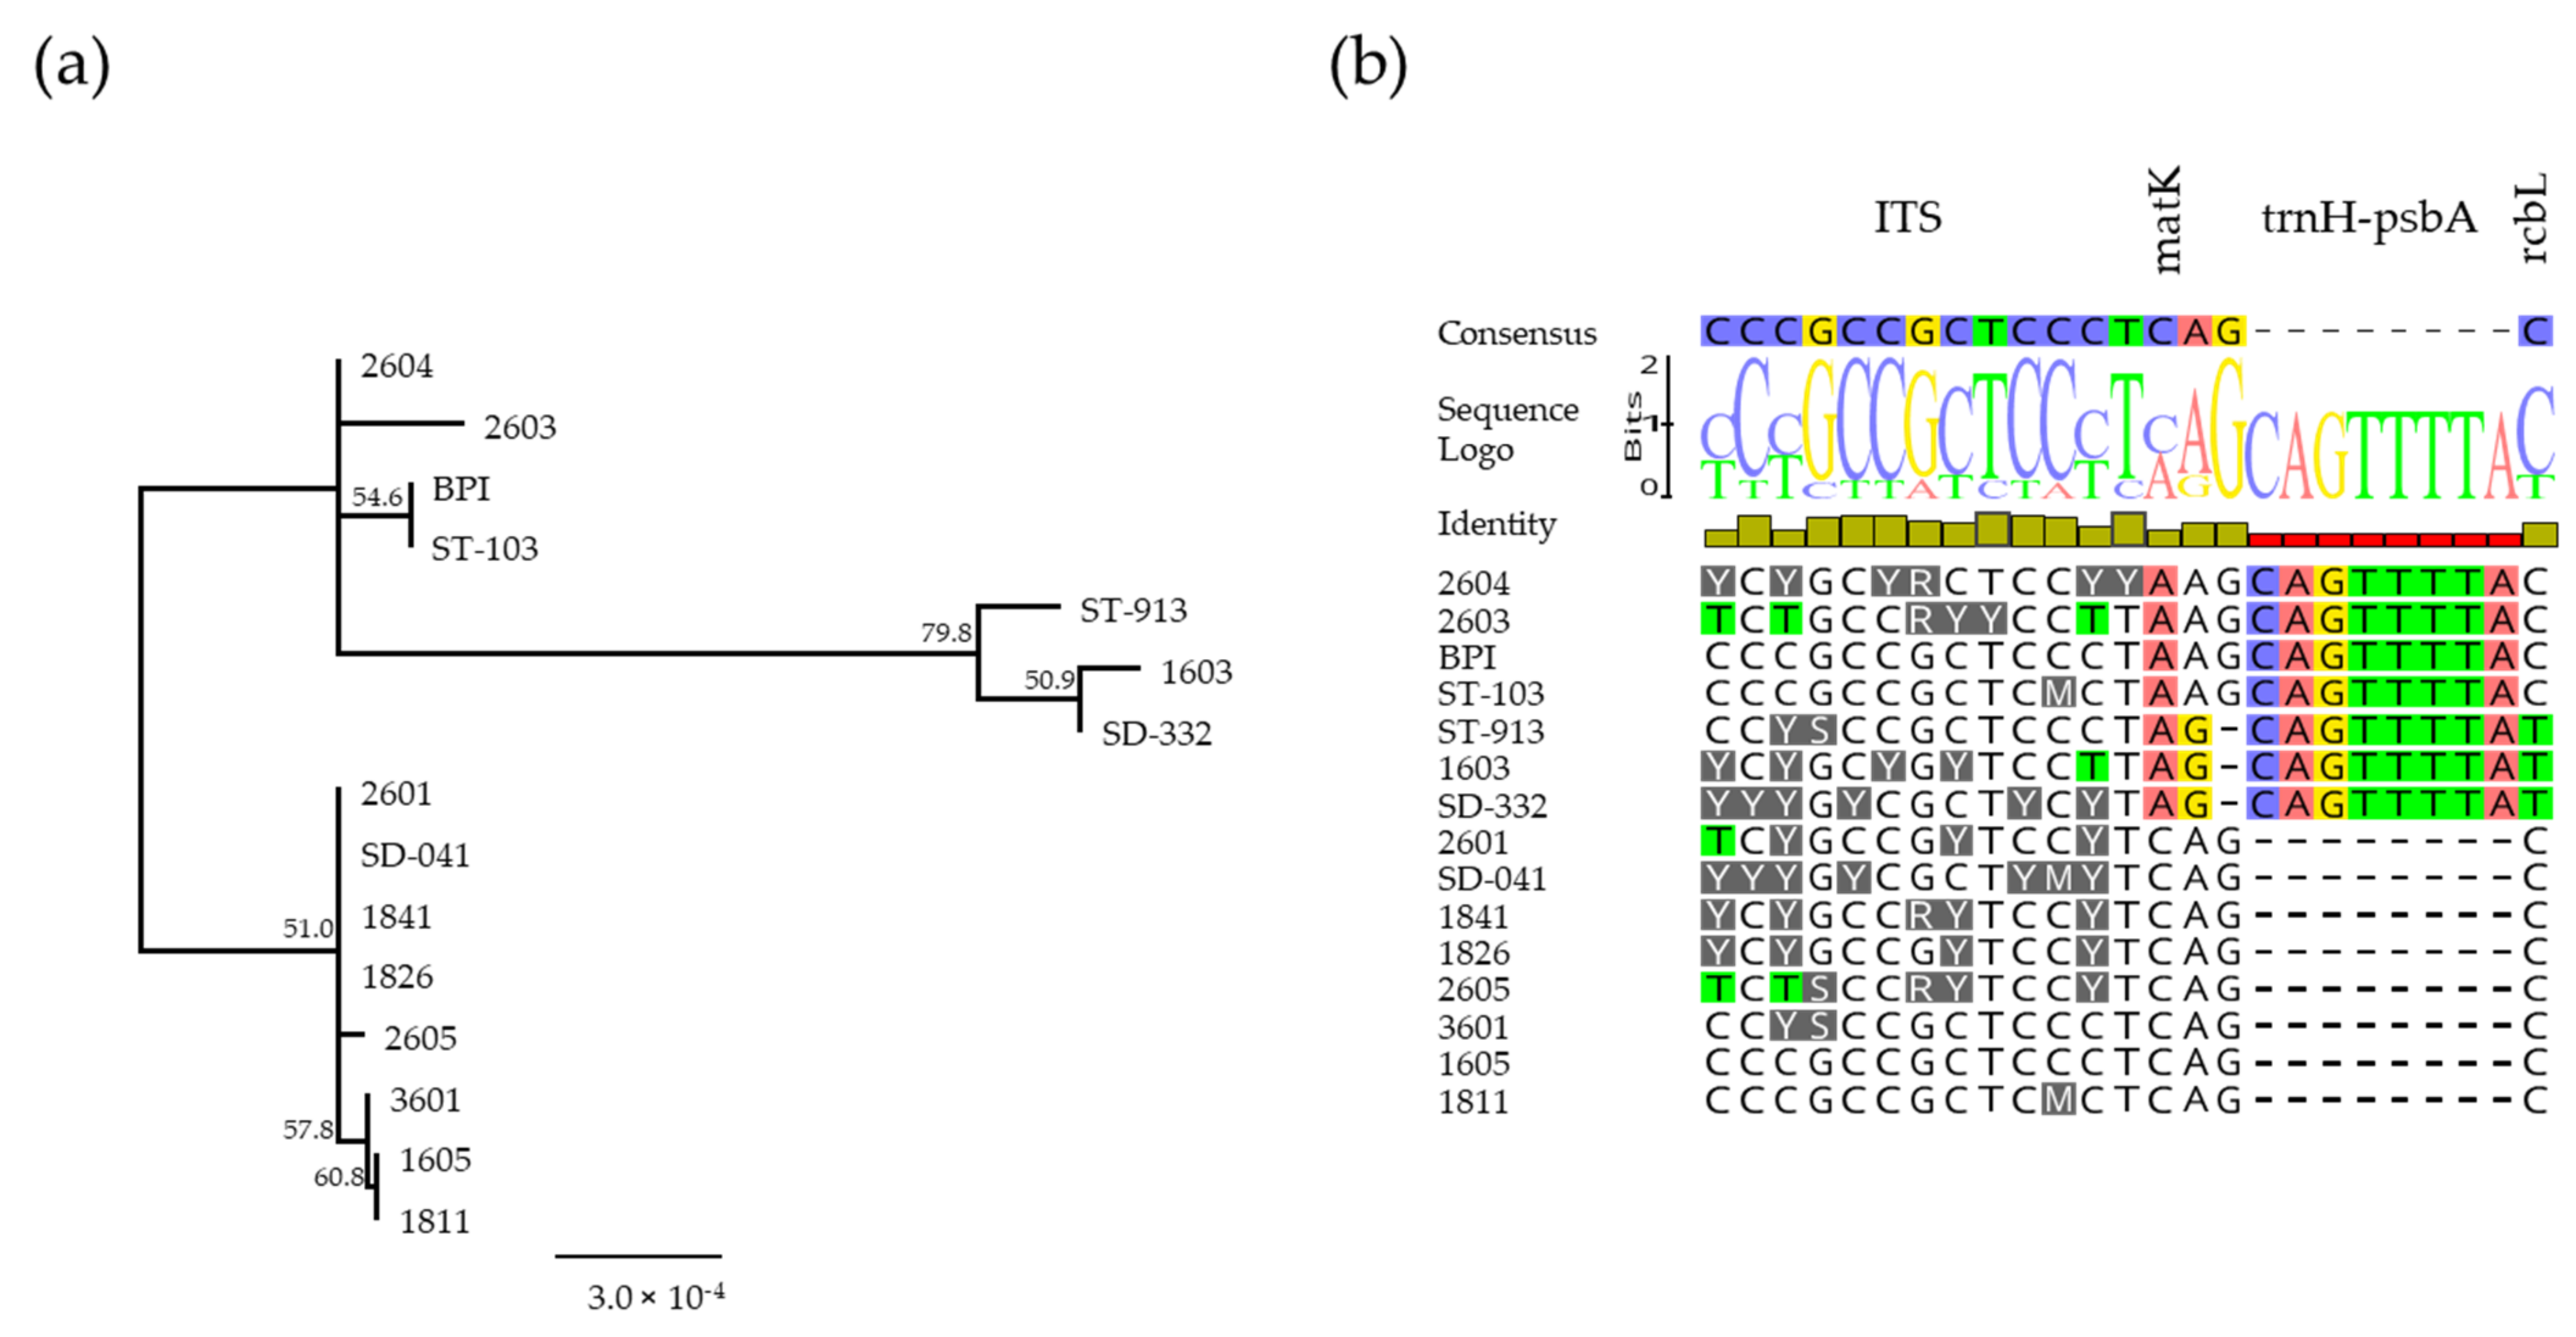
3.4. Sanger Sequencing and DNA Barcoding Analysis

The analysis of DNA barcoding sequences commonly used in molecular taxonomy was conducted to verify the clustering reliability of the putative interspecific crosses hypothesized after ancestor membership reconstruction. The obtained sequences were 318 bp (psbA-trnH), 644 bp (rbcL), 273 bp (ITS) and 692 bp (matK) long, and the total concatenated sequence alignment among the four samples considered was 1926 bp long. The majority of the aligned sites were conserved, but few insertions, SNPs or heterozygous positions (ITS) were found. The different site numbers ranged from 1 (e.g., “1826” vs. “1841”) to 20 (“SD-332” vs. “2605”) among the pairwise comparisons of the aligned sequences, whereas the total number of polymorphic sites in the alignment was equal to 25. The results obtained from the neighbour-joining tree construction revealed that samples were clustered in three main subgroups, but no concordances were observed with the previously obtained results based on the RAD-Seq dataset (see Figure 3).

4. Discussion

RAD-Seq-Based Genetic Similarity and Ancestral Composition Reconstruction

The use of molecular markers for genotyping analyses is currently one of the main tools in plant breeding and variety protection. Not only has this approach evolved in terms of informativeness during the late years, moving from dominant to codominant PCR-based and then to NGS-derived molecular markers, but it has also increased in the number of obtainable data and the robustness/informativeness of the resulting assays.
Indeed, RAD-Seq technology has been used for different applications in crop plant science, ranging from QTL mapping in crop species [35,36,37] to Mendelian gene mapping [38,39] and marker-assisted breeding (MAS) [9,40,41,42]. This technique has also been used for crop variety identification [43] and phylogeny [44] studies, and population structure analyses [45]. In our study, we aimed to show the potential of the RAD-Seq approach in accessing the genetic identity or similarity and distinctiveness in Lavandula accessions, and at identifying putative genomic loci for use in breeding schemes, registering or patenting plant varieties and novelties, and protecting plant breeders’ rights.
The great number of data points (42,610,020 total reads, 2,834,001 reads on average per sample) allowed us to investigate both the relatedness degree existing among the DNA samples and the SNP variants possibly linked to the biosynthesis of flavonoids and terpenes. To confer the robustness of the analysis, of the 43,271 SNP sites originally identified, only those with no missing data were retained (16,228). Notably, among the 27,043 RAD tags that were filtered and removed from the initial dataset, 1044 had missing values in the L. pedunculata samples that were instead scored among the 13 individuals of L. stoechas. From these findings, it could be hypothesized that these loci are likely species-specific and could, therefore, be used for species discrimination. The filtered marker dataset used for the genetic similarity analysis allowed us to group the 15 samples into five main clusters. Moreover, the GS calculated within “Cluster A + B + C + D” was comparable to that calculated within “Cluster E”, whereas the GS calculated between the two groups was lower, which is consistent with the fact that two different species were represented. Regarding the ancestral membership reconstruction, the number of K = 3 derived from the STRUCTURE software analysis was used to divide the 15 samples of the core collection of Lavandula into three main ancestors, showing membership percentages that were consistent with that obtained from the genetic similarity analysis. From these results, two main ancestors for accessions of L. stoechas were hypothesized, whereas one main ancestor mostly represented the L. pedunculata ancestry. The fact that admixed memberships were present among samples belonging to different species can be explained by a few factors. In the first hypothesis, interspecific crosses can be present between the two considered species, a fact that is highly probable as they are reported to be cross-fertile and belong to the taxonomic section Stoechas of the genus Lavandula [46,47]. Notably, L. stoechas and L. pedunculata have been reported to be phylogenetically related and very close to one another. These species are so closely related that L. pedunculata has been considered in the past as a subspecies of L. stoechas but was subsequently reassigned as a different species [46]. Then, the possibility of conserved loci among the analysed samples is possible and could relate to common ancestral genotypes between the two species. Another consideration, excluding the possible biological explanations, is that the use of a reduced and filtered dataset based exclusively on loci that are shared among all analysed samples and presenting no missing data could have resulted in a reduced capability of the molecular information in assessing the correct ancestry reconstruction. Specifically, missing data could be caused by the missed sequencing of the genomic fragment in one or more samples or by the absence of the restricted genomic region due to a polymorphic nucleotide in the restriction site. In the first case, the missing information is not usable for genomic or statistical comparisons among the samples. In the second case, however, the absence of the data is an allele itself that could be used in species determination investigation. To address this issue, the use of an assembled genome of both or at least one of the analysed species would be useful.
To confirm the first hypothesis, a barcoding analysis based on Sanger DNA sequencing of three cytoplasmic regions and one nuclear region was performed on the 15 samples of the core collection of Lavandula. The results obtained showed very few polymorphic sites among the analysed sequences with a maximum number of 20 among 1926 sequenced base pairs, which was approximately 1% of the total. These results were not in agreement with those obtained from the GS clustering or the ancestral reconstruction analysis performed by STRUCTURE. However, the difference can be explained by the different types of analysis performed and the nature of the molecular information used. The analysed cytoplasmic DNA regions, including both genic and intergenic sequences, are inherited by the maternal parent, so they are not suitable for phylogenetic analyses in interspecific crosses. Thus, the ITS nuclear region was also considered and found to be able to discriminate the two L. pedunculata individuals from the other 13 accessions of L. stoechas (Supplementary Figure S7). Therefore, based on the observed data, the use of a DNA barcoding strategy in determining interspecific crosses is useless or much less informative than the RAD-Seq technology.
BLASTN analysis was also performed using the 16,228 RAD tags as queries against the S. indicum RefSeq genome and S. splendens newly assembled genome to identify the RAD tags most likely attributable to gene coding sequences and possibly phenotype related. A total of 16.1% of the reads matched the CDS from sesame, whereas 26.1% of the reads matched the exome regions of scarlet sage. Based on this analysis, it was possible to filter the original RAD-Seq dataset to a limited number of sequences that were subsequently used for a new and more stringent genetic similarity analysis. The resulting data used to calculate the genetic similarities and relationships among accessions and the extent of heterozygosity/homozygosity of all accessions showed no relevant differences compared with findings from the analysis of the nonfiltered dataset, with the exception of a few cases that can be explained by a higher similarity of the conserved exonic regions. In addition, the two PCoAs derived from these reduced datasets were consistently similar to the PCoAs performed using the initial 16,228 markers (Figure 2 and Supplementary Figures S5 and S6), demonstrating once again the discriminative ability of the method used in these analyses and the relatedness of expressed and nonexpressed regions among the genomes in genotyping studies [48,49,50].
Regarding the heterozygosity estimates, it was observed that accessions showing a greater homozygosity were also those with the highest ancestral membership percentage to one or the other ancestors probably due to selfing or inbreeding reproductive strategies. The fact that few of the analysed samples exhibited high levels of heterozygosis can be explained by the presence of interspecific crosses between the two species considered in this study. Notably, those samples with greater membership percentages with one of the three identified ancestors were also those with greater homozygosity (“Cluster C” and samples “SD-014” and “2603”), whereas the admixed samples showed the highest degree of heterozygosity (“Cluster A”). Consistent with the reproduction strategy of these species, autogamy rarely occurs in natural populations [2]. However, it has been reported that these species are self-compatible, so breeding lines can be obtained by increasing homozygosity levels through controlled self-pollinations. Moreover, highly heterozygous breeding lines can be maintained at their heterozygous status and can be vegetatively reproduced by cutting, thus maintaining the phenotypic characteristics of the line and their heterotic vigour and avoiding segregation after self-pollination or recombination from cross-pollination with other lines. Moreover, the use of interspecific crosses between L. stoechas and L. pedunculata is used to transfer phenotypic traits that are desired to be maintained for commercial purposes; thus, “hybrids” are reproduced by cutting to avoid loss of desired traits, which could explain the combined results of ancestry reconstruction with homozygosity. In conclusion, the results and type of data obtained through the method proposed in this study highlighted the informativeness of the approach used and showed how genotyping-by-sequencing thorough RAD-Seq is highly informative and could be considered a useful tool to be used in combination or in place of other genotyping technologies based on PCR-based molecular markers, both dominant and codominant. Further studies are needed to confirm whether the identified SNPs are associated with phenotypic evidence.
Some findings about the STOP codons in genes involved in the synthesis of terpene precursors, including 1,4-dihydroxy-2-naphthoyl-CoA synthase, a phylloquinone precursor [51], and phosphomevalonate kinase (PMK), an inositol-diphosphate precursor [52], were particularly interesting, but further studies are needed to investigate and validate their gene function, expression, and compound synthesis to possibly correlate genotypes to chemotypes and phenotypes. This approach would be useful for MAB, including MAS approaches, and particularly for variety registration and protection.
The polymorphism information contents, and molecular profiles obtained through the technology adopted in our research project, would enable us to guarantee the breeders’ rights of the analysed varieties and to legally protect them from any theft or embezzlement and commercialization by companies competing with the rights owner’s breeders. This aim would be further improved by the creation of specific molecular assays based on prebuilt arrays able to simplify and speed-up routine screenings. Most importantly, it would be helpful to legally define the genetic similarity/diversity thresholds between commercialized varieties able to consider them distinguishable or essentially derived to avoid misunderstandings or legal issues in the genus Lavandula, as has already been applied or suggested for other crops [53,54,55].

5. Conclusions

In conclusion, genotyping analysis by RAD-Seq reads was found to be useful for assessing the genetic identity and relationships of breeding lines in lavender species aimed at managing plant variety protection. Furthermore, the described approach provides an informative characterization analysis which would help with lavender varieties registration procedures, which are now based on the only phenotypic evaluation, with no genetic investigation needed.

Supplementary Materials

The following are available online at https://www.mdpi.com/article/10.3390/genes12111656/s1, Figure S1: STRUCTURE Harvester software resulting ΔK chart; Figure S2: (a) Genetic Similarity matrix of 15 Lavandula individuals based the BLASTN analysis against S. splendens exome, and relative observed homozygosity (Obs. Ho) and heterozygosity (Obs. He). (b) Average genetic similarity of Clusters identified through the construction of the UPGMA dendrogram, and average observed homozygosity (Avg. Obs. Ho); Figure S3: UPGMA dendrogram of the genetic similarity calculated on the Lavandula reads matching the S. indicum exome; Figure S4: UPGMA dendrogram of the genetic similarity calculated on the Lavandula reads matching the S. splendens exome; Figure S5: Principal Coordinate Analysis (PCoA) of the genetic similarity calculated on the Lavandula reads matching the S. indicum exome; Figure S6: Principal Coordinate Analysis (PCoA) of the genetic similarity calculated on the Lavandula reads matching the S. splendens exome; Figure S7: Neighbour Joining tree based on Geneious software plug-in “multiple alignment” of ITS nuclear region of the 15 Lavandula individuals; Table S1: BLASTN result of the RAD-seq obtained reads of Lavandula against the S. indicum exome; Table S2: BLASTN result of the RAD-seq obtained reads of Lavandula against the S. splendens exome; Table S3: Multiple alignments results reporting read ID, S. splendens (GCA_004379255.2) accession number on NCBI database, Flavonoid/Terpenes product, KEGG ID assigned by KASS, amino acid substitution based on the polymorphic SNP in the 15 individuals of Lavandula; Table S4: BLASTN results for Lavandula reads matching genes involved in the Flavonoids and Terpenes biosynthetic pathways of S. indicum; Table S5: BLASTN results for Lavandula reads matching genes involved in the Flavonoids and Terpenes biosynthetic pathways of S. splendens.

Author Contributions

Conceptualization, F.S., F.P. and G.B.; methodology, F.S. and F.P.; formal analysis, F.S.; investigation, F.S.; resources, G.B.; data curation, F.S.; writing—original draft preparation, F.S.; writing—review and editing, F.S., F.P., A.V., G.B.S., M.G. and G.B.; visualization, F.S., F.P., M.G., G.B.S. and G.B.; supervision, A.V. and G.B.; project administration, G.B.; funding acquisition, G.B. and M.G. All authors have read and agreed to the published version of the manuscript.

Funding

This research was funded by the Gruppo Padana company (Paese, TV, Italy), within the research contract signed with the Department of Agronomy, Food, Natural resources, Animals and Environment (DAFNAE), University of Padua, Italy.

Institutional Review Board Statement

Not applicable.

Informed Consent Statement

Not applicable.

Data Availability Statement

The data presented in this study are available within the article or as Supplementary Material and the initial dataset is available upon request.

Acknowledgments

We convey our thanks to Piergiorgio Stevanato and Samathmika Ravi for their help in the RAD-seq analyses and graduated fellow Samela Draga for her help in the DNA barcoding analyses. We also convey our thanks to Gruppo Padana company for providing the biological samples of Lavandula.

Conflicts of Interest

The authors declare no conflict of interest.

References

  1. Rice, A.; Glick, L.; Abadi, S.; Einhorn, M.; Kopelman, N.M.; Salman-Minkov, A.; Mayzel, J.; Chay, O.; Mayrose, I. The Chromosome Counts Database (CCDB)—A community resource of plant chromosome numbers. New Phytol. 2015, 206, 19–26. [Google Scholar] [CrossRef]
  2. Munoz, A.; Devesa, J. Contribution to the knowledge of the floral biology of the genus Lavandula L., 2: Lavandula stoechas L. subsp. stoechas. An. Jard. Bot. Madr. 1987, 44, 63–78. [Google Scholar]
  3. Shawl, A.S.; Kumar, S. Potential of lavender oil industry in Kashmir. J. Med. Arom. Plant Sci. 2000, 22, 319–321. [Google Scholar]
  4. Algieri, F.; Rodriguez-Nogales, A.; Vezza, T.; Garrido-Mesa, J.; Garrido-Mesa, N.; Utrilla, M.P.; Gonzalez-Tejero, M.R.; Casares-Porcel, M.; Molero-Mesa, J.; Del Mar Contreras, M.; et al. Anti-inflammatory activity of hydroalcoholic extracts of Lavandula dentata L. and Lavandula stoechas L. J. Ethnopharmacol. 2016, 190, 142–158. [Google Scholar] [CrossRef] [PubMed]
  5. Zuzarte, M.d.R. Portuguese Lavenders: Evaluation of Their Potential Use for Health and Agricultural Purposes; Universidade de Coimbra: Coimbra, Portugal, 2013. [Google Scholar]
  6. Zuzarte, M.; Gonçalves, M.J.; Cavaleiro, C.; Cruz, M.T.; Benzarti, A.; Marongiu, B.; Maxia, A.; Piras, A.; Salgueiro, L. Antifungal and anti-inflammatory potential of Lavandula stoechas and Thymus herba-barona essential oils. Ind. Crop. Prod. 2013, 44, 97–103. [Google Scholar] [CrossRef]
  7. CPVO. Protocol for Tests on Distinctness, Uniformity and Stability; CPVO, Ed.; Lavandula L., Lavender; European Union: Angers, France, 2018. [Google Scholar]
  8. Pan, L.; Wang, N.; Wu, Z.; Guo, R.; Yu, X.; Zheng, Y.; Xia, Q.; Gui, S.; Chen, C. A High Density Genetic Map Derived from RAD Sequencing and Its Application in QTL Analysis of Yield-Related Traits in Vigna unguiculata. Front. Plant Sci. 2017, 8, 1544. [Google Scholar] [CrossRef] [Green Version]
  9. Patella, A.; Palumbo, F.; Ravi, S.; Stevanato, P.; Barcaccia, G. Genotyping by RAD Sequencing Analysis Assessed the Genetic Distinctiveness of Experimental Lines and Narrowed Down the Genomic Region Responsible for Leaf Shape in Endive (Cichorium endivia L.). Genes 2020, 11, 462. [Google Scholar] [CrossRef] [Green Version]
  10. Palumbo, F.; Galvao, A.C.; Nicoletto, C.; Sambo, P.; Barcaccia, G. Diversity Analysis of Sweet Potato Genetic Resources Using Morphological and Qualitative Traits and Molecular Markers. Genes 2019, 10, 840. [Google Scholar] [CrossRef] [Green Version]
  11. Barcaccia, G.; Palumbo, F.; Scariolo, F.; Vannozzi, A.; Borin, M.; Bona, S. Potentials and Challenges of Genomics for Breeding Cannabis Cultivars. Front. Plant Sci. 2020, 11, 573299. [Google Scholar] [CrossRef]
  12. Hnia, C.; Mohamed, B. Genetic diversity of Lavandula multifida L. (Lamiaceae) in Tunisia: Implication for conservation. Afr. J. Ecol. 2011, 49, 10–20. [Google Scholar] [CrossRef]
  13. Prasad, A.; Shukla, S.P.; Mathur, A.; Chanotiya, C.S.; Mathur, A.K. Genetic fidelity of long-term micropropagated Lavandula officinalis Chaix.: An important aromatic medicinal plant. Plant Cell Tissue Organ Cult. PCTOC 2014, 120, 803–811. [Google Scholar] [CrossRef]
  14. Ibrahim, H.M.; Salama, A.M.; Abou El-Leel, O.F. Analysis of genetic diversity of Lavandula species using taxonomic, essential oil and molecular genetic markers. Sciences 2017, 7, 141–154. [Google Scholar]
  15. Zagorcheva, T.; Stanev, S.; Rusanov, K.; Atanassov, I. SRAP markers for genetic diversity assessment of lavender (Lavandula angustifolia mill.) varieties and breeding lines. Biotechnol. Biotechnol. Equip. 2020, 34, 303–308. [Google Scholar] [CrossRef] [Green Version]
  16. Adal, A.M.; Demissie, Z.A.; Mahmoud, S.S. Identification, validation and cross-species transferability of novel Lavandula EST-SSRs. Planta 2015, 241, 987–1004. [Google Scholar] [CrossRef]
  17. Ahmed, S.M.; Alamer, K.H. Discriminating Lamiaceae Species from Saudi Arabia Using Allozyme and Specific DNA Markers. Pak. J. Bot. 2018, 50, 969–975. [Google Scholar]
  18. Adal, A.M. Development of Molecular Markers and Cloning of Genes Involved in The Biosynthesis of Monoterpenes in Lavandula; University of British Columbia: Vancouver, BC, Canada, 2019. [Google Scholar]
  19. Angioni, A.; Barra, A.; Coroneo, V.; Dessi, S.; Cabras, P. Chemical composition, seasonal variability, and antifungal activity of Lavandula stoechas L. ssp. stoechas essential oils from stem/leaves and flowers. J. Agric. Food Chem. 2006, 54, 4364–4370. [Google Scholar] [CrossRef] [PubMed]
  20. Tuttolomondo, T.; Dugo, G.; Ruberto, G.; Leto, C.; Napoli, E.M.; Potortì, A.G.; Fede, M.R.; Virga, G.; Leone, R.; Anna, E.D.; et al. Agronomical evaluation of Sicilian biotypes of Lavandula stoechas L. spp. stoechasand analysis of the essential oils. J. Essent. Oil Res. 2015, 27, 115–124. [Google Scholar] [CrossRef]
  21. Li, J.; Wang, Y.; Dong, Y.; Zhang, W.; Wang, D.; Bai, H.; Li, K.; Li, H.; Shi, L. The chromosome-based lavender genome provides new insights into Lamiaceae evolution and terpenoid biosynthesis. Hortic. Res. 2021, 8, 1–14. [Google Scholar]
  22. Stevanato, P.; Broccanello, C.; Biscarini, F.; Del Corvo, M.; Sablok, G.; Panella, L.; Stella, A.; Concheri, G. High-Throughput RAD-SNP Genotyping for Characterization of Sugar Beet Genotypes. Plant Mol. Biol. Report. 2013, 32, 691–696. [Google Scholar] [CrossRef]
  23. Rochette, N.C.; Rivera-Colon, A.G.; Catchen, J.M. Stacks 2: Analytical methods for paired-end sequencing improve RADseq-based population genomics. Mol. Ecol. 2019, 28, 4737–4754. [Google Scholar] [CrossRef]
  24. Rohlf, F. NTSYS-pc: Numerical Taxonomy Multivariate Analysis System; Applied Biostatistics, I. & Exeter Software (Firm): Setauket, NY, USA, 2009. [Google Scholar]
  25. Pritchard, J.K.; Stephens, M.; Donnelly, P. Inference of population structure using multilocus genotype data. Genetics 2000, 155, 945–959. [Google Scholar] [CrossRef]
  26. Earl, D.A.; vonHoldt, B.M. STRUCTURE HARVESTER: A website and program for visualizing STRUCTURE output and implementing the Evanno method. Conserv. Genet. Resour. 2011, 4, 359–361. [Google Scholar] [CrossRef]
  27. Moriya, Y.; Itoh, M.; Okuda, S.; Yoshizawa, A.C.; Kanehisa, M. KAAS: An automatic genome annotation and pathway reconstruction server. Nucleic Acids Res. 2007, 35, W182–W185. [Google Scholar] [CrossRef] [PubMed] [Green Version]
  28. Suzuki, S.; Kakuta, M.; Ishida, T.; Akiyama, Y. GHOSTX: An improved sequence homology search algorithm using a query suffix array and a database suffix array. PLoS ONE 2014, 9, e103833. [Google Scholar] [CrossRef] [Green Version]
  29. Kanehisa, M.; Goto, S.; Furumichi, M.; Tanabe, M.; Hirakawa, M. KEGG for representation and analysis of molecular networks involving diseases and drugs. Nucleic Acids Res. 2010, 38, D355–D360. [Google Scholar] [CrossRef] [PubMed] [Green Version]
  30. Nicolè, S.; Erickson, D.L.; Ambrosi, D.; Bellucci, E.; Lucchin, M.; Papa, R.; Kress, W.J.; Barcaccia, G. Biodiversity studies in Phaseolus species by DNA barcoding. Genome 2011, 54, 529–545. [Google Scholar] [CrossRef]
  31. Wojciechowski, M.F.; Lavin, M.; Sanderson, M. A phylogeny of legumes (Leguminosae) based on analysis of the plastid matK gene resolves many well-supported subclades within the family. Am. J. Bot. 2004, 91, 1846–1862. [Google Scholar] [CrossRef]
  32. Sang, T.; Crawford, D.; Stuessy, T. Chloroplast DNA phylogeny, reticulate evolution, and biogeography of Paeonia (Paeoniaceae). Am. J. Bot. 1997, 84, 1120. [Google Scholar] [CrossRef] [Green Version]
  33. Tate, J.A.; Simpson, B.B. Paraphyly of Tarasa (Malvaceae) and diverse origins of the polyploid species. Syst. Bot. 2003, 28, 723–737. [Google Scholar]
  34. White, T.J.; Bruns, T.; Lee, S.; Taylor, J. Amplification and direct sequencing of fungal ribosomal RNA genes for phylogenetics. PCR Protoc. Guide Methods Appl. 1990, 18, 315–322. [Google Scholar]
  35. Wang, J.; Wang, Z.; Du, X.; Yang, H.; Han, F.; Han, Y.; Yuan, F.; Zhang, L.; Peng, S.; Guo, E. A high-density genetic map and QTL analysis of agronomic traits in foxtail millet [Setaria italica (L.) P. Beauv.] using RAD-seq. PLoS ONE 2017, 12, e0179717. [Google Scholar] [CrossRef]
  36. Zhang, F.; Kang, J.; Long, R.; Yu, L.X.; Wang, Z.; Zhao, Z.; Zhang, T.; Yang, Q. High-density linkage map construction and mapping QTL for yield and yield components in autotetraploid alfalfa using RAD-seq. BMC Plant Biol. 2019, 19, 165. [Google Scholar] [CrossRef] [PubMed] [Green Version]
  37. Wang, L.; Conteh, B.; Fang, L.; Xia, Q.; Nian, H. QTL mapping for soybean (Glycine max L.) leaf chlorophyll-content traits in a genotyped RIL population by using RAD-seq based high-density linkage map. BMC Genom. 2020, 21, 739. [Google Scholar] [CrossRef] [PubMed]
  38. Wu, K.; Liu, H.; Yang, M.; Tao, Y.; Ma, H.; Wu, W.; Zuo, Y.; Zhao, Y. High-density genetic map construction and QTLs analysis of grain yield-related traits in sesame (Sesamum indicum L.) based on RAD-Seq techonology. BMC Plant Biol. 2014, 14, 274. [Google Scholar] [CrossRef] [PubMed] [Green Version]
  39. Peng, Y.; Hu, Y.; Mao, B.; Xiang, H.; Shao, Y.; Pan, Y.; Sheng, X.; Li, Y.; Ni, X.; Xia, Y.; et al. Genetic analysis for rice grain quality traits in the YVB stable variant line using RAD-seq. Mol. Genet Genom. 2016, 291, 297–307. [Google Scholar] [CrossRef] [PubMed]
  40. Yang, H.; Tao, Y.; Zheng, Z.; Shao, D.; Li, Z.; Sweetingham, M.W.; Buirchell, B.J.; Li, C. Rapid development of molecular markers by next-generation sequencing linked to a gene conferring phomopsis stem blight disease resistance for marker-assisted selection in lupin (Lupinus angustifolius L.) breeding. Theor. Appl. Genet 2013, 126, 511–522. [Google Scholar] [CrossRef] [PubMed]
  41. Fan, W.; Zong, J.; Luo, Z.; Chen, M.; Zhao, X.; Zhang, D.; Qi, Y.; Yuan, Z. Development of a RAD-Seq Based DNA Polymorphism Identification Software, AgroMarker Finder, and Its Application in Rice Marker-Assisted Breeding. PLoS ONE 2016, 11, e0147187. [Google Scholar] [CrossRef] [PubMed] [Green Version]
  42. Yamashita, H.; Uchida, T.; Tanaka, Y.; Katai, H.; Nagano, A.J.; Morita, A.; Ikka, T. Genomic predictions and genome-wide association studies based on RAD-seq of quality-related metabolites for the genomics-assisted breeding of tea plants. Sci. Rep. 2020, 10, 17480. [Google Scholar] [CrossRef]
  43. Kawamura, K.; Kawanabe, T.; Shimizu, M.; Nagano, A.J.; Saeki, N.; Okazaki, K.; Kaji, M.; Dennis, E.S.; Osabe, K.; Fujimoto, R. Genetic distance of inbred lines of Chinese cabbage and its relationship to heterosis. Plant Gene 2016, 5, 1–7. [Google Scholar] [CrossRef] [Green Version]
  44. Liu, L.; Jin, X.; Chen, N.; Li, X.; Li, P.; Fu, C. Phylogeny of Morella rubra and Its Relatives (Myricaceae) and Genetic Resources of Chinese Bayberry Using RAD Sequencing. PLoS ONE 2015, 10, e0139840. [Google Scholar] [CrossRef] [Green Version]
  45. Feng, J.; Zhao, S.; Li, M.; Zhang, C.; Qu, H.; Li, Q.; Li, J.; Lin, Y.; Pu, Z. Genome-wide genetic diversity detection and population structure analysis in sweetpotato (Ipomoea batatas) using RAD-seq. Genomics 2020, 112, 1978–1987. [Google Scholar] [CrossRef]
  46. Moja, S.; Guitton, Y.; Nicolè, F.; Legendre, L.; Pasquier, B.; Upson, T.; Jullien, F. Genome size and plastid trnK-matK markers give new insights into the evolutionary history of the genus Lavandula L. Plant Biosyst. Int. J. Deal. All Asp. Plant Biol. 2015, 150, 1216–1224. [Google Scholar] [CrossRef]
  47. Robb, J.B.; Cherry, R.J. Multi-Bracted Lavender Plants. U.S. Patent No. 9301463, 5 April 2016. [Google Scholar]
  48. Lam, H.Y.; Clark, M.J.; Chen, R.; Chen, R.; Natsoulis, G.; O’huallachain, M.; Dewey, F.E.; Habegger, L.; Ashley, E.A.; Gerstein, M.B. Performance comparison of whole-genome sequencing platforms. Nat. Biotechnol. 2012, 30, 78–82. [Google Scholar] [CrossRef] [PubMed] [Green Version]
  49. Eklöf, H.; Bernhardsson, C.; Ingvarsson, P.K. Comparing the Effectiveness of Exome Capture Probes, Genotyping by Sequencing and Whole-Genome Re-Sequencing for Assessing Genetic Diversity in Natural and Managed Stands of Picea abies. Forests 2020, 11, 1185. [Google Scholar] [CrossRef]
  50. Rabbi, I.Y.; Kulakow, P.A.; Manu-Aduening, J.A.; Dankyi, A.A.; Asibuo, J.Y.; Parkes, E.Y.; Abdoulaye, T.; Girma, G.; Gedil, M.A.; Ramu, P.; et al. Tracking crop varieties using genotyping-by-sequencing markers: A case study using cassava (Manihot esculenta Crantz). BMC Genet 2015, 16, 115. [Google Scholar] [CrossRef] [Green Version]
  51. McCoy, R.M.; Utturkar, S.M.; Crook, J.W.; Thimmapuram, J.; Widhalm, J.R. The origin and biosynthesis of the naphthalenoid moiety of juglone in black walnut. Hortic. Res. 2018, 5, 67. [Google Scholar] [CrossRef] [PubMed] [Green Version]
  52. Niu, M.; Xiong, Y.; Yan, H.; Zhang, X.; Li, Y.; da Silva, J.A.T.; Ma, G. Cloning and Expression Analysis of Mevalonate Kinase and Phosphomevalonate Kinase Genes Associated with MVA Pathway in Santalum Album. Sci. Rep. 2020, 11, 1–13. [Google Scholar]
  53. Achard, F.; Butruille, M.; Madjarac, S.; Nelson, P.; Duesing, J.; Laffont, J.L.; Nelson, B.; Xiong, J.; Mikel, M.A.; Smith, J. Single nucleotide polymorphisms facilitate distinctness-uniformity-stability testing of soybean cultivars for plant variety protection. Crop Sci. 2020, 60, 2280–2303. [Google Scholar] [CrossRef]
  54. Jamali, S.H.; Cockram, J.; Hickey, L.T. Insights into deployment of DNA markers in plant variety protection and registration. Theor. Appl. Genet 2019, 132, 1911–1929. [Google Scholar] [CrossRef] [PubMed]
  55. Yu, J.-K.; Chung, Y.-S. Plant Variety Protection: Current Practices and Insights. Genes 2021, 12, 1127. [Google Scholar] [CrossRef]
Figure 1. (a) UPGMA dendrogram based on the pair-wise genetic similarity matrix highlighting five main “Clusters” for the no missing values containing dataset. (b) STRUCTURE software histogram for K = 3 of 15 individuals of Lavandula with a no missing values containing dataset (“red star” symbol labels individuals with homozygosity >80%).
Genes 12 01656 g001
Figure 2. Principal Coordinate Analysis (PCoA) [24], based on the eigenvectors calculated starting from the genetic similarity matrix and highlighting the 5 mains “Clusters” (A to E) identified for the 15 analysed samples of Lavandula.
Genes 12 01656 g002
Figure 3. (a) Neighbour Joining tree based on the polymorphic sites among ITS nuclear region, and matK, trnH-psbA and rbcL chloroplast barcoding regions. Bootstrap values are reported. (b) LOGO representation of polymorphic sites identified among the 15 Lavandula accessions analysed for the DNA barcoding.
Genes 12 01656 g003
Table 1. List of primers used for each chloroplast (cpDNA) and nuclear (nuDNA) marker with their nucleotide sequence, and reference source.
MarkerPrimer NamePrimer Sequence (5′-3′) *Ta (°C)References
rbcL gene (cpDNA)rbcL_FGCAGCATTYCGAGTAASTCCYCA55[30]
rbcL_RGAAACGYTCTCTCCAWCGCATAAA[30]
matK gene (cpDNA)matK4LaCCTTCGATACTGGGTGAAAGAT55[31]
matK1932RaCCAGACCGGCTTACTAATGGG[31]
trnH-psbA (cpDNA)psbA3′fGTTATGCATGAACGTAATGCTC55[32]
trnHfCGCATGGTGGATTCACAATCC[33]
ITS1
(nuDNA)
ITS5GGAAGTAAAAGTCGTAACAAGG55[34]
ITS2GCTGCGTTCTTCATCGATGC[34]
* Y: C or T; S: G or C; W: A or T; Ta: primers’ annealing temperature.
Table 2. Genetic Similarity matrix of 15 Lavandula individuals based on 16,228 SNPs with no missing data, and relative observed homozygosity (Obs. Ho) and heterozygosity (Obs. He).
Obs. HoObs. He Sample Genetic Similarity (GS)
160366.1%33.9%Cluster A1603100.0%
260160.1%39.9%260182.8%100.0%
260472.8%27.2%260478.9%77.6%100.0%
160576.4%23.6%Cluster B160579.8%77.8%73.8%100.0%
184178.8%21.2%184177.9%75.7%71.1%86.4%100.0%
182677.9%22.1%182679.2%76.9%74.1%87.4%86.5%100.0%
SD-01485.5%14.5%SD-01476.5%74.3%70.6%88.5%83.9%83.3%100.0%
BPI90.1%9.9%Cluster CBPI74.6%72.3%68.2%82.8%79.1%83.7%83.8%100.0%
ST-91384.8%15.2%ST-91375.0%74.2%70.4%85.7%81.1%86.5%83.5%93.3%100.0%
SD-33282.4%17.6%SD-33275.9%74.4%70.5%83.5%79.1%84.8%85.4%93.7%93.5%100.0%
181189.7%10.3%181175.1%72.1%67.7%86.0%85.6%85.9%86.4%89.7%92.2%89.5%100.0%
ST-10377.6%22.4%Cluster DST-10375.7%72.9%69.4%80.7%79.4%76.9%82.8%83.2%82.2%82.3%82.0%100.0%
360178.1%21.9%360172.2%70.4%67.8%78.0%76.5%75.2%80.0%76.3%77.2%77.2%80.9%86.0%100.0%
260387.8%12.2%Cluster E260363.0%64.0%65.9%55.4%58.8%56.2%54.0%53.9%53.9%53.4%51.6%54.9%53.1%100.0%
260571.6%28.4%260567.6%68.9%69.3%62.0%66.4%62.9%60.0%58.9%61.0%60.3%59.7%64.0%63.8%73.7%100.0%
160326012604160518411826SD-014BPIST-913SD-3321811ST-103360126032605
Cluster ACluster BCluster CCluster DCluster E
Table 3. Average genetic similarity of clusters identified through the construction of the UPGMA dendrogram, and average observed homozygosity (Avg. Obs. Ho).
Avg. Obs. HoClusterAvg. Genetic Similarity (GS)
66.4% ± 3.7%Cluster A79.8% ± 1.6%
79.7% ± 2.0%Cluster B75.6% ± 0.9%86.0% ± 0.8%
86.7% ± 1.9%Cluster C72.5% ± 0.8%83.9% ± 0.6%92.0% ± 0.8%
77.9% ± 0.2%Cluster D71.4% ± 1.1%78.7% ± 0.9%80.2% ± 1.0%86.0% ± N/A
79.7% ± 8.1%Cluster E66.4% ± 1.1%59.4% ± 1.5%56.6% ± 1.3%58.9% ± 2.9%73.7% ± N/A
78.5% ± 2.4%A + B + C + D 60.1% ± 1.0%79.7% ± 0.7%
Cluster ACluster BCluster CCluster DCluster EA + B + C + D
Table 4. Summary statistics of the BLASTN analysis of the RAD-Seq reads against the exomes of S. indicum and S. splendens. Statistics information of the flavonoids and terpenes pathways involved genes is also reported.
BLASTn
Result
RAD-Tags (n)CDS (n)Protein Products
(n)
Avg. Identity (%)Avg. Length (bp)Avg. E-ValueAvg. BitscoreAvg. ScoreAvg.
Mismatches (n)
Avg. Identity (n)Avg.
Positive Positions
Exome S.ind26182907207787.364.45.33 × 10−1280.287.58.256.287.3
Flavonoids15141086.767.11.04 × 10−1282.189.68.958.286.7
Terpenes20241986.062.96.20 × 10−1274.381.09.053.986.0
Exome S.sp42396534121588.764.22.90 × 10−1283.891.57.356.988.7
Flavonoids33401887.466.02.41 × 10−1282.590.18.357.687.4
Terpenes61652888.965.61.45 × 10−1286.694.77.358.388.9
Table 5. Genetic Similarity matrix of 15 Lavandula individuals based the BLASTN analysis against S. indicum exome, and relative observed homozygosity (Obs. Ho) and heterozygosity (Obs. He).
Obs. HoObs. He Genetic Similarity (GS)
68.3%31.7%Cluster A1603100.0%
60.4%39.6%260183.1%100.0%
73.7%26.3%260479.6%77.3%100.0%
78.3%21.7%Cluster B160581.2%78.5%74.8%100.0%
86.1%13.9%SD-01477.9%75.5%72.3%88.9%100.0%
78.2%21.8%184179.7%77.5%73.1%86.9%85.1%100.0%
79.5%20.5%182681.0%78.3%75.9%87.0%84.5%88.1%100.0%
90.4%9.6%Cluster CBPI76.4%74.0%70.6%83.5%85.8%80.6%84.3%100.0%
85.3%14.7%ST-91376.9%76.1%72.7%86.2%85.5%82.0%87.4%94.2%100.0%
83.2%16.8%SD-33277.3%76.3%72.9%83.9%86.9%80.4%85.1%93.9%93.7%100.0%
89.7%10.3%181177.5%74.3%70.4%86.8%87.9%86.2%86.6%90.4%92.6%90.0%100.0%
78.5%21.5%Cluster DST-10377.5%74.7%71.3%82.5%84.2%81.6%79.0%84.0%83.8%83.3%84.1%100.0%
77.3%22.7%360175.0%73.2%70.4%79.4%80.9%78.5%76.6%77.8%78.9%78.4%82.2%87.0%100.0%
87.0%13.0%Cluster E260365.8%67.4%68.9%59.0%58.9%63.0%61.1%57.9%58.2%58.1%56.4%58.7%57.8%100.0%
70.2%29.8%260569.1%70.4%70.9%64.1%63.5%69.2%65.9%61.5%63.6%63.3%62.9%66.5%67.4%74.3%100.0%
1603260126041605SD-01418411826BPIST-913SD-3321811ST-103360126032605
Cluster ACluster BCluster CCluster DCluster E
Table 6. Average genetic similarity of clusters identified through the construction of the UPGMA dendrogram, and average observed homozygosity (Avg. Obs. Ho) The standard error is also reported.
Avg. Obs. HoSampleAvg. Genetic Similarity (GS)
67.4% ± 3.9%Cluster A80.0% ± 1.7%
80.5% ± 1.9%Cluster B77.1% ± 0.8%86.7% ± 0.7%
87.2% ± 1.7%Cluster C74.6% ± 0.7%84.9% ± 0.6%92.5% ± 0.8%
77.9% ± 0.4%Cluster D73.7% ± 1.1%80.3% ± 0.9%81.6% ± 1.0%87.0% ± N/A
78.6% ± 8.4%Cluster E68.8% ± 0.8%63.1% ± 1.2%60.2% ± 1.0%62.6% ± 2.5%74.3% ± N/A
79.1% ± 2.3%A + B + C + D 63.4% ± 0.9%81.0% ± 0.7%
Cluster ACluster BCluster CCluster DCluster EA + B + C + D
Table 7. Multiple alignments results reporting read ID, S. indicum (GCF_000512975.1) accession number on NCBI database, Flavonoid/Terpenes product, KEGG ID, amino acid substitution based on the polymorphic SNP in the 15 individuals of Lavandula.
FLAVONOIDS
Read IDS. ind CDS IDproductKO-IDs from KEGGSNP to AA Subs.
3043XP_011100449.1anthocyanidin 3-O-glucosyltransferase 2K12930Ile -> Met
XP_011100453.1anthocyanidin 3-O-glucosyltransferase 2-like
6706XP_011090466.1aspartate aminotransferase and glu/asp-prephenate aminotransferaseK15849Val -> Ala
7480XP_011089364.1arogenate dehydratase/prephenate dehydratase 2, chloroplasticK05359Glu -> Val
XP_011089363.1
7969XP_011094662.1phenylalanine ammonia-lyaseK10775Gln -> Arg
9011XP_011089239.2LOW QUALITY PROTEIN: 4-coumarate--CoA ligase-like 7K01904Gln -> Gln
9012Gln -> Arg
9955XP_020554052.1putative anthocyanidin reductase isoform X2K08695Uncertain
XP_011095308.1X -> Leu
10947XP_011069886.1anthocyanidin 3-O-glucosyltransferase-likeK12930Arg -> Pro
11587XP_011077338.1phenylalanine ammonia-lyaseK10775His -> Tyr
TERPENES
Read IDS. ind CDS_IDproductKO-IDs from KEGGSNP to AA Subs.
8036XP_011071094.11,4-dihydroxy-2-naphthoyl-CoA synthase, peroxisomalK01661X -> X
14576XP_011096130.1α-farnesene synthaseK14173Gly -> Glu
6208XP_011093795.1β-amyrin synthaseK15813Lys -> Glu
8386XP_011093795.1X -> Arg
6208XP_011085901.1β-amyrin synthase-likeK15813Lys -> Glu
8386XP_011085901.1X -> Arg
6276XP_011095756.1ent-kaur-16-ene synthase, chloroplasticN/APro -> Ala
7199XP_011083784.1ent-kaurene oxidase, chloroplastic-likeK04122Val -> Met
3576XP_020550121.1geranylgeranyl transferase type-2 subunit α 1K09833Leu -> Ser
10802XP_011092247.1gibberellin 20-oxidase-like proteinK05282Gln -> Gln
11279XP_011096560.1gibberellin 2-β-dioxygenaseK04125Phe -> Leu
10014XP_011098626.1gibberellin-regulated protein 4-likeN/AArg -> Gln
XP_011071640.1
4578XP_011084658.1isopentenyl-diphosphate Delta-isomerase IK01823Uncertain
6515Phe -> Leu
13525XP_011077171.1Pro -> Pro
9817XP_011075409.1probable NAD(P)H dehydrogenase subunit CRR3, chloroplasticN/ATrp -> Leu
14513XP_011082816.1probable solanesyl-diphosphate synthase 3, chloroplasticK05356Leu -> Phe
14513XP_011098150.1probable solanesyl-diphosphate synthase 3, chloroplastic isoform X2Leu -> Phe
5640XP_020551000.1protein prenyltransferase α subunit, isoform X6K14137Pro -> Gln
XP_020551002.1
3603XP_011078470.1squalene monooxygenaseK00511Asn -> Thr
9296XP_011092466.1squalene monooxygenase-likeAsp -> His
5280XP_011092839.1squalene synthaseK00801Pro -> Ser
XP_011092841.1
4990XP_011082248.1vetispiradiene synthase 3 isoform X2K14182Asp -> Glu
14152XP_020548233.1isochorismate synthase, chloroplastic-likeK01851Arg -> Met
14154Gln -> Pro
14685XP_020548234.1isochorismate synthase, chloroplastic-likeK01851Val -> Leu
14687Thr -> Thr
15015Lys -> Lys
Publisher’s Note: MDPI stays neutral with regard to jurisdictional claims in published maps and institutional affiliations.

