
Risk Allele Frequency Analysis of Single-Nucleotide Polymorphisms for Vitamin D Concentrations in Different Ethnic Group


Abstract
:1. Introduction
2. Materials and Methods
2.1. Ethical Considerations
2.2. Comparison of Vitamin D-Related SNPs among the Global Population and East Asia
2.3. Calculation of Genetic Risk Scores Using SNPs Related to Vitamin D Concentration
2.4. Statistical Analyses
3. Results
3.1. Vitamin D Concentration-Related SNPs in the Global Population
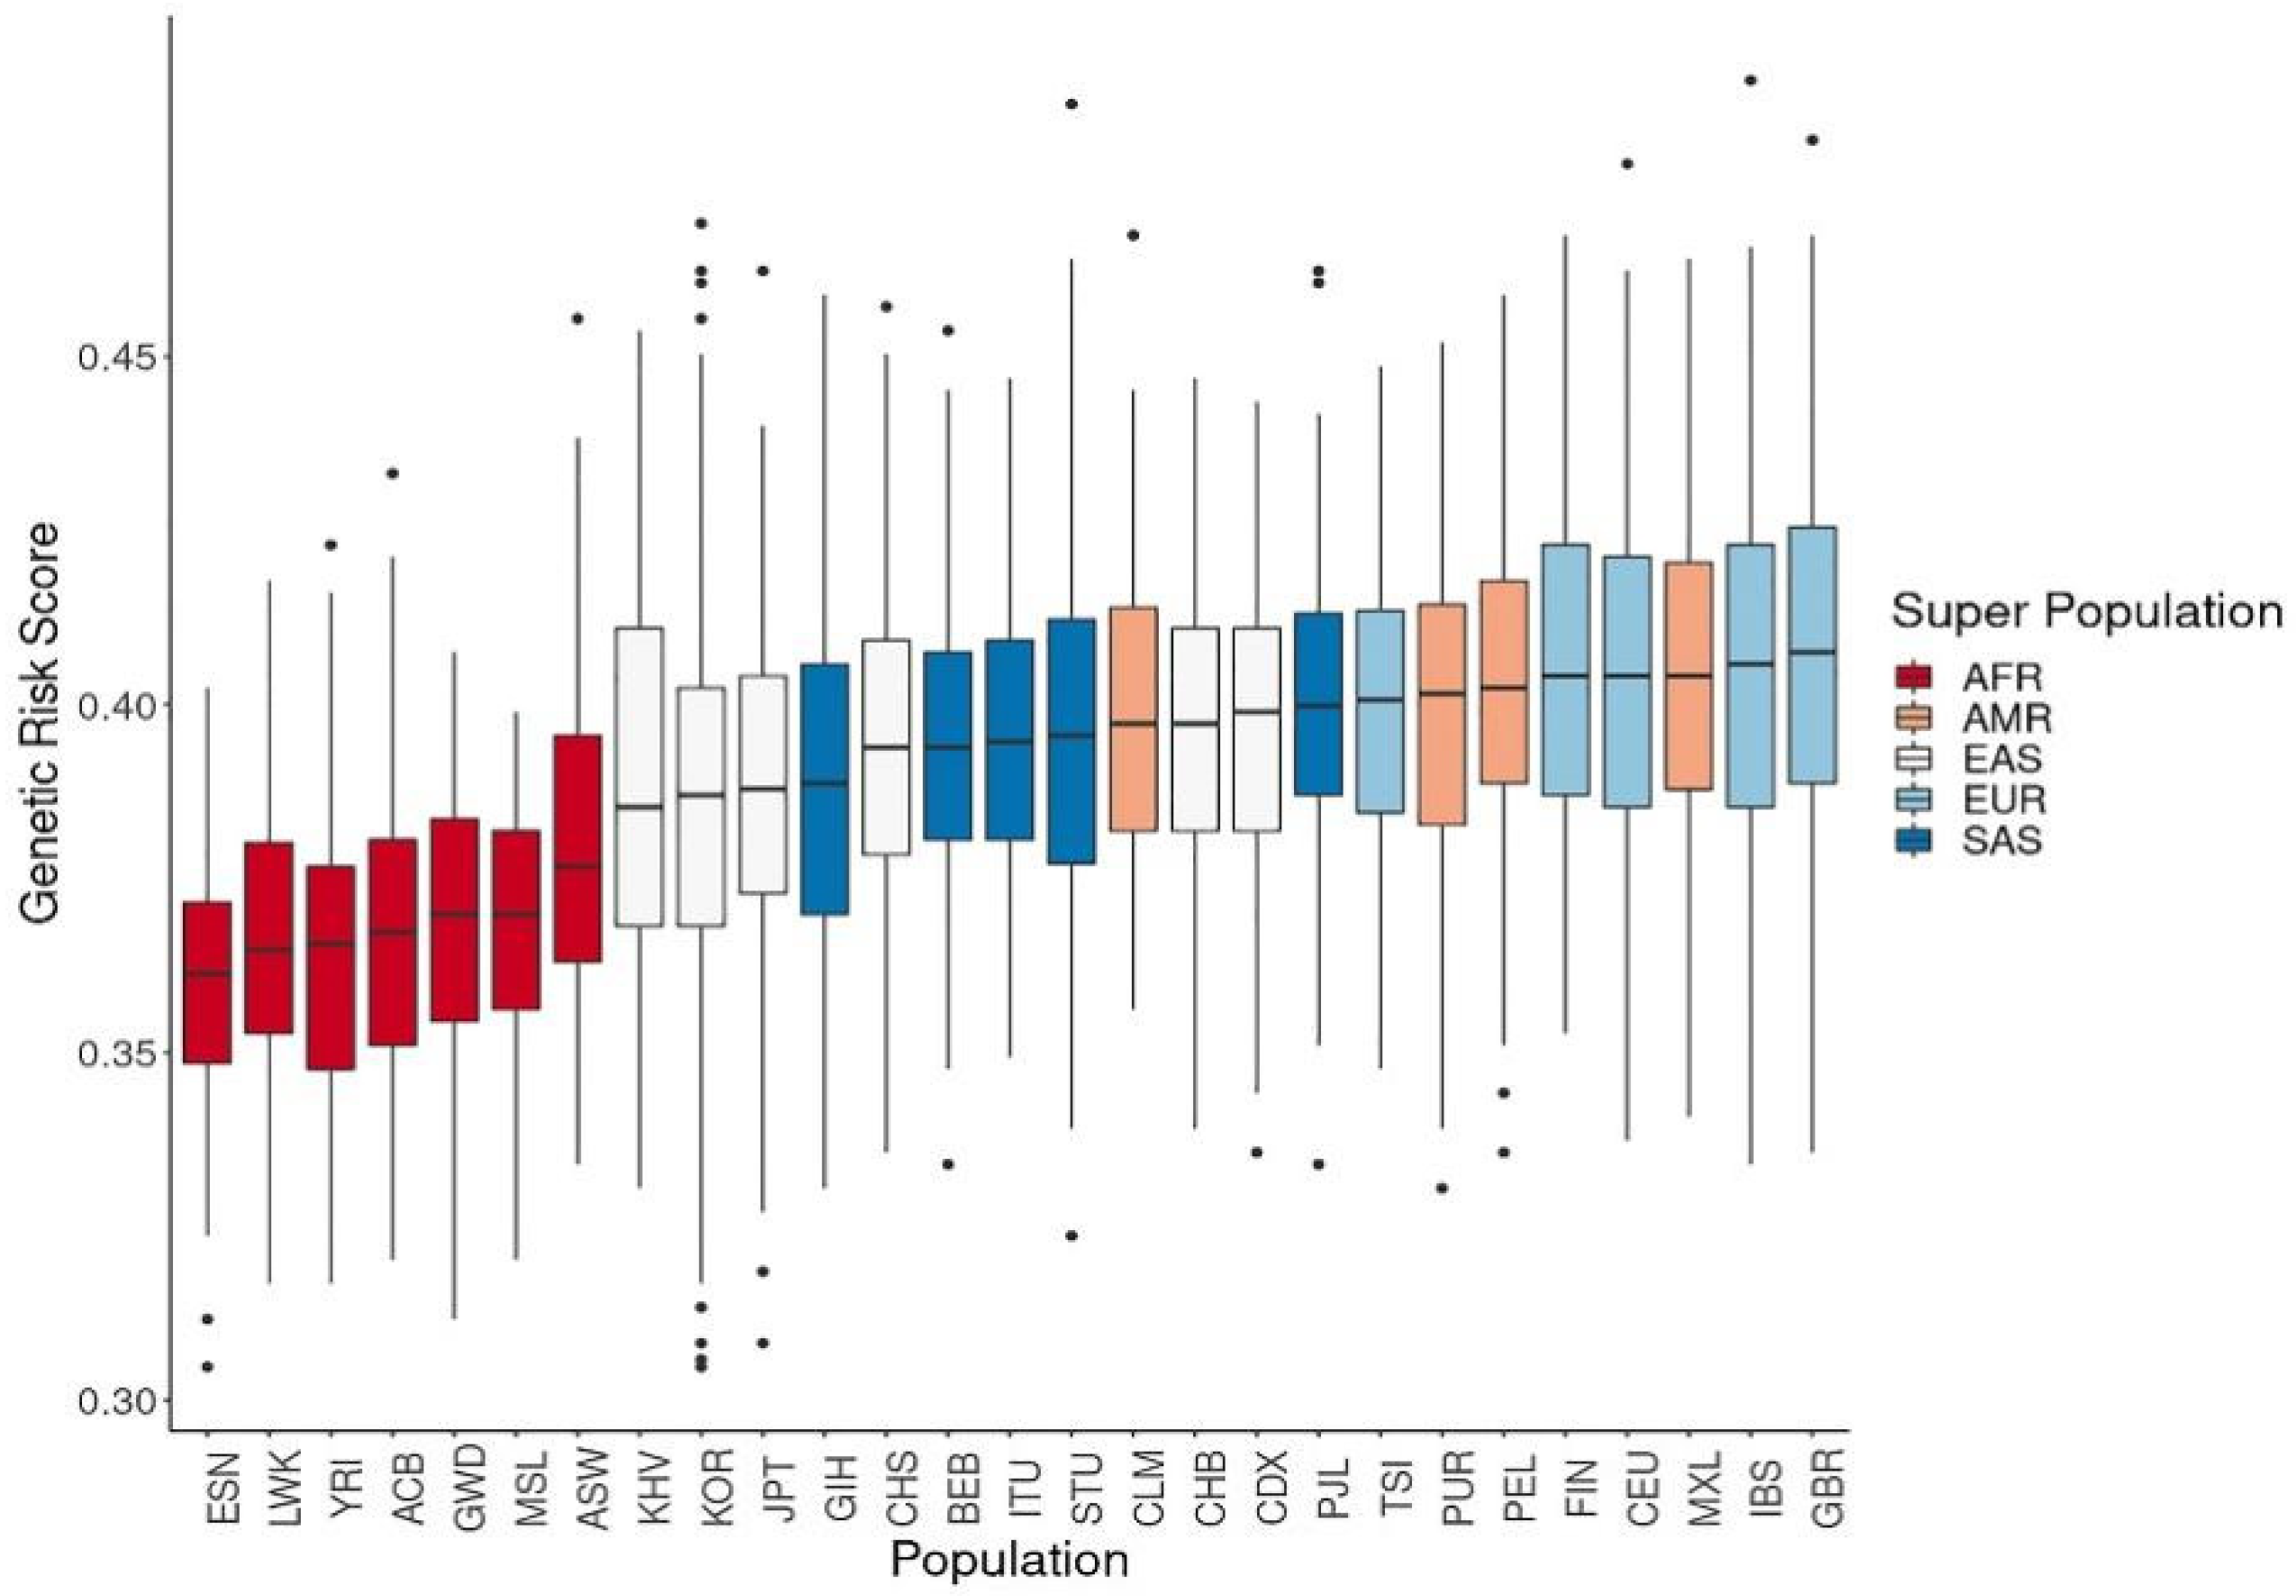
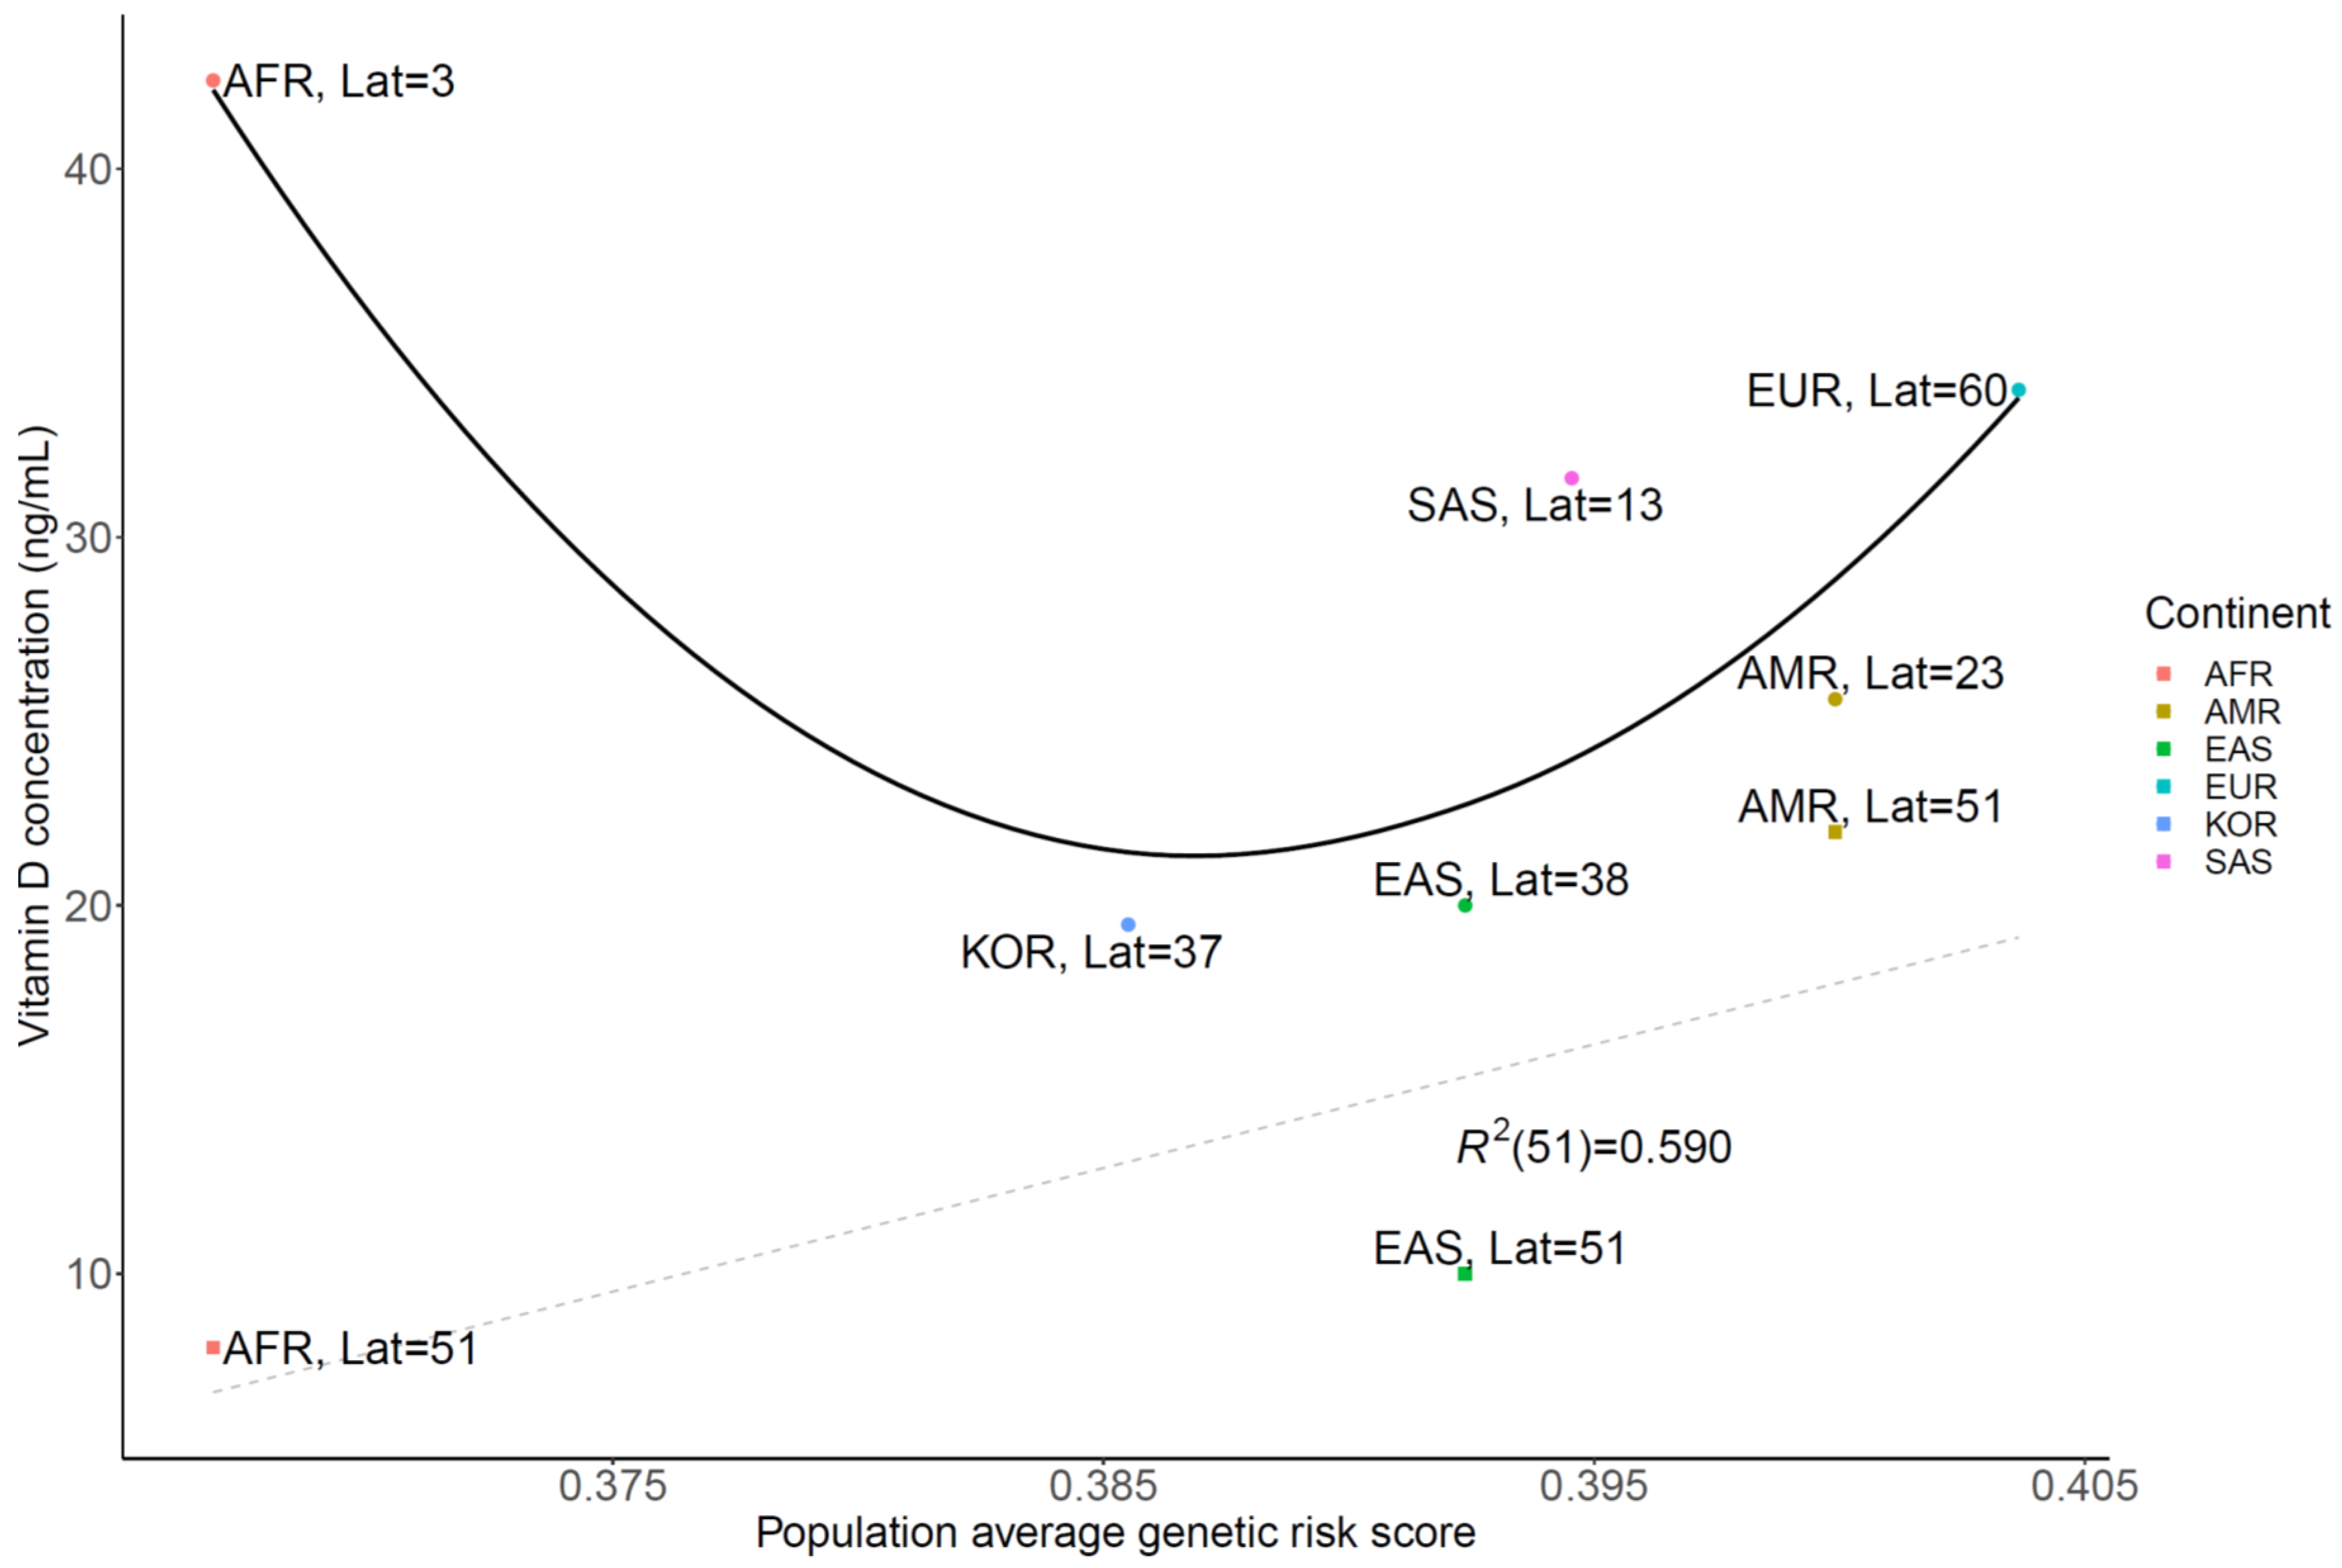
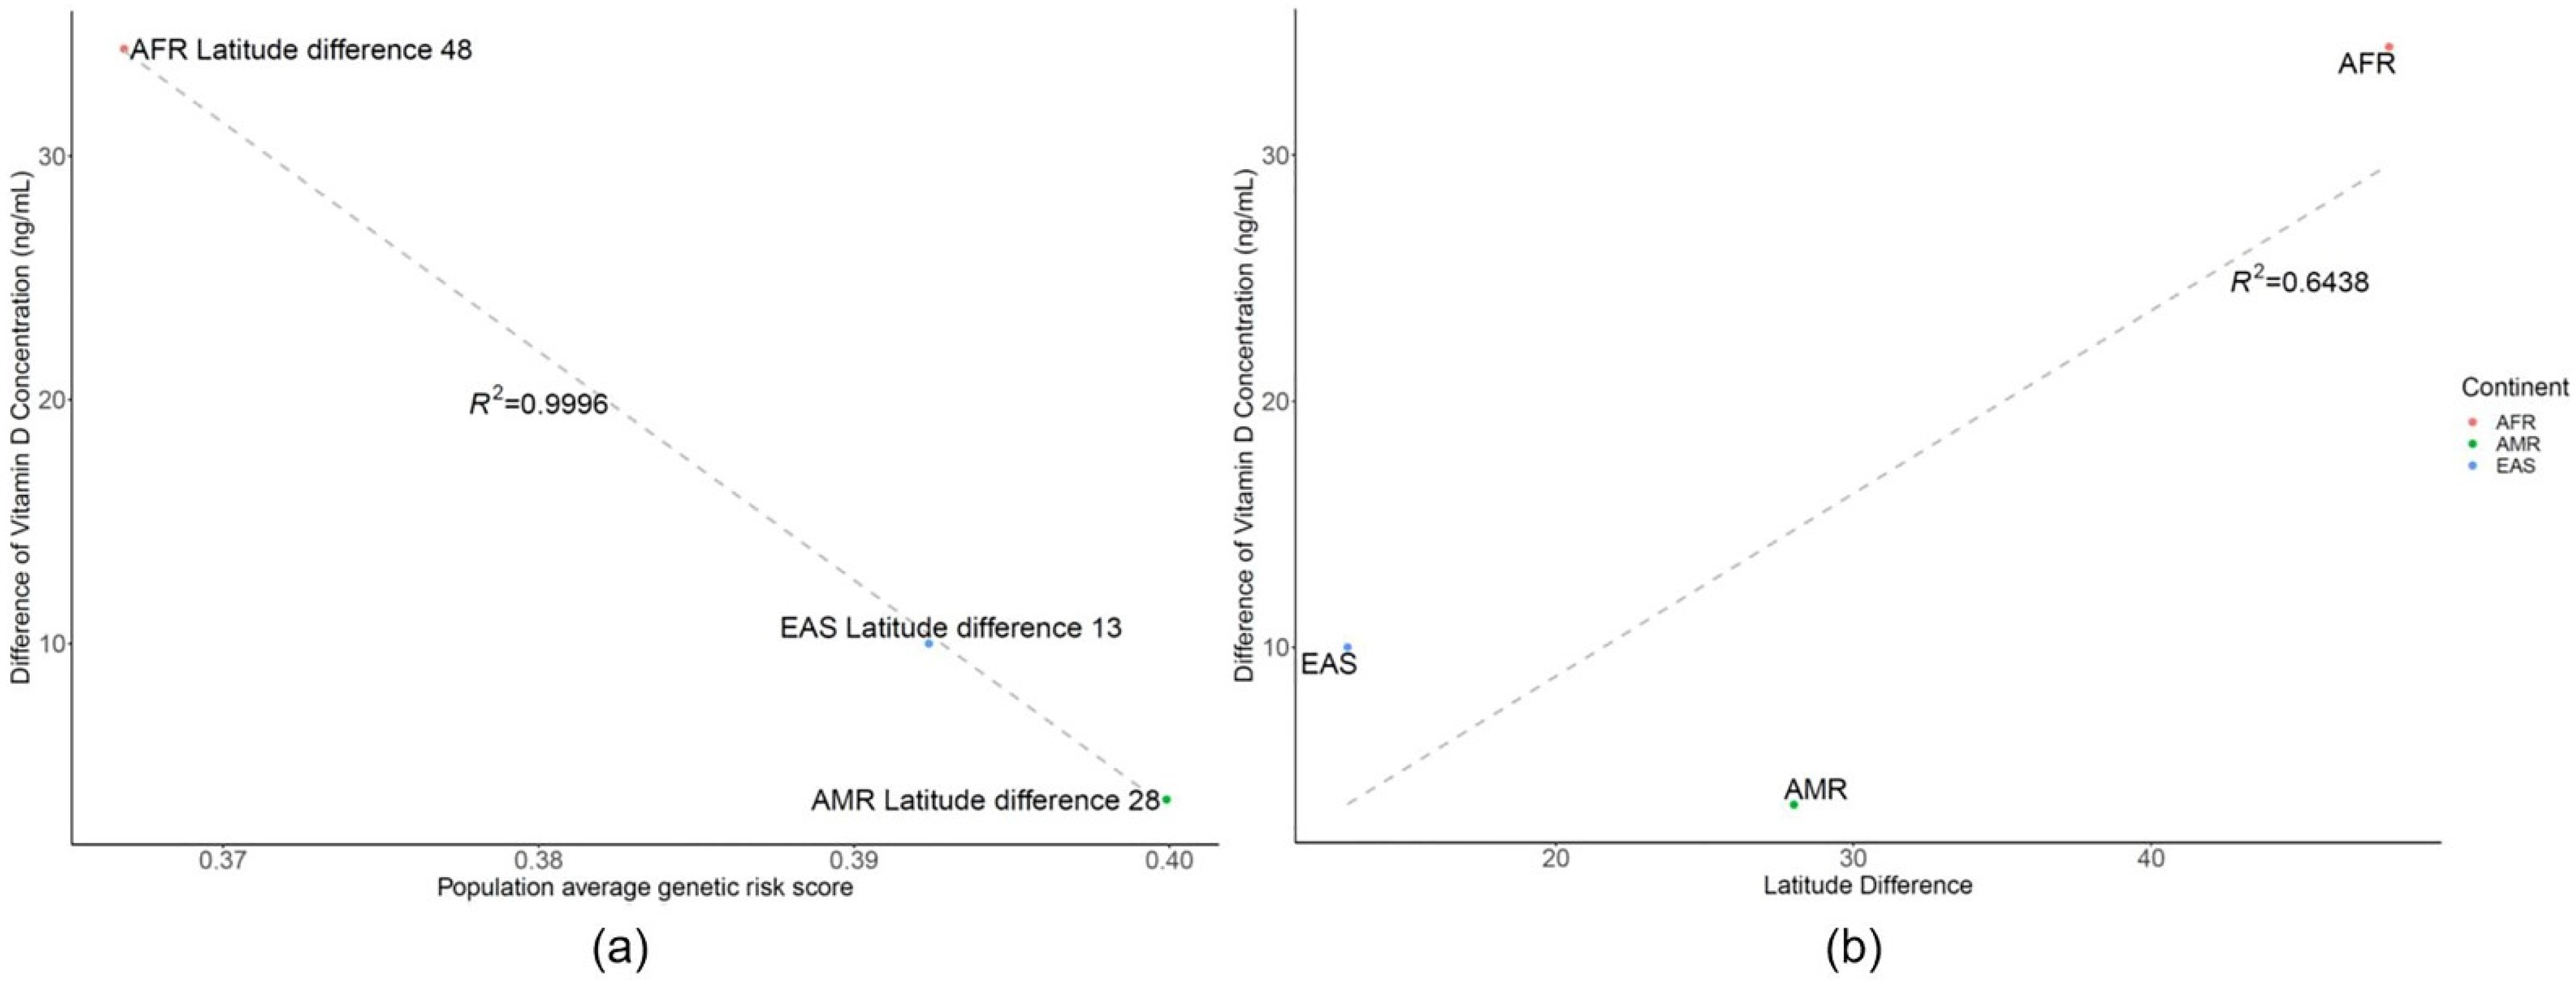
3.2. Genetic Risk Scores Calculated Using SNPs Related to Vitamin D Levels
4. Discussion
5. Conclusions
Supplementary Materials
Author Contributions
Funding
Institutional Review Board Statement
Informed Consent Statement
Data Availability Statement
Acknowledgments
Conflicts of Interest
References
- Holick, M.F. Vitamin D deficiency. N. Engl. J. Med. 2007, 357, 266–281. [Google Scholar] [CrossRef]
- Altieri, B.; Muscogiuri, G.; Barrea, L.; Mathieu, C.; Vallone, C.V.; Mascitelli, L.; Bizzaro, G.; Altieri, V.M.; Tirabassi, G.; Balercia, G.; et al. Does vitamin D play a role in autoimmune endocrine disorders? A proof of concept. Rev. Endocr. Metab. Disord. 2017, 18, 335–346. [Google Scholar] [CrossRef] [PubMed] [Green Version]
- Skaaby, T.; Thuesen, B.H.; Linneberg, A. Vitamin D, Cardiovascular Disease and Risk Factors. Adv. Exp. Med. Biol. 2017, 996, 221–230. [Google Scholar] [CrossRef]
- Lee, C.J.; Iyer, G.; Liu, Y.; Kalyani, R.R.; Bamba, N.; Ligon, C.B.; Varma, S.; Mathioudakis, N. The effect of vitamin D supplementation on glucose metabolism in type 2 diabetes mellitus: A systematic review and meta-analysis of intervention studies. J. Diabetes Complicat. 2017, 31, 1115–1126. [Google Scholar] [CrossRef] [PubMed]
- Gois, P.H.F.; Ferreira, D.; Olenski, S.; Seguro, A.C. Vitamin D and Infectious Diseases: Simple Bystander or Contributing Factor? Nutrients 2017, 9, 651. [Google Scholar] [CrossRef] [PubMed] [Green Version]
- Bikle, D.D. Vitamin D metabolism, mechanism of action, and clinical applications. Chem. Biol. 2014, 21, 319–329. [Google Scholar] [CrossRef] [Green Version]
- Makariou, S.; Liberopoulos, E.N.; Elisaf, M.; Challa, A. Novel roles of vitamin D in disease: What is new in 2011? Eur. J. Intern. Med. 2011, 22, 355–362. [Google Scholar] [CrossRef]
- Bischoff-Ferrari, H.A.; Giovannucci, E.; Willett, W.C.; Dietrich, T.; Dawson-Hughes, B. Estimation of optimal serum concentrations of 25-hydroxyvitamin D for multiple health outcomes. Am. J. Clin. Nutr. 2006, 84, 18–28. [Google Scholar] [CrossRef]
- van Schoor, N.; Lips, P. Global Overview of Vitamin D Status. Endocrinol. Metab. Clin. N. A. 2017, 46, 845–870. [Google Scholar] [CrossRef]
- Choi, H.S.; Oh, H.J.; Choi, H.; Choi, W.H.; Kim, J.G.; Kim, K.M.; Kim, K.J.; Rhee, Y.; Lim, S.K. Vitamin D insufficiency in Korea--a greater threat to younger generation: The Korea National Health and Nutrition Examination Survey (KNHANES) 2008. J. Clin. Endocrinol. Metab. 2011, 96, 643–651. [Google Scholar] [CrossRef]
- Ahn, J.; Yu, K.; Stolzenberg-Solomon, R.; Simon, K.C.; McCullough, M.L.; Gallicchio, L.; Jacobs, E.J.; Ascherio, A.; Helzlsouer, K.; Jacobs, K.B.; et al. Genome-wide association study of circulating vitamin D levels. Hum. Mol. Genet. 2010, 19, 2739–2745. [Google Scholar] [CrossRef] [PubMed]
- Wang, T.J.; Zhang, F.; Richards, J.B.; Kestenbaum, B.; van Meurs, J.B.; Berry, D.; Kiel, D.P.; Streeten, E.A.; Ohlsson, C.; Koller, D.L.; et al. Common genetic determinants of vitamin D insufficiency: A genome-wide association study. Lancet 2010, 376, 180–188. [Google Scholar] [CrossRef] [Green Version]
- Malik, S.; Fu, L.; Juras, D.J.; Karmali, M.; Wong, B.Y.; Gozdzik, A.; Cole, D.E. Common variants of the vitamin D binding protein gene and adverse health outcomes. Crit. Rev. Clin. Lab. Sci. 2013, 50, 1–22. [Google Scholar] [CrossRef] [PubMed] [Green Version]
- Anderson, D.; Holt, B.J.; Pennell, C.E.; Holt, P.G.; Hart, P.H.; Blackwell, J.M. Genome-wide association study of vitamin D levels in children: Replication in the Western Australian Pregnancy Cohort (Raine) study. Genes Immun. 2014, 15, 578–583. [Google Scholar] [CrossRef] [PubMed]
- Moy, K.A.; Mondul, A.M.; Zhang, H.; Weinstein, S.J.; Wheeler, W.; Chung, C.C.; Mannisto, S.; Yu, K.; Chanock, S.J.; Albanes, D. Genome-wide association study of circulating vitamin D-binding protein. Am. J. Clin. Nutr. 2014, 99, 1424–1431. [Google Scholar] [CrossRef] [PubMed] [Green Version]
- Sapkota, B.R.; Hopkins, R.; Bjonnes, A.; Ralhan, S.; Wander, G.S.; Mehra, N.K.; Singh, J.R.; Blackett, P.R.; Saxena, R.; Sanghera, D.K. Genome-wide association study of 25(OH) Vitamin D concentrations in Punjabi Sikhs: Results of the Asian Indian diabetic heart study. J. Steroid Biochem. Mol. Biol. 2016, 158, 149–156. [Google Scholar] [CrossRef] [Green Version]
- Wang, J.; Thingholm, L.B.; Skieceviciene, J.; Rausch, P.; Kummen, M.; Hov, J.R.; Degenhardt, F.; Heinsen, F.A.; Ruhlemann, M.C.; Szymczak, S.; et al. Genome-wide association analysis identifies variation in vitamin D receptor and other host factors influencing the gut microbiota. Nat. Genet. 2016, 48, 1396–1406. [Google Scholar] [CrossRef]
- Pinese, M.; Lacaze, P.; Rath, E.M.; Stone, A.; Brion, M.J.; Ameur, A.; Nagpal, S.; Puttick, C.; Husson, S.; Degrave, D.; et al. The Medical Genome Reference Bank contains whole genome and phenotype data of 2570 healthy elderly. Nat. Commun. 2020, 11, 435. [Google Scholar] [CrossRef] [Green Version]
- Shin, H.T.; Yoon, B.W.; Seo, J.H. Comparison of risk allele frequencies of single nucleotide polymorphisms associated with age-related macular degeneration in different ethnic groups. BMC Ophthalmol. 2021, 21, 97. [Google Scholar] [CrossRef]
- Shin, H.T.; Yoon, B.W.; Seo, J.H. Analysis of risk allele frequencies of single nucleotide polymorphisms related to open-angle glaucoma in different ethnic groups. BMC Med. Genom. 2021, 14, 80. [Google Scholar] [CrossRef]
- Mao, L.; Fang, Y.; Campbell, M.; Southerland, W.M. Population differentiation in allele frequencies of obesity-associated SNPs. BMC Genom. 2017, 18, 861. [Google Scholar] [CrossRef]
- Consortium, G.P.; Auton, A.; Brooks, L.D.; Durbin, R.M.; Garrison, E.P.; Kang, H.M.; Korbel, J.O.; Marchini, J.L.; McCarthy, S.; McVean, G.A.; et al. A global reference for human genetic variation. Nature 2015, 526, 68–74. [Google Scholar] [CrossRef] [Green Version]
- Kim, J.; Weber, J.A.; Jho, S.; Jang, J.; Jun, J.; Cho, Y.S.; Kim, H.M.; Kim, H.; Kim, Y.; Chung, O.; et al. KoVariome: Korean National Standard Reference Variome database of whole genomes with comprehensive SNV, indel, CNV, and SV analyses. Sci. Rep. 2018, 8, 5677. [Google Scholar] [CrossRef] [PubMed] [Green Version]
- Jones, P.; Lucock, M.; Chaplin, G.; Jablonski, N.G.; Veysey, M.; Scarlett, C.; Beckett, E. Distribution of variants in multiple vitamin D-related loci (DHCR7/NADSYN1, GC, CYP2R1, CYP11A1, CYP24A1, VDR, RXRalpha and RXRgamma) vary between European, East-Asian and Sub-Saharan African-ancestry populations. Genes Nutr. 2020, 15, 5. [Google Scholar] [CrossRef] [PubMed] [Green Version]
- Choi, H.S. Vitamin d status in Korea. Endocrinol. Metab. 2013, 28, 12–16. [Google Scholar] [CrossRef] [PubMed] [Green Version]
- Eloi, M.; Horvath, D.V.; Szejnfeld, V.L.; Ortega, J.C.; Rocha, D.A.; Szejnfeld, J.; Castro, C.H. Vitamin D deficiency and seasonal variation over the years in Sao Paulo, Brazil. Osteoporos. Int. 2016, 27, 3449–3456. [Google Scholar] [CrossRef]
- Cashman, K.D.; Dowling, K.G.; Skrabakova, Z.; Kiely, M.; Lamberg-Allardt, C.; Durazo-Arvizu, R.A.; Sempos, C.T.; Koskinen, S.; Lundqvist, A.; Sundvall, J.; et al. Standardizing serum 25-hydroxyvitamin D data from four Nordic population samples using the Vitamin D Standardization Program protocols: Shedding new light on vitamin D status in Nordic individuals. Scand. J. Clin. Lab. Investig. 2015, 75, 549–561. [Google Scholar] [CrossRef]
- Nakamura, K.; Kitamura, K.; Takachi, R.; Saito, T.; Kobayashi, R.; Oshiki, R.; Watanabe, Y.; Tsugane, S.; Sasaki, A.; Yamazaki, O. Impact of demographic, environmental, and lifestyle factors on vitamin D sufficiency in 9084 Japanese adults. Bone 2015, 74, 10–17. [Google Scholar] [CrossRef]
- Chailurkit, L.O.; Aekplakorn, W.; Ongphiphadhanakul, B. Regional variation and determinants of vitamin D status in sunshine-abundant Thailand. BMC Public Health 2011, 11, 853. [Google Scholar] [CrossRef] [Green Version]
- Luxwolda, M.F.; Kuipers, R.S.; Kema, I.P.; van der Veer, E.; Dijck-Brouwer, D.A.; Muskiet, F.A. Vitamin D status indicators in indigenous populations in East Africa. Eur. J. Nutr. 2013, 52, 1115–1125. [Google Scholar] [CrossRef]
- Amrein, K.; Scherkl, M.; Hoffmann, M.; Neuwersch-Sommeregger, S.; Kostenberger, M.; Tmava Berisha, A.; Martucci, G.; Pilz, S.; Malle, O. Vitamin D deficiency 2.0: An update on the current status worldwide. Eur. J. Clin. Nutr. 2020, 74, 1498–1513. [Google Scholar] [CrossRef] [PubMed]
- Batai, K.; Cui, Z.; Arora, A.; Shah-Williams, E.; Hernandez, W.; Ruden, M.; Hollowell, C.M.P.; Hooker, S.E.; Bathina, M.; Murphy, A.B.; et al. Genetic loci associated with skin pigmentation in African Americans and their effects on vitamin D deficiency. PLoS Genet. 2021, 17, e1009319. [Google Scholar] [CrossRef]
- Ju, D.; Mathieson, I. The evolution of skin pigmentation-associated variation in West Eurasia. Proc. Natl. Acad. Sci. USA 2021, 118. [Google Scholar] [CrossRef] [PubMed]
- Carlberg, C. Nutrigenomics of Vitamin D. Nutrients 2019, 11, 676. [Google Scholar] [CrossRef] [PubMed] [Green Version]
- Hanel, A.; Carlberg, C. Skin colour and vitamin D: An update. Exp. Dermatol. 2020, 29, 864–875. [Google Scholar] [CrossRef]
- Cashman, K.D. Vitamin D Deficiency: Defining, Prevalence, Causes, and Strategies of Addressing. Calcif. Tissue Int. 2020, 106, 14–29. [Google Scholar] [CrossRef]
- Sarafin, K.; Durazo-Arvizu, R.; Tian, L.; Phinney, K.W.; Tai, S.; Camara, J.E.; Merkel, J.; Green, E.; Sempos, C.T.; Brooks, S.P. Standardizing 25-hydroxyvitamin D values from the Canadian Health Measures Survey. Am. J. Clin. Nutr. 2015, 102, 1044–1050. [Google Scholar] [CrossRef] [PubMed] [Green Version]
- Cashman, K.D.; Dowling, K.G.; Skrabakova, Z.; Gonzalez-Gross, M.; Valtuena, J.; De Henauw, S.; Moreno, L.; Damsgaard, C.T.; Michaelsen, K.F.; Molgaard, C.; et al. Vitamin D deficiency in Europe: Pandemic? Am. J. Clin. Nutr. 2016, 103, 1033–1044. [Google Scholar] [CrossRef] [Green Version]
- Lips, P.; de Jongh, R.T. Vitamin D deficiency in immigrants. Bone Rep. 2018, 9, 37–41. [Google Scholar] [CrossRef]
- van der Meer, I.M.; Middelkoop, B.J.; Boeke, A.J.; Lips, P. Prevalence of vitamin D deficiency among Turkish, Moroccan, Indian and sub-Sahara African populations in Europe and their countries of origin: An overview. Osteoporos. Int. 2011, 22, 1009–1021. [Google Scholar] [CrossRef] [Green Version]
- Batai, K.; Murphy, A.B.; Shah, E.; Ruden, M.; Newsome, J.; Agate, S.; Dixon, M.A.; Chen, H.Y.; Deane, L.A.; Hollowell, C.M.; et al. Common vitamin D pathway gene variants reveal contrasting effects on serum vitamin D levels in African Americans and European Americans. Hum. Genet. 2014, 133, 1395–1405. [Google Scholar] [CrossRef] [PubMed] [Green Version]
- Mogire, R.M.; Mutua, A.; Kimita, W.; Kamau, A.; Bejon, P.; Pettifor, J.M.; Adeyemo, A.; Williams, T.N.; Atkinson, S.H. Prevalence of vitamin D deficiency in Africa: A systematic review and meta-analysis. Lancet Glob. Health 2020, 8, e134–e142. [Google Scholar] [CrossRef] [Green Version]
- Petrenya, N.; Lamberg-Allardt, C.; Melhus, M.; Broderstad, A.R.; Brustad, M. Vitamin D status in a multi-ethnic population of northern Norway: The SAMINOR 2 Clinical Survey. Public Health Nutr. 2020, 23, 1186–1200. [Google Scholar] [CrossRef] [PubMed] [Green Version]


| SNP ID | Chr a | Position | MAPPED_GENE | Function | Ref Allele b | Alt Allele c | Global EAF d | AMR e EAF | AMR log10 P | AFR f EAF | AFR log10 P | EAS g EAF | EAS log10 P | SAS h EAF | SAS log10 P | EUR i EAF | EUR log10 P | KOR k EAF | KOR log10 P |
|---|---|---|---|---|---|---|---|---|---|---|---|---|---|---|---|---|---|---|---|
| rs2131925 | chr1 | 63025942 | DOCK7 | intron_variant | G | T | 0.56 | 0.61 | 1.61 | 0.31 | −58.18 | 0.77 | 35.67 | 0.53 | −0.97 | 0.69 | 13.25 | 0.785 | 102.29 |
| rs10908454 | chr1 | 155066416 | EFNA3-AL691442.1 | TF_binding_site_variant | G | A | 0.55 | 0.64 | 4.64 | 0.31 | −53.75 | 0.91 | 116.71 | 0.51 | −1.48 | 0.48 | −3.99 | 0.919 | 312.61 |
| rs11264322 | chr1 | 155087933 | EFNA3-AL691442.1 | intergenic_variant | G | A | 0.54 | 0.61 | 2.91 | 0.3 | −53.97 | 0.91 | 122.04 | 0.5 | −1.51 | 0.45 | −6.28 | 0.919 | 312.61 |
| rs11264360 | chr1 | 155284586 | FDPS | intron_variant | T | A | 0.35 | 0.3 | −1.79 | 0.2 | −25.83 | 0.7 | 91.61 | 0.3 | −2.46 | 0.27 | −5.79 | 0.638 | 149.83 |
| rs11264361 | chr1 | 155289545 | FDPS, RUSC1-AS1 | non_coding_transcript_exon_variant | T | G | 0.35 | 0.3 | −1.79 | 0.21 | −22.25 | 0.71 | 96.83 | 0.31 | −1.66 | 0.26 | −7.22 | 0.801 | 312.61 |
| rs10908465 | chr1 | 155389688 | ASH1L | intron_variant | C | T | 0.34 | 0.31 | −0.75 | 0.14 | −48.92 | 0.71 | 102.27 | 0.31 | −1.04 | 0.28 | −3.40 | 0.811 | 312.61 |
| rs562338 | chr2 | 21288321 | APOB-AC010872.2 | intergenic_variant | A | G | 0.73 | 0.82 | 6.07 | 0.35 | −138.10 | 0.98 | 91.24 | 0.87 | 21.07 | 0.8 | 5.29 | 0.995 | 311.61 |
| rs541041 | chr2 | 21294975 | APOB-AC010872.2 | intergenic_variant | G | A | 0.75 | 0.82 | 3.96 | 0.4 | −119.94 | 0.99 | 93.79 | 0.88 | 19.24 | 0.8 | 3.04 | 0.995 | 282.11 |
| rs6782190 | chr3 | 85639672 | CADM2 | intron_variant | G | A | 0.65 | 0.73 | 4.16 | 0.37 | −73.11 | 0.94 | 91.71 | 0.64 | −0.23 | 0.65 | 0.00 | 0.936 | 231.64 |
| rs200641845 | chr4 | 72620895 | GC | intron_variant | T | A | 0.42 | 0.43 | 0.14 | 0.34 | −6.80 | 0.45 | 1.03 | 0.47 | 2.24 | 0.45 | 1.02 | 0.080 | −285.57 |
| rs1607741 | chr4 | 72719033 | AC068721.1-NPFFR2 | intergenic_variant | G | C | 0.58 | 0.72 | 11.29 | 0.49 | −8.10 | 0.42 | −19.40 | 0.61 | 0.98 | 0.73 | 18.02 | 0.338 | −106.15 |
| rs1614377 | chr4 | 100279332 | ADH1B-ADH7 | intergenic_variant | G | A | 0.15 | 0.17 | 0.61 | 0.095 | −6.69 | 0.026 | −33.64 | 0.18 | 1.55 | 0.31 | 28.74 | 0.012 | −125.88 |
| rs12642639 | chr4 | 100301241 | ADH1B-ADH7 | intergenic_variant | C | A | 0.38 | 0.14 | −37.19 | 0.34 | −2.07 | 0.65 | 54.04 | 0.51 | 12.56 | 0.21 | −24.90 | 0.825 | 312.61 |
| rs10070734 | chr5 | 87940026 | LINC00461 | intron_variant | T | C | 0.5 | 0.46 | −1.12 | 0.46 | −1.92 | 0.25 | −48.15 | 0.61 | 9.11 | 0.71 | 33.25 | 0.217 | −155.96 |
| rs31612 | chr5 | 108996643 | KRT18P42-AC012603.1 | intergenic_variant | T | C | 0.32 | 0.28 | −1.27 | 0.12 | −51.58 | 0.61 | 63.57 | 0.46 | 15.17 | 0.18 | −18.77 | 0.654 | 201.59 |
| rs804280 | chr8 | 11612698 | GATA4, GATA4 | intron_variant | C | A | 0.73 | 0.69 | −1.31 | 0.6 | −18.48 | 0.99 | 103.54 | 0.87 | 21.07 | 0.56 | −24.11 | 0.975 | 231.56 |
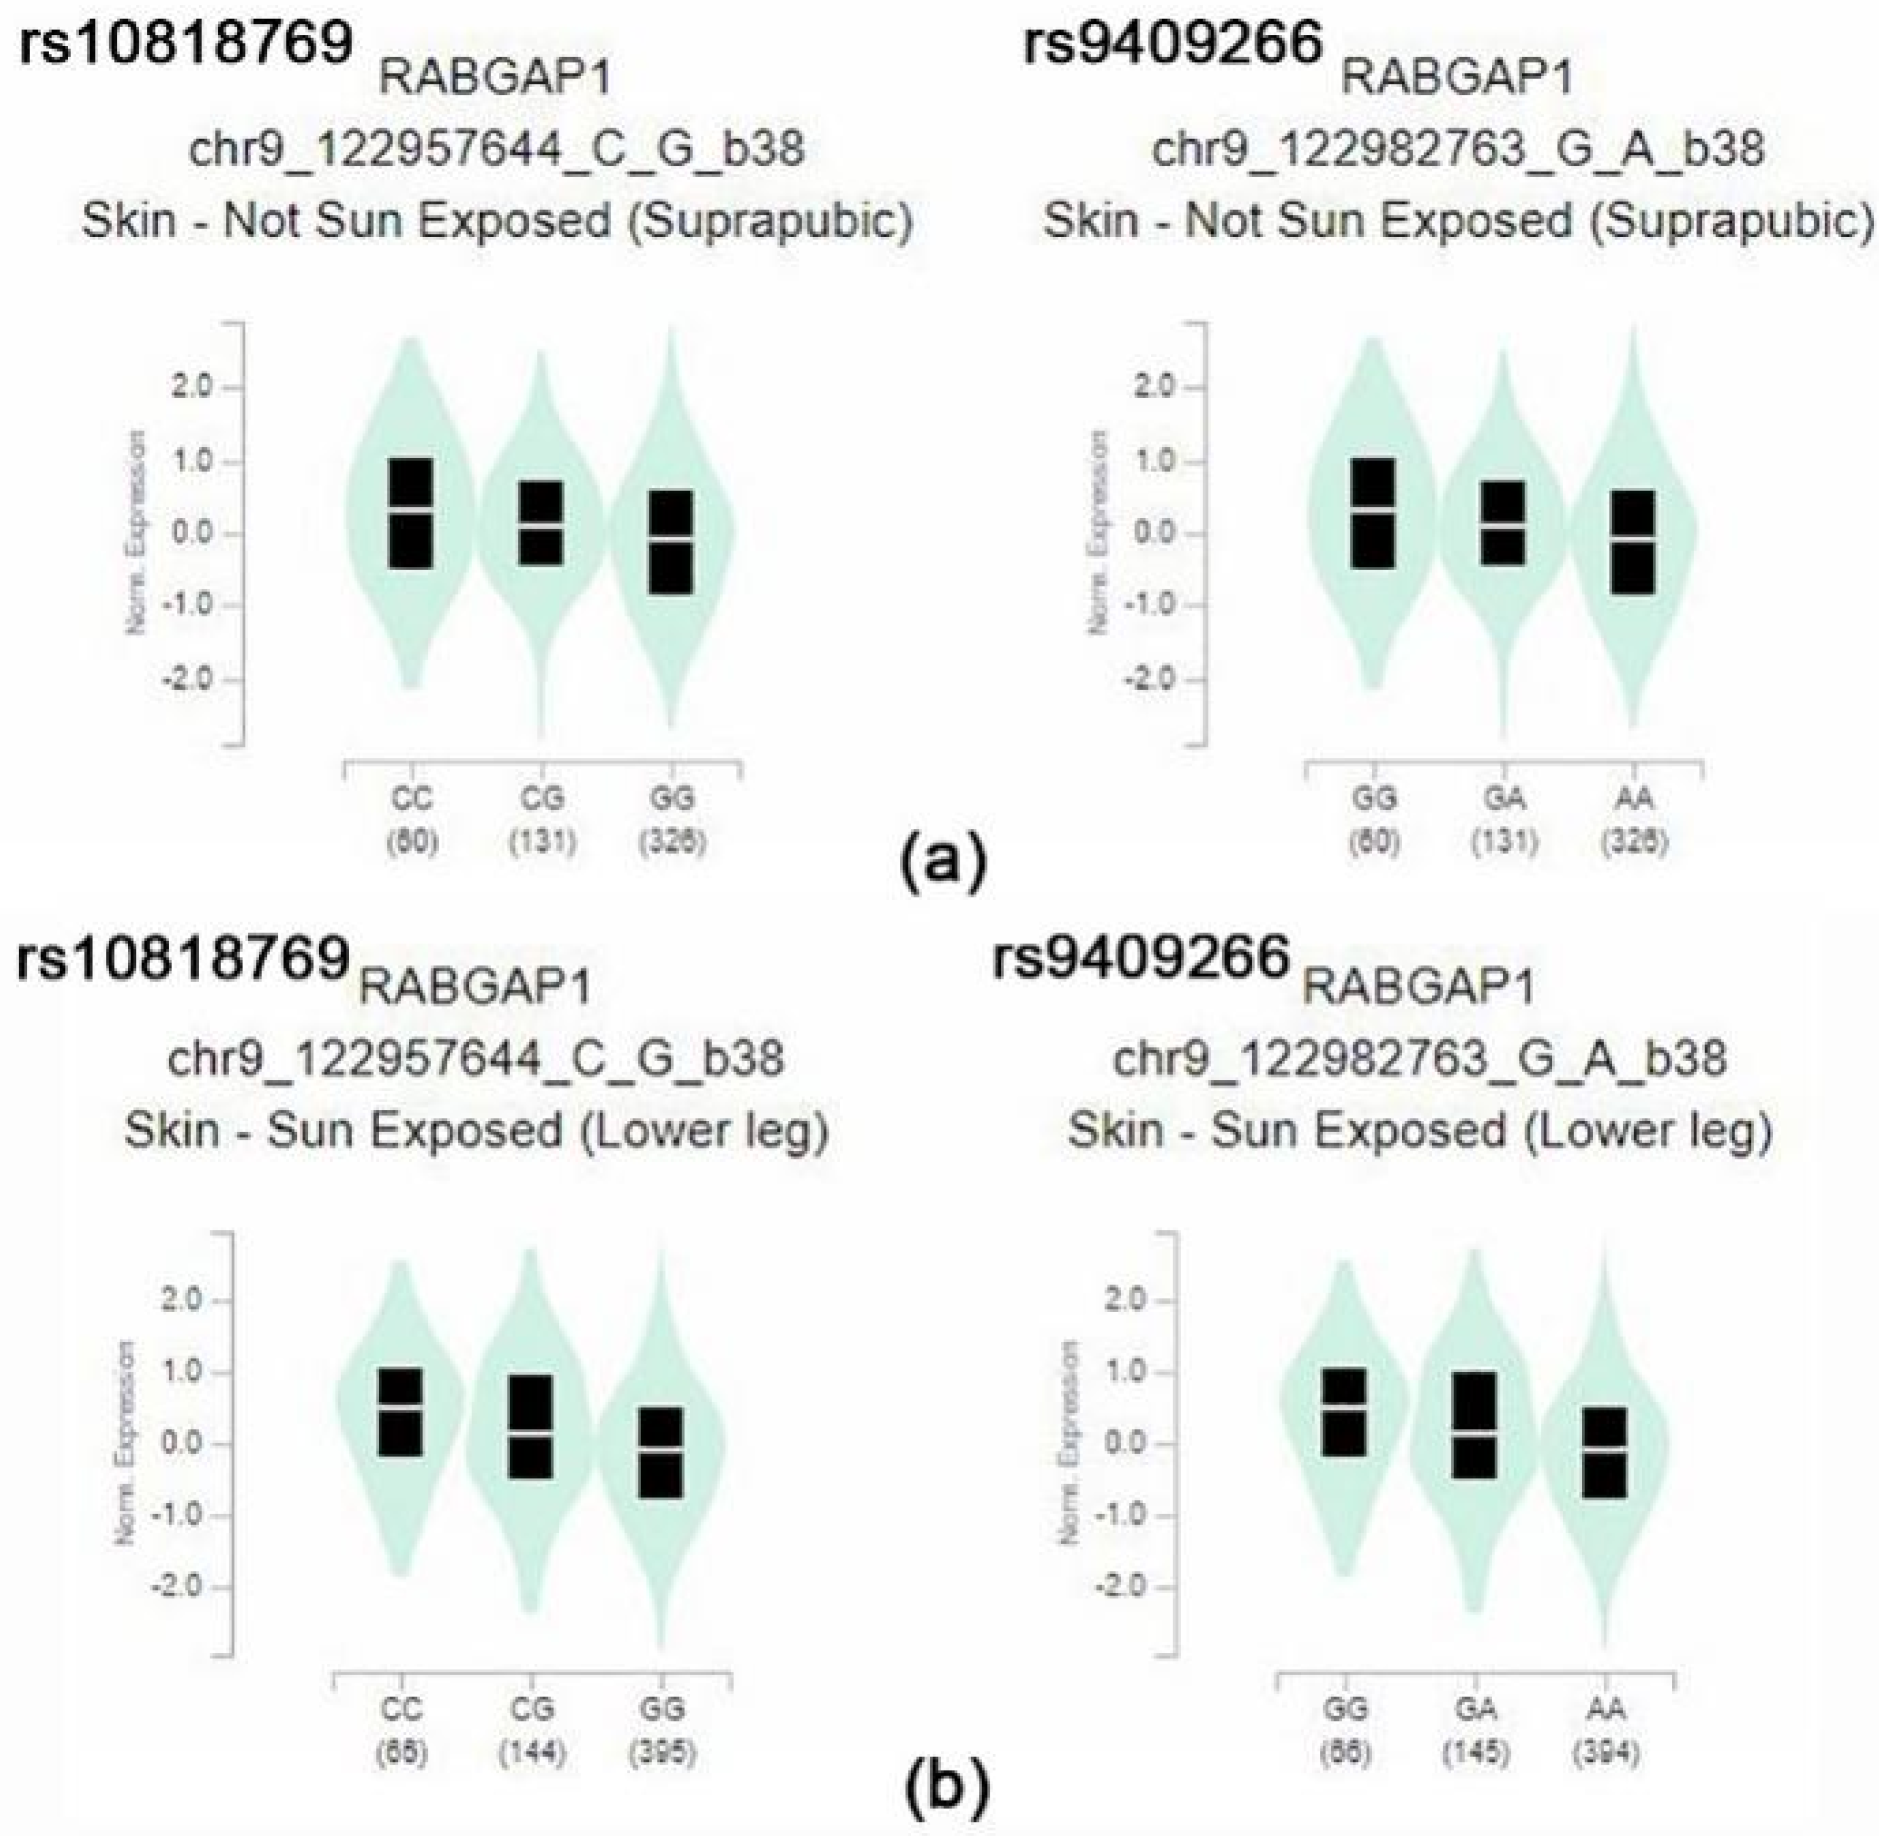
| rs10818769 | chr9 | 125719923 | RABGAP1 | intron_variant | C | G | 0.49 | 0.58 | 4.58 | 0.071 | −197.61 | 0.31 | −24.91 | 0.83 | 89.25 | 0.85 | 104.26 | 0.260 | −100.85 |
| rs9409266 | chr9 | 125745042 | RABGAP1 | intron_variant | G | A | 0.49 | 0.58 | 4.58 | 0.07 | −198.46 | 0.31 | −24.91 | 0.83 | 89.25 | 0.85 | 104.26 | 0.260 | −101.09 |
| rs10887718 | chr10 | 82042624 | MAT1A | intron_variant | C | T | 0.66 | 0.67 | 0.16 | 0.41 | −58.77 | 0.97 | 114.96 | 0.76 | 8.79 | 0.54 | −11.52 | 0.979 | 312.61 |
| rs12411742 | chr10 | 82042782 | MAT1A | intron_variant | G | A | 0.66 | 0.67 | 0.16 | 0.41 | −58.77 | 0.97 | 114.96 | 0.76 | 8.79 | 0.54 | −11.52 | 0.979 | 312.61 |
| rs1620013 | chr11 | 71089210 | SHANK2-AP002387.1 | intergenic_variant | C | T | 0.48 | 0.45 | −0.72 | 0.45 | −1.21 | 0.66 | 24.42 | 0.53 | 2.16 | 0.3 | −24.67 | 0.717 | 104.75 |
| rs1396206 | chr12 | 24576859 | SOX5 | intron_variant | A | T | 0.7 | 0.67 | −0.78 | 0.67 | −1.37 | 0.97 | 94.88 | 0.61 | −6.85 | 0.58 | −12.07 | 0.967 | 245.87 |
| rs12881545 | chr14 | 101176212 | AL132711.1-DLK1 | TF_binding_site_variant | G | C | 0.26 | 0.38 | 9.25 | 0.029 | −97.30 | 0.0069 | −103.17 | 0.35 | 7.30 | 0.65 | 116.98 | 0.000 | −286.57 |
| rs17765311 | chr15 | 63789952 | AC007950.1-AC007950.2 | regulatory_region_variant | A | C | 0.16 | 0.2 | 1.80 | 0.016 | −58.56 | 0.001 | −65.52 | 0.26 | 11.55 | 0.4 | 57.06 | 0.003 | −174.20 |
| rs55829990 | chr15 | 63790642 | AC007950.1-AC007950.2 | intergenic_variant | T | C | 0.16 | 0.2 | 1.80 | 0.019 | −54.99 | 0.002 | −63.59 | 0.26 | 11.55 | 0.4 | 57.06 | 0.003 | −174.20 |
| rs28607847 | chr15 | 66284913 | MEGF11 | intron_variant | G | A | 0.38 | 0.22 | −15.36 | 0.36 | −0.69 | 0.62 | 42.80 | 0.38 | 0.00 | 0.29 | −6.89 | 0.668 | 149.95 |
| rs3814995 | chr19 | 36342212 | NPHS1 | missense_variant | C | T | 0.29 | 0.34 | 1.85 | 0.056 | −84.87 | 0.6 | 74.07 | 0.24 | −2.58 | 0.31 | 0.62 | 0.587 | 162.75 |
| rs6123359 | chr20 | 52714706 | BCAS1-CYP24A1 | regulatory_region_variant | A | G | 0.21 | 0.1 | −11.63 | 0.083 | −28.70 | 0.55 | 96.31 | 0.22 | 0.27 | 0.11 | −13.14 | 0.511 | 180.25 |
| rs960596 | chr22 | 41393520 | RBX1-AL080243.3 | intergenic_variant | C | T | 0.27 | 0.2 | −3.71 | 0.026 | −107.11 | 0.43 | 21.65 | 0.38 | 10.42 | 0.35 | 5.99 | 0.508 | 108.51 |
Publisher’s Note: MDPI stays neutral with regard to jurisdictional claims in published maps and institutional affiliations. |
© 2021 by the authors. Licensee MDPI, Basel, Switzerland. This article is an open access article distributed under the terms and conditions of the Creative Commons Attribution (CC BY) license (https://creativecommons.org/licenses/by/4.0/).
Share and Cite
Yoon, B.-W.; Shin, H.-T.; Seo, J. Risk Allele Frequency Analysis of Single-Nucleotide Polymorphisms for Vitamin D Concentrations in Different Ethnic Group. Genes 2021, 12, 1530. https://doi.org/10.3390/genes12101530
Yoon B-W, Shin H-T, Seo J. Risk Allele Frequency Analysis of Single-Nucleotide Polymorphisms for Vitamin D Concentrations in Different Ethnic Group. Genes. 2021; 12(10):1530. https://doi.org/10.3390/genes12101530
Chicago/Turabian StyleYoon, Byung-Woo, Hyun-Tae Shin, and Jehyun Seo. 2021. "Risk Allele Frequency Analysis of Single-Nucleotide Polymorphisms for Vitamin D Concentrations in Different Ethnic Group" Genes 12, no. 10: 1530. https://doi.org/10.3390/genes12101530
APA StyleYoon, B.-W., Shin, H.-T., & Seo, J. (2021). Risk Allele Frequency Analysis of Single-Nucleotide Polymorphisms for Vitamin D Concentrations in Different Ethnic Group. Genes, 12(10), 1530. https://doi.org/10.3390/genes12101530