
Major Depressive Disorder and Lifestyle: Correlated Genetic Effects in Extended Twin Pedigrees

 , ,
, ,
Abstract
:
1. Introduction
2. Materials and Methods
2.1. Participants and Procedures
2.2. Phenotypic Measures
2.3. Genetic Analyses
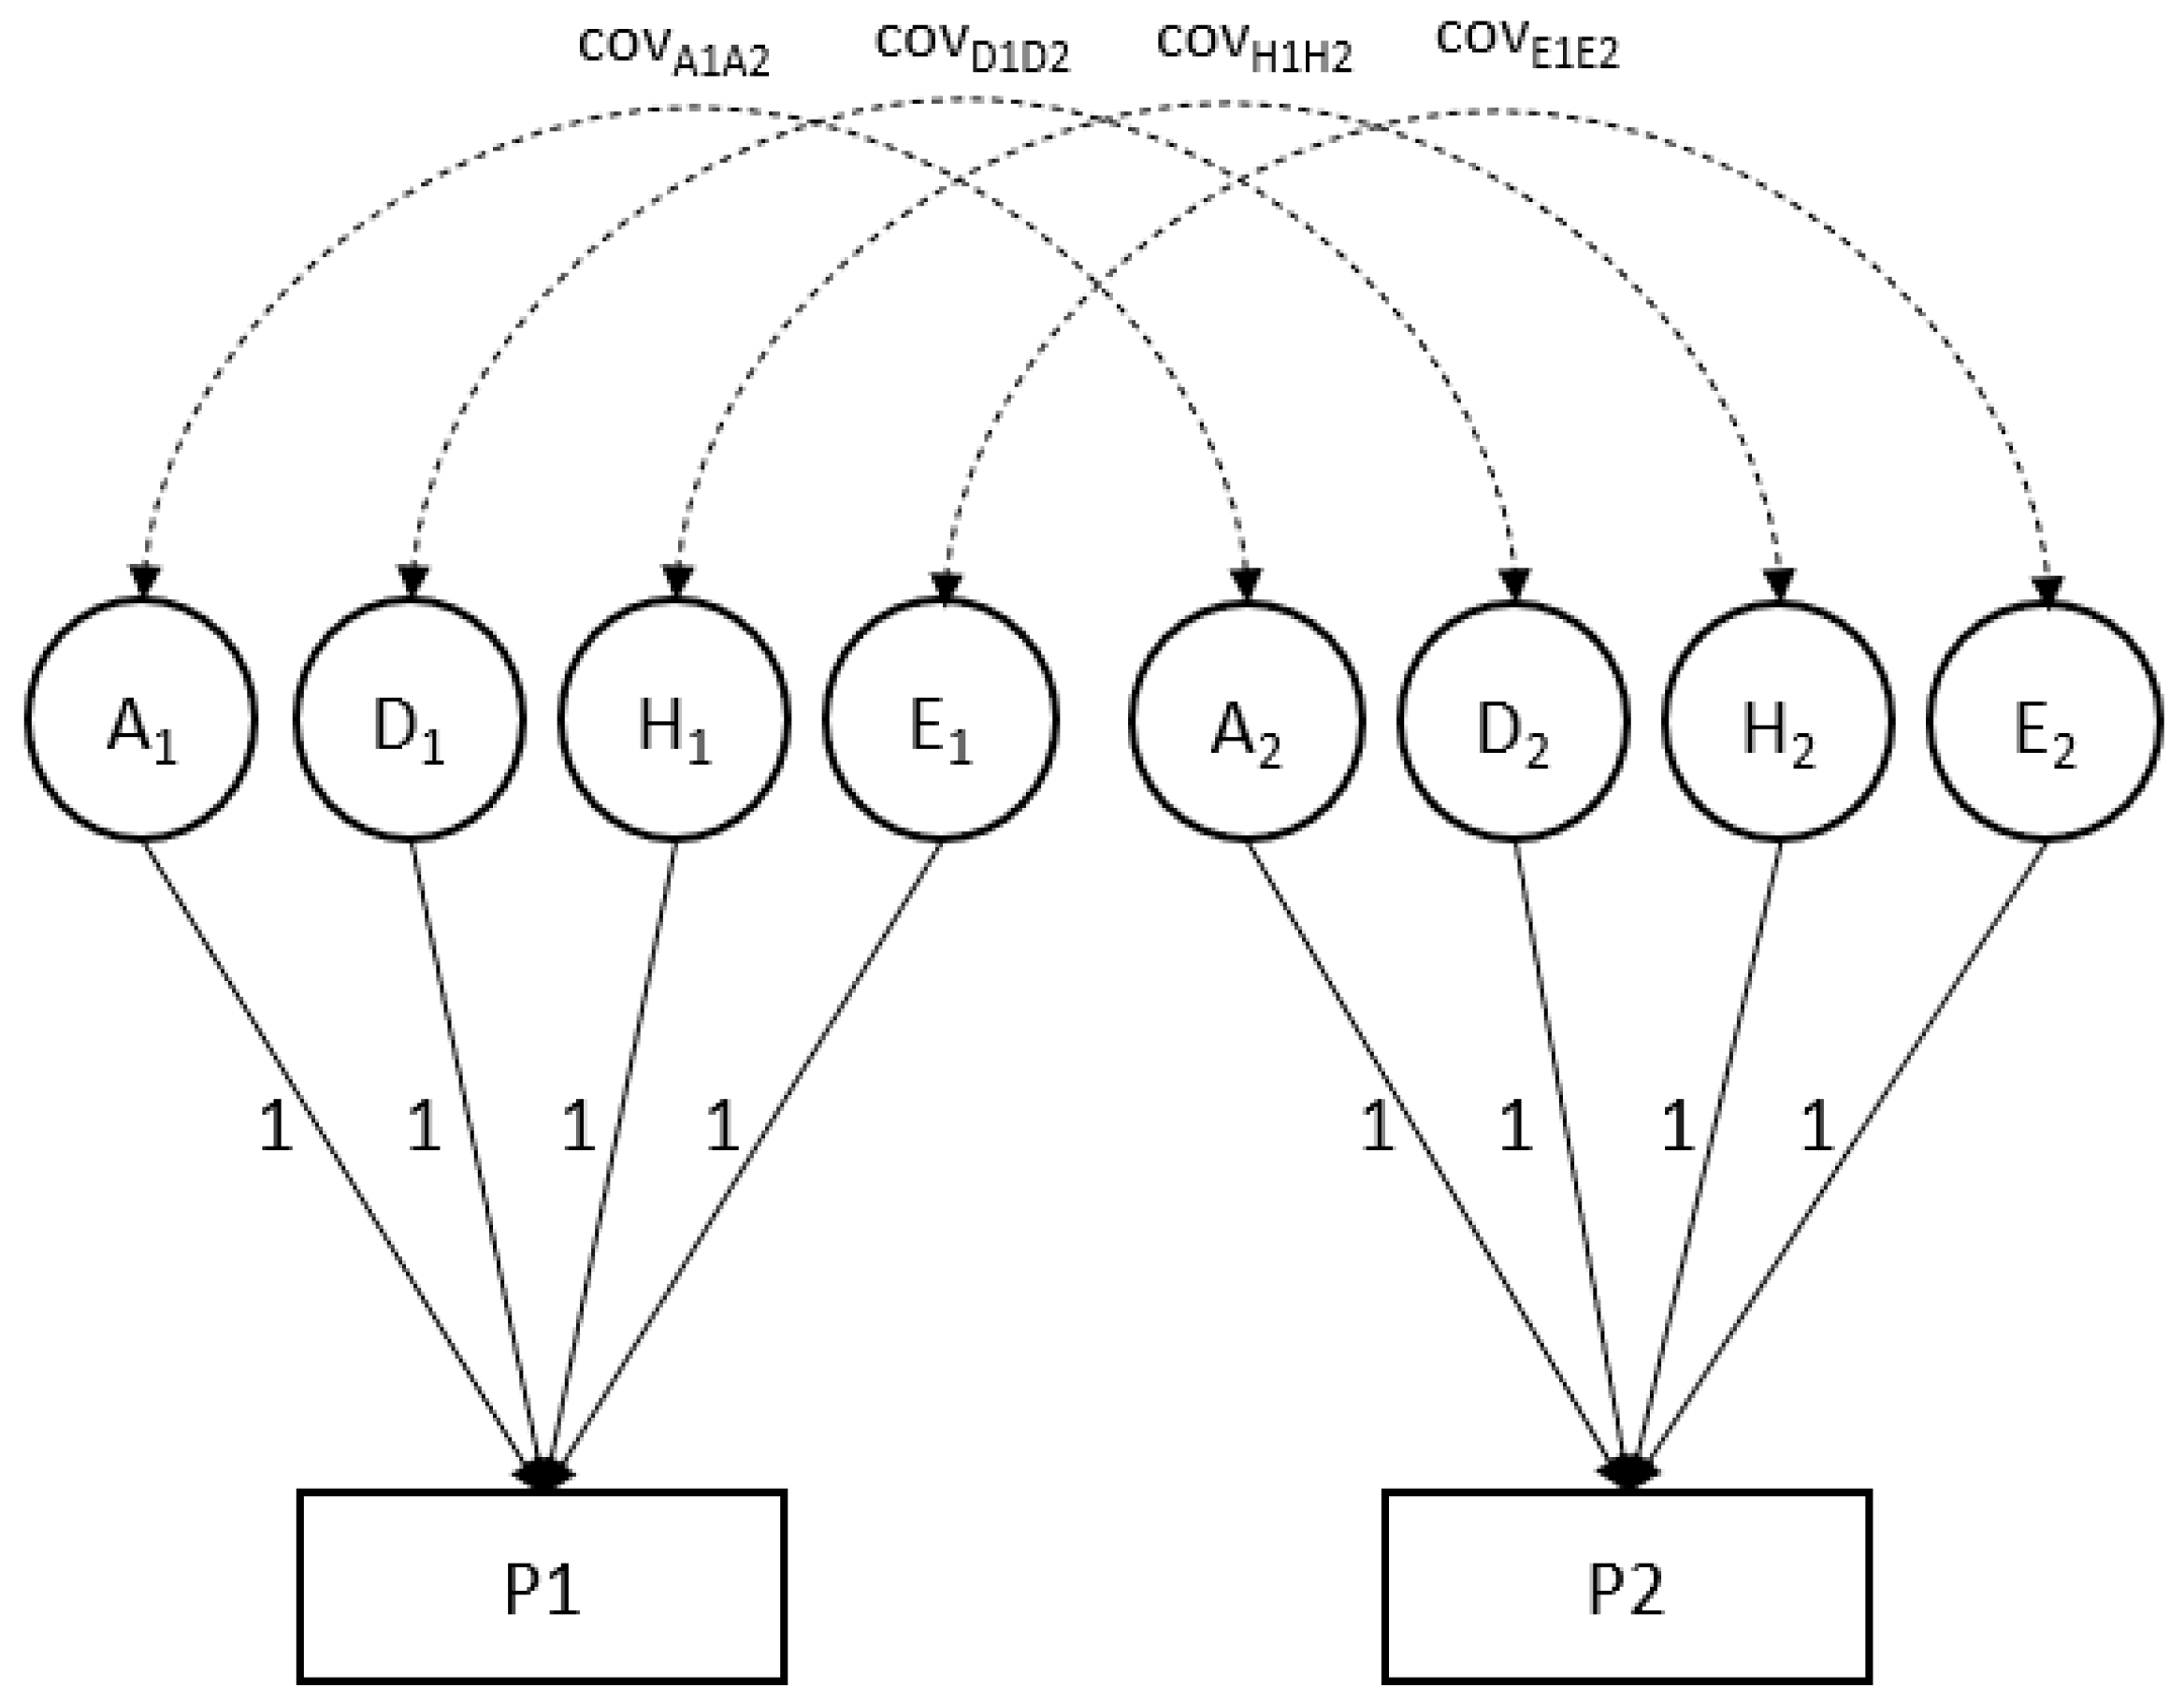
| The bivariate model represented for an individual for two phenotypes (P1 and P2): |
| P1 = G1 + NG1 = A1+ D1 + H1 + E1 |
| P2 = G2 + NG2 = A2+ D2 + H2 + E2 |
| Var (P1) = Var(G1) + Var (NG1) |
| Var (P2) = Var(G2) + Var (NG2) |
| Broad-sense heritability (P1) = Var(G1)/Var (P1) = H2 |
| Narrow-sense heritability (P1) = Var(A1)/Var (P1) = h2 |
| Covar (P1, P2) = Covar (G1, G2) + Covar (NG1, NG2) |
| Phenotypic correlation: r (P1, P2) = Covar (P1, P2)/SD(P1) × SD(P2) |
| Genetic correlation: r (G1, G2) = Covar (G1, G2)/SD(G1) × SD(G2); |
| where P is an individual’s phenotypic value (possibly a residual after correction for fixed effects of, e.g., age and sex), G is genotypic value and NG stands for non-genetic value. Var(P) is the variance of the phenotype (or the phenotypic residual); var(G) and var(NG) stand for genetic and non-genetic variance components (assuming no covariance of G and NG). G can be decomposed into additive genetic (A) and non-additive (dominance; D) values; non-genetic influences can be distinguished into those that are common to members from the same household (called household effects (H) in Mendel) and all other (unique; E) environmental effects. |
| The covariance between two phenotypes, here labeled P1 and P2 (e.g., MDD and smoking) likewise can be decomposed into genetic and non-genetic covariance. The correlation of P1 and P2 is obtained by scaling the phenotypic covariance by the product of the standard deviations of P1 and P2. Likewise, the genetic correlation is obtained by dividing the genetic covariance by the standard deviations of G1 and G2. |
3. Results
3.1. Phenotypic Overview
3.2. Kinship Correlations
3.3. Variance Component Analyses
4. Discussion
5. Conclusions
Author Contributions
Funding
Institutional Review Board Statement
Informed Consent Statement
Data Availability Statement
Acknowledgments
Conflicts of Interest
References
- Klein, D.N.; Riso, L.P. Psychiatric disorders: Problems of boundaries and comorbidity. In Basic Issues in Psychopathology; Guilford Press: New York, NY, USA, 1993; pp. 19–66. [Google Scholar]
- Neale, M.C.; Kendler, K.S. Models of comorbidity for multifactorial disorders. Am. J. Hum. Genet. 1995, 57, 935–953. [Google Scholar] [PubMed]
- Middeldorp, C.M.; Cath, D.C.; Van Dyck, R.; Boomsma, D.I. The co-morbidity of anxiety and depression in the perspective of genetic epidemiology. A review of twin and family studies. Psychol. Med. 1999, 35, 611–624. [Google Scholar] [CrossRef] [PubMed]
- Falconer, D.S.; Mackay, T.F. Introduction to Quantitative Genetics, 4th ed.; Longman: Harlow, UK, 1996. [Google Scholar]
- Solovieff, N.; Cotsapas, C.; Lee, P.H.; Purcell, S.M.; Smoller, J.W. Pleiotropy in complex traits: Challenges and strategies. Nat. Rev. Genet. 2013, 14, 483. [Google Scholar] [CrossRef] [PubMed] [Green Version]
- Visscher, P.M.; Yang, J. A plethora of pleiotropy across complex traits. Nat. Genet. 2016, 48, 707–708. [Google Scholar] [CrossRef]
- Watanabe, K.; Stringer, S.; Frei, O.; Mirkov, M.U.; de Leeuw, C.; Polderman, T.J.C.; van der Sluis, S.; Andreassen, O.A.; Neale, B.M.; Posthuma, D. A global overview of pleiotropy and genetic architecture in complex traits. Nat. Genet. 2019, 51, 1339–1348. [Google Scholar] [CrossRef]
- Smoller, J.W.; Andreassen, O.A.; Edenberg, H.J.; Faraone, S.V.; Glatt, S.J.; Kendler, K.S. Psychiatric genetics and the structure of psychopathology. Mol. Psychiatry 2019, 24, 409–420. [Google Scholar] [CrossRef]
- Van Rheenen, W.; Peyrot, W.J.; Schork, A.J.; Lee, S.H.; Wray, N.R. Genetic correlations of polygenic disease traits: From theory to practice. Nat. Rev. Genet. 2019, 20, 567–581. [Google Scholar] [CrossRef]
- The Brainstorm Consortium; Anttila, V.; Bulik-Sullivan, B.; Finucane, H.K.; Walters, R.K.; Bras, J.; Duncan, L.; Escott-Price, V.; Falcone, G.J.; Gormley, P.; et al. Analysis of shared heritability in common disorders of the brain. Science 2018, 360, eaap8757. [Google Scholar] [CrossRef] [Green Version]
- Visscher, P.M.; Hill, W.G.; Wray, N.R. Heritability in the genomics era—Concepts and misconceptions. Nat. Rev. Genet. 2008, 9, 255–266. [Google Scholar] [CrossRef]
- Eaves, L.; Heath, A.; Martin, N.; Maes, H.; Neale, M.; Kendler, K.; Kirk, K.; Corey, L. Comparing the biological and cultural inheritance of personality and social attitudes in the Virginia 30,000 study of twins and their relatives. Twin Res. Hum. Genet. 1999, 2, 62–80. [Google Scholar] [CrossRef] [Green Version]
- Maes, H.H.; Neale, M.C.; Martin, N.; Heath, A.C.; Eaves, L.J. Religious attendance and frequency of alcohol use: Same genes or same environments: A bivariate extended twin kinship model. Twin Res. Hum. Genet. 1999, 2, 169–179. [Google Scholar] [CrossRef]
- Kendall, K.M.; Van Assche, E.; Andlauer, T.F.M.; Choi, K.W.; Luykx, J.J.; Schulte, E.C.; Lu, Y. The genetic basis of major depression. Psychol. Med. 2021, 1–14. [Google Scholar] [CrossRef] [PubMed]
- Malhi, G.S.; Mann, J.J. Depression. Lancet 2018, 392, 2299–2312. [Google Scholar] [CrossRef]
- Fluharty, M.; Taylor, A.E.; Grabski, M.; Munafo, M. The Association of Cigarette Smoking with Depression and Anxiety: A Systematic Review. Nicotine Tob. Res. 2017, 19, 3–13. [Google Scholar] [CrossRef] [PubMed]
- de Geus, E.J. A genetic perspective on the association between exercise and mental health in the era of genome-wide association studies. Ment. Heal. Phys. Act. 2021, 20, 100378. [Google Scholar] [CrossRef]
- Milaneschi, Y.; Simmons, W.K.; Van Rossum, E.F.C.; Penninx, B.W. Depression and obesity: Evidence of shared biological mechanisms. Mol. Psychiatry 2019, 24, 18–33. [Google Scholar] [CrossRef] [PubMed]
- Cook, B.L.; Wayne, G.F.; Kafali, E.N.; Liu, Z.; Shu, C.; Flores, M. Trends in Smoking Among Adults with Mental Illness and Association Between Mental Health Treatment and Smoking Cessation. JAMA 2014, 311, 172–182. [Google Scholar] [CrossRef] [Green Version]
- Mathew, A.R.; Hogarth, L.; Leventhal, A.M.; Cook, J.W.; Hitsman, B. Cigarette smoking and depression comorbidity: Systematic review and proposed theoretical model. Addiction 2016, 112, 401–412. [Google Scholar] [CrossRef] [Green Version]
- Korhonen, T.; Broms, U.; Varjonen, J.; Romanov, K.; Koskenvuo, M.; Kinnunen, T.; Kaprio, J. Smoking behaviour as a predictor of depression among Finnish men and women: A prospective cohort study of adult twins. Psychol. Med. 2006, 37, 705–715. [Google Scholar] [CrossRef]
- Pasco, J.A.; Williams, L.; Jacka, F.N.; Ng, F.; Henry, A.P.M.J.; Nicholson, G.; Kotowicz, M.; Berk, M. Tobacco smoking as a risk factor for major depressive disorder: Population-based study. Br. J. Psychiatry 2008, 193, 322–326. [Google Scholar] [CrossRef]
- Berlin, I.; Covey, L.S.; Glassman, A.H. Smoking and Depression: A Co-morbidity. J. Dual Diagn. 2009, 5, 149–158. [Google Scholar] [CrossRef]
- Teychenne, M.; Ball, K.; Salmon, J. Physical activity and likelihood of depression in adults: A review. Prev. Med. 2008, 46, 397–411. [Google Scholar] [CrossRef]
- Lindwall, M.; Gerber, M.; Jonsdottir, I.H.; Börjesson, M.; Ahlborg, G. The relationships of change in physical activity with change in depression, anxiety, and burnout: A longitudinal study of Swedish healthcare workers. Health Psychol. 2014, 33, 1309–1318. [Google Scholar] [CrossRef]
- Choi, K.W.; Zheutlin, A.B.; Karlson, R.A.; Wang, M.; Dunn, E.C.; Stein, M.B.; Karlson, E.W.; Smoller, J.W. Physical activity offsets genetic risk for incident depression assessed via electronic health records in a biobank cohort study. Depress. Anxiety 2020, 37, 106–114. [Google Scholar] [CrossRef]
- Jia, H.; Zack, M.M.; Gottesman, I.I.; Thompson, W.W. Associations of Smoking, Physical Inactivity, Heavy Drinking, and Obesity with Quality-Adjusted Life Expectancy among US Adults with Depression. Value Health 2018, 21, 364–371. [Google Scholar] [CrossRef] [Green Version]
- Achttien, R.; Van Lieshout, J.; Wensing, M.; Van Der Sanden, M.N.; Staal, J.B. Symptoms of depression are associated with physical inactivity but not modified by gender or the presence of a cardiovascular disease; a cross-sectional study. BMC Cardiovasc. Disord. 2019, 19, 95. [Google Scholar] [CrossRef]
- Dennison, C.A.; Legge, S.E.; Bracher-Smith, M.; Menzies, G.; Escott-Price, V.; Smith, D.J.; Doherty, A.R.; Owen, M.J.; O’Donovan, M.C.; Walters, J.T.R. Association of genetic liability for psychiatric disorders with accelerometer-assessed physical activity in the UK Biobank. PLoS ONE 2021, 16, e0249189. [Google Scholar] [CrossRef]
- Xu, Q.; Anderson, D.; Lurie-Beck, J. The relationship between abdominal obesity and depression in the general population: A systematic review and meta-analysis. Obes. Res. Clin. Pract. 2011, 5, e267–e278. [Google Scholar] [CrossRef] [PubMed] [Green Version]
- Pereira-Miranda, E.; Costa, P.R.; Queiroz, V.A.; Pereira-Santos, M.; Santana, M.L.P. Overweight and Obesity Associated with Higher Depression Prevalence in Adults: A Systematic Review and Meta-Analysis. J. Am. Coll. Nutr. 2017, 36, 223–233. [Google Scholar] [CrossRef] [PubMed]
- Luppino, F.S.; de Wit, L.; Bouvy, P.F.; Stijnen, T.; Cuijpers, P.; Penninx, B.W.J.H.; Zitman, F.G. Overweight, Obesity, and Depression: A Systematic Review and Meta-analysis of Longitudinal Studies. Arch. Gen. Psychiatry 2010, 67, 220–229. [Google Scholar] [CrossRef] [PubMed]
- Mannan, M.; Mamun, A.; Doi, S.; Clavarino, A. Prospective Associations between Depression and Obesity for Adolescent Males and Females- A Systematic Review and Meta-Analysis of Longitudinal Studies. PLoS ONE 2016, 11, e0157240. [Google Scholar] [CrossRef] [PubMed]
- Mannan, M.; Mamun, A.; Doi, S.; Clavarino, A. Is there a bi-directional relationship between depression and obesity among adult men and women? Systematic review and bias-adjusted meta analysis. Asian J. Psychiatry 2016, 21, 51–66. [Google Scholar] [CrossRef] [PubMed] [Green Version]
- Ligthart, L.; van Beijsterveldt, T.; Kevenaar, S.T.; de Zeeuw, E.; van Bergen, E.; Bruins, S.; Pool, R.; Helmer, Q.; van Dongen, J.; Hottenga, J.-J.; et al. The Netherlands Twin Register: Longitudinal Research Based on Twin and Twin-Family Designs. Twin Res. Hum. Genet. 2019, 22, 623–636. [Google Scholar] [CrossRef] [PubMed] [Green Version]
- Bot, M.; Middeldorp, C.; de Geus, E.; Lau, H.M.; Sinke, S.M.; Van Nieuwenhuizen, B.; Smit, J.H.; Boomsma, D.I.; Penninx, B.W.J.H. Validity of LIDAS (LIfetime Depression Assessment Self-report): A self-report online assessment of lifetime major depressive disorder. Psychol. Med. 2016, 47, 279–289. [Google Scholar] [CrossRef]
- Boomsma, D.I.; Helmer, Q.; Nieuwboer, H.A.; Hottenga, J.J.; de Moor, M.; Berg, S.V.D.; Davies, G.E.; Vink, J.M.; Schouten, M.J.; Dolan, C.V.; et al. An Extended Twin-Pedigree Study of Neuroticism in the Netherlands Twin Register. Behav. Genet. 2018, 48, 1–11. [Google Scholar] [CrossRef]
- Kessler, R.C.; Andrews, G.; Mroczek, D.; Ustun, B.; Wittchen, H.-U. The World Health Organization Composite International Diagnostic Interview short-form (CIDI-SF). Int. J. Methods Psychiatr. Res. 1998, 7, 171–185. [Google Scholar] [CrossRef]
- American Psychiatric Association. Diagnostic and Statistical Manual of Mental Disorders (DSM-5 (R.)); Psychiatric Association Publishing: Arlington, VA, USA, 2013. [Google Scholar]
- Van Der Zee, M.D.; Helmer, Q.; Boomsma, D.I.; Dolan, C.V.; de Geus, E. An Extended Twin-Pedigree Study of Different Classes of Voluntary Exercise Behavior. Behav. Genet. 2020, 50, 94–104. [Google Scholar] [CrossRef] [Green Version]
- Lange, K.; Papp, J.C.; Sinsheimer, J.S.; Sripracha, R.; Zhou, H.; Sobel, E.M. Mendel: The Swiss army knife of genetic analysis programs. Bioinformatics 2013, 29, 1568–1570. [Google Scholar] [CrossRef] [Green Version]
- Lange, K.; Weeks, D.; Boehnke, M.; MacCluer, J.W. Programs for pedigree analysis: Mendel, Fisher, and dGene: Letters to the Editor. Genet. Epidemiol. 1988, 5, 471–472. [Google Scholar] [CrossRef] [PubMed] [Green Version]
- Hopper, J. Review papers: Variance components for statistical genetics: Applications in medical research to characteristics related to human diseases and health. Stat. Methods Med. Res. 1993, 2, 199–223. [Google Scholar] [CrossRef] [PubMed]
- Fisher, R.A. XV—The Correlation between Relatives on the Supposition of Mendelian Inheritance: The Correlation between Relatives on the Supposition of Mendelian Inheritance. Trans. R. Soc. Edinb. 1919, 52, 399–433. [Google Scholar] [CrossRef] [Green Version]
- Eisenhart, C. The Assumptions Underlying the Analysis of Variance. Biometrics 1947, 3, 1. [Google Scholar] [CrossRef]
- Weiss, K.M. Genetic Variation and Human Disease: Principles and Evolutionary Approaches; Cambridge University Press: Cambridge, UK, 1993. [Google Scholar]
- Galván-Femenía, I.; Barceló-Vidal, C.; Sumoy, L.; Moreno, V.; de Cid, R.; Graffelman, J. A likelihood ratio approach for identifying three-quarter siblings in genetic databases. Heredity 2021, 126, 537–547. [Google Scholar] [CrossRef]
- Statistics|Eurostat. Estimated Average Age of Young People Leaving the Parental Household by Sex. Available online: https://ec.europa.eu/eurostat/databrowser/view/yth_demo_030/default/table?lang=en (accessed on 26 May 2021).
- Cohen, J.; Cohen, P.; West, S.G.; Aiken, L.S. Applied Multiple Regression/Correlation Analysis for the Behavioral Sciences; Routledge: London, UK, 2013. [Google Scholar]
- Fedko, I.O.; Hottenga, J.-J.; Helmer, Q.; Mbarek, H.; Huider, F.; Amin, N.; Beulens, J.W.; Bremmer, M.A.; Elders, P.J.; Galesloot, T.E.; et al. Measurement and genetic architecture of lifetime depression in the Netherlands as assessed by LIDAS (Lifetime Depression Assessment Self-report). Psychol. Med. 2021, 51, 1345–1354. [Google Scholar] [CrossRef] [Green Version]
- Sullivan, P.F.; Neale, M.C.; Kendler, K.S. Genetic Epidemiology of Major Depression: Review and Meta-Analysis. Am. J. Psychiatry 2000, 157, 1552–1562. [Google Scholar] [CrossRef]
- Polderman, T.; Benyamin, B.; de Leeuw, C.; Sullivan, P.F.; Van Bochoven, A.; Visscher, P.; Posthuma, D. Meta-analysis of the heritability of human traits based on fifty years of twin studies. Nat. Genet. 2015, 47, 702–709. [Google Scholar] [CrossRef] [PubMed] [Green Version]
- Wray, N.R. Using summary data from the Danish National Registers to estimate heritabilities for schizophrenia, bipolar disorder, and major depressive disorder. Front. Genet. 2012, 3, 118. [Google Scholar] [CrossRef] [PubMed] [Green Version]
- Polubriaginof, F.C.; Vanguri, R.; Quinnies, K.; Belbin, G.M.; Yahi, A.; Salmasian, H.; Lorberbaum, T.; Nwankwo, V.; Li, L.; Shervey, M.M.; et al. Disease Heritability Inferred from Familial Relationships Reported in Medical Records. Cell 2018, 173, 1692–1704. [Google Scholar] [CrossRef] [PubMed] [Green Version]
- Howard, D.M.; Adams, M.J.; Clarke, T.-K.; Hafferty, J.D.; Gibson, J.; Shirali, M.; Coleman, J.R.I.; Hagenaars, S.P.; Ward, J.; Wigmore, E.M.; et al. Genome-wide meta-analysis of depression identifies 102 independent variants and highlights the importance of the prefrontal brain regions. Nat. Neurosci. 2019, 22, 343–352. [Google Scholar] [CrossRef] [PubMed] [Green Version]
- Yang, J.; Zeng, J.; Goddard, M.; Wray, N.R.; Visscher, P.M. Concepts, estimation and interpretation of SNP-based heritability. Nat. Genet. 2017, 49, 1304–1310. [Google Scholar] [CrossRef] [PubMed] [Green Version]
- Li-Gao, R.; Boomsma, D.I.; de Geus, E.J.C.; Denollet, J.; Kupper, N. The Heritability of Type D Personality by an Extended Twin-Pedigree Analysis in the Netherlands Twin Register. Behav. Genet. 2021, 51, 1–11. [Google Scholar] [CrossRef]
- Coventry, W.L.; Keller, M.C. Estimating the Extent of Parameter Bias in the Classical Twin Design: A Comparison of Parameter Estimates from Extended Twin-Family and Classical Twin Designs. Twin Res. Hum. Genet. 2005, 8, 214–223. [Google Scholar] [CrossRef]
- Nivard, M.G.; Dolan, C.V.; Kendler, K.S.; Kan, K.-J.; Willemsen, G.; van Beijsterveldt, T.; Lindauer, R.J.L.; Van Beek, J.H.D.A.; Geels, L.M.; Bartels, M.; et al. Stability in symptoms of anxiety and depression as a function of genotype and environment: A longitudinal twin study from ages 3 to 63 years. Psychol. Med. 2015, 45, 1039–1049. [Google Scholar] [CrossRef] [PubMed] [Green Version]
- Kendler, K.S.; Neale, M.C.; MacLean, C.J.; Heath, A.C.; Eaves, L.J.; Kessler, R.C. Smoking and Major Depression: A Causal Analysis. Arch. Gen. Psychiatry 1993, 50, 36–43. [Google Scholar] [CrossRef] [PubMed]
- Breslau, N.; Johnson, E.O.; Rhee, S.H.; Chase, G.A. Comorbidity of depression with levels of smoking: An exploration of the shared familial risk hypothesis. Nicotine Tob. Res. 2004, 6, 1029–1038. [Google Scholar] [CrossRef]
- Dierker, L.C.; Avenevoli, S.; Stolar, M.; Merikangas, K. Smoking and Depression: An Examination of Mechanisms of Comorbidity. Am. J. Psychiatry 2002, 159, 947–953. [Google Scholar] [CrossRef] [PubMed] [Green Version]
- Lyons, M.; Hitsman, B.; Xian, H.; Panizzon, M.S.; Jerskey, B.A.; Santangelo, S.; Grant, M.D.; Rende, R.; Eisen, S.; Eaves, L.; et al. A twin study of smoking, nicotine dependence, and major depression in men. Nicotine Tob. Res. 2008, 10, 97–108. [Google Scholar] [CrossRef]
- McCaffery, J.M.; Niaura, R.; Swan, G.E.; Carmelli, D. A study of depressive symptoms and smoking behavior in adult male twins from the NHLBI twin study. Nicotine Tob. Res. 2003, 5, 77. [Google Scholar] [CrossRef]
- De Moor, M.H.M.; Boomsma, D.I.; Stubbe, J.H.; Willemsen, G.; De Geus, E.J.C. Testing Causality in the Association Between Regular Exercise and Symptoms of Anxiety and Depression. Arch. Gen. Psychiatry 2008, 65, 897–905. [Google Scholar] [CrossRef] [Green Version]
- Afari, N.; Noonan, C.; Goldberg, J.; Roy-Byrne, P.; Schur, E.; Golnari, G.; Buchwald, D. Depression and obesity: Do shared genes explain the relationship? Depress. Anxiety 2010, 27, 799–806. [Google Scholar] [CrossRef] [Green Version]
- Choy, W.C.; López-León, S.; Aulchenko, Y.S.; Mackenbach, J.P.; Oostra, B.A.; van Duijn, C.M.; Janssens, A.C.J. Role of shared genetic and environmental factors in symptoms of depression and body composition. Psychiatr. Genet. 2009, 19, 32–38. [Google Scholar] [CrossRef] [PubMed]
- Posthuma, D.; Boomsma, D.I. A Note on the Statistical Power in Extended Twin Designs. Behav. Genet. 2000, 30, 147–158. [Google Scholar] [CrossRef] [Green Version]
- Keller, M.C.; Medland, S.E.; Duncan, L.E. Are Extended Twin Family Designs Worth the Trouble? A Comparison of the Bias, Precision, and Accuracy of Parameters Estimated in Four Twin Family Models. Behav. Genet. 2010, 40, 377–393. [Google Scholar] [CrossRef] [PubMed] [Green Version]
- Choi, K.W.; Chen, C.-Y.; Stein, M.B.; Klimentidis, Y.; Wang, M.-J.; Koenen, K.C.; Smoller, J.W.; for the Major Depressive Disorder Working Group of the Psychiatric Genomics Consortium. Assessment of Bidirectional Relationships Between Physical Activity and Depression Among Adults: A 2-Sample Mendelian Randomization Study. JAMA Psychiatry 2019, 76, 399–408. [Google Scholar] [CrossRef]
- Hodgkin, J. Seven types of pleiotropy. Int. J. Dev. Biol. 1998, 42, 501–505. [Google Scholar]
- Paaby, A.; Rockman, M.V. The many faces of pleiotropy. Trends Genet. 2013, 29, 66–73. [Google Scholar] [CrossRef] [PubMed] [Green Version]
- Pickrell, J.K.; Berisa, T.; Liu, J.Z.; Ségurel, L.; Tung, J.Y.; Hinds, D.A. Detection and interpretation of shared genetic influences on 42 human traits. Nat. Genet. 2016, 48, 709–717. [Google Scholar] [CrossRef] [PubMed] [Green Version]
- Gratten, J.; Visscher, P. Genetic pleiotropy in complex traits and diseases: Implications for genomic medicine. Genome Med. 2016, 8, 1–3. [Google Scholar] [CrossRef] [Green Version]
- Baselmans, B.M.; Yengo, L.; van Rheenen, W.; Wray, N.R. Risk in Relatives, Heritability, SNP-Based Heritability, and Genetic Correlations in Psychiatric Disorders: A Review. Biol. Psychiatry 2021, 89, 11–19. [Google Scholar] [CrossRef] [PubMed]


| Pairing | Additive Genetic Sharing | Dominance Sharing |
|---|---|---|
| Monozygotic twins | 1 | 1 |
| Dizygotic twins and non-twin siblings | 0.5 | 0.25 |
| Three-quarter siblings | 0.375 | 0 |
| Half-siblings | 0.25 | 0 |
| Parent-offspring | 0.5 | 0 |
| Grandparent-grandchild | 0.25 | 0 |
| Aunt/uncle-niece/nephew | 0.25 | 0 |
| First cousins | 0.125 | 0 |
| First cousins with monozygotic twins as parents | 0.25 | 0 |
| Double first cousins | 0.25 | 0.0625 |
| Spouses | 0 | 0 |
| Age, Years | Sex | MDD | ||||
|---|---|---|---|---|---|---|
| N | Mean (SD) | Female | Male | Screened Control | Case | |
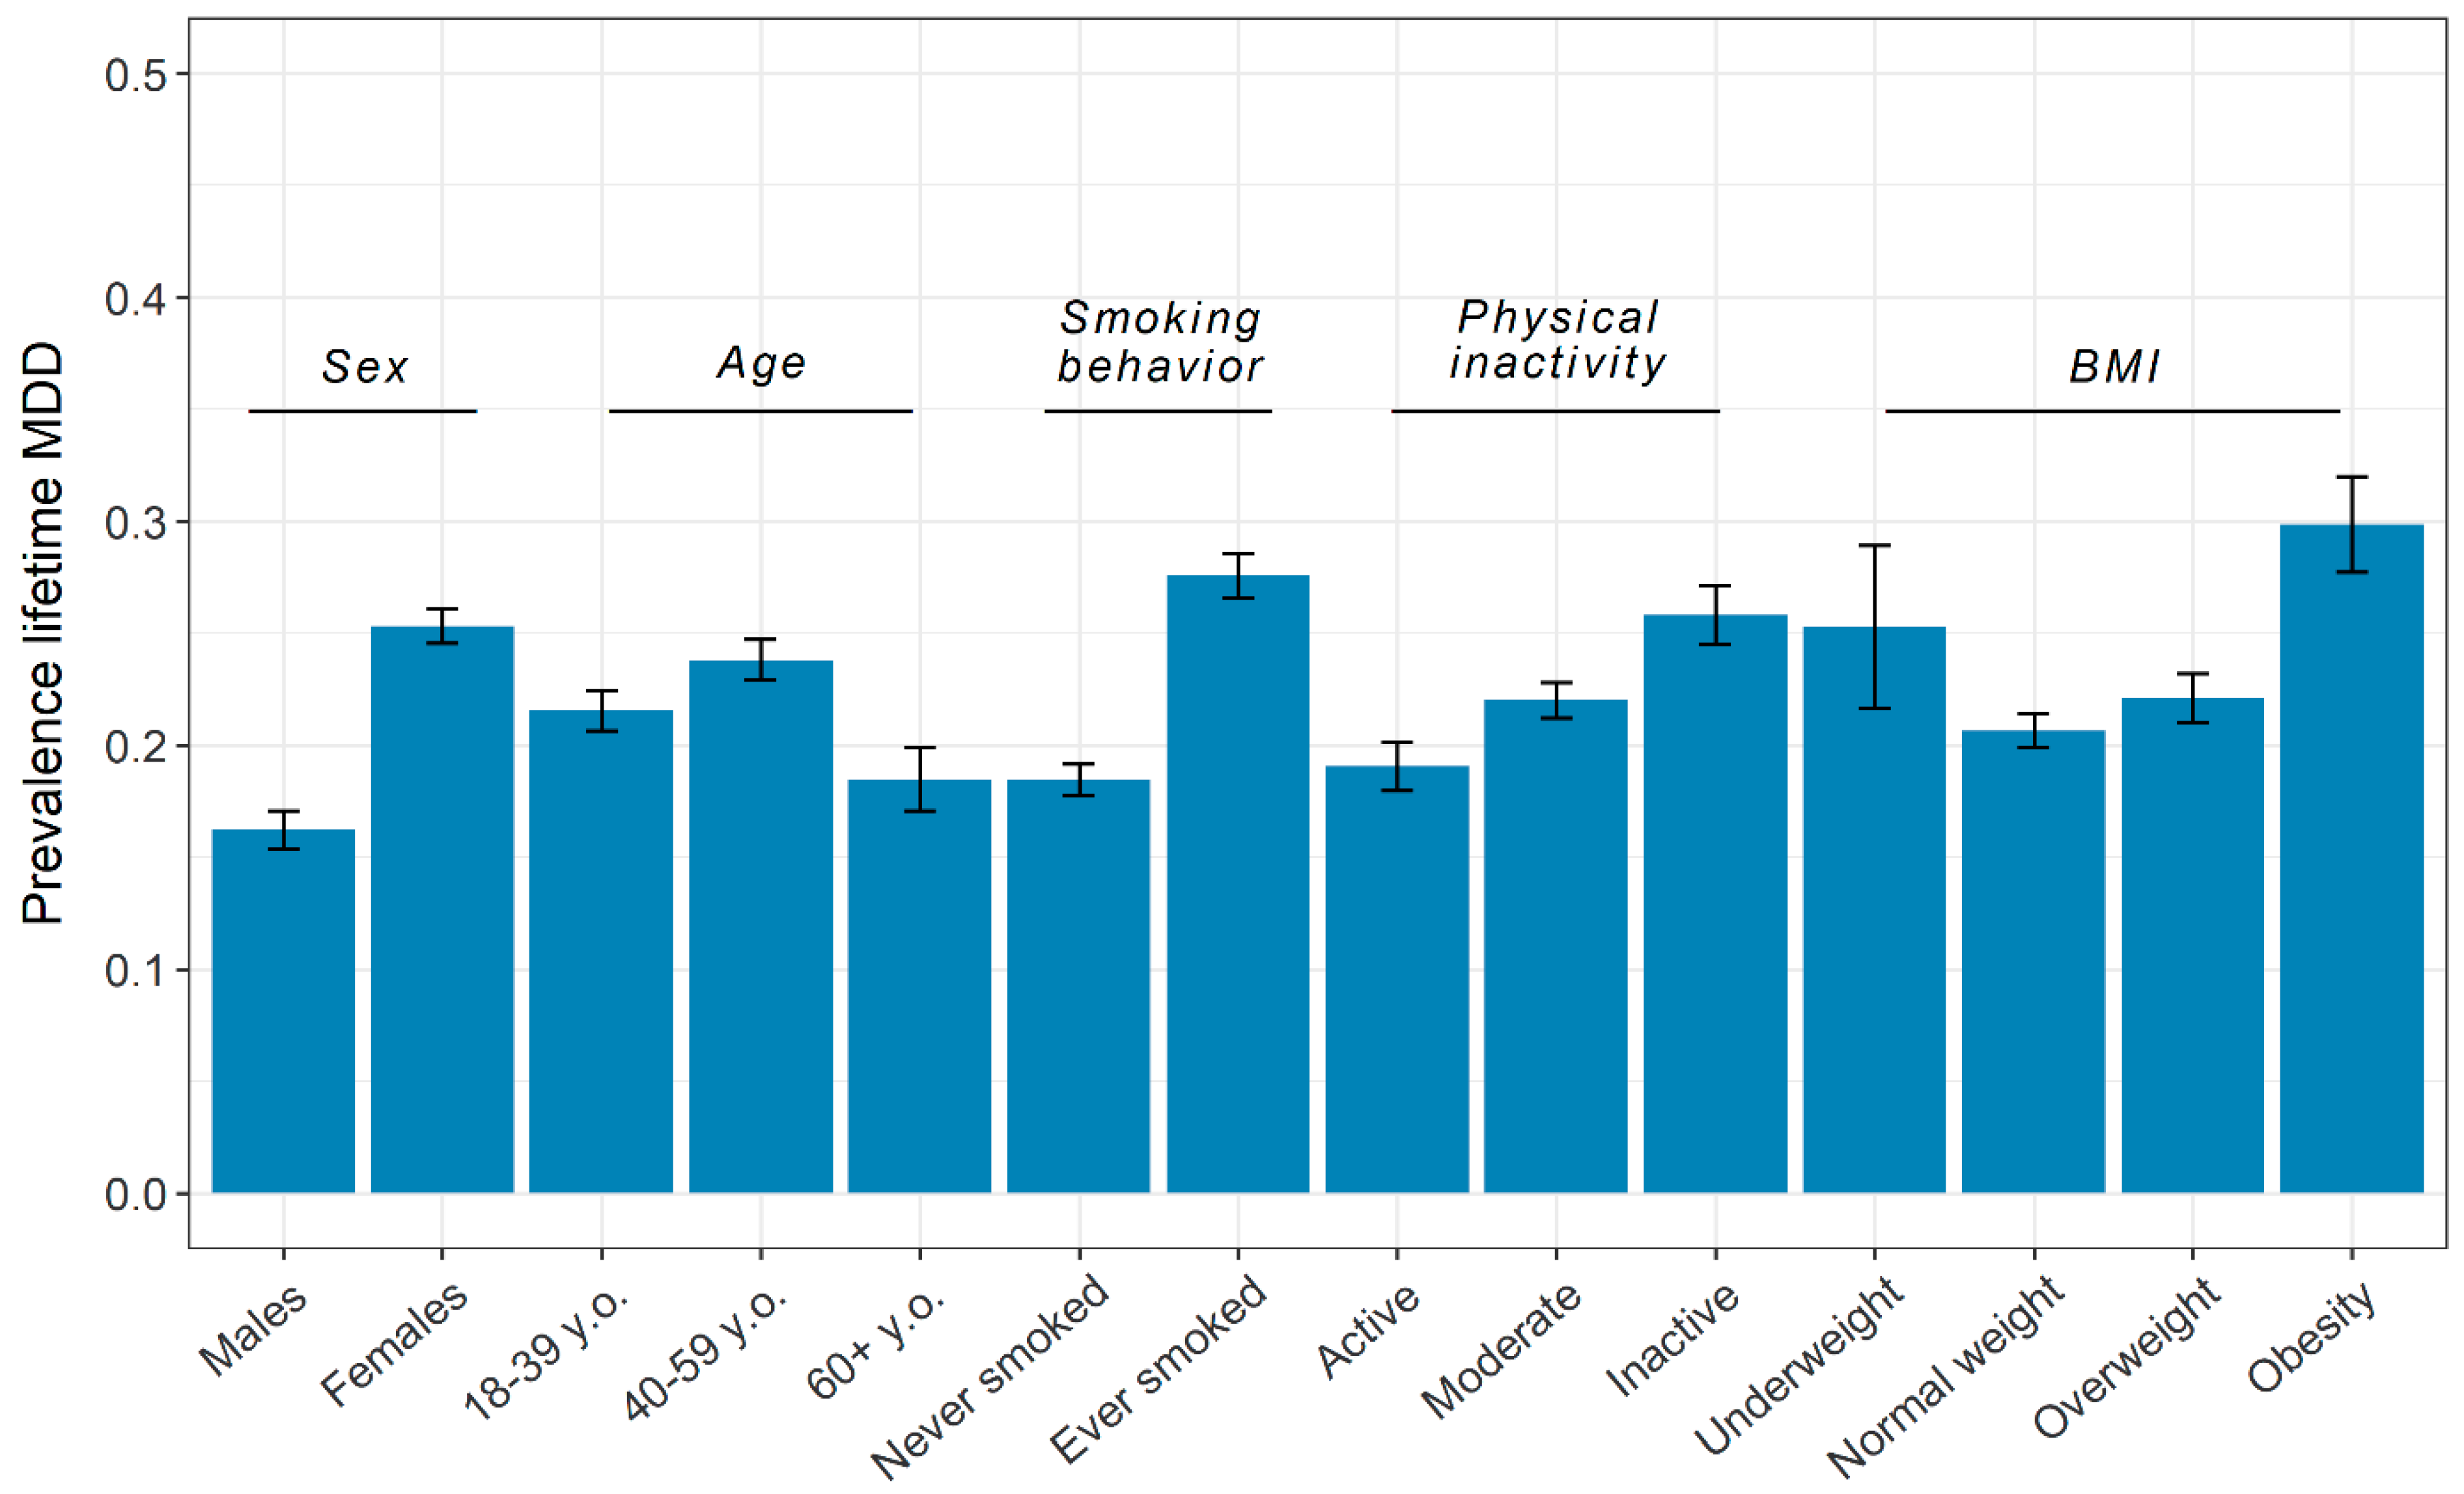
| Total | 19,496 | 41.75 (16.61) | 12,535 (64.3%) | 6961 (35.7%) | 15,196 | 4300 |
| MDD, N (%) | ||||||
| Screened control | 15,196 (77.9%) | 41.72 (16.93) | 9363 (74.7%) | 5833 (83.8%) | - | - |
| Case | 4300 (22.1%) | 41.82 (15.43) | 3172 (25.3%) | 1128 (16.2%) | - | - |
| Smoking behavior, N (%) | ||||||
| Never smoked | 11,760 (60.4%) | 37.76 (15.98) | 7860 (62.8%) | 3900 (56.1%) | 9588 (63.2%) | 2172 (50.5%) |
| Ever smoked | 7715 (39.6%) | 47.80 (15.70) | 4661 (37.2%) | 3054 (43.9%) | 5588 (36.8%) | 2127 (49.5%) |
| Physical inactivity, N (%) | ||||||
| Active | 5052 (25.9%) | 37.96 (17.06) | 2901 (23.2%) | 2151 (30.9%) | 4089 (26.9%) | 963 (22.4%) |
| Moderate | 10,220 (52.4%) | 42.53 (16.10) | 6760 (53.9%) | 3460 (49.7%) | 7971 (52.5%) | 2249 (52.3%) |
| Inactive | 4214 (21.6%) | 44.36 (16.52) | 2869 (22.9%) | 1345 (19.3%) | 3126 (20.6%) | 1088 (25.3%) |
| Body-mass index * | ||||||
| Underweight (<18.5) | 550 (2.8%) | 25.99 (12.46) | 393 (3.2%) | 157 (2.3%) | 411 (2.7%) | 139 (3.3%) |
| Normal weight (18.5–24.9) | 11,557 (59.8%) | 38.28 (16.51) | 7722 (62.2%) | 3855 (55.4%) | 9169 (60.8%) | 2388 (56.0%) |
| Overweight (25–29.9) | 5459 (28.2%) | 48.56 (14.55) | 3053 (24.6%) | 2406 (34.7%) | 4252 (28.2%) | 1207 (28.3%) |
| Obesity (≥30) | 1768 (9.1%) | 48.97 (13.28) | 1240 (10.0%) | 528 (7.6%) | 1240 (8.2%) | 528 (12.4%) |
| r (n) | r between MDD Relative 1; Lifestyle Relative 2 | r between Lifestyle Relative 1; MDD Relative 2 | |||||||||||
|---|---|---|---|---|---|---|---|---|---|---|---|---|---|
| Kinship | MDD | Smoking | PI | BMI | Obesity | Smoking | PI | BMI | Obesity | Smoking | PI | BMI | Obesity |
| Spouse (parents) | 0.050 (1570) | 0.259 (1563) | 0.167 (1568) | 0.185 (1556) | 0.096 (1556) | 0.009 | 0.023 | –0.004 | 0.001 | –0.004 | 0.021 | –0.018 | –0.020 |
| Spouse (twins) | 0.105 (386) | 0.227 (384) | 0.155 (384) | 0.272 (384) | 0.061 (384) | 0.047 | 0.017 | 0.014 | 0.065 | –0.048 | 0.025 | –0.107 | –0.094 |
| MZ males | 0.439 (342) | 0.505 (341) | 0.411 (342) | 0.726 (339) | 0.548 (339) | 0.085 | 0.008 | 0.003 | 0.034 | 0.164 | 0.031 | –0.051 | 0.001 |
| MZ females | 0.299 (986) | 0.561 (983) | 0.376 (984) | 0.764 (979) | 0.490 (979) | 0.132 | 0.043 | 0.019 | 0.036 | 0.132 | 0.051 | 0.045 | 0.054 |
| DZ males | 0.303 (195) | 0.260 (194) | 0.212 (194) | 0.224 (193) | –0.027 (193) | –0.006 | 0.097 | –0.022 | –0.094 | 0.152 | 0.048 | –0.053 | 0.130 |
| DZ females | 0.072 (410) | 0.246 (410) | 0.194 (409) | 0.293 (400) | 0.045 (400) | 0.064 | 0.047 | 0.034 | 0.027 | 0.046 | 0.112 | 0.005 | 0.002 |
| DZ opposite sex | 0.139 (450) | 0.223 (449) | 0.104 (449) | 0.299 (443) | 0.139 (443) | 0.057 | –0.016 | 0.060 | 0.112 | 0.119 | –0.012 | 0.022 | 0.013 |
| Mother-Daughter | 0.105 (2440) | 0.128 (2437) | 0.135 (2440) | 0.296 (2409) | 0.161 (2409) | –0.005 | 0.029 | 0.049 | 0.051 | 0.052 | 0.024 | 0.030 | 0.023 |
| Mother-Son | 0.092 (1324) | 0.173 (1322) | 0.039 (1324) | 0.205 (1314) | 0.092 (1314) | 0.042 | –0.007 | –0.040 | –0.027 | 0.035 | –0.014 | 0.002 | 0.003 |
| Father-Daughter | 0.111 (1700) | 0.113 (1699) | 0.148 (1699) | 0.229 (1680) | 0.134 (1680) | –0.012 | 0.017 | 0.031 | 0.053 | 0.022 | 0.065 | 0.010 | –0.011 |
| Father-Son | 0.103 (1007) | 0.201 (1007) | 0.110 (1007) | 0.253 (1001) | 0.086 (1001) | 0.077 | –0.004 | 0.0003 | –0.027 | –0.010 | 0.027 | –0.004 | 0.017 |
| Brother-Brother | 0.235 (202) | 0.307 (201) | 0.238 (201) | 0.315 (197) | 0.112 (197) | –0.041 | –0.026 | 0.025 | –0.025 | 0.158 | 0.130 | 0.016 | 0.157 |
| Brother-Sister | 0.143 (1128) | 0.176 (1127) | 0.080 (1126) | 0.256 (1120) | 0.121 (1120) | –0.010 | 0.020 | 0.066 | 0.077 | 0.089 | 0.031 | 0.015 | –0.031 |
| Sister-Sister | 0.091 (579) | 0.296 (578) | 0.206 (578) | 0.334 (564) | 0.169 (564) | 0.131 | 0.058 | 0.015 | –0.019 | 0.072 | 0.088 | 0.041 | –0.028 |
| Model | N | Raw VC (se) | Standardized VC | ||||||
|---|---|---|---|---|---|---|---|---|---|
| A | D | H | E | A | D | H | E | ||
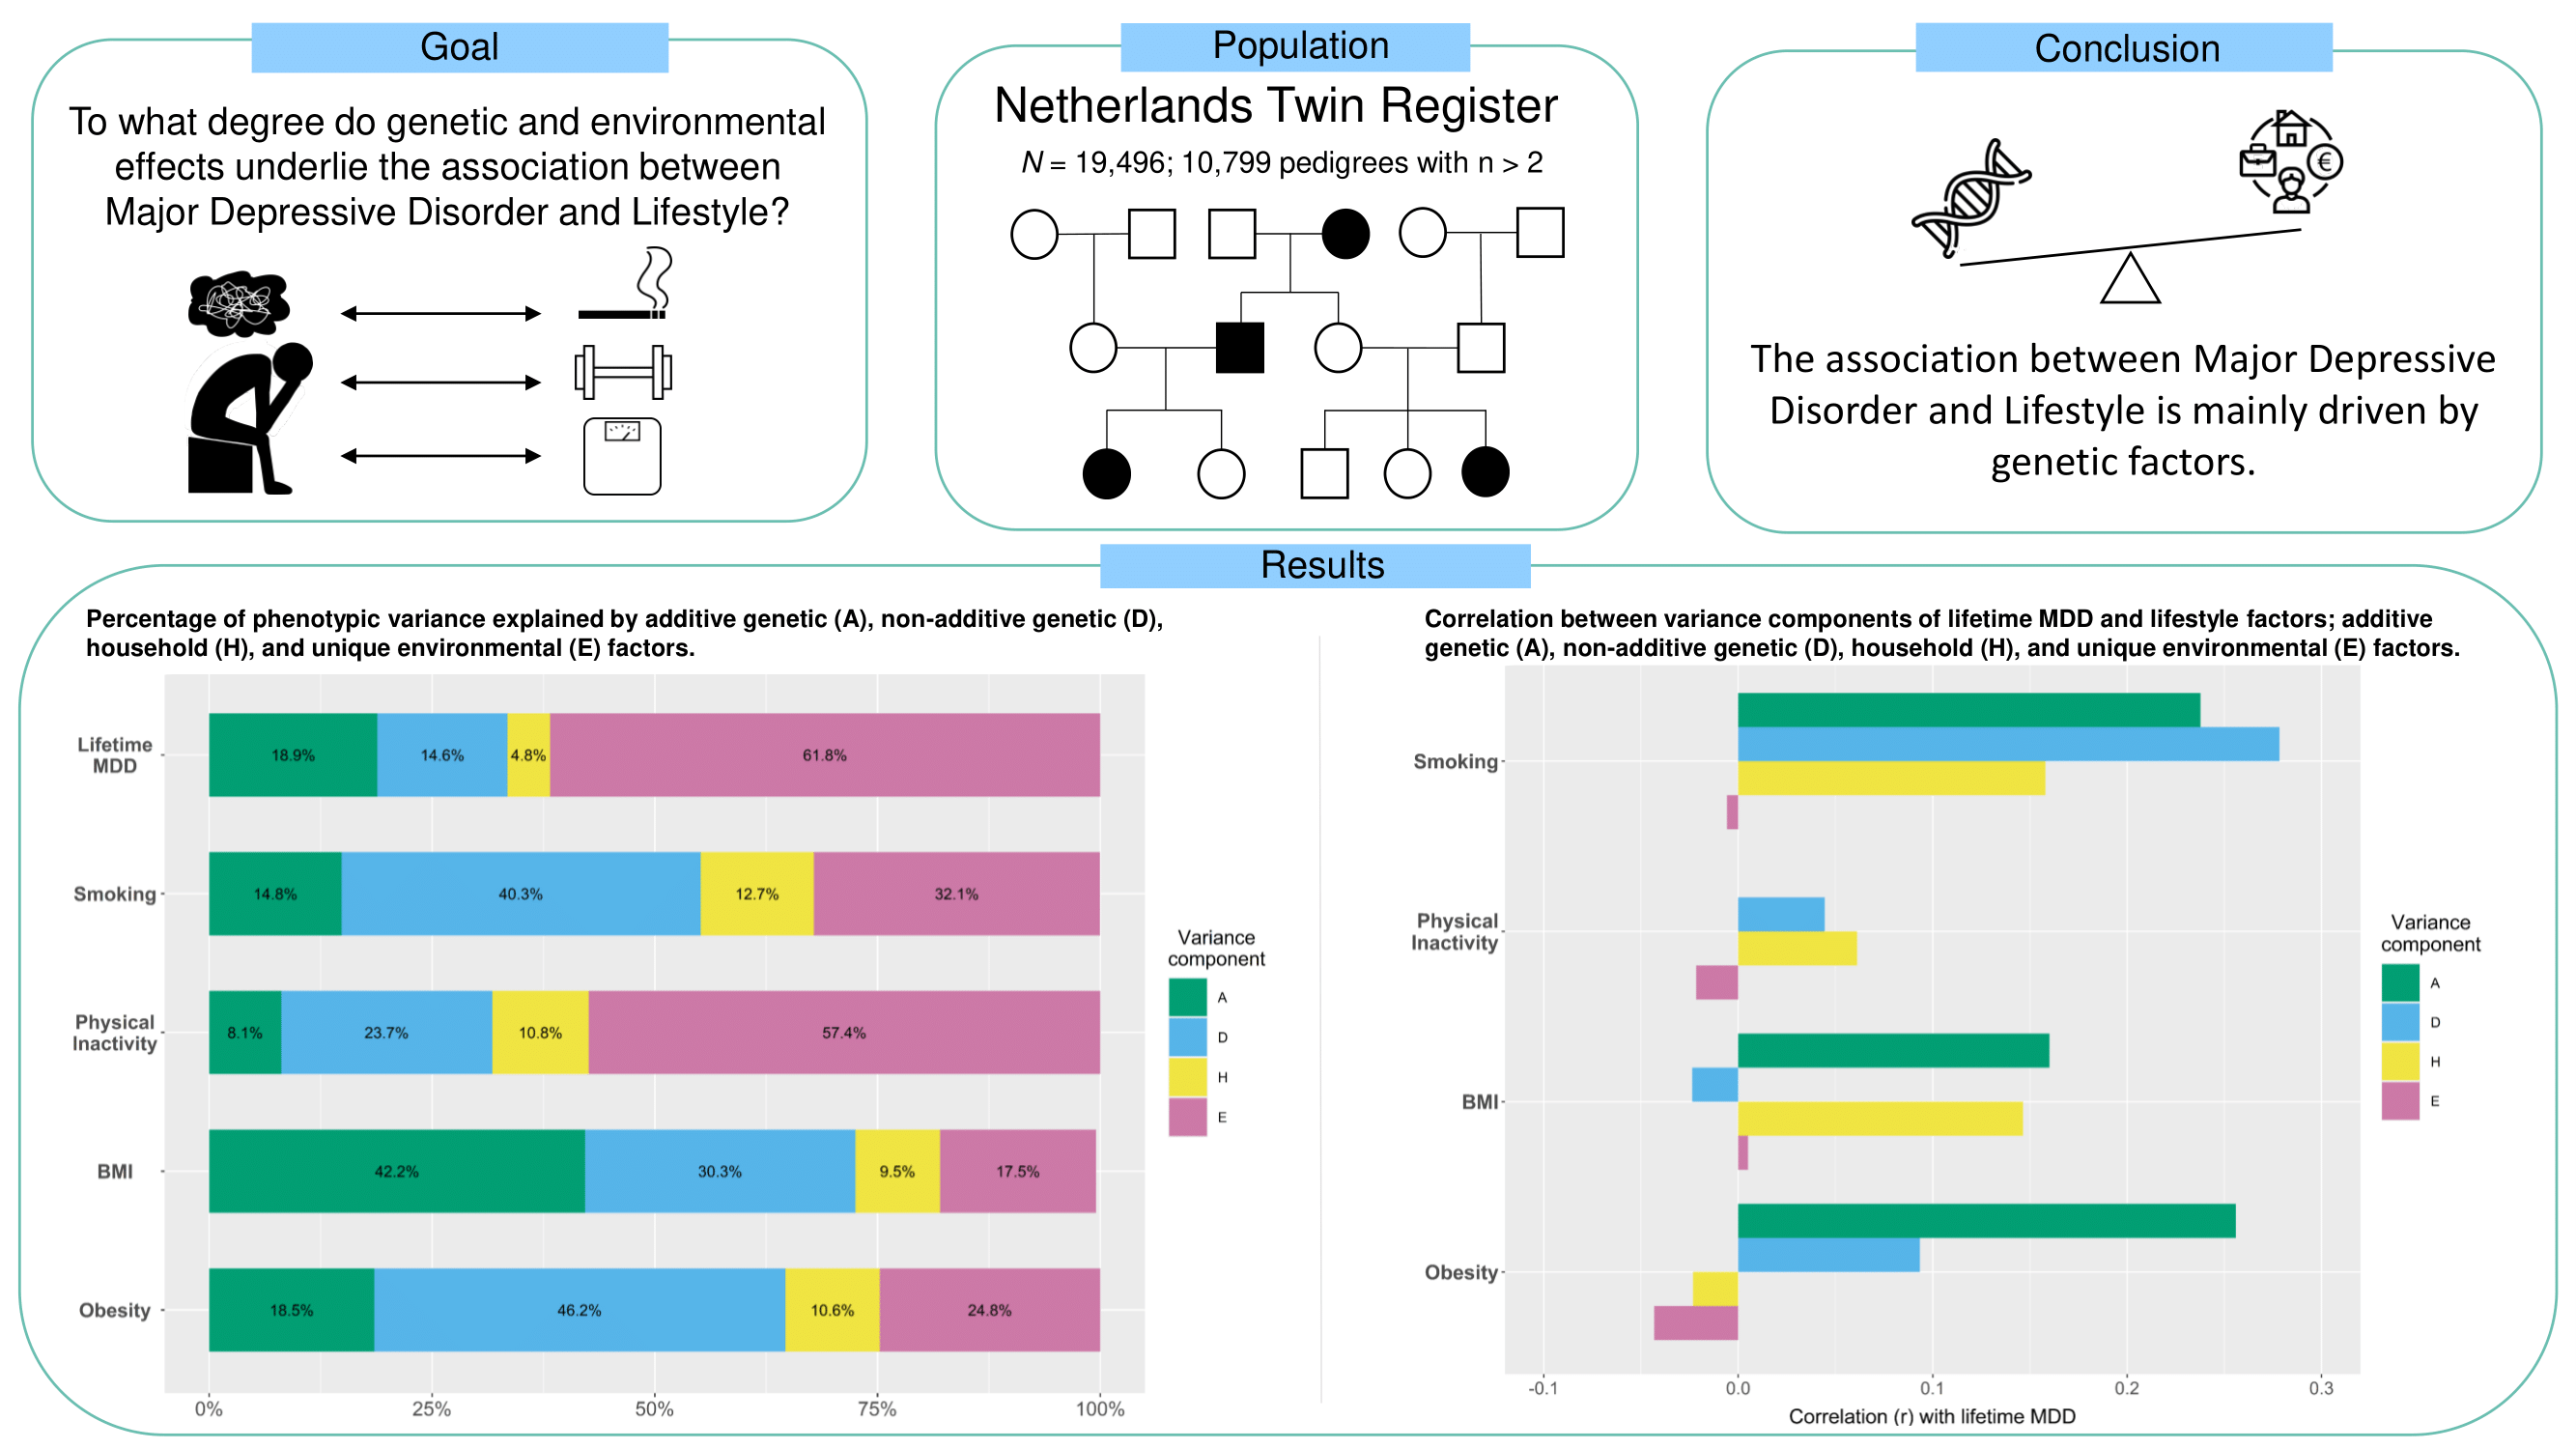
| MDD | 19,496 | 0.032 (0.005) | 0.025 (0.006) | 0.008 (0.003) | 0.105 (0.004) | 0.189 | 0.146 | 0.048 | 0.618 |
| Smoking | 19,475 | 0.033 (0.007) | 0.088 (0.007) | 0.028 (0.003) | 0.071 (0.003) | 0.149 | 0.401 | 0.127 | 0.323 |
| PI | 19,486 | 0.038 (0.014) | 0.109 (0.016) | 0.049 (0.007) | 0.264 (0.010) | 0.082 | 0.236 | 0.108 | 0.574 |
| BMI | 19,334 | 0.009 (0.001) | 0.006 (0.001) | 0.002 (0.0003) | 0.004 (0.0002) | 0.422 | 0.303 | 0.095 | 0.175 |
| Obesity | 19,334 | 0.015 (0.003) | 0.0384 (0.003) | 0.009 (0.001) | 0.021 (0.001) | 0.185 | 0.462 | 0.107 | 0.246 |
| Model | N | Raw Covariance (se) | Correlation | |||||||
|---|---|---|---|---|---|---|---|---|---|---|
| A | D | H | E | A | D | G | H | E | ||
| Smoking and MDD | 19,475 | 0.008 (0.004) | 0.013 (0.005) | 0.002 (0.002) | –0.001 (0.003) | 0.238 | 0.278 | 0.249 | 0.158 | –0.006 |
| PI and MDD | 19,486 | 0.012 (0.006) | 0.002 (0.007) | 0.001 (0.003) | –0.004 (0.005) | 0.357 | 0.044 | 0.161 | 0.061 | –0.022 |
| BMI and MDD | 19,334 | 0.003 (0.001) | –0.0003 (0.0013) | 0.001 (0.001) | 0.0001 (0.0007) | 0.160 | –0.024 | 0.081 | 0.146 | 0.005 |
| Obesity and MDD | 19,334 | 0.006 (0.003) | 0.003 (0.003) | –0.0002 (0.001) | –0.002 (0.002) | 0.256 | 0.093 | 0.155 | –0.023 | –0.043 |
Publisher’s Note: MDPI stays neutral with regard to jurisdictional claims in published maps and institutional affiliations. |
© 2021 by the authors. Licensee MDPI, Basel, Switzerland. This article is an open access article distributed under the terms and conditions of the Creative Commons Attribution (CC BY) license (https://creativecommons.org/licenses/by/4.0/).
Share and Cite
Huider, F.; Milaneschi, Y.; van der Zee, M.D.; de Geus, E.J.C.; Helmer, Q.; Penninx, B.W.J.H.; Boomsma, D.I. Major Depressive Disorder and Lifestyle: Correlated Genetic Effects in Extended Twin Pedigrees. Genes 2021, 12, 1509. https://doi.org/10.3390/genes12101509
Huider F, Milaneschi Y, van der Zee MD, de Geus EJC, Helmer Q, Penninx BWJH, Boomsma DI. Major Depressive Disorder and Lifestyle: Correlated Genetic Effects in Extended Twin Pedigrees. Genes. 2021; 12(10):1509. https://doi.org/10.3390/genes12101509
Chicago/Turabian StyleHuider, Floris, Yuri Milaneschi, Matthijs D. van der Zee, Eco J. C. de Geus, Quinta Helmer, Brenda W. J. H. Penninx, and Dorret I. Boomsma. 2021. "Major Depressive Disorder and Lifestyle: Correlated Genetic Effects in Extended Twin Pedigrees" Genes 12, no. 10: 1509. https://doi.org/10.3390/genes12101509
APA StyleHuider, F., Milaneschi, Y., van der Zee, M. D., de Geus, E. J. C., Helmer, Q., Penninx, B. W. J. H., & Boomsma, D. I. (2021). Major Depressive Disorder and Lifestyle: Correlated Genetic Effects in Extended Twin Pedigrees. Genes, 12(10), 1509. https://doi.org/10.3390/genes12101509