A Knowledge-Based Machine Learning Approach to Gene Prioritisation in Amyotrophic Lateral Sclerosis

 ,
,
Abstract
1. Introduction
2. Materials and Methods
2.1. Data Sources
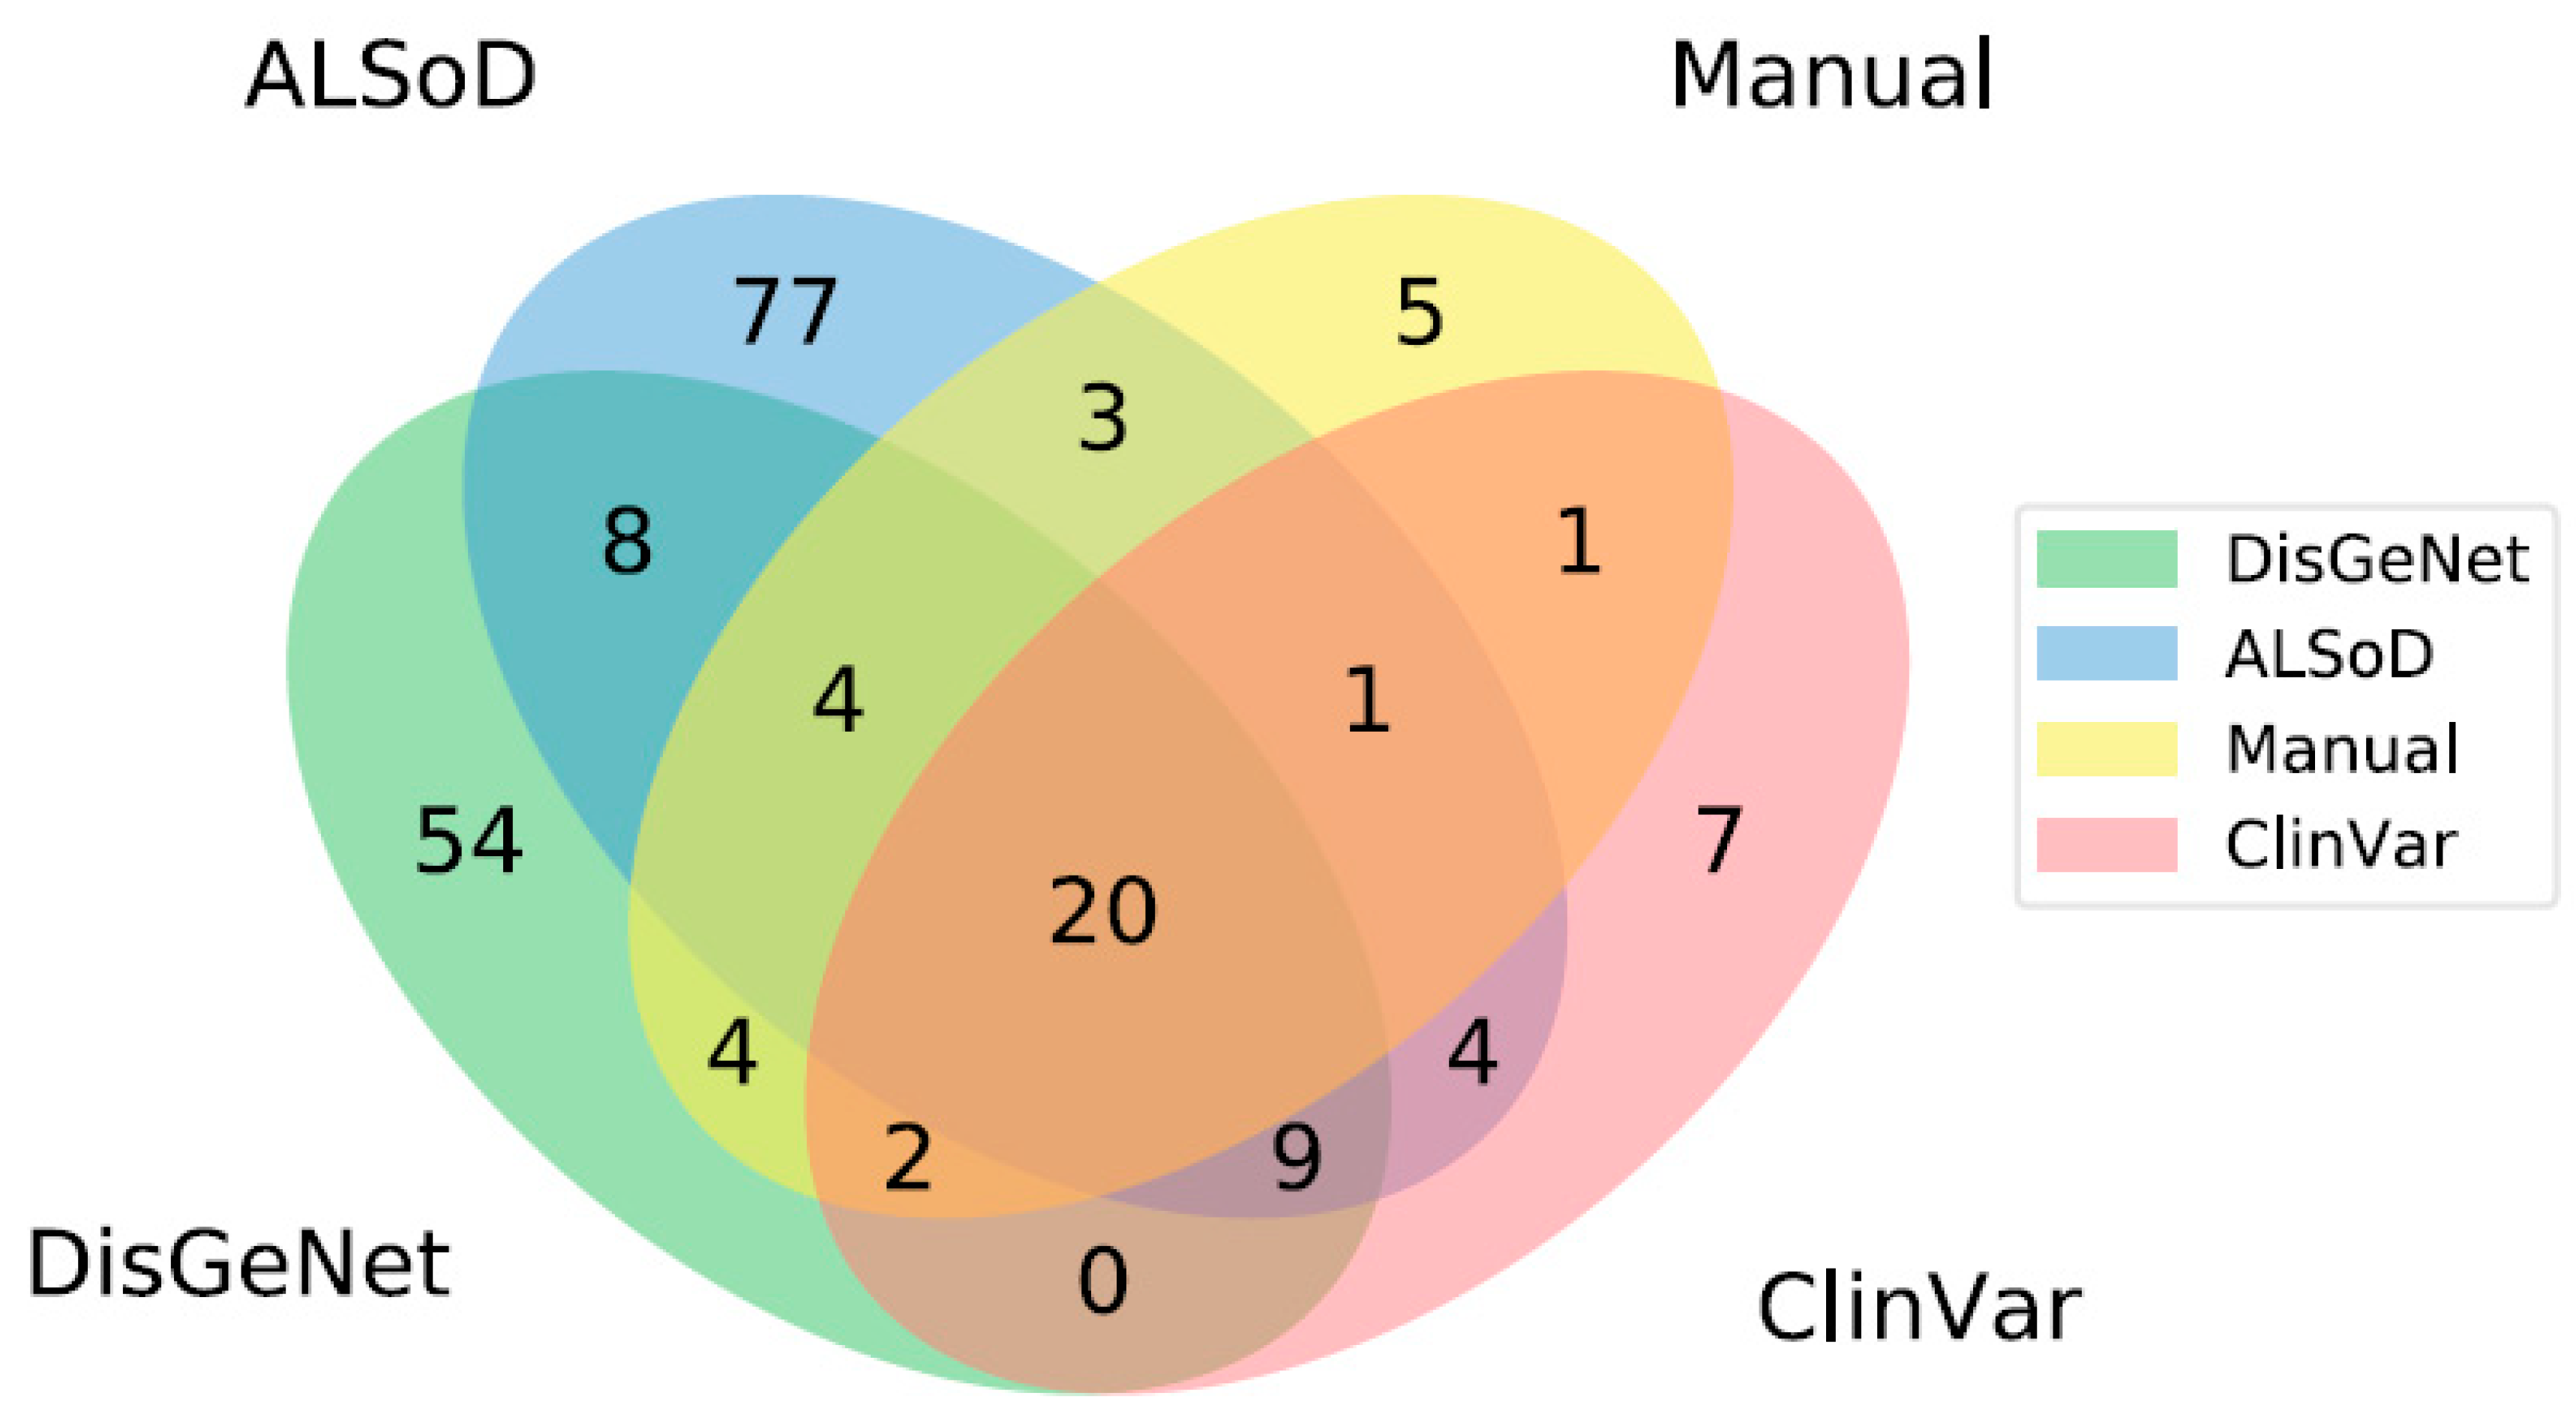
2.2. Definition of ALS-Linked Genes
2.3. Machine Learning
2.4. Cross-Validation
2.5. Gene Set Function and Phenotype Enrichment Analyses
2.6. GWAS Validation
3. Results
3.1. Definition of Known ALS-Linked Genes
3.2. Model Training and Cross-Validation
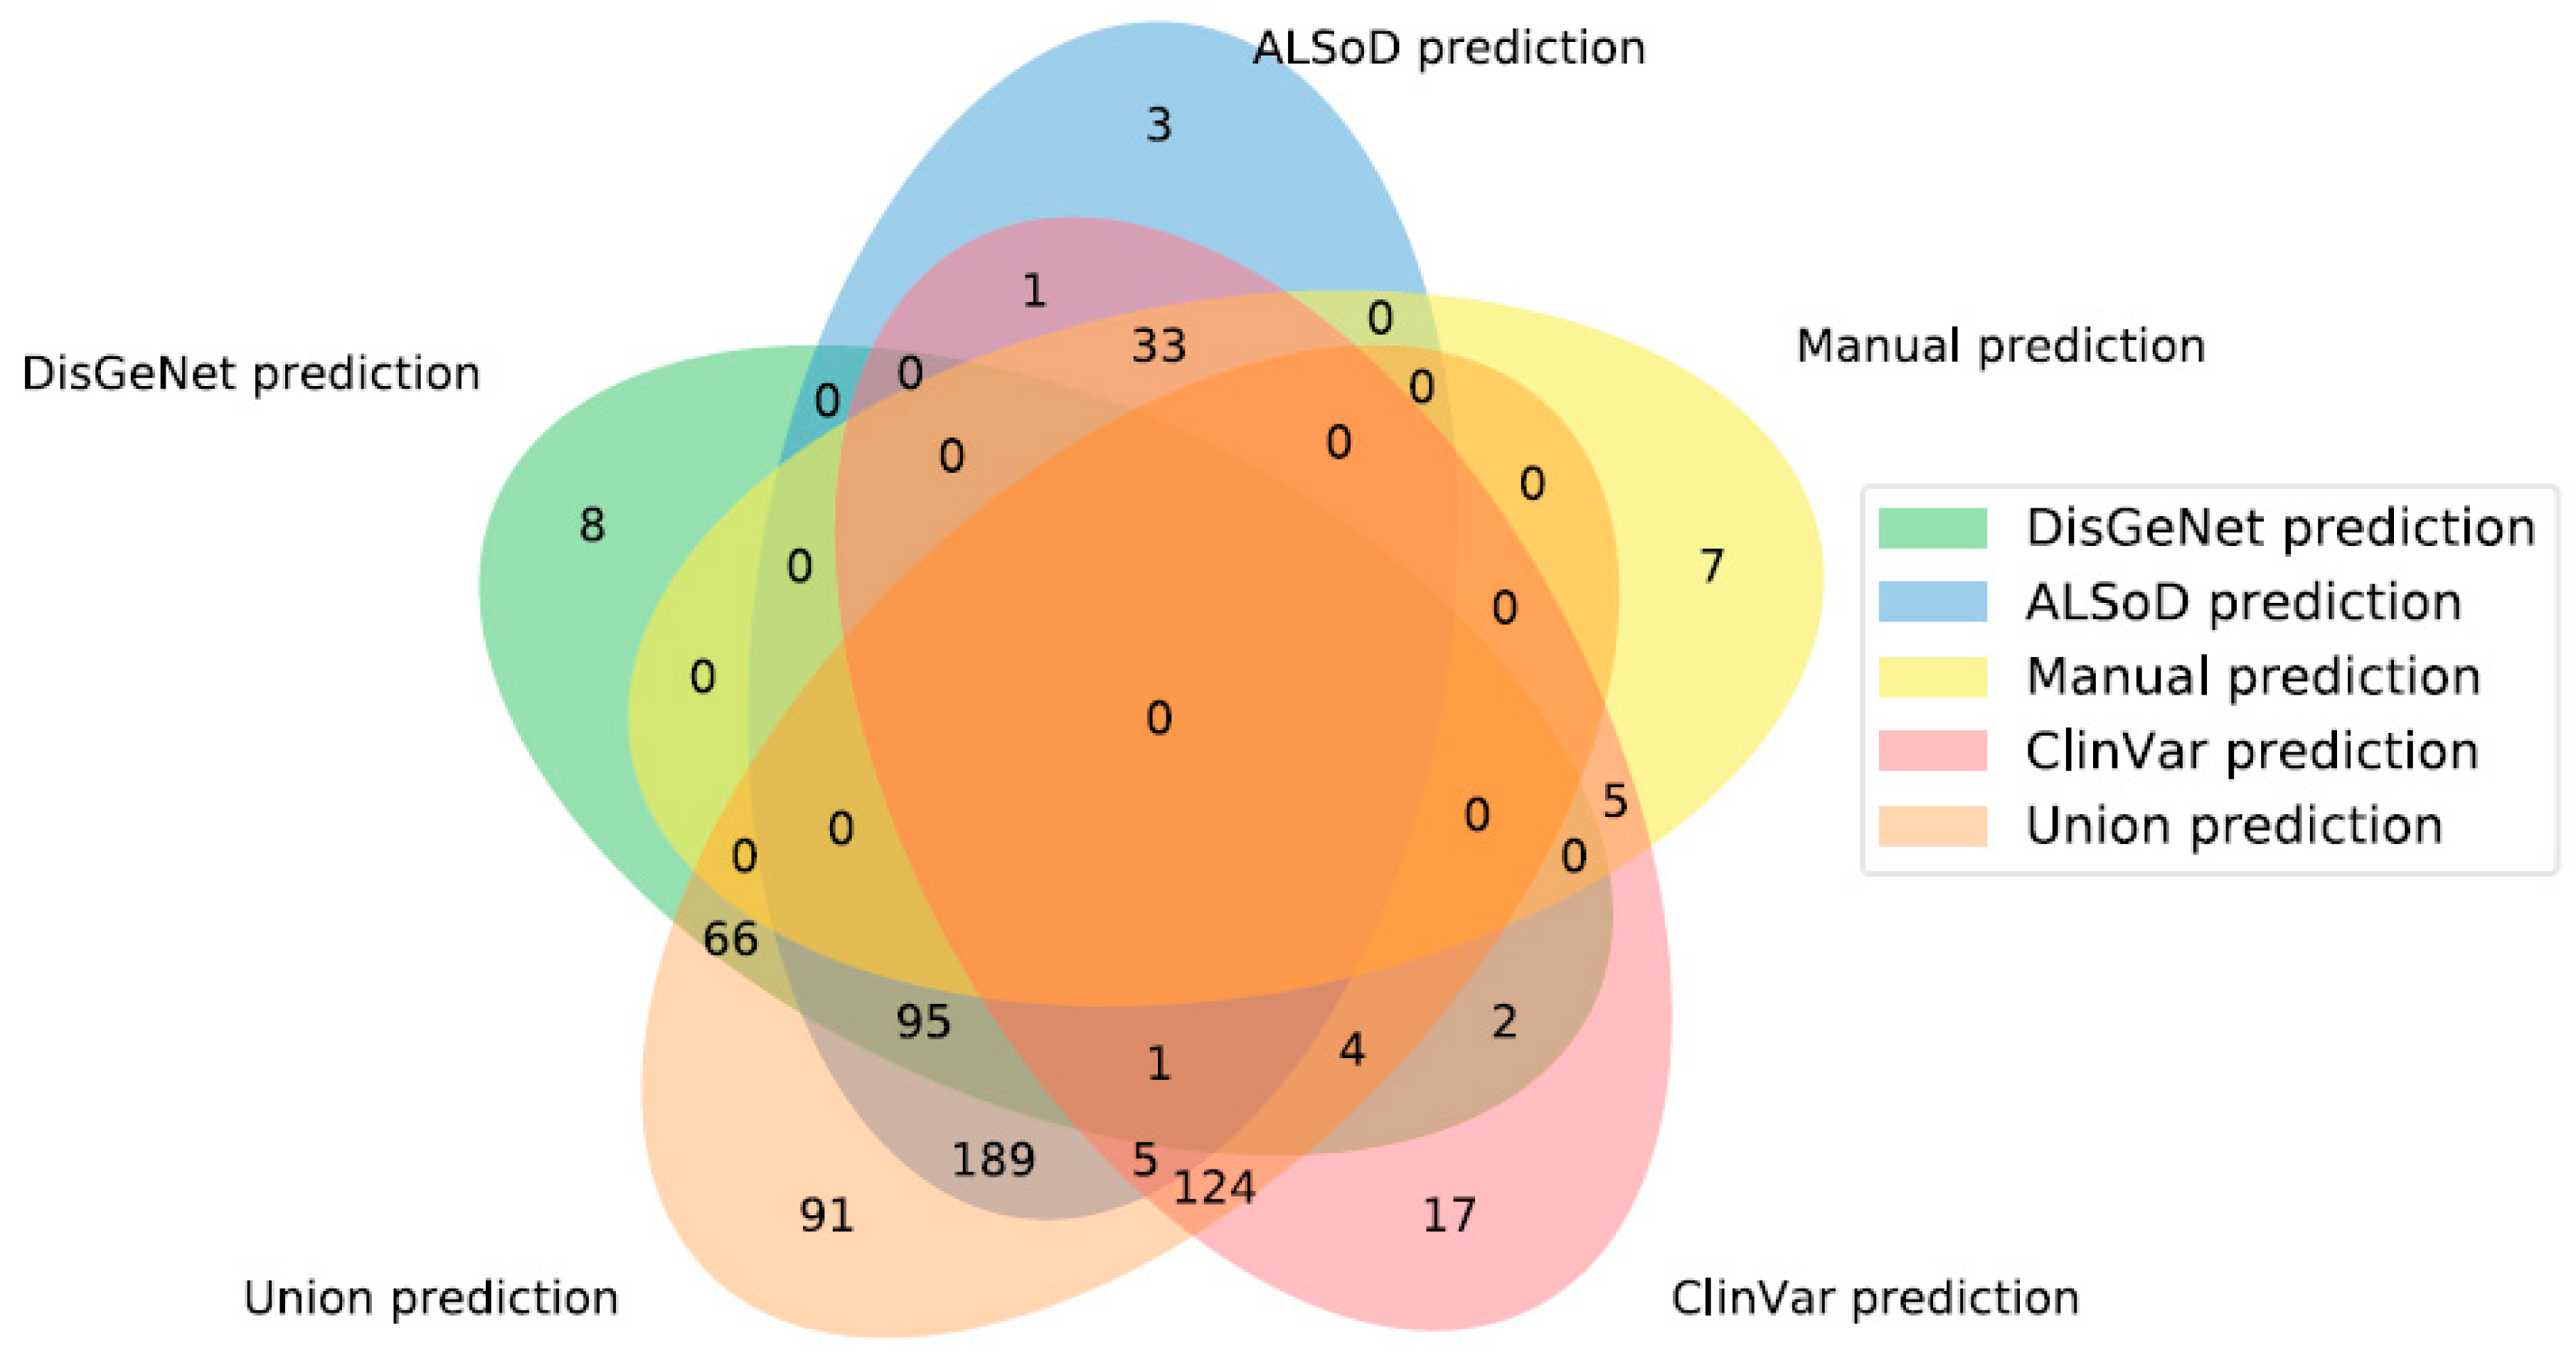
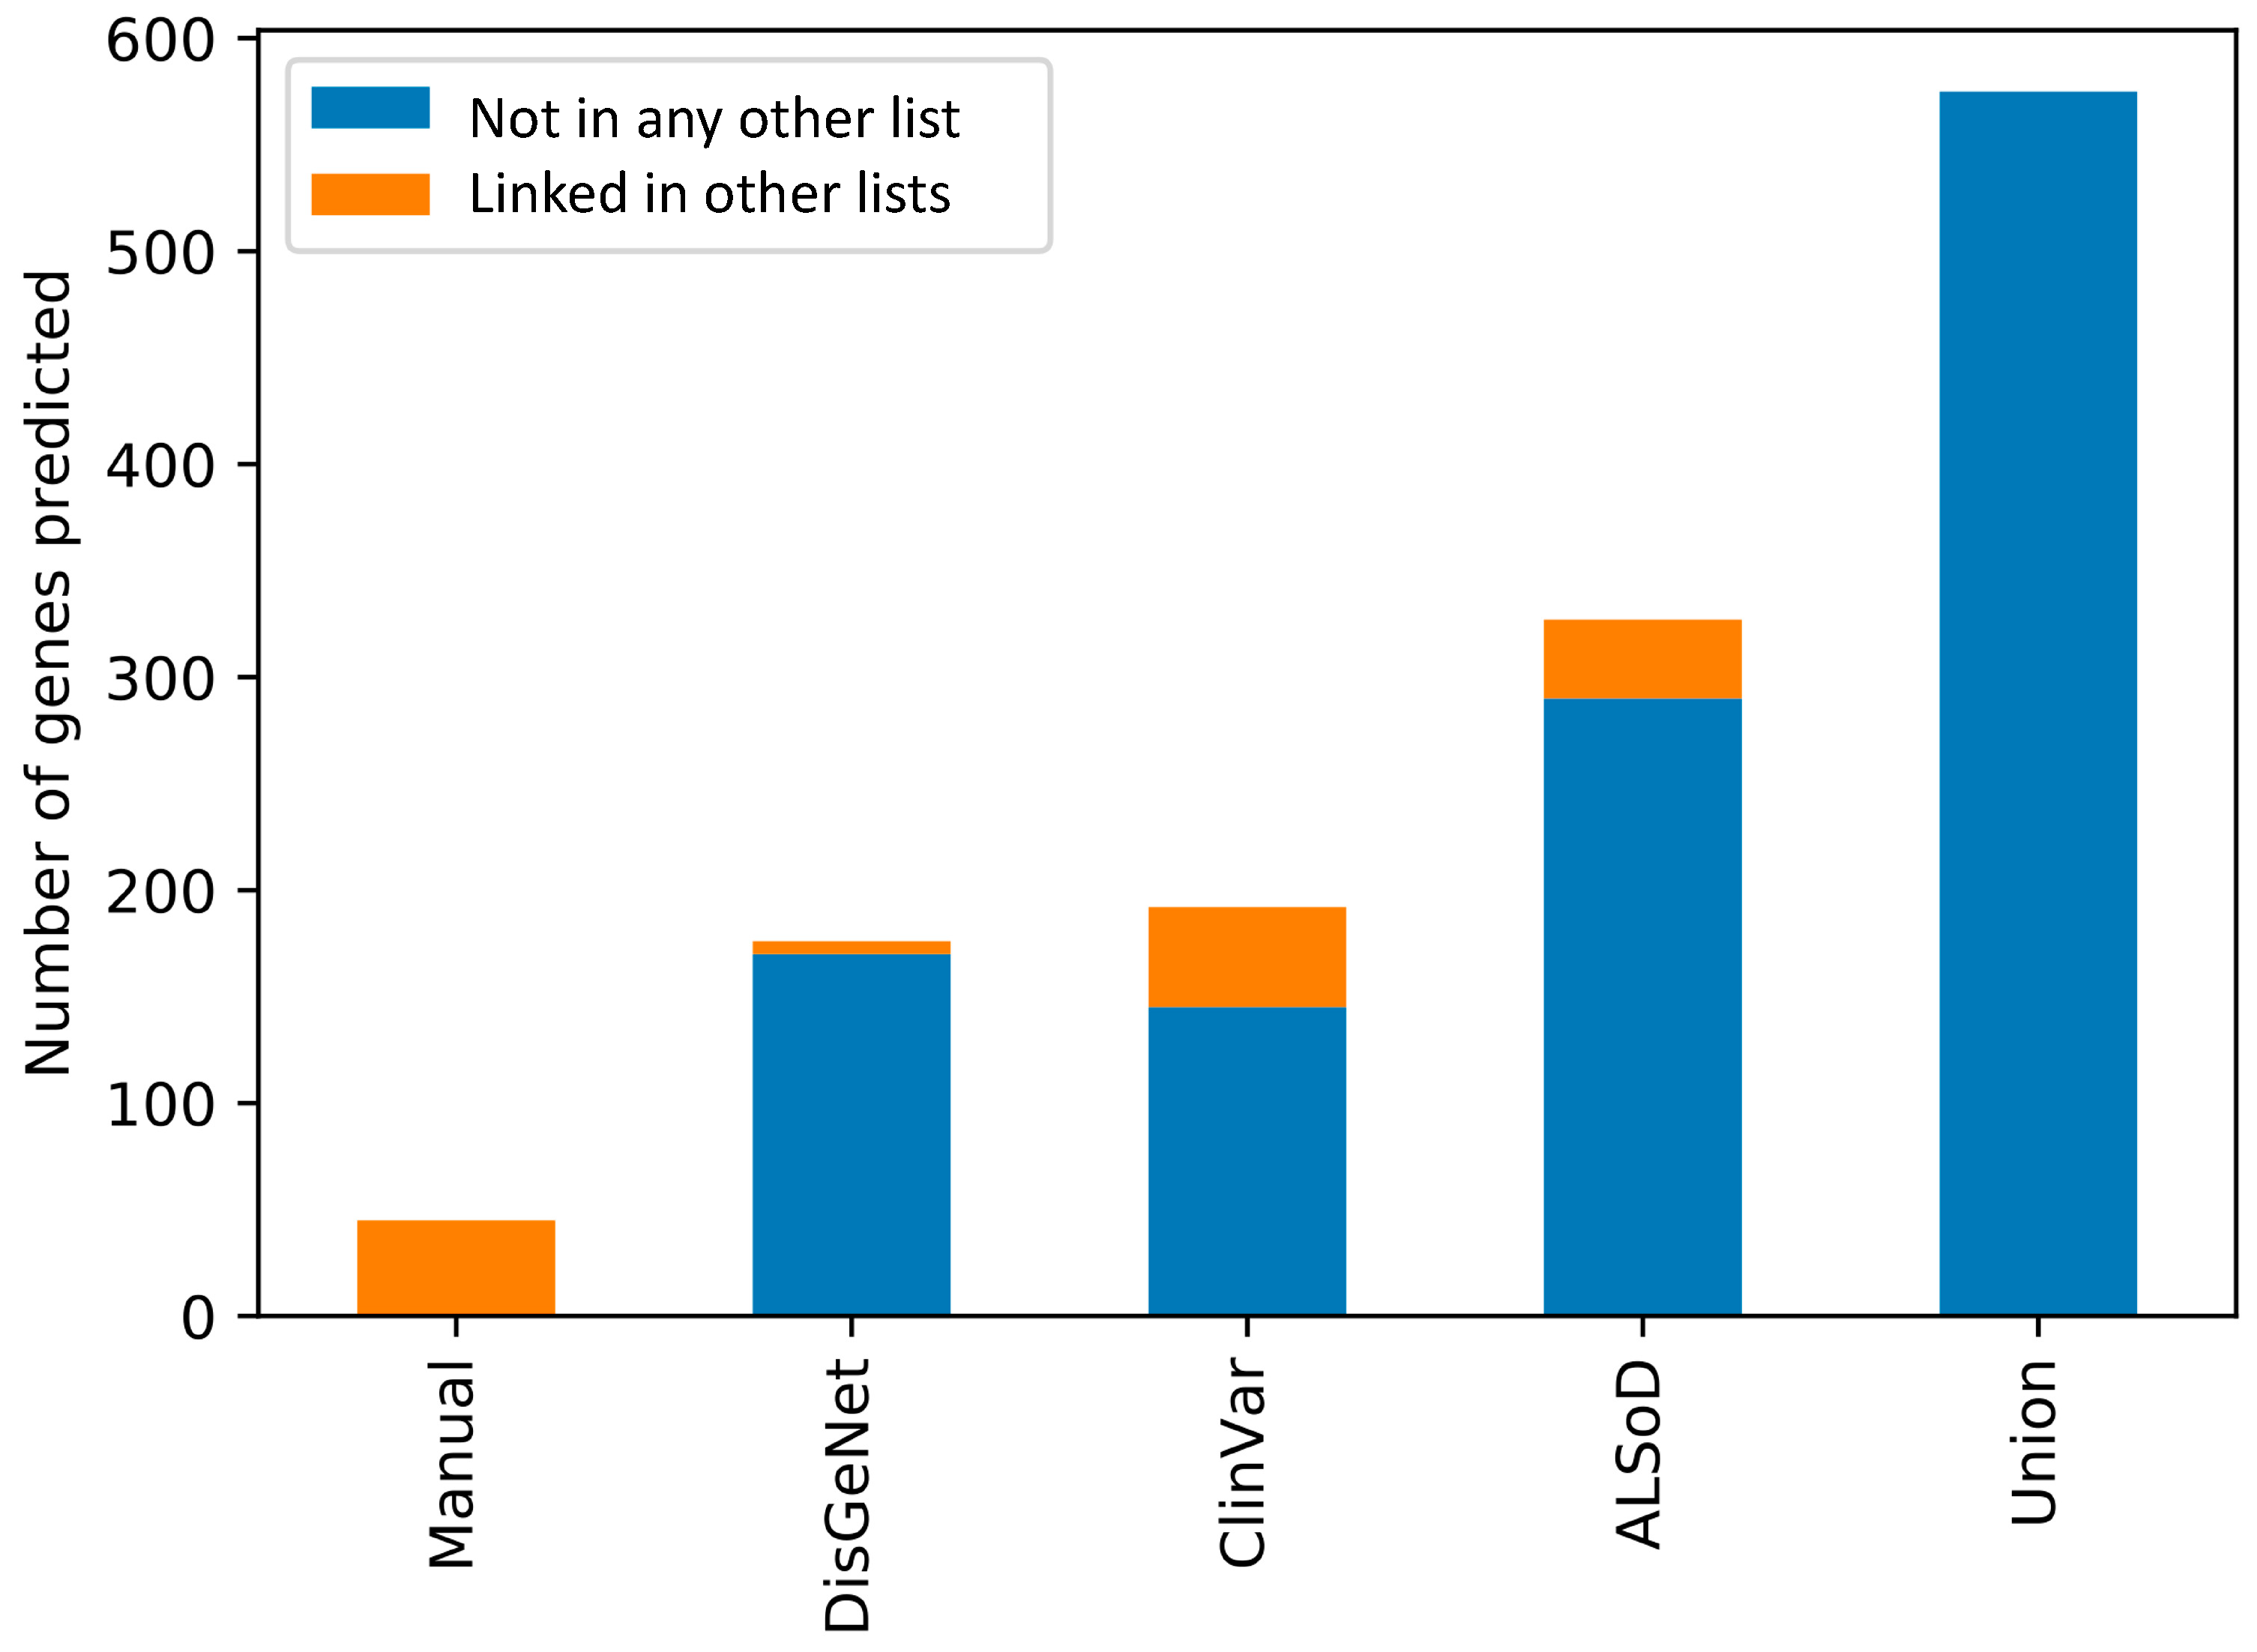
3.3. Prediction of New ALS-Linked Genes
3.4. Functional and Phenotypic Enrichment Analyses of Predicted ALS-Linked Genes
3.5. Validation of Predicted ALS-Linked Genes in GWAS Data
4. Discussion
Supplementary Materials
Author Contributions
Funding
Acknowledgments
Conflicts of Interest
References
- Brown, R.H.; Al-Chalabi, A. Amyotrophic lateral sclerosis. N. Engl. J. Med. 2017, 377, 162–172. [Google Scholar] [CrossRef] [PubMed]
- Abel, O.; Powell, J.F.; Andersen, P.M.; Al-Chalabi, A. ALSoD: A user-friendly online bioinformatics tool for amyotrophic lateral sclerosis genetics. Hum. Mutat. 2012, 33, 1345–1351. [Google Scholar] [CrossRef] [PubMed]
- Iacoangeli, A.; Al Khleifat, A.; Sproviero, W.; Shatunov, A.; Jones, A.R.; Opie-Martin, S.; Naselli, E.; Topp, S.D.; Fogh, I.; Hodges, A.; et al. ALSgeneScanner: A pipeline for the analysis and interpretation of DNA sequencing data of ALS patients. Amyotroph. Lateral Scler. Front. Degener. 2019, 20, 207–215. [Google Scholar] [CrossRef] [PubMed]
- Renton, A.E.; Chiò, A.; Traynor, B.J. State of play in amyotrophic lateral sclerosis genetics. Nat. Neurosci. 2014, 17, 17–23. [Google Scholar] [CrossRef] [PubMed]
- Chia, R.; Chiò, A.; Traynor, B.J. Novel genes associated with amyotrophic lateral sclerosis: Diagnostic and clinical implications. Lancet Neurol. 2018, 17, 94–102. [Google Scholar] [CrossRef]
- Al-Chalabi, A. Perspective: Don’t keep it in the family. Nature 2017, 550, S112. [Google Scholar] [CrossRef]
- Stelzl, U.; Wanker, E.E. The value of high quality protein–protein interaction networks for systems biology. Curr. Opin. Chem. Biol. 2006, 10, 551–558. [Google Scholar] [CrossRef]
- Piñero, J.; Bravo, À.; Queralt-Rosinach, N.; Gutiérrez-Sacristán, A.; Deu-Pons, J.; Centeno, E.; García-García, J.; Sanz, F.; Furlong, L.I. DisGeNET: A comprehensive platform integrating information on human disease-associated genes and variants. Nucleic Acids Res. 2016, 45, D833–D839. [Google Scholar] [CrossRef]
- Iacoangeli, A.; Al Khleifat, A.; Sproviero, W.; Shatunov, A.; Jones, A.; Morgan, S.; Pittman, A.; Dobson, R.; Newhouse, S.; Al-Chalabi, A. DNAscan: Personal computer compatible NGS analysis, annotation and visualisation. BMC Bioinform. 2019, 20, 213. [Google Scholar] [CrossRef]
- Gandhi, T.; Zhong, J.; Mathivanan, S.; Karthick, L.; Chandrika, K.; Mohan, S.S.; Sharma, S.; Pinkert, S.; Nagaraju, S.; Periaswamy, B.; et al. Analysis of the human protein interactome and comparison with yeast, worm and fly interaction datasets. Nat. Genet. 2006, 38, 285–293. [Google Scholar] [CrossRef]
- Oti, M.; Brunner, H.G. The modular nature of genetic diseases. Clin. Genet. 2007, 71, 1–11. [Google Scholar] [CrossRef]
- Lin, C.-H.; Konecki, D.M.; Liu, M.; Wilson, S.J.; Nassar, H.; Wilkins, A.D.; Gleich, D.F.; Lichtarge, O. Multimodal network diffusion predicts future disease–gene–chemical associations. Bioinformatics 2019, 35, 1536–1543. [Google Scholar] [CrossRef] [PubMed]
- Köhler, S.; Bauer, S.; Horn, D.; Robinson, P.N. Walking the interactome for prioritization of candidate disease genes. Am. J. Hum. Genet. 2008, 82, 949–958. [Google Scholar] [CrossRef] [PubMed]
- Peng, J.; Bai, K.; Shang, X.; Wang, G.; Xue, H.; Jin, S.; Cheng, L.; Wang, Y.; Chen, J. Predicting disease-related genes using integrated biomedical networks. BMC Genom. 2017, 18, 1043. [Google Scholar] [CrossRef]
- Vanunu, O.; Magger, O.; Ruppin, E.; Shlomi, T.; Sharan, R. Associating genes and protein complexes with disease via network propagation. PLoS Comput. Biol. 2010, 6, e1000641. [Google Scholar] [CrossRef] [PubMed]
- Zhou, H.; Skolnick, J. A knowledge-based approach for predicting gene–disease associations. Bioinformatics 2016, 32, 2831–2838. [Google Scholar] [CrossRef] [PubMed]
- Zeng, X.; Liao, Y.; Liu, Y.; Zou, Q. Prediction and validation of disease genes using HeteSim Scores. IEEE/ACM Trans. Comput. Biol. Bioinform. 2016, 14, 687–695. [Google Scholar] [CrossRef]
- Ata, S.K.; Ou-Yang, L.; Fang, Y.; Kwoh, C.-K.; Wu, M.; Li, X.-L. Integrating node embeddings and biological annotations for genes to predict disease-gene associations. BMC Syst. Biol. 2018, 12, 138. [Google Scholar] [CrossRef]
- Grover, A.; Leskovec, J. node2vec: Scalable feature learning for networks. In Proceedings of the 22nd ACM SIGKDD International Conference on Knowledge Discovery and Data Mining, San Francisco, CA, USA, 13–17 August 2016; ACM: New York, NY, USA, 2016; pp. 855–864. [Google Scholar]
- Wu, X.; Jiang, R.; Zhang, M.Q.; Li, S. Network-based global inference of human disease genes. Mol. Syst. Biol. 2008, 4. [Google Scholar] [CrossRef]
- Lin, L.; Yang, T.; Fang, L.; Yang, J.; Yang, F.; Zhao, J. Gene gravity-like algorithm for disease gene prediction based on phenotype-specific network. BMC Syst. Biol. 2017, 11, 121. [Google Scholar] [CrossRef]
- Luo, P.; Li, Y.; Tian, L.-P.; Wu, F.-X. Enhancing the prediction of disease–gene associations with multimodal deep learning. Bioinformatics 2019, 35, 3735–3742. [Google Scholar] [CrossRef] [PubMed]
- Asif, M.; Martiniano, H.F.; Vicente, A.M.; Couto, F.M. Identifying disease genes using machine learning and gene functional similarities, assessed through Gene Ontology. PLoS ONE 2018, 13, e0208626. [Google Scholar] [CrossRef]
- Bean, D.M.; Wu, H.; Iqbal, E.; Dzahini, O.; Ibrahim, Z.M.; Broadbent, M.; Stewart, R.; Dobson, R.J. Knowledge graph prediction of unknown adverse drug reactions and validation in electronic health records. Sci. Rep. 2017, 7, 16416. [Google Scholar] [CrossRef] [PubMed]
- Orchard, S.; Ammari, M.; Aranda, B.; Breuza, L.; Briganti, L.; Broackes-Carter, F.; Campbell, N.H.; Chavali, G.; Chen, C.; Del-Toro, N.; et al. The MIntAct project—IntAct as a common curation platform for 11 molecular interaction databases. Nucleic Acids Res. 2014, 42, D358–D363. [Google Scholar] [CrossRef] [PubMed]
- The Gene Ontology Consortium; Dolinski, K.; Dwight, S.S.; Eppig, J.T.; Harris, M.A.; Hill, D.P.; Issel-Tarver, L.; Kasarskis, A.; Lewis, S.; Matese, J.; et al. Gene ontology: Tool for the unification of biology. Nat. Genet. 2000, 25, 25–29. [Google Scholar]
- Acencio, M.L.; Lægreid, A.; Kuiper, M. The Gene Ontology Resource: 20 Years and Still Going Strong. Nucleic Acids Res. 2019, 47, D330–D338. [Google Scholar] [CrossRef]
- Piñero, J.; Ramírez-Anguita, J.M.; Saüch-Pitarch, J.; Ronzano, F.; Centeno, E.; Sanz, F.; Furlong, L.I. The DisGeNET knowledge platform for disease genomics: 2019 Update. Nucleic Acids Res. 2020, 48, D845–D855. [Google Scholar] [CrossRef]
- Wroe, R.; Wai-Ling Butler, A.; Andersen, P.M.; Powell, J.F.; Al-Chalabi, A. ALSOD: The Amyotrophic Lateral Sclerosis Online Database. Amyotroph. Lateral Scler. 2008, 9, 249–250. [Google Scholar] [CrossRef]
- Landrum, M.J.; Lee, J.M.; Riley, G.R.; Jang, W.; Rubinstein, W.S.; Church, D.M.; Maglott, D.R. ClinVar: Public archive of relationships among sequence variation and human phenotype. Nucleic Acids Res. 2014, 42, D980–D985. [Google Scholar] [CrossRef]
- Mi, H.; Muruganujan, A.; Ebert, D.; Huang, X.; Thomas, P.D. PANTHER version 14: More genomes, a new PANTHER GO-slim and improvements in enrichment analysis tools. Nucleic Acids Res. 2019, 47, D419–D426. [Google Scholar] [CrossRef]
- Supek, F.; Bošnjak, M.; Škunca, N.; Šmuc, T. REVIGO summarizes and visualizes long lists of gene ontology terms. PLoS ONE 2011, 6, e21800. [Google Scholar] [CrossRef] [PubMed]
- Kuleshov, M.V.; Jones, M.R.; Rouillard, A.D.; Fernandez, N.F.; Duan, Q.; Wang, Z.; Koplev, S.; Jenkins, S.L.; Jagodnik, K.M.; Lachmann, A.; et al. Enrichr: A comprehensive gene set enrichment analysis web server 2016 update. Nucleic Acids Res. 2016, 44, W90–W97. [Google Scholar] [CrossRef] [PubMed]
- Amberger, J.S.; Bocchini, C.A.; Scott, A.F.; Hamosh, A. Omim. org: Leveraging knowledge across phenotype–gene relationships. Nucleic Acids Res. 2019, 47, D1038–D1043. [Google Scholar] [CrossRef] [PubMed]
- Hamosh, A.; Scott, A.F.; Amberger, J.S.; Bocchini, C.A.; McKusick, V.A. Online Mendelian Inheritance in Man (OMIM), a knowledgebase of human genes and genetic disorders. Nucleic Acids Res. 2005, 33, D514–D517. [Google Scholar] [CrossRef]
- Nicolas, A.; Kenna, K.P.; Renton, A.E.; Ticozzi, N.; Faghri, F.; Chia, R.; Dominov, J.A.; Kenna, B.J.; Nalls, M.A.; Keagle, P.; et al. Genome-wide analyses identify KIF5A as a novel ALS gene. Neuron 2018, 97, 1268–1283. [Google Scholar] [CrossRef]
- Pe’er, I.; Yelensky, R.; Altshuler, D.; Daly, M.J. Estimation of the multiple testing burden for genomewide association studies of nearly all common variants. Genet. Epidemiol. Off. Publ. Int. Genet. Epidemiol. Soc. 2008, 32, 381–385. [Google Scholar] [CrossRef]
- The 1000 Genomes Project Consortium. A global reference for human genetic variation. Nature 2015, 526, 68–74. [Google Scholar] [CrossRef]
- de Leeuw, C.A.; Mooij, J.M.; Heskes, T.; Posthuma, D. MAGMA: Generalized gene-set analysis of GWAS data. PLoS Comput. Biol. 2015, 11, e1004219. [Google Scholar] [CrossRef]
- Oosthuyse, B.; Moons, L.; Storkebaum, E.; Beck, H.; Nuyens, D.; Brusselmans, K.; Van Dorpe, J.; Hellings, P.; Gorselink, M.; Heymans, S.; et al. Deletion of the hypoxia-response element in the vascular endothelial growth factor promoter causes motor neuron degeneration. Nat. Genet. 2001, 28, 131–138. [Google Scholar] [CrossRef]
- Adibhatla, R.M.; Hatcher, J.F. Role of lipids in brain injury and diseases. Future Lipidol. 2007, 2, 403–422. [Google Scholar] [CrossRef]
- Smith, E.F.; Shaw, P.J.; De Vos, K.J. The role of mitochondria in amyotrophic lateral sclerosis. Neurosci. Lett. 2019, 710, 132933. [Google Scholar] [CrossRef] [PubMed]
- Guo, W.; Vandoorne, T.; Steyaert, J.; Staats, K.A.; Van Den Bosch, L. The multifaceted role of kinases in amyotrophic lateral sclerosis: Genetic, pathological and therapeutic implications. Brain 2020. [Google Scholar] [CrossRef] [PubMed]
- Barber, S.C.; Shaw, P.J. Oxidative stress in ALS: Key role in motor neuron injury and therapeutic target. Free Radic. Biol. Med. 2010, 48, 629–641. [Google Scholar] [CrossRef] [PubMed]
- Bowling, A.C.; Schulz, J.B.; Brown, R.H., Jr.; Beal, M.F. Superoxide dismutase activity, oxidative damage, and mitochondrial energy metabolism in familial and sporadic amyotrophic lateral sclerosis. J. Neurochem. 1993, 61, 2322–2325. [Google Scholar] [CrossRef] [PubMed]
- Nishimura, A.L.; Mitne-Neto, M.; Silva, H.C.; Richieri-Costa, A.; Middleton, S.; Cascio, D.; Kok, F.; Oliveira, J.R.; Gillingwater, T.; Webb, J.; et al. A mutation in the vesicle-trafficking protein VAPB causes late-onset spinal muscular atrophy and amyotrophic lateral sclerosis. Am. J. Hum. Genet. 2004, 75, 822–831. [Google Scholar] [CrossRef]
- Foerster, B.R.; Pomper, M.G.; Callaghan, B.C.; Petrou, M.; Edden, R.A.; Mohamed, M.A.; Welsh, R.C.; Carlos, R.C.; Barker, P.B.; Feldman, E.L. An imbalance between excitatory and inhibitory neurotransmitters in amyotrophic lateral sclerosis revealed by use of 3-T proton magnetic resonance spectroscopy. JAMA Neurol. 2013, 70, 1009–1016. [Google Scholar] [CrossRef]
- Lillo, P.; Mioshi, E.; Zoing, M.C.; Kiernan, M.C.; Hodges, J.R. How common are behavioural changes in amyotrophic lateral sclerosis? Amyotroph. Lateral Scler. 2011, 12, 45–51. [Google Scholar] [CrossRef]
- DeJesus-Hernandez, M.; Mackenzie, I.R.; Boeve, B.F.; Boxer, A.L.; Baker, M.; Rutherford, N.J.; Nicholson, A.M.; Finch, N.A.; Flynn, H.; Adamson, J.; et al. Expanded GGGGCC hexanucleotide repeat in noncoding region of C9ORF72 causes chromosome 9p-linked FTD and ALS. Neuron 2011, 72, 245–256. [Google Scholar] [CrossRef]
- Renton, A.E.; Majounie, E.; Waite, A.; Simón-Sánchez, J.; Rollinson, S.; Gibbs, J.R.; Schymick, J.C.; Laaksovirta, H.; Van Swieten, J.C.; Myllykangas, L. A hexanucleotide repeat expansion in C9ORF72 is the cause of chromosome 9p21-linked ALS-FTD. Neuron 2011, 72, 257–268. [Google Scholar] [CrossRef]
- McLaughlin, R.L.; Schijven, D.; Van Rheenen, W.; Van Eijk, K.R.; O’Brien, M.; Kahn, R.S.; Ophoff, R.A.; Goris, A.; Bradley, D.G.; Al-Chalabi, A. Genetic correlation between amyotrophic lateral sclerosis and schizophrenia. Nat. Commun. 2017, 8, 14770. [Google Scholar] [CrossRef]
- Trist, B.G.; Davies, K.M.; Cottam, V.; Genoud, S.; Ortega, R.; Roudeau, S.; Carmona, A.; De Silva, K.; Wasinger, V.; Lewis, S.J.; et al. Amyotrophic lateral sclerosis-like superoxide dismutase 1 proteinopathy is associated with neuronal loss in Parkinson’s disease brain. Acta Neuropathol. 2017, 134, 113–127. [Google Scholar] [CrossRef] [PubMed]
- Muraoka, Y.; Nakamura, A.; Tanaka, R.; Suda, K.; Azuma, Y.; Kushimura, Y.; Piccolo, L.L.; Yoshida, H.; Mizuta, I.; Tokuda, T.; et al. Genetic screening of the genes interacting with Drosophila FIG4 identified a novel link between CMT-causing gene and long noncoding RNAs. Exp. Neurol. 2018, 310, 1–13. [Google Scholar] [CrossRef] [PubMed]
- Montecchiani, C.; Pedace, L.; Lo Giudice, T.; Casella, A.; Mearini, M.; Gaudiello, F.; Pedroso, J.L.; Terracciano, C.; Caltagirone, C.; Massa, R.; et al. ALS5/SPG11/KIAA1840 mutations cause autosomal recessive axonal Charcot–Marie–Tooth disease. Brain 2016, 139, 73–85. [Google Scholar] [CrossRef] [PubMed]
- Orlacchio, A.; Babalini, C.; Borreca, A.; Patrono, C.; Massa, R.; Basaran, S.; Munhoz, R.P.; Rogaeva, E.A.; St George-Hyslop, P.H.; Bernardi, G.; et al. SPATACSIN mutations cause autosomal recessive juvenile amyotrophic lateral sclerosis. Brain 2010, 133, 591–598. [Google Scholar] [CrossRef] [PubMed]
- Zeng, P.; Wang, T.; Zheng, J.; Zhou, X. Causal association of type 2 diabetes with amyotrophic lateral sclerosis: New evidence from Mendelian randomization using GWAS summary statistics. BMC Med. 2019, 17, 225. [Google Scholar] [CrossRef]
- Kioumourtzoglou, M.-A.; Rotem, R.S.; Seals, R.M.; Gredal, O.; Hansen, J.; Weisskopf, M.G. Diabetes mellitus, obesity, and diagnosis of amyotrophic lateral sclerosis: A population-based study. JAMA Neurol. 2015, 72, 905–911. [Google Scholar] [CrossRef]
- Miller, R.G.; Mitchell, J.D.; Moore, D.H. Riluzole for amyotrophic lateral sclerosis (ALS)/motor neuron disease (MND). Cochrane Database Syst. Rev. 2012. [Google Scholar] [CrossRef]
- Crockford, C.; Newton, J.; Lonergan, K.; Chiwera, T.; Booth, T.; Chandran, S.; Colville, S.; Heverin, M.; Mays, I.; Pal, S.; et al. ALS-specific cognitive and behavior changes associated with advancing disease stage in ALS. Neurology 2018, 91, e1370–e1380. [Google Scholar] [CrossRef]
- Phukan, J.; Pender, N.P.; Hardiman, O. Cognitive impairment in amyotrophic lateral sclerosis. Lancet Neurol. 2007, 6, 994–1003. [Google Scholar] [CrossRef]
- van Es, M.A.; Hardiman, O.; Chio, A.; Al-Chalabi, A.; Pasterkamp, R.J.; Veldink, J.H.; van den Berg, L.H. Amyotrophic lateral sclerosis. Lancet 2017, 390, 2084–2098. [Google Scholar] [CrossRef]
- Van Rheenen, W.; Shatunov, A.; Dekker, A.M.; McLaughlin, R.L.; Diekstra, F.P.; Pulit, S.L.; Van Der Spek, R.A.; Võsa, U.; De Jong, S.; Robinson, M.R.; et al. Genome-wide association analyses identify new risk variants and the genetic architecture of amyotrophic lateral sclerosis. Nat. Genet. 2016, 48, 1043–1048. [Google Scholar] [CrossRef] [PubMed]
- Fogh, I.; Ratti, A.; Gellera, C.; Lin, K.; Tiloca, C.; Moskvina, V.; Corrado, L.; Sorarù, G.; Cereda, C.; Corti, S.; et al. A genome-wide association meta-analysis identifies a novel locus at 17q11. 2 associated with sporadic amyotrophic lateral sclerosis. Hum. Mol. Genet. 2013, 23, 2220–2231. [Google Scholar] [CrossRef] [PubMed]
- Fogh, I.; Lin, K.; Tiloca, C.; Rooney, J.; Gellera, C.; Diekstra, F.P.; Ratti, A.; Shatunov, A.; Van Es, M.A.; Proitsi, P.; et al. Association of a locus in the CAMTA1 gene with survival in patients with sporadic amyotrophic lateral sclerosis. JAMA Neurol. 2016, 73, 812–820. [Google Scholar] [CrossRef]
- Iacoangeli, A.; Al Khleifat, A.; Jones, A.R.; Sproviero, W.; Shatunov, A.; Opie-Martin, S.; Morrison, K.E.; Shaw, P.J.; Shaw, C.E.; Fogh, I.; et al. C9orf72 intermediate expansions of 24–30 repeats are associated with ALS. Acta Neuropathol. Commun. 2019, 7, 115. [Google Scholar] [CrossRef] [PubMed]
- Project MinE ALS Sequencing Consortium. Project MinE: Study design and pilot analyses of a large-scale whole-genome sequencing study in amyotrophic lateral sclerosis. Eur. J. Hum. Genet. 2018, 26, 1537–1546. [Google Scholar] [CrossRef] [PubMed]
- Kenna, K.P.; Van Doormaal, P.T.; Dekker, A.M.; Ticozzi, N.; Kenna, B.J.; Diekstra, F.P.; Van Rheenen, W.; Van Eijk, K.R.; Jones, A.R.; Keagle, P.; et al. NEK1 variants confer susceptibility to amyotrophic lateral sclerosis. Nat. Genet. 2016, 48, 1037–1042. [Google Scholar] [CrossRef] [PubMed]
- Van Rheenen, W.; Diekstra, F.P.; Harschnitz, O.; Westeneng, H.-J.; van Eijk, K.R.; Saris, C.G.; Groen, E.J.; Van Es, M.A.; Blauw, H.M.; Van Vught, P.W. Whole blood transcriptome analysis in amyotrophic lateral sclerosis: A biomarker study. PLoS ONE 2018, 13, e0198874. [Google Scholar] [CrossRef]
- van der Spek, R.A.; Van Rheenen, W.; Pulit, S.L.; Kenna, K.P.; van den Berg, L.H.; Veldink, J.H.; On behalf of the Project MinE ALS Sequencing Consortium. The Project MinE databrowser: Bringing large-scale whole-genome sequencing in ALS to researchers and the public. Amyotroph. Lateral Scler. Front. Degener. 2019, 20, 432–440. [Google Scholar] [CrossRef]
- Farhan, S.M.; Howrigan, D.P.; Abbott, L.E.; Klim, J.R.; Topp, S.D.; Byrnes, A.E.; Churchhouse, C.; Phatnani, H.; Smith, B.N.; Rampersaud, E.; et al. Exome sequencing in amyotrophic lateral sclerosis implicates a novel gene, DNAJC7, encoding a heat-shock protein. Nat. Neurosci. 2019, 22, 1966–1974. [Google Scholar] [CrossRef]
- Al Khleifat, A.; Iacoangeli, A.; Shatunov, A.; Fang, T.; Sproviero, W.; Jones, A.R.; Opie-Martin, S.; Morrison, K.E.; Shaw, P.J.; Shaw, C.E.; et al. Telomere length is greater in ALS than in controls: A whole genome sequencing study. Amyotroph. Lateral Scler. Front. Degener. 2019, 20, 229–234. [Google Scholar] [CrossRef]


| Training | Validation | |||||||
|---|---|---|---|---|---|---|---|---|
| # of Genes | Precision | Recall | # of Genes | Precision | Recall | Fold-Change Enrichment | Number of Significantly Enriched Folds | |
| ALSoD | 60–61 | 0.23 (0.16) | 0.55 (0.09) | 15–16 | 0.07 (0.08) | 0.45 (0.17) | 23.33 (23.53) | 5/5 |
| ClinVar | 29–30 | 0.16 (0.09) | 0.86 (0.04) | 7–8 | 0.05 (0.02) | 0.82 (0.17) | 30.05 (15.64) | 5/5 |
| DisGeNet | 54–55 | 0.44 (0.33) | 0.23 (0.16) | 13–14 | 0.15 (0.22) | 0.09 (0.08) | 55.90 (81.66) | 2/5 |
| Manual | 21–22 | 0.27 (0.01) | 0.85 (0.04) | 5–6 | 0.09 (0.01) | 0.86 (0.14) | 84.54 (13.27) | 5/5 |
| Union | 96 | 0.16 (0.04) | 0.73 (0.05) | 24 | 0.04 (0.02) | 0.67 (0.07) | 8.92 (4.28) | 5/5 |
| Ensembl Gene Name | Ensembl Transcript Name | Chr | Transcript Start | Transcript End | Strand | ClinVar Genes | ClinVar Predictions | DisGeNet Genes | DisGeNet Predictions | ALSoD Genes | ALSoD Predictions | |
|---|---|---|---|---|---|---|---|---|---|---|---|---|
| ALS2 | ENSG00000003393 | ENST00000489440 | 2 | 202581364 | 202591275 | − | TRUE | FALSE | TRUE | FALSE | TRUE | FALSE |
| BCL2L1 | ENSG00000171552 | ENST00000307677 | 20 | 30252254 | 30310701 | − | FALSE | TRUE | TRUE | FALSE | FALSE | TRUE |
| BSG | ENSG00000172270 | ENST00000573216 | 19 | 572571 | 581376 | + | FALSE | TRUE | TRUE | FALSE | FALSE | TRUE |
| CASP1 | ENSG00000137752 | ENST00000436863 | 11 | 104896234 | 104905977 | − | FALSE | TRUE | TRUE | FALSE | FALSE | TRUE |
| CHMP2B | ENSG00000083937 | ENST00000466696 | 3 | 87302198 | 87303063 | + | TRUE | FALSE | TRUE | FALSE | TRUE | FALSE |
| CLU | ENSG00000120885 | ENST00000522413 | 8 | 27463898 | 27472209 | − | FALSE | TRUE | TRUE | FALSE | FALSE | TRUE |
| CNTF | ENSG00000242689 | ENST00000361987 | 11 | 58390145 | 58393198 | + | TRUE | FALSE | TRUE | FALSE | TRUE | FALSE |
| CREBBP | ENSG00000005339 | ENST00000574740 | 16 | 3786508 | 3794958 | − | FALSE | TRUE | TRUE | FALSE | FALSE | TRUE |
| CST3 | ENSG00000101439 | ENST00000398409 | 20 | 23614293 | 23619110 | − | FALSE | TRUE | TRUE | FALSE | TRUE | FALSE |
| CTSD | ENSG00000117984 | ENST00000438213 | 11 | 1775253 | 1782770 | − | FALSE | TRUE | TRUE | FALSE | FALSE | TRUE |
| DPP6 | ENSG00000130226 | ENST00000377770 | 7 | 153749764 | 154685161 | + | FALSE | TRUE | TRUE | FALSE | TRUE | FALSE |
| ERBB4 | ENSG00000178568 | ENST00000484594 | 2 | 212426486 | 213403306 | − | TRUE | FALSE | TRUE | FALSE | TRUE | FALSE |
| FOS | ENSG00000170345 | ENST00000556324 | 14 | 75745530 | 75746234 | + | FALSE | TRUE | TRUE | FALSE | FALSE | TRUE |
| GDI1 | ENSG00000203879 | ENST00000465640 | X | 153670112 | 153671075 | + | FALSE | TRUE | TRUE | FALSE | FALSE | TRUE |
| GFAP | ENSG00000131095 | ENST00000253408 | 17 | 42982993 | 42992920 | − | FALSE | TRUE | TRUE | FALSE | FALSE | TRUE |
| GLE1 | ENSG00000119392 | ENST00000309971 | 9 | 131266978 | 131304567 | + | FALSE | TRUE | TRUE | FALSE | TRUE | FALSE |
| GSR | ENSG00000104687 | ENST00000221130 | 8 | 30535582 | 30585443 | − | FALSE | TRUE | TRUE | FALSE | FALSE | TRUE |
| GSTP1 | ENSG00000084207 | ENST00000489040 | 11 | 67351604 | 67352535 | + | FALSE | TRUE | TRUE | FALSE | FALSE | TRUE |
| GSX2 | ENSG00000180613 | ENST00000326902 | 4 | 54966197 | 54968672 | + | FALSE | TRUE | TRUE | FALSE | FALSE | TRUE |
| HSF1 | ENSG00000185122 | ENST00000529630 | 8 | 145532954 | 145533780 | + | FALSE | TRUE | TRUE | FALSE | FALSE | TRUE |
| INA | ENSG00000148798 | ENST00000369849 | 10 | 105036919 | 105050108 | + | FALSE | TRUE | TRUE | FALSE | FALSE | TRUE |
| JAK3 | ENSG00000105639 | ENST00000526008 | 19 | 17949078 | 17958841 | − | FALSE | TRUE | TRUE | FALSE | FALSE | TRUE |
| JUND | ENSG00000130522 | ENST00000600972 | 19 | 18390828 | 18391739 | − | FALSE | TRUE | TRUE | FALSE | FALSE | TRUE |
| KIF3C | ENSG00000084731 | ENST00000455394 | 2 | 26149470 | 26205366 | − | FALSE | TRUE | TRUE | FALSE | FALSE | TRUE |
| LAT | ENSG00000213658 | ENST00000566415 | 16 | 29000897 | 29001776 | + | FALSE | TRUE | TRUE | FALSE | FALSE | TRUE |
| LDLR | ENSG00000130164 | ENST00000560467 | 19 | 11215982 | 11224300 | + | FALSE | TRUE | TRUE | FALSE | FALSE | TRUE |
| PARK7 | ENSG00000116288 | ENST00000465354 | 1 | 8021807 | 8031581 | + | TRUE | FALSE | TRUE | FALSE | FALSE | FALSE |
| PLA2G4A | ENSG00000116711 | ENST00000466600 | 1 | 186823417 | 186908362 | + | FALSE | TRUE | TRUE | FALSE | FALSE | TRUE |
| PPARGC1A | ENSG00000109819 | ENST00000264867 | 4 | 23793643 | 23891700 | − | FALSE | TRUE | TRUE | FALSE | FALSE | TRUE |
| PRPH | ENSG00000135406 | ENST00000551194 | 12 | 49687034 | 49687780 | + | TRUE | FALSE | TRUE | FALSE | TRUE | FALSE |
| RXRA | ENSG00000186350 | ENST00000484822 | 9 | 137208943 | 137298240 | + | FALSE | TRUE | TRUE | FALSE | FALSE | TRUE |
| SELPLG | ENSG00000110876 | ENST00000228463 | 12 | 109016604 | 109025854 | − | FALSE | TRUE | TRUE | FALSE | FALSE | TRUE |
| SHC1 | ENSG00000160691 | ENST00000448116 | 1 | 154934773 | 154943223 | − | FALSE | TRUE | TRUE | FALSE | FALSE | TRUE |
| SLC1A2 | ENSG00000110436 | ENST00000531628 | 11 | 35287147 | 35323075 | − | FALSE | TRUE | TRUE | FALSE | TRUE | FALSE |
| SNAI1 | ENSG00000124216 | ENST00000244050 | 20 | 48599535 | 48605423 | + | FALSE | TRUE | TRUE | FALSE | FALSE | TRUE |
| SOD2 | ENSG00000112096 | ENST00000541573 | 6 | 160103513 | 160113110 | − | FALSE | TRUE | TRUE | FALSE | TRUE | FALSE |
| TIAM1 | ENSG00000156299 | ENST00000455508 | 21 | 32638611 | 32716594 | − | FALSE | TRUE | TRUE | FALSE | FALSE | TRUE |
| TLE3 | ENSG00000140332 | ENST00000557815 | 15 | 70341315 | 70351129 | − | FALSE | TRUE | TRUE | FALSE | FALSE | TRUE |
| TMSB4X | ENSG00000205542 | ENST00000451311 | X | 12993226 | 12995346 | + | FALSE | TRUE | TRUE | FALSE | FALSE | TRUE |
| TNF | ENSG00000232810 | ENST00000449264 | 6 | 31543344 | 31546113 | + | FALSE | TRUE | TRUE | FALSE | FALSE | TRUE |
| TP53 | ENSG00000141510 | ENST00000574684 | 17 | 7577571 | 7578437 | − | FALSE | TRUE | TRUE | FALSE | FALSE | TRUE |
| TRPM7 | ENSG00000092439 | ENST00000558444 | 15 | 50867155 | 50874661 | − | TRUE | FALSE | TRUE | FALSE | TRUE | FALSE |
| VIM | ENSG00000026025 | ENST00000544301 | 10 | 17270257 | 17279584 | + | FALSE | TRUE | TRUE | FALSE | FALSE | TRUE |
| WNT7A | ENSG00000154764 | ENST00000285018 | 3 | 13857754 | 13921618 | − | FALSE | TRUE | TRUE | FALSE | FALSE | TRUE |
| XIAP | ENSG00000101966 | ENST00000496602 | X | 123046609 | 123047465 | + | FALSE | TRUE | TRUE | FALSE | FALSE | TRUE |
| Rank | DisGeNet | ALSoD | Manual | ClinVar | Union |
|---|---|---|---|---|---|
| 1 | Smooth muscle contraction | Peripheral nervous system development | Erythrocyte differentiation | Cardiac muscle tissue development | Peripheral nervous system development |
| 2 | Response to xenobiotic stimulus | Response to xenobiotic stimulus | Translational termination | Nuclear migration | Protein localization to Golgi apparatus |
| 3 | Response to antibiotic | Phosphatidylcholine metabolic process | Phospholipid catabolic process | Nucleus localization | Response to antibiotic |
| 4 | Tissue remodelling | Inactivation of MAPK activity | Regulation of transcription from RNA polymerase II promoter in response to stress | Heart contraction | Regulation of neuron death |
| 5 | Sprouting angiogenesis | Ammonium transport | Response to heat | Cellular component assembly involved in morphogenesis | Mitochondrial fusion |
| 6 | Peripheral nervous system development | Protein localization to Golgi apparatus | Endosome transport via multivesicular body sorting pathway (GO:0032509) | Myofibril assembly | Response to mechanical stimulus |
| 7 | Response to hypoxia | Response to antibiotic | Multivesicular body sorting pathway | Response to mechanical stimulus | Regulation of phosphatidylinositol 3-kinase signalling |
| 8 | Regulation of blood pressure | Triglyceride homeostasis | Glutathione metabolic process | Skeletal muscle contraction | Ammonium transport |
| 9 | Ammonium transport | Behaviour | Regulation of cysteine-type endopeptidase activity | Protein homooligomerization | Regulation of phospholipase activity |
| 10 | Regulation of phospholipase activity | Ammonium ion metabolic process | Cellular modified amino acid metabolic process | Muscle structure development | Regulation of lipase activity |
| 11 | Phospholipase C-activating G protein-coupled receptor signalling pathway | Positive regulation of lipase activity | Wnt signalling pathway | Cellular lipid catabolic process | Protein targeting to the vacuole |
| 12 | Regulation of mitochondrion organization | Organophosphate ester transport | Apoptotic process | Synapse organization | Phospholipase C-activating G protein-coupled receptor signalling pathway |
| 13 | Positive regulation of protein kinase B signalling | Phospholipid transport | Cell death | Lipid catabolic process | Positive regulation of blood pressure |
| 14 | Response to oxidative stress | Phospholipase C-activating G protein-coupled receptor signalling pathway | Sulfur compound metabolic process | Circulatory system process | Action potential |
| 15 | Regulation of lipase activity | Positive regulation of the cellular catabolic process | Response to abiotic stimulus | Actomyosin structure organization | Membrane protein proteolysis |
| 16 | Superoxide metabolic process | Regulation of neurotransmitter levels | Positive regulation of DNA-binding transcription factor activity | Cell-cell adhesion via plasma-membrane adhesion molecules | Behaviour |
| 17 | Membrane protein proteolysis | Regulation of trans-synaptic signalling | Response to cytokine | Regulation of canonical Wnt signalling pathway | Protein localization to the vacuole |
| 18 | Behaviour | Regulation of lipase activity | Positive regulation of molecular function | Negative regulation of the apoptotic process | Vacuolar transport |
| 19 | Glycolytic process | Glutamate receptor signalling pathway | Cell surface receptor signalling pathway | Circulatory system development | Ammonium ion metabolic process |
| 20 | Cyclic nucleotide metabolic process | Response to drug | Regulation of molecular function | Maintenance of location | Regulation of trans-synaptic signalling |
| Rank | DisGeNet | ALSoD | Manual | ClinVar | Union |
|---|---|---|---|---|---|
| 1 | Parkinson disease (PRKN;NR4A2;PINK1;UCHL1;TBP;HTRA2;MAPT;SNCAIP;FBXO7;SNCA) | Parkinson disease (PRKN;NR4A2;PINK1;UCHL1;TBP;HTRA2;DBH;SNCAIP;FBXO7;SNCA) | Amyotrophic lateral sclerosis (ALS2;CHMP2B;TRPM7;PRPH) | Cardiomyopathy(DSP;MYBPC3;CAV3;ACTN2;TPM1;LDB3;ABCC9;PSEN1;TAZ;TTN;PLN;SGCD;DES;ACTC1;MYL2;LMNA;MYL3;TCAP;TNNI3;DMD;SCN5A;MYH6;VCL;MYH7) | Cardiomyopathy (DSP;MYBPC3;CAV3;ACTN2;TPM1;PSEN2;LDB3;ABCC9;TAZ;TTN;PLN;SGCD;DES;ACTC1;MYL2;LMNA;MYL3;TCAP;TNNI3;DMD;SCN5A;MYH6;VCL;MYH7) |
| 2 | Dystonia (SGCE;GCH1;PRKRA;ATP1A3;DRD2;THAP1;TAF1) | Alzheimer′s disease (APP;NOS3;PSEN2;APBB2;BLMH;A2M;MPO;SORL1) | Frontotemporal dementia (CHMP2B;TRPM7;TNF) | Cardiomyopathy, dilated (DSP;MYBPC3;ACTN2;TPM1;LDB3;ABCC9;PSEN1;TAZ;TTN;PLN;SGCD;DES;ACTC1;LMNA;TCAP;TNNI3;DMD;SCN5A;VCL;MYH7) | Cardiomyopathy, dilated (DSP;MYBPC3;ACTN2;TPM1;PSEN2;LDB3;ABCC9;TAZ;TTN;PLN;SGCD;DES;ACTC1;LMNA;TCAP;TNNI3;DMD;SCN5A;VCL;MYH7) |
| 3 | Diabetes (IL6;EPO;IRS1;HFE;INSR;IRS2;PPARG;SLC2A4;GCK) | Dystonia (SGCE;GCH1;PRKRA;ATP1A3;DRD2;THAP1;TAF1) | Charcot-Marie-Tooth disease (PRPS1;MTMR2;EGR2;HSPB8;LITAF;NDRG1;DNM2;MPZ;LMNA;MFN2;NEFL;KIF1B;GARS;SBF2) | Ataxia (PRKCG;TBP;ABCB7;FMR1;KCNA1;ITPR1;SLC1A3;CP;APTX;SYNE1;TTBK2;ATCAY;CACNB4;ATXN1;ATXN7;PPP2R2B;TDP1;SACS;ATXN10;FXN;POLG;SPTBN2) | |
| 4 | Diabetes mellitus, type 2 (IRS1;INSR;IRS2;PPARG;SLC2A4;GCK) | Schizophrenia (CHRNA7;DTNBP1;AKT1;MTHFR;NRG1;HTR2A;COMT) | Neuropathy (EGR2;CTDP1;HSPB8;BSCL2;SPTLC1;GAN;WNK1;MPZ;TDP1;PRX;MFN2;GARS;CCT5;POLG) | Charcot-Marie-Tooth disease (PRPS1;MTMR2;EGR2;HSPB8;LITAF;NDRG1;DNM2;MPZ;LMNA;MFN2;NEFL;KIF1B;SBF2) | |
| 5 | Alzheimer disease (NOS3;HFE;PSEN1;MPO) | Colorectal cancer (PLA2G2A;AKT1;BAX;CTNNB1;TLR4;TP53) | Cardiomyopathy, hypertrophic (MYBPC3;ACTC1;CAV3;MYL2;TPM1;MYL3;TNNI3;MYH6;TTN;MYH7) | Cardiomyopathy, hypertrophic (MYBPC3;ACTC1;CAV3;MYL2;TPM1;MYL3;TNNI3;MYH6;TTN;MYH7) |
| p-Value | Predicted (n) | Mapped (n) | Validated (n) | Significant genes (p-Value) | Magma Gene set p-Value | |
|---|---|---|---|---|---|---|
| DisGeNet | 0.49 | 176 | 166 | 1 | ATXN3 (6.8 × 10⁻⁷) | 0.44 |
| ALSoD | 0.33 | 327 | 305 | 2 | SCFD1 (5.4 × 10⁻⁷) ATXN3 (6.8 × 10⁻⁷) | 0.24 |
| Manual | 0.060 (0.33) | 45 | 41 | 2 (1) | WNT7A (0.00019) ZFP91-CNTF* (0.00091) | 0.057 |
| ClinVar | 0.038 | 192 | 170 | 3 | WNT7A (0.00019) SCFD1(5.4 × 10⁻⁷) UNC13A (2.9 × 10⁻⁶) | 0.065 |
| Union | 0.67 | 575 | 534 | 1 | ATXN3 (6.8 × 10⁻⁷) | 0.72 |
© 2020 by the authors. Licensee MDPI, Basel, Switzerland. This article is an open access article distributed under the terms and conditions of the Creative Commons Attribution (CC BY) license (http://creativecommons.org/licenses/by/4.0/).
Share and Cite
Bean, D.M.; Al-Chalabi, A.; Dobson, R.J.B.; Iacoangeli, A. A Knowledge-Based Machine Learning Approach to Gene Prioritisation in Amyotrophic Lateral Sclerosis. Genes 2020, 11, 668. https://doi.org/10.3390/genes11060668
Bean DM, Al-Chalabi A, Dobson RJB, Iacoangeli A. A Knowledge-Based Machine Learning Approach to Gene Prioritisation in Amyotrophic Lateral Sclerosis. Genes. 2020; 11(6):668. https://doi.org/10.3390/genes11060668
Chicago/Turabian StyleBean, Daniel M., Ammar Al-Chalabi, Richard J. B. Dobson, and Alfredo Iacoangeli. 2020. "A Knowledge-Based Machine Learning Approach to Gene Prioritisation in Amyotrophic Lateral Sclerosis" Genes 11, no. 6: 668. https://doi.org/10.3390/genes11060668
APA StyleBean, D. M., Al-Chalabi, A., Dobson, R. J. B., & Iacoangeli, A. (2020). A Knowledge-Based Machine Learning Approach to Gene Prioritisation in Amyotrophic Lateral Sclerosis. Genes, 11(6), 668. https://doi.org/10.3390/genes11060668