Article

rps3 as a Candidate Mitochondrial Gene for the Molecular Identification of Species from the Colletotrichum acutatum Species Complex

by
Agnieszka Pszczółkowska
1,†,
Piotr Androsiuk
2,*,†,
Jan Paweł Jastrzębski
2,
Łukasz Paukszto
2 and
Adam Okorski
1
1
Department of Entomology, Phytopathology and Molecular Diagnostics, University of Warmia and Mazury in Olsztyn, ul. Prawocheńskiego 17, 10-720 Olsztyn, Poland
2
Department of Plant Physiology, Genetics and Biotechnology, University of Warmia and Mazury in Olsztyn, ul. Oczapowskiego 1A, 10-719 Olsztyn, Poland
*
Author to whom correspondence should be addressed.
These authors contributed equally to this work.
Genes 2020, 11(5), 552; https://doi.org/10.3390/genes11050552
Submission received: 5 March 2020 / Revised: 7 May 2020 / Accepted: 12 May 2020 / Published: 14 May 2020
(This article belongs to the Section Microbial Genetics and Genomics)

Abstract

:
Colletotrichum species form one of the most economically significant groups of pathogenic fungi and lead to significant losses in the production of major crops—in particular, fruits, vegetables, ornamental plants, shrubs, and trees. Members of the genus Colletotrichum cause anthracnose disease in many plants. Due to their considerable variation, these fungi have been widely investigated in genetic studies as model organisms. Here, we report the complete mitochondrial genome sequences of four Colletotrichum species (C. fioriniae, C. lupini, C. salicis, and C. tamarilloi). The reported circular mitogenomes range from 30,020 (C. fioriniae) to 36,554 bp (C. lupini) in size and have identical sets of genes, including 15 protein-coding genes, two ribosomal RNA genes, and 29 tRNA genes. All four mitogenomes are characterized by a rather poor repetitive sequence content with only forward repeat representatives and a low number of microsatellites. The topology of the phylogenetic tree reflects the systematic positions of the studied species, with representatives of each Colletotrichum species complex gathered in one clade. A comparative analysis reveals consistency in the gene composition and order of Colletotrichum mitogenomes, although some highly divergent regions are also identified, like the rps3 gene which appears as a source of potential diagnostic markers for all studied Colletotrichum species.

1. Introduction

Members of the genus Colletotrichum pose one of the greatest threats to the health of host plants around the world. According to previous research, Colletotrichum species are the eighth most economically significant group of pathogenic fungi in the world [1,2,3]. Nearly all cultivated plants are susceptible to infections caused by one or more species of Colletotrichum [1,4]. These fungi cause significant losses in the production of major crops—in particular, fruits, vegetables, ornamental plants, shrubs, and trees. Members of Colletotrichum cause anthracnose, a disease that leads to the formation of dark spots on the aboveground plant parts (leaves, shoots, and pods) and causes fruit and vegetable rot [1,4,5,6,7]. Colletotrichum species also cause losses in agricultural raw materials and crops stored after harvest, due to undetected latent infections that develop during storage [7,8].
There are many blind spots in the taxonomy of the pathogenic fungi of Colletotrichum due to differences in the applied evaluation criteria. The reported number of Colletotrichum species ranges from 29 to more than 700 [1,9,10], and 889 records have been entered into the Index Fungorum database to date [11] The genus Colletotrichum has been regarded as a model organism for hemibiotrophic pathogens, with a brief biotrophic phase followed by a necrotrophic phase of infection [1]. Colletotrichum species rely on various infection strategies, including biotrophic, necrotrophic, hemibiotrophic, and endophytic, to colonize the tissues of a host organism and derive nutrients [7,12]. Due to their considerable variations, these pathogens have also been widely investigated as model organisms in genetic studies. Multilocus phylogenetic studies of Colletotrichum support the presence of at least 10 large clades, including C. acutatum, C. gloeosporioides, and C. boninense species complexes comprising at least 28, 22, and 17 species, respectively [5]. Colletotrichum species identified within the major clades differ significantly in their ability to infect host plants. The C. acutatum complex includes polyphagous species such as C. nymphaeae, C. simmondsii, and C. fioriniae, as well as C. salicis, which has a preference for woody hosts [6], C. lupini, which infects lupines [13], and C. tamarilloi, which only targets potatoes [6]. Pszczółkowska et al. [14,15] isolated C. fioriniae from highbush blueberry and common beech. The cited authors also identified C. lupini in the seeds of various lupine species [16,17]. Okorski et al. [18] confirmed an infection caused by C. salicis in willow shoots based on morphological identification and an analysis of selected gene sequences. Baroncelli et al. [19] reported on the plasticity of fungal genomes and observed that changes in gene structures are largely influenced by the spectrum of host plants. The C. acutatum species complex is varied but is also closely related to the group of fungal plant pathogens. It is characterized by significant variations in major traits, including the range of host plants, host preferences, mode of reproduction, and infection strategies. In comparative analyses of fungal genomes, attempts have been made to link specific genes with the evolutionary patterns of fungal species [20]. The next point of concern is the precise identification of fungal species. Although, for many species, a multilocus DNA barcode system is available for which both mitochondrial and nucleic sequences have been exploited [21], there are still a number of taxa, including those from the genus Colletotrichum, for which there is a strong need to develop an efficient tool for phylogenetic inference and species identification [6].
The aim of this study was to report the complete mitochondrial (mt) genome sequences of four Colletotrichum species (C. fioriniae, C. lupini, C. salicis, and C. tamarilloi) and to compare them with other publicly available mt genomes of the Colletotrichum species to identify the characteristic features of the sequenced genomes and their possible applications in genetic diversity studies and species identification.

2. Materials and Methods

2.1. Fungal Isolate and DNA Extraction

The Colletotrichum isolates used in this study were derived from various plant species collected in Poland and from the CBS (Central Bureau of Fungal Cultures) Westerdijk Fungal Biodiversity Institute, Utrecht, the Netherlands. C. lupini CBS 119142 was derived from Lupinus albus in Elsenburg (South Africa, 1995), C. fioriniae isolate Cf.60.014.DDPP was derived from Vaccinium corymbosum leaves (Poland, 2014), C. salicis SP17/2016 was isolated from S. vinimalis × S. schwerini shoots (Poland), and C. tamarilloi CBS 129814 (Solanum betaceum was taken from fruit anthracnose, Cundinamarca (Colombia, 2012). Fungal cultures were grown in 90 mm sterile Petri dishes with PDA (Potato Dextrose Agar) medium. For DNA extraction, the mycelium of the species studied was scraped off the plates. Genomic DNA was extracted from 10-day Colletotrichum cultures, which were grated (homogenized) using a pestle and mortar in liquid nitrogen and proceeded according to the protocol using a Maxwell® 16 FFS Nucleic Acid Extraction System, Customs X9431 (Promega GMBH, Madison, WI, USA).

2.2. DNA Sequencing, Assembly, and Annotation of the Mitogenomes

Genome libraries were prepared from the genomic DNA using a Nextera XT kit (Illumina Inc., San Diego, CA, USA). Prepared libraries were sequenced on the Illumina MiSeq Platform (Illumina Inc., San Diego, CA, USA) with a 150 bp paired-end read. The trimmed reads were mapped to the reference of the complete mitochondrial genome of Colletotrichum acutatum using Geneious Mapper (ver. 8.0.4) [22] with “Medium-Low Sensitivity” parameters. Reads aligned to the reference mtDNA genome were extracted and used for de novo assembly (K-mer—23–41, low coverage cut-off—5, minimum contig length—300) separately for each Colletotrichum species. De novo contigs were extended by mapping raw reads to the generated contigs, reassembling the contigs with mapped reads, and manually scaffolding the extended contigs (minimum sequence overlap of 50 bp and 97% overlap identity). This process was iterated five times. Finally, the reduced sequences were assembled in the circular mitochondrial genome for each of the four species. The mitochondrial genomes were annotated using MFannot [23] and PlasMapper [24] with manual adjustments.

2.3. Characteristic and Comparative Analysis of the Mitogenomes

The complete mitochondrial genomes of Colletotrichum fioriniae, C. lupini, C. salicis, and C. tamarilloi from the C. acutatum species complex were characterized in terms of their size and composition. Furthermore, the gene contents and orders of the four referred mitogenomes were compared to those of previously published mitochondrial genomes of other representatives of the genus Colletotrichum. For that purpose, the mitogenomes of seven Colletotrichum species were downloaded from GenBank: C. acutatum, four representatives of the C. gloeosporioides species complex (C. aenigma, C. fructicola, C. gloeosporioides, and C. siamense), C. graminicola (C. graminicola species complex), and C. lindemuthianum (C. orbiculare species complex) (Table 1). In order to analyze the interspecific variation among the five representatives of the Colletotrichum acutatum species complex, a comparison of their mitochondrial genomes was performed using the mVISTA program, with the application of the Shuffle-LAGAN mode [25]. C. acutatum was set as a reference. Moreover, to check whether the representatives of Colletotrichum gloeosporioides species complex, C. graminicola and C. lindemuthianum, share conserved regions with C. acutatum, their sequences were also included in the analysis. The comparison was performed on mitogenome sequences aligned by MAFFT v7.310 [26].
An analysis of the evolutionary rates of genes shared by the abovementioned 11 species of the genus Colletotrichum was also performed. The group of 15 genes was selected to estimate the ratio of non-synonymous (Ka) to synonymous (Ks) substitutions. These genes were extracted and aligned separately using MAFFT v7.310. The Ka and Ks for each of the shared genes were estimated in DnaSP [31]. Since the reported sequences of the Colletotrichum species belong to the C. acutatum species complex, all selected sequences from the analyzed mitochondrial genomes were compared with those from the mitogenome of C. acutatum.

2.4. Identification of Repetitive Elements

The REPuter program [32] was used to detect and assess genomic repeats, including forward, reverse, palindromic, and complementary sequences with a minimal length of 30 bp, a Hamming distance of 3, and 90% sequence identity. Mitochondrial simple sequence repeats (SSR) or microsatellites were identified in Phobos v.3.3.12 [33] with default settings for perfect SSRs with a motif size of one to six nucleotide units. Standard thresholds for the identification of mitochondrial SSRs were applied [34], i.e., a minimum of 12 repeat units for mononucleotide SSRs, six repeat units for dinucleotide SSRs, four repeat units for trinucleotide SSRs, and three repeat units for tetra-, penta-, and hexanucleotide SSRs.

2.5. Phylogenetic Analysis

Phylogenetic analyses were performed on sequences of 15 protein-coding genes shared by 46 fungi species belonging the Sordariomycetes class, including 11 Colletotrichum species and two species of Penicillium as an outgroup. The appropriate sequences were downloaded from the NCBI database (Table S1). The chosen sequences were aligned in MAFFT v7.310. Bayesian Inference (BI) and Maximum-Likelihood (ML) methods were used for genome-wide phylogenetic analyses in MrBayes v.3.2.6 [35,36] and PhyML 3.0 [37]. Before BI and ML analysis, the best fitting substitution model was searched for in Mega 7 [38], and the GTR + G + I model was selected. A BI partitioning analysis was carried out to develop a majority rule consensus tree with 1 × 10⁷ generations using the Markov Chain Monte Carlo (MCMC) method. The tree sampling frequency was 1000 generations. The first 2500 trees were discarded as burn-in, with a random starting tree. The ML analysis was performed in PhyML 3.0 with 1000 bootstrap replicates.
In order to infer the phylogeny of the rps3 gene, an analogical approach was applied. However, in the case of the set of rps3 sequences derived from 44 species representing Sordariomycetes and two Penicillium species, Mega 7 software marked out the GTR + G substitution model as the optimal model, and therefore, it was applied in the BI and ML analyses. A detailed comparison of rps3 nucleotide sequences from 11 representatives of Colletotrichum was also performed. For this purpose, Geneious software was applied. As a consequence, polymorphic regions within the gene were identified and characterized.

3. Results

3.1. Genome Size and Organization

Four Colletotrichum species were sequenced to produce 1,557,270 (C. lupini), 1,769,902 (C. tamarilloi), 1,918,044 (C. fioriniae), and 4,983,140 (C. salicis) raw reads with lengths ranging from 150 to 300 bp. These were then mapped separately to the reference genome of C. acutatum (NC_027280). Obtained contigs were enlarged and assembled de novo to build the final complete circular mtDNA of each species. The six Colletotrichum mt genome sequences were then submitted to GenBank and acquired the following accession numbers: NC_030052 for C. fiorinae, NC_029213 for C. lupini, NC_035496 for C salicis, and NC_029706 for C. tamarilloi.
The complete mitochondrial genomes of Colletotrichum fioriniae, C. lupini, C. salicis, and C. tamarilloi appeared as circular molecules with sequence lengths ranging from 30,020 bp (C. fioriniae) to 36,554 bp (C. lupini) (Table 2). For C. salicis and C. lupini, the mitogenomes notably exceeded the average length of the mt genome observed within the C. acutatum species complex, which, for C. acutatum, C. fioriniae, C. lupini, C. salicis and C. tamarilloi, was 32,448 ± 2742 bp (SD). These species had mitogenomes closer to those found in C. graminicola and C. lindemuthianum. On the other hand, the average size of the mitogenome within the C. gloeosporioides species complex (estimated for C. gloeosporioides, C. aenigma, C. fructicula, and C. siamense) was almost two-fold bigger (1.72) than the average size of the mt genome within the C. acutatum species complex. The lengths of noncoding regions seemed to be the main contributors to the observed differences, as was shown by the very similar values of the total length of coding sequences (CDS) observed for the C. gloeosporioides species complex and the C. acutatum species complex.
The GC content within the C. acutatum species complex was found to be at a rather low level and spread within the range from 29.91% (C. lupini) to 30.5% (C. tamarilloi), similar to the values of that trait found for C. graminicola and C. lindemuthianum. Analogically to the mt genome size, the representatives of the C. gloeosporioides species complex were characterized by higher GC contents, which, in all cases, exceeded 34% (Table 2).
In order to analyze the overall sequence conservation, to detect the diverged regions in the mitochondrial genomes of representatives of the C. acutatum species complex (C. acutatum, C. fioriniae, C. lupini, C. salicis, C. tamarilloi), and to check whether the representatives of the Colletotrichum gloeosporioides species complex as well as C. graminicola and C. lindemuthianum share conserved regions with C. acutatum, the mVISTA tool was applied. The aligned sequences revealed high similarity for the mt genomes within the C. acutatum species complex and clear divergence between the C. acutatum species complex and other representatives of Colletotrichum (C. gloeosporioides species complex, C. graminicola, and C. lindemuthianum). Moreover, the coding regions appeared to be more conserved than their non-coding counterparts in all analyzed species (Figure S1).
For all 11 analyzed mitogenome sequences, 14 protein-coding genes were found to be conserved among fungi, including seven subunits of the electron transport complex I (nad1, nad2, nad3, nad4, nad4L, nad5, and nad6), one subunit of complex III (cob), three subunits of complex IV (cox1, cox2, and cox3), and three subunits of the ATP-synthase complex (atp6, atp8, and atp9) (Figure 1). Moreover, the rps3 gene, which encodes the 40S ribosomal protein S3, as well as genes for large and small ribosomal RNA (rnl and rns, respectively) were identified in all reported mt genomes. The sequence for the rps3 gene was located within the intron of rnl. Reanalysis of mt genomes of C. graminicola (NW_007361658) and C. lindemuthianum (NC_023540) allowed us to identify previously unannotated rnl and rns in both species in the following locations: rnl (28,092–33,124) and rns (22,173–23,805) in C. graminicola, and rnl (15,745–20,963) in C. lindemuthianum. The order of the 15 abovementioned protein-coding genes and the two ribosomal RNA genes was highly conserved among the studied representatives of the C. acutatum species complex and C. gloeosporioides species complex. Some differences were observed in the gene order of C. graminicola and C. lindemuthianum, reflecting their taxonomical affiliations (Figure 1). Furthermore, for C. graminicola and C. lindemuthianum, annotations for two additional protein-coding sequences were found within their mitogenomes: DNA polymerase in C. graminicola [29] and GIY endonuclease in the case of C. lindemuthianum [30]. Reannotation of the C. lindemuthianum mt genome revealed the presence of a group IA intron containing hypothetical ORF within the cob gene; however, the presence of maturase in that location [30] was not confirmed.
All four Colletotrichum mitogenomes reported here (C. fioriniae, C. lupini, C. salicis and C. tamarilloi) included 29 tRNA genes (trn) that recognize codons for all amino acids; however, the composition differed slightly between species (Figure 1). For C. fioriniae and C. tamarilloi, there were 23 tRNA genes with a single copy and an additional four (trnC-GCA, trnK-TTT, trnR-ACG, and trnN-GTT) were doubled, whereas trnM-CAT had three copies. Within the mitogenome of C. lupini, there was a lack of one copy of trnR-ACG; however, an additional copy of trnS-GCT was found. An expansion in the number of copies of tRNA genes was also observed in C. salicis in which three copies of trnK-TTT were observed; however, this was accompanied by the deletion of one copy of trnN-GTT. The tRNA gene composition and order of C. acutatum was identical to that observed for C. fioriniae and C. tamarilloi, with one exception—the trnR-ACG gene was not present. For the remaining Colletotrichum species representatives, the number of tRNA sequences within the mitogenome ranged from 25 to 28, which was enough to provide a sufficient number of trn sequences that recognize codons for all amino acids (Figure 1). However, the exception was C. graminicola, where the trn for tryptophan was replaced by the trn for selenocysteine [29].
All mitochondrial genes of C. fioriniae, C. lupini, C. salicis, and C. tamarilloi were transcribed from the same DNA strand. The same analogical situation has been described for other sequenced mt genomes of Colletotrichum spp., with the exception of C. graminicola, where the sequence for DNA polymerase was encoded on a complementary strand. A detailed analysis of the mitogenomes showed that, in all studied species, there was only one example of sequence overlap: a 10 nt overlap in the trnV-TAC by the nad6 sequence.
The majority of protein-coding genes start with the typical AUG codon and terminate with either UAA or UAG (cox1, cox3 and/or nad6). However, in the case of cox3 for C. gloeosporioides, C. aenigma, C. fructicola, and C. siamense, as well as in the atp6 sequence in C. graminicola, alternative start codons, UUG and AUU, were found, respectively (Table 2). The codon usage frequencies were generally similar among all eleven Colletotrichum mitogenomes (Table S2). The most frequently used codons were UUA (L, 11.29–11.87%), AUA (I, 6.06–6.93%), and UUU (F, 5.1–5.81%). There were also codons (AUU, UUG, CGC, CGG, UGG, CUC, and AGG) found only in a portion of the studied mitogenomes, among which AUU deserves special attention, since it was found within only one species (C. graminicola). Furthermore, three codons CUC, UUG, and CGC have a potentially diagnostic character and can be used to distinguish the members of the C. acutatum species complex from those of the C. gleosporioides species complex, since they were found in only one group, while they were completely absent in the other.
Only one intron was found in the C. fioriniae, C. lupini, and C. tamarilloi mitochondrial genes, each time within the rnl sequence. An analysis of the mitogenome of C. salicis revealed the presence of two introns: one within rnl and one within the rns sequence. The remaining representatives of Colletotrichum may have up to eight or even nine introns within their mitogenomic genes [28].
To determine the nature of the evolutionary selection pressure in Colletotrichum, we estimated the evolutionary rates of 15 mitochondrial genes that are involved in electron transport complexes I, III, and IV, as well as the ATP synthase complex and rps3 gene, which encodes 40S ribosomal protein S3. In this analysis, we included all 11 Colletotrichum species for which the complete mitochondrial genomes are currently available, including the mitogenomes reported here for C. fioriniae, C. lupini, C. salicis, and C. tamarilloi. Genes with non-applicable (NA) Ka/Ks ratios were changed to zero. The Ka/Ks ratio for most genes was less than one, with the exception of rps3. In the case of that gene, the Ka/Ks ratio was the highest for C. tamarilloi and C. salicis, for which it reached values of 1.942 and 1.363, respectively (Table S3a, Figure 2). A Ka/Ks ratio higher than one for rps3 was also noted for C. lindemuthianum (1.298) and C. graminicola (1.081). In the case of the other genes, the Ka/Ks ratio in all analyzed species did not exceed the value of 0.523, which was noted for nad3 in C. graminicola. A comparative analysis of genes revealed that the substitution rate varied widely, with Ka and Ks values ranging from zero to 0.218 and from zero to 1.036, respectively. The highest synonymous substitution rate (average Ks = 0.591) was observed for the cox3 gene, whereas the lowest average Ks (0.108) was noted for nad4L. The highest average non-synonymous (Ka) substitution rate was observed for rps3 (average Ka = 0.129), whereas the lowest was noted for atp9 (0.005).
Based on Ka/Ks values, 14 genes indicative of purifying selection (Ka/Ks < 1) were identified in the analyzed mt genomes. A Ka/Ks ratio higher than 1.0 was only found for one gene (rps3), which is indicative of positive selection. In order to test whether traces of positive selection could be observed for the gene in all analyzed mitogenomes, pairwise comparisons of the Ka/Ks ratio for rps3 were performed between all species combinations (Table S3b). In 15 out of 55 combinations, the Ka/Ks ratio was higher than 1.0, suggesting their adaptation to environmental conditions. Furthermore, in 34 other cases, the Ka/Ks ratio was slightly below one (>0,83), which may indicate at least some role of positive selection for rps3 in the acceleration of the substitution rate.

3.2. Repeated Elements

A total of nine repeated sequences with lengths ranging from 31 to 205 bp and sequence identities greater than 90% (Table S4) were identified in C. salicis. In all cases, only forward repeats were scored. Most of the repeated sequences (6) were dispersed in the intergenic regions (IGS), and only three were localized within genes. For the other representatives of the C. acutatum species complex reported here (i.e., C. tamarilloi, C. lupini, and C. fioriniae), five repeated sequences were found in each mitochondrial genome. Their lengths ranged from 31 to 101 bp (C. tamarilloi and C. lupini) or from 41 to 151 bp (C. fioriniae). Analogically to C. salicis, only forward repeats were identified; however, this time, most of them (three to five) were localized within genes. The analysis of the previously reported C. acutatum mt genome [27] revealed the same number (five) of genomic repeats of a similar size, ranging from 31 to 112 bp, located predominantly (three) within the coding sequences. All of them were identified as forward repeats (Table S4).
An analysis of repeat sequences from the mt genomes of other representatives of Colletotrichum was also performed (Table S4). In the mitochondrial genome of C. graminicola, a total of 12 repeated sequences with lengths ranging from 30 to 75 bp were found. They included nine forward repeats and three palindromic repeats, all of them located within intergenic regions. The mitochondrial genome of Colletotrichum lindemuthianum included 21 repeat sequences with lengths ranging from 30 to 87 bp. All of them were identified as forward repeats located almost exclusively within the intergenic regions and introns (18). In the case of C. gloeosporioides, a total of 68 repeated sequences were found with lengths ranging from 30 to 107 bp. They included 40 forward repeats and 28 palindromic repeats located almost exclusively within intergenic regions and introns (65). Only three were identified within genes (trnV-TAC and nad6). An analysis of the mitogenome of C. fructicola allowed us to identify 54 repeated sequences with lengths ranging from 30 to 90 bp. They included 37 forward repeats and 17 palindromic repeats. Most of the repeated sequences were dispersed in the intergenic regions and introns (44), whereas 10 were identified within genes (trnV-TAC and large subunit of ribosomal RNA). For C. siamense, a total of 73 repeated sequences were found with lengths ranging from 30 to 83 bp. They included 46 forward repeats and 27 palindromic repeats located predominantly within the intergenic regions and introns (64), whereas nine were identified within genes (trnV-TAC and a large subunit of ribosomal RNA). The mitochondrial genome of C. aenigma included the highest number (124) of repeated sequences with lengths ranging from 30 to 100 bp. This included 66 forward repeats, 46 palindromic repeats, and 12 reverse repeats distributed mainly in intergenic regions and introns (107); only 17 were found within genes (trnV-TAC, rps, and a large subunit of ribosomal RNA).
The distribution and types of microsatellites were also studied in Colletotrichum mitogenomes (Table S5a–S5k). For all studied representatives of the C. acutatum species complex, the number of identified mitochondrial SSRs was rather low and ranged from 10 (C. fioriniae) to 18 (C. lupini). The di- and trinucleotide repeats appeared as the most abundant among the analyzed species, whereas penta- and hexanucleotide repeats were represented by solitary elements. A single mononucleotide repeat was only identified in the mt genome of C. acutatum. Regarding tetranucleotide repeats, five such elements were found in C. lupini and one in C. tamarilloi and C. salicis, while they were completely absent in C. acutatum and C. fioriniae. In comparison with those from the C. acutatum species complex, the representatives of the C. gloeosporioides species complex were characterized by a much higher number of SSRs found within their mitochondrial genomes—the number of these repetitive elements ranged from 31 (C. siamense) to 41 (C. aenigma). All identified SSR types occurred in the analyzed mitogenomes in various numbers and proportions, with some exceptions—the pentanucleotide repeats were not found in any of them; furthermore, hexanucleotide repeats were not found in the C. fructicola mitogenome. The remaining two Colletotrichum species, C. lindemuthianum and C. graminicola, were characterized by intermediate numbers of identified mitochondrial SSRs—25 and 27, respectively. For C. graminicola, all six SSR types were distinguished (mono-, di-, tri, tetra-, penta- and hexanucleotide); however, when C. lindemuthianum was considered, no hexanucleotide repeats were observed. Tri- and tetranucleotide repeats were the most abundant in these two Colletotrichum species.
The SSRs can be distributed across three different genomic regions: exons, introns, and intergenic spacers (IGS). For C. lupini and C. fioriniae, the SSRs were equally (50%/50%) distributed between exons and IGS (Table S5a–k). In other representatives of the C. acutatum species complex, the location of SSRs within exons predominated: 54.5% in C. salicis, 64.3% in C. tamarilloi, and 72.7% in C. acutatum. When the C. gloeosporioides species complex was considered, SSRs were found to be located predominantly in IGS (from 50% in C. gloeosporioides to 57.9% in C. fructicola) and were almost equally distributed within introns (range from 22.6% in C. siamense to 29.3% in C. aenigma) and exons (range from 18.4% in C. fructicola to 26.5% in C. gloeosporioides). The remaining two Colletotrichum species, C. graminicola and C. lindemuthianum, were characterized by having the highest number of SSRs located within IGS (59.3% in the former and 80% in the latter), and there was a complete lack of these repetitive elements within introns. A more detailed analysis of the SSRs in exons revealed that they could be found within the coding sequences of eleven genes (nad1nad6, cox1, cob, atp6, atp8 and large subunit ribosomal RNA), from which cox1, nad2, and nad4 were the most common locations for identified microsatellites. On the other hand, nad5 and nad6 only appeared as SSR locations for C. graminicola. The joint analysis of all 11 Colletotrichum species revealed that among the identified mononucleotide repeats, the C/G motif was the most common (70.6%). For dinucleotide SSRs, the AT/TA motif was found to have the highest frequency (88.6%), whereas for trinucleotide repeats, two motifs, AAT/TTA (67.7%) and AAG/TTC (24.6%), were the most common. AGCC/TCGG (28.1%) and AAAT/TTTA (20.3%) were the most frequent tetranucleotide SSRs in all species. In pentanucleotide SSRs, three tandem repeat motifs were observed—AATAT/TTATA (77.8%), AAGCT/TTCGA (11.1%), and AAGAT/TTCTA (11.1%)—whereas in the case of hexanucleotide repeats, seven such elements were dominated by the AATGGG/TTACCC motif (36.4%).

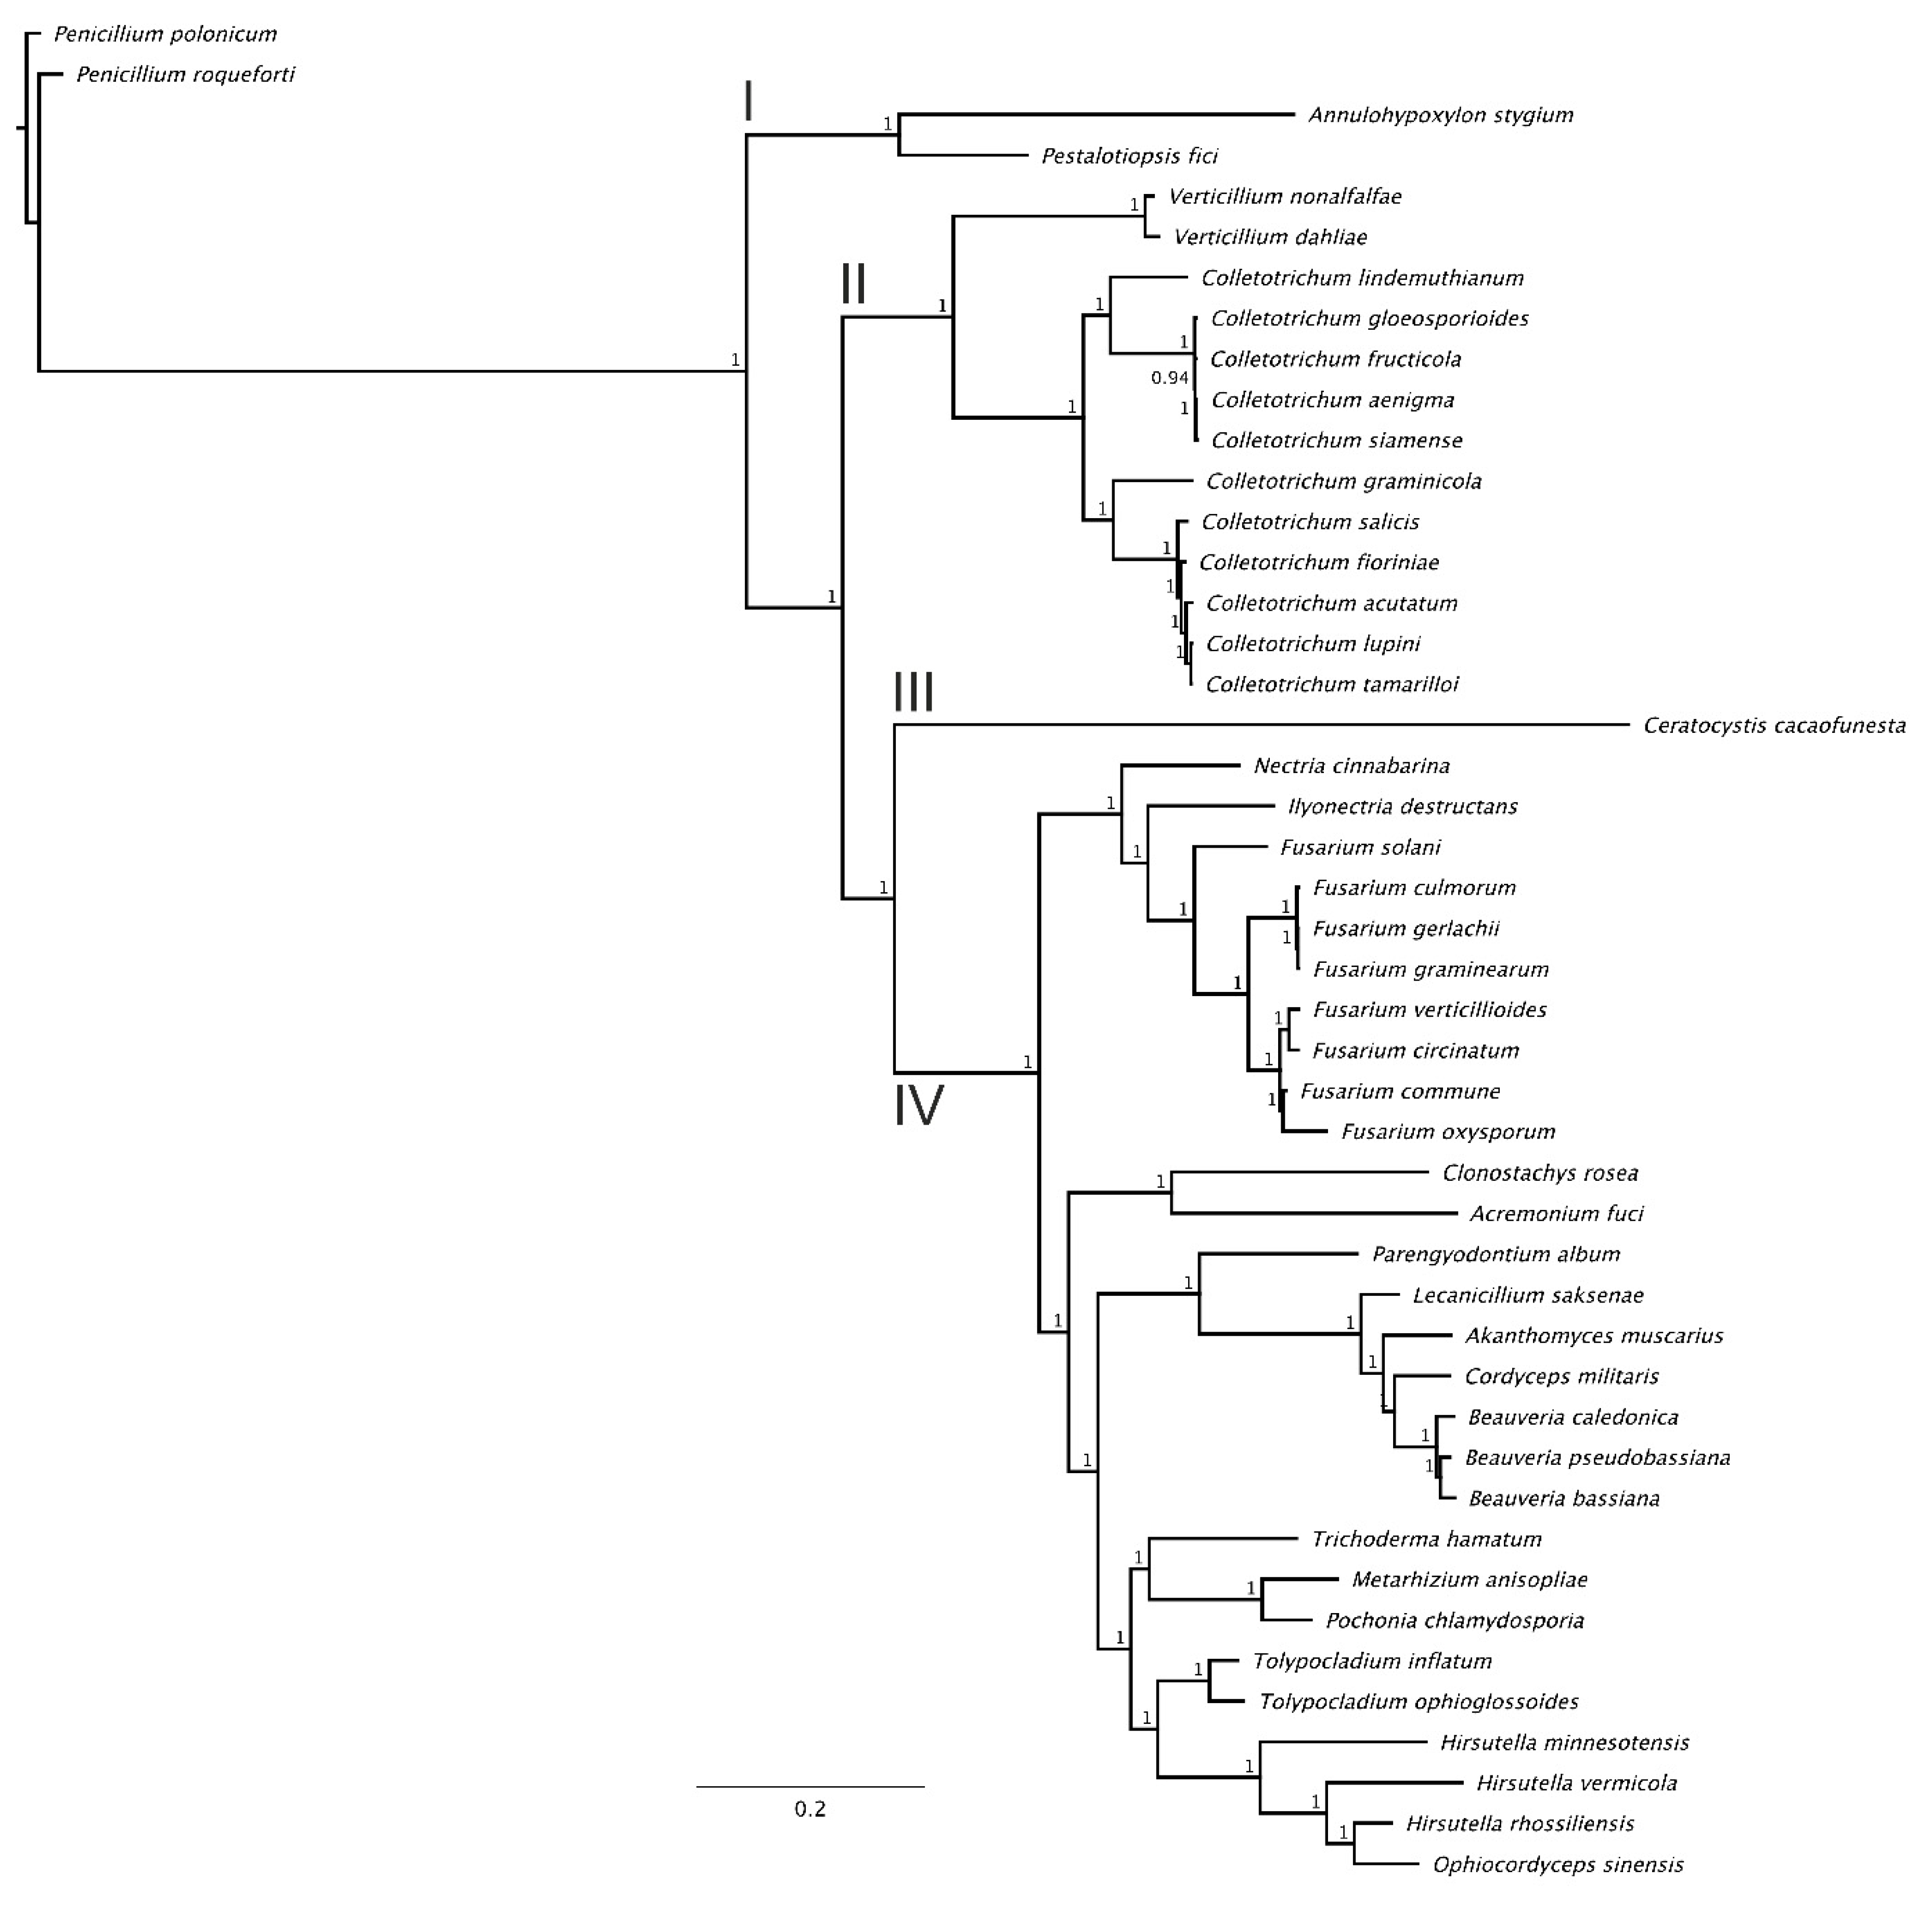
3.3. Phylogenomic Analysis

The nucleotide sequences of 15 protein-coding genes were used for phylogenetic tree reconstruction. The ML and BI trees revealed consistent phylogenetic relationships. The BI tree (Figure 3) was characterized by very high nodal support values (only one node had a Bayesian posterior probability value below 1.0). Phylogenetic tree topology revealed systematic relationships between the analyzed fungi and divided them into four (I–IV) main clades. All analyzed Colletotrichum species were clustered into one clade (Clade II), and their topologies reflected their systematic positions: representatives of the C. acutatum species complex and C. gloeosporioides species complex formed two separate clusters, whereas C. graminicola and C. lindemuthianum formed solitary branches (the former appeared more similar to the C. acutatum species complex, whereas the latter was more similar to the C. gloeosporioides species complex). Two Verticillum species (V. nonalfalfae and V. dahlia) appeared as the most similar to the analyzed Colletotrichum species and, therefore, were found in the same clade. Clade III consisted of only one species: Ceratocystis cacaofunesta. Clade I joined Annulohypoxylon stygium and Pestalotiopsis fici, representing Sordariomycetes. The most heterogenous clade, Clade IV, contained 28 species, representing various genera from the Sordariomycetes class. Finally, two Penicillium species (P. roqueforti and P. polonicum), used here as the outgroup, occupied the most distinct positions on the dendrogram.

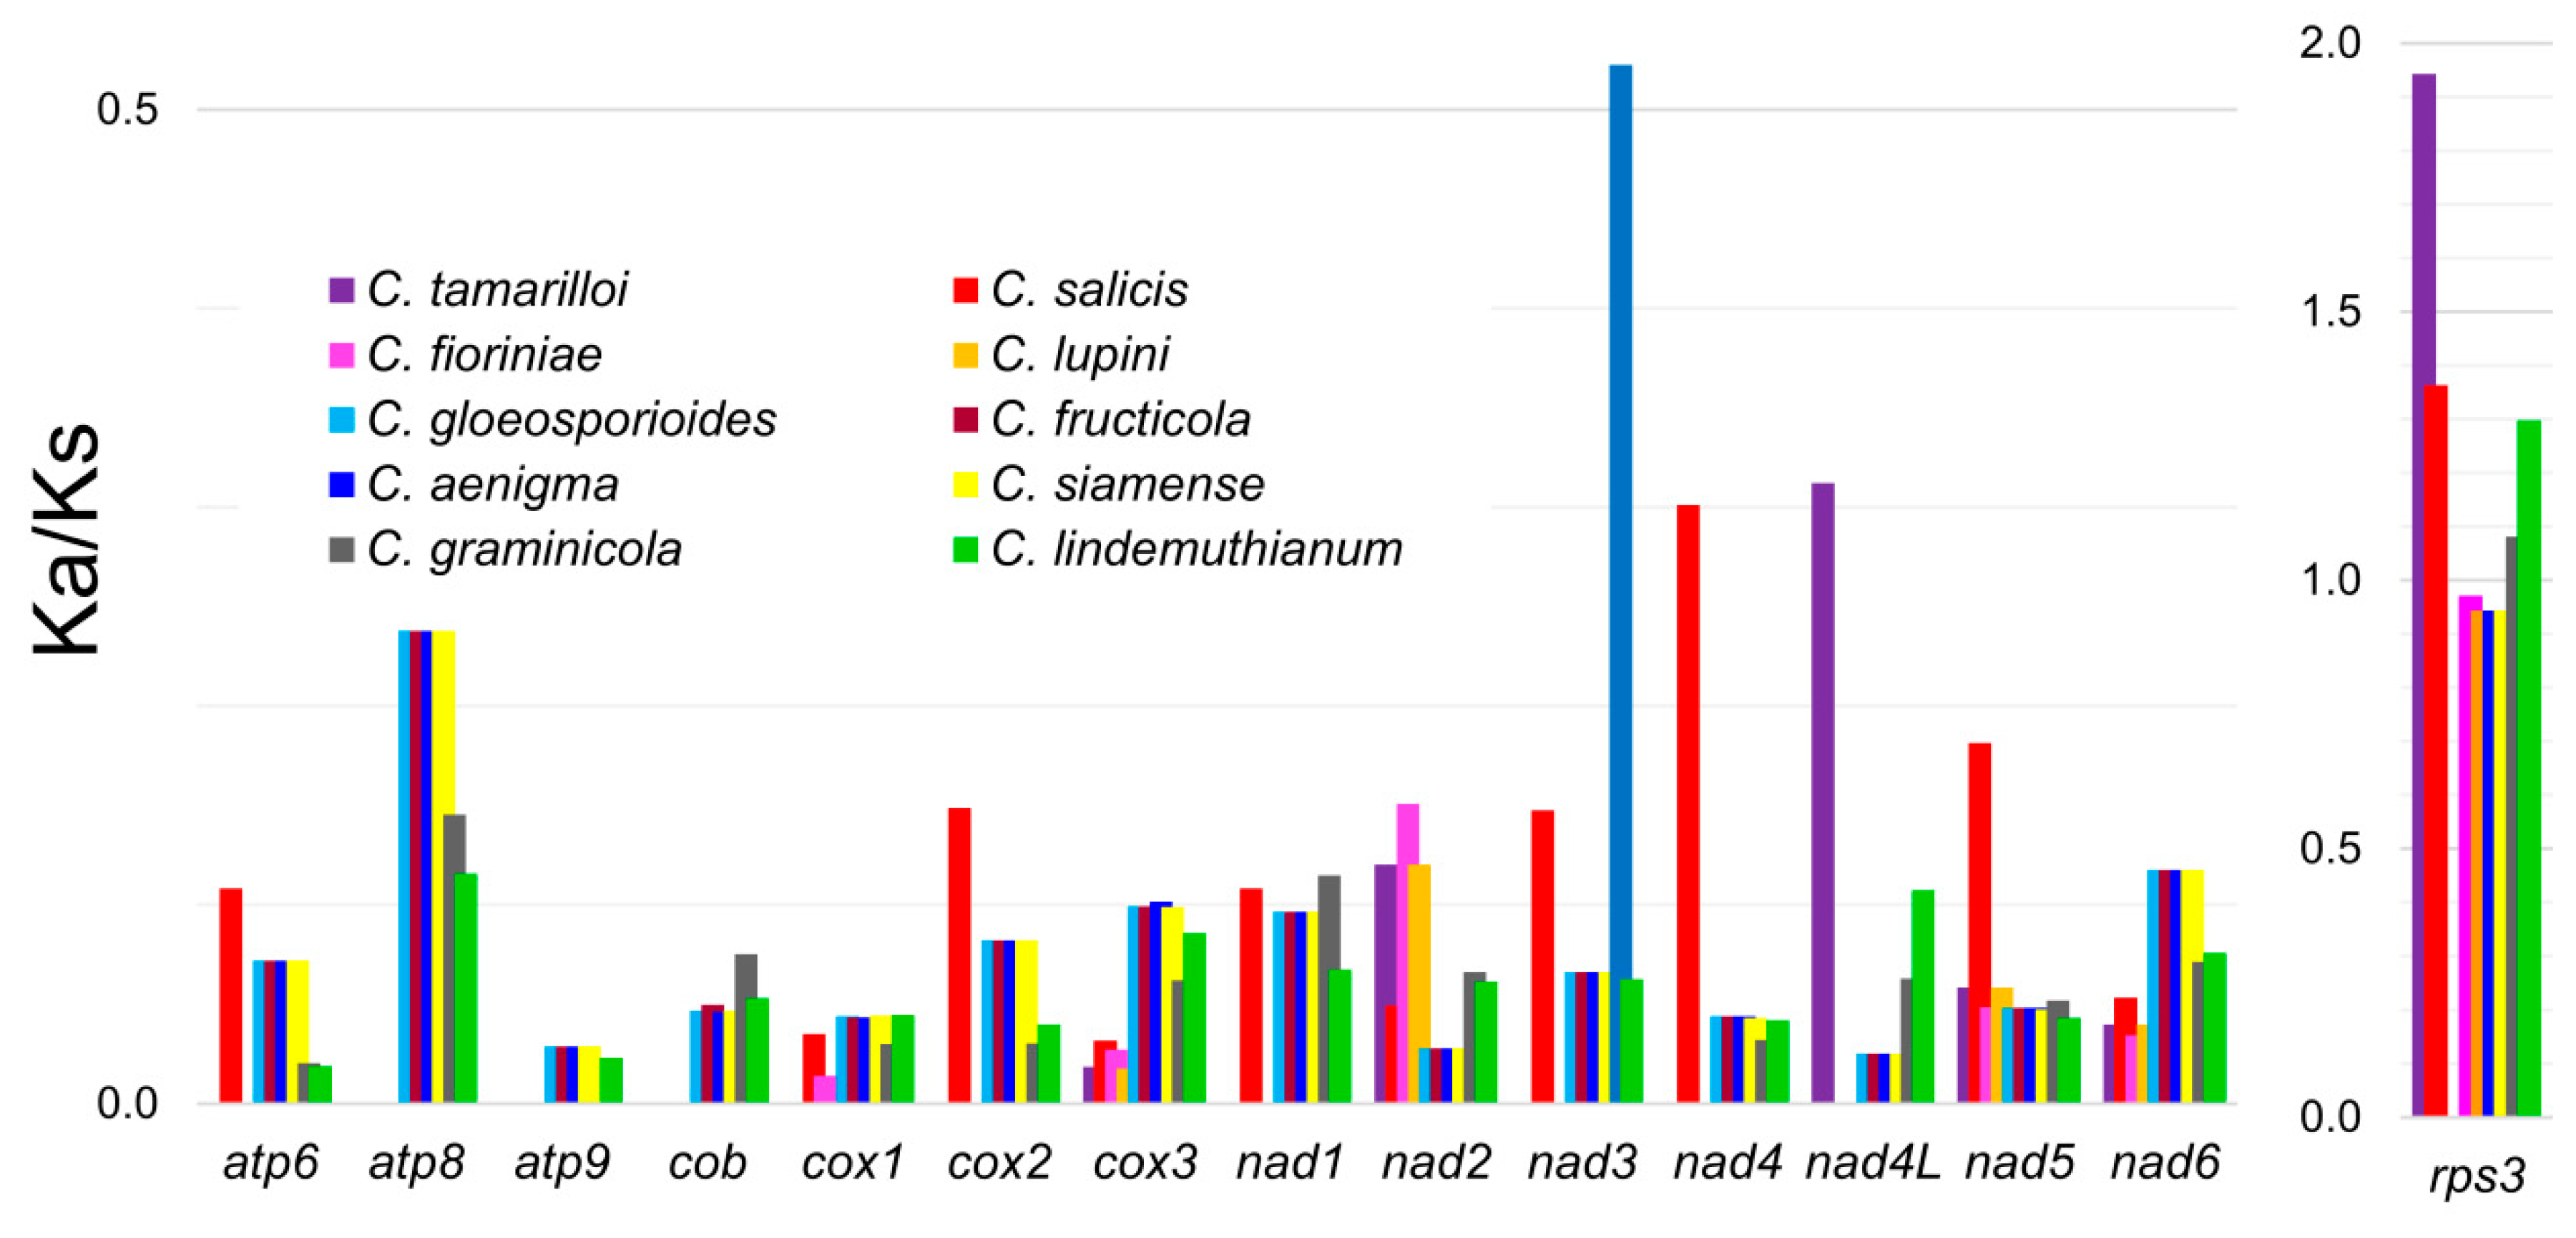
3.4. Molecular Evolution of rps3 in Colletotrichum

The analyzed rps3 sequences varied in size among analyzed the Colletotrichum species, ranging from 1581 bp in C. siamense and C. aenigma to 1245 bp in C. lindemuthianum. However, for the C. acutatum species complex, the rps3 length was very stable and fell within the range of 1416–1422 bp. A larger discrepancy was observed among representatives of the C. gleosporioides complex, where the length of rps3 ranged from 1581 to 1329 bp (C. fructicola). When the other 35 fungi species were also considered (33 representatives of Sordariomycetes and two Penicillium species, P. polonicum and P. roqueforti, as an outgroup), the rps3 length ranged from 1635 bp in Hirsutella rhossiliensis to 804 bp in Penicillium polonicum. Multiple alignment of all 46 rps3 nucleotide sequences revealed the highest similarity of genes within the group of Colletotrichum species (on average, 78.55% identity), whereas the most divergent character (31.1% identity) was observed for the rps3 sequence from the Penicillium polonicum mitogenome (Table S6). The average level of similarity between all analyzed sequences was 58.8%.
The nucleotide sequences of the rps3 gene from the collection of all 46 fungi species were used for phylogenetic tree reconstruction (Figure S2). The ML and BI trees revealed consistent phylogenetic relationships. High consistency was observed for the topology of phylogenetic trees obtained on the basis of concatenated data for 15 protein-coding genes and sequences of the solitary rps3 gene. In both cases, the positions of species reflected their systematic positions, with representatives of each genus generally gathered in the same cluster. This was also observed for the Colletotrichum genus, for which rps3 appeared as a source of potentially diagnostic characteristics which could be applied in both evolutionary studies and for the development of markers to enable accurate species recognition.
A detailed comparison of the rps3 sequence from 11 Colletotrichum species allowed us to identify a 223-bp-long polymorphic region suitable for the development of potentially diagnostic markers. This enabled us to distinguish all 11 studied Colletotrichum species. The abovementioned region was located between positions 529 and 751 of the rps3 nucleotide multiple sequence alignment. It contained 140 polymorphic sites, resulting from either nucleotide substitution or insertion/deletion events (Figure S3). The characteristic distribution of indel polymorphism at positions 559–576 and 622–636 enabled the representatives of the C. acutatum complex and C. salicis to be distinguished from C. lindemuthianum and the C. gloeosporioides species complex. Moreover, unique indel polymorphisms were observed for C. salicis (546–551), C. gloeosporioides (583–609), C. fructicola (576–617), and C. gramionicola (619–645), which enabled them to be distinguished from each other and from the other representatives of Colletotrichum. For the other representatives of Colletotrichum, multiple alignments of their rps3 nucleotide sequence revealed a number of polymorphic sites in the form of nucleotide substitutions that were characteristic of certain species (Figure S3).

4. Discussion

Colletotrichum fioriniae, C. lupini, C. salicis, and C. tamarilloi represent fungi with rather small mitochondrial genomes that do not exceed 37 kb. Although the complete mt genomes of these four species are, on average, almost three times larger than the smallest sequenced so far—the fungal mt genome of Rozella allomycis, Cryptomycota (~12 kb)—they are far smaller than the biggest fungal mt genome of Rhizoctonia solani, Basidiomycota (~235 kb) [39]. However, the size of the mitochondrial genome varies within the Colletotrichum genus and even reaches a length of 57,252 bp for C. aenigma or 58,666 bp for C. siamense, which are both representatives of the C. gloeosporioides species complex.
A number of studies have reported that the size variation of mitochondrial genomes may be caused by the length and organization of intergenic regions as well as by the presence of introns [40,41] which may vary in terms of their number and size. In some cases, the total length of intronic and intergenic regions may contribute up to 80% of the mt DNA sequence (Phlebia radiata; [42]). Intron content variation has been also reported as a source of variation in the size of mitogenomes, even among closely related species [43,44]. As was shown by our studies, compact mt genomes of representatives of the C. acutatum species complex include one (C. acutatum, C. tamarilloi, C. fioriniae, and C. lupini) or two (C. salicis) introns. However, for the C. gloeosporioides species complex, the number of introns was found to range from seven to nine, with the highest values found for C. aenigma and C. fructicola. Three of these introns were described as unique for all C. gloeosporioides sensu lato mitogenomes and thus potential targets for PCR-based detection [28].
The intergenic regions, as well as introns of the Colletotrichum mitogenomes, are filled with repetitive sequences, especially observed in the C. gloeosporioides species complex. For example, for the mitochondrial genome of C. aenigma, in which the highest numbers of palindromic, direct, and reverse repeats were found (124), 62.9% of them were found in intergenic spacers, whereas 31.5% were found in introns. On the contrary, the mitogenomes of the representatives of the Colletotrichum acutatum species complex are very poor in terms of their repetitive element content. The analysis of the mitochondrial genomes of C. acutatum, C. fioriniae, C. lupini, C. salicis, and C. tamarilloi revealed low numbers (five to nine) of only one type of repetitive element (forward repeats), and these were distributed predominantly (60–80%) in coding regions, with the exception of C. salicis for which repetitive elements within exons constituted 33.3% of their total number. The remaining two Colletotrichum species (C. graminicola and C. lindemuthianum) were characterized by an intermediate number of repetitive sequences (12 and 21, respectively); moreover, their locations were predominantly identified within intergenic regions (100% and 81%, respectively). An analogous situation was observed for all studied Colletotrichum species when the number and distribution of tandem repeats were considered.
Despite the identification of some differences in the size of the studied Colletotrichum mitogenomes, a high degree of consistency in their gene composition and order is observed. The Colletotrichum fungi generally contain a set of 17 genes in their mt genomes, including atp6, atp8, nad4, nad1, cox1, cob, nad5, nad4L, cox2, atp9, nad3, nad2, rnl, rps3 (located within the intron of rnl), nad6, cox3, and rns. The abovementioned set of genes, together with sequences for 23 different tRNAs identified in the analyzed representatives of Colletotrichum (some of the trn genes were identified in more than one copy for certain species), fits the observation by Bullerwell and Lang perfectly [45], who stated that typical fungal mitochondrial genome usually encodes 30–40 genes. The highly conservative distribution of mitogenomic tRNA genes, which appeared to be organized in clusters across all analyzed Colletotrichum species, confirmed that the changes in trn locations are relatively rare events, and thus, an analysis of their distribution can be used to study fungal evolution or phylogenetic signals, including their contribution to gene order variation in fungal mitogenomes [46].
Nevertheless, some exceptions were found in the mt genomes of C. graminicola and C. lindemuthianum. For the mt genome of C. lindemuthianum, one additional gene was identified (GIY endonuclease) [30], whereas, in C. graminicola, a sequence of DNA polymerase was annotated [29]. For C. lindemuthianum, the annotated GIY endonuclease appeared as a free-standing ORF with a length of 1011 bp, placed between the sequences of cox1 and cob. Contrary to the abovementioned unique element of the C. lindemuthianum mitochondrial genome, an additional sequence was annotated on the complementary strand of the C. graminicola mitogenome between the loci of cox1 and nad4 coded on the positive strand. This 2079-bp-long sequence, which encodes a protein with 692 amino acids, was identified as a member of the DNA polymerase type B protein family [29]. However, since all of the abovementioned additional genes annotated for C. graminicola and C. lindemuthianum were predicted solely based on the in silico analysis, we do not actually know whether they are active or, rather, if they are non-functional pseudogenes. Nevertheless, the unique characteristics of GIY endonuclease from C. lindemuthianum as well as DNA polymerase from C. graminicola makes them potential targets for diagnostic purposes as well as evolutionary studies, as has been proven previously for other systematic groups [47,48].
One of the main elements of evolution studies is the analysis of the substitution patterns within particular sequences [49]. Generally, synonymous substitutions dominate over non-synonymous changes within the coding sequences [50], and analogical patterns were identified in the mitogenomic genes of the 11 studied Colletotrichum species. The highest average synonymous substitution rate was observed for the cox3 sequence. This unique characteristic of cox3 was conditioned by the high Ks values estimated for all four representatives of the Colletotrichum gloeosporioides species complex, as well as for C. graminicola and C. lindemuthianum. In all of the abovementioned species, the Ks value was higher than 0.846, with C. graminicola having the highest value of 1.036. The opposite situation was observed for the Colletotrichum acutatum species complex, where the Ks values for cox3 did not exceed 0.209. High polymorphism within the cox3 sequence in mitogenomes of representatives of the C. gloeosporioides species complex was also previously reported by Liang et al. [28], who identified a short polymorphic region within the cox3 sequence that showed strong lineage-specific divergence. The abovementioned 142 bp long region of cox3 included 42.2% of all polymorphic sites present in the protein-coding regions of the analyzed mitogenomes and 64.3% of all nonsynonymous sites [28].
In our study, rps3 appeared as the most variable nucleotide sequence with the highest number of non-synonymous substitutions. This was accompanied by high Ka/Ks values for almost all rps3 sequences in Colletotrichum species in relation to C. acutatum, which was used as a reference. Four species (C. tamarilloi, C. salicis, C. graminicola, and C. lindemuthianum) had Ka/Ks values greater than one, suggesting that positive selection acts on rps3 in Colletotrichum fungi. In another four Colletotrichum species (C. aenigma, C. fructicola, C. siamense, and C. gloeosporioides), the Ka/Ks value for the rps3 sequence was within the range of 0.943–0.971. Although these values were <1, they were very close to the threshold value, which seemed to be a confirmation of that tendency. Our observations are concordant with the results of Lin et al. [51], who revealed a similar mechanism (positive selection) for rps3 gene evolution for 12 representatives of Hypocreales fungi. When the remaining 14 protein-coding genes of 11 Colletotrichum mitogenomes analyzed in this study were considered, the Ka/Ks ratio did not exceed the value of 0.238, indicating that these sequences were under functional constraints, i.e., natural selection minimizes the number of amino acid changes to maintain the conservative characteristics of protein structure and function.
The abovementioned rps3 gene, firstly described in yeasts as var1, is an optional element of many fungal mitogenomes [52,53]. rps3 is the only ribosomal protein encoded in the mt genome that may be found either in the intron of the rnl gene or as a free-standing gene [54]. Furthermore, cytoplasmic (nuclear genome-encoded) versions of the rps3 protein have been reported [55,56]. In our study, rps3 was found exclusively as an intronic ORF within the rnl gene. The rps3 gene has become one of the key elements in fungal evolution studies, since its unique features have helped to reveal the mechanisms of the evolution or extinction of fungal mitochondria, including the mechanisms of fungal gene mobility within an organelle’s genome and/or the nucleus [57]. The data obtained for a number of fungal lineages also confirmed the importance of the rps3 gene identified in phylogenetic studies of this group of organisms [54]. Generally, it is preferred that phylogenetic studies are performed based on data for several genes originating from nuclear or organellar genomes, or both [58,59,60]. However, as proved by Korovesi et al. [57] for 246 fungi species, the phylogenetic tree based on the sequences of only one gene (rps3) showed similar relations between studied lineages as the tree constructed based on concatenated data for 14 genes. Moreover, in our study, the phylogenetic tree for all 46 studied fungi species based on a solitary rps3 sequence revealed a very consistent topology with the tree based on 15 mitochondrial protein-coding sequences. In both cases, the representatives of the Colletotrichum acutatum complex as well as the Colletotrichum gloeosporioides species complex formed two closely related but clearly separated clusters. C. lindemuthianum and C. graminicola formed solitary branches which revealed close relationship with the Colletotrichum gloeosporioides species complex and Colletotrichum acutatum species complex, respectively. The positions of other species reflected their systematic positions, with representatives of each genus generally gathered in the same clusters. The phylogenies based on data for a single gene usually represent the evolution of the respective gene only. However, some genes like rps3 seem to provide a significant source of information on the evolution of the species carrying them. In our data, this can be observed for Colletotrichum or for species representing the same order, as revealed by Kang et al. [61] for Hypocreales.
Besides mitochondrial genes, a number of nucleic loci have been used for the determination of phylogenetic diversity and species identification within the Colletotrichum genus. The first phylogenetic studies of Colletotrichum were based on polymorphism within the internal transcribed spacer (ITS) region [62], which was considered as a standard barcode for the fungi. However, due to the insufficient level of polymorphism, the use of the ITS region to reveal species diversity within Colletotrichum has shown limited efficiency [63,64]. As a result, a number of other nuclear loci have been proposed and successfully used for multilocus phylogenetic inference and species identification within various Colletotrichum species complexes [64,65,66]. Very recently, a comprehensive evaluation of 11 of the most frequently used nuclear loci revealed that histone 3 (HIS3), glyceraldehyde-3-phosphate dehydrogenase (GAPDH), and β-tubulin (TUB2) are the best markers for Colletotrichum systematics and taxonomy [67]. However, for closely related fungi species for which the standard multilocus barcode is not sufficient, the utilization of the complete mitochondrial genome sequence as a super-barcode may have to be applied, in a similar manner to the approach successfully applied in plant genomics, where complete chloroplast genomes were recently proposed as a tool for taxonomic studies [68]. Nevertheless, the results of the current study for the phylogenetic relationships between Colletotrichum species based on concatenated data for 15 mitochondrial protein-coding sequences and the solitary mitochondrial rps3 gene are in accordance with these revealed by nuclear loci. For example, only a slight difference in tree topology was observed when our phylogenetic trees were compared with those obtained for the C. acutatum species complex on the base of nucleic multilocus data which included ITS, GAPDH, CHS-1 (chitin synthase 1)>, HIS3, ACT (actin), and TUB2 [6]. This constitutes an additional argument for the potentially unique value of the rps3 gene in the comparative genomics of Colletotrichum.
Here, we would also like to propose another novel approach for the utility of the rps3 sequence in fungi genomics. The high variability identified within the rps3 sequence among the studied Colletotrichum species encouraged us to perform a more detailed analysis of the studied sequence. As a result, we identified a polymorphic region of rps3 that is suitable for the development of potential diagnostic markers that enable all 11 studied Colletotrichum species to be distinguished. This is an important issue since, despite strong efforts, Colletotrichum species are still identified based on the simultaneous analysis of several polymorphic loci [69,70,71]. The efficiency of the identification of fungi from that taxonomic group could be substantially improved by enhancing the available and commonly used set of mitochondrial and nucleic loci by the rps3 sequence. Nevertheless, to confirm the effectiveness of the rps3-based diagnostic markers, further studies and tests on a wider number of samples for each Colletotrichum lineage are required.

5. Conclusions

More than ten genomes of the genus Colletotrichum have been sequenced to date [72,73,74,75,76]. Members of Colletotrichum belong to six independent species complexes that deploy various infection strategies, including biotrophic, necrotrophic, hemibiotrophic, and endophytic strategies, to derive nutrients from colonized monocotyledonous and dicotyledonous plants [7,19,74]. These genomes have been intensively analyzed to identify the genomic features associated with host adaptation mechanisms. The results indicate that Colletotrichum species secrete specific cell wall-degrading enzymes and proteinases depending on their infection strategies. The structures of their genomes can probably be grouped based on similarities in the host range, rather than phylogenetic similarities [19,74,77]. Nevertheless, further research is needed to characterize genes associated with virulence factors in specific host plants.
This study provides comprehensive information on the structure and organization of the four newly sequenced mitochondrial genomes of C. fioriniae, C. lupini, C. salicis, and C. tamarilloi. The comparative study with mitogenome sequences of seven other Colletotrichum species revealed a high consistency in gene composition and order and also in the presence of variable regions with various possible applications. The results of this study indicate that the genes grouped within mitochondrial genomes can facilitate the development of effective methods for detecting polyphagous pathogens. In particular, the development of an effective qPCR detection method based on mitochondrial sequences appears to be a key focus for future research.

Supplementary Materials

The following are available online at https://www.mdpi.com/2073-4425/11/5/552/s1, Table S1: List of the mitochondrial genomes used in the phylogenetic analysis. Species list arranged alphabetically; Table S2: Codon usage frequencies in analyzed mitogenomes of Colletotrichum species; Table S3a: Ks and Ka values of the Colletotrichum acutatum mitochondrial genome vs. selected representatives of the Colletotrichum genus; Table S3b: Ks and Ka values and pairwise Ka/Ks ratio for rps3 between all Colletotrichum species combinations; Table S4: List of repeated sequences in the mitochondrial genomes of Colletotrichum sp. Genomes; Table S5a: Distribution of simple sequence repeats (SSR) in the Colletotrichum gloeosporioides mt genome; Table S5b: Distribution of SSR in the Colletotrichum fructicola mt genome; Table S5c: Distribution of SSR in the Colletotrichum siamense mt genome; Table S5d: Distribution of SSR in the Colletotrichum aenigma mt genome; Table S5e: Distribution of SSR in the Colletotrichum acutatum mt genome; Table S5f: Distribution of SSR in the Colletotrichum lupini mt genome; Table S5g: Distribution of SSR in the Colletotrichum fioriniae mt genome; Table S5h: Distribution of SSR in the Colletotrichum tamarilloi mt genome; Table S5i: Distribution of SSR in the Colletotrichum salicis mt genome; Table S5j: Distribution of SSR in the Colletotrichum lindemuthianum mt genome; Table S5k: Distribution of SSR in the Colletotrichum graminicola mt genome; Table S6: Identity matrix between rps3 genes among 46 studied fungi species;. Species list arranged alphabetically; Figure S1: Sequence identity plots (mVISTA) of 11 Colletotrichum species using C. acutatum as a reference genome. The arrows indicate the annotated genes and their transcriptional directions. Genome regions are color coded as coding and non-coding regions (blue and red, respectively). The vertical scale represents the degree of identity, which ranged from 50% to 100%; Figure S2: Phylogenetic tree based on sequences of the rps3 gene from 11 Colletotrichum species, 33 other Sordariomycetes representatives, and 2 Penicillium sp. using Bayesian posterior probabilities (PP). Bayesian PP are given at each node; Figure S3: Multiple alignment of the rps3 gene of 11 Colletotrichum species. The highly variable region between positions 529 and 751 of the alignment is presented.

Author Contributions

Conceptualization, A.P.; methodology, P.A.; validation, P.A.; formal analysis, P.A., J.P.J., Ł.P. and A.O.; investigation, A.P. and A.O.; resources, A.P. and A.O.; data curation, P.A., J.P.J. and Ł.P.; writing—original draft preparation, P.A.; writing—review and editing, A.P., J.P.J., Ł.P., and A.O.; visualization, J.P.J., Ł.P. and P.A.; funding acquisition, A.P. All authors have read and agreed to the published version of the manuscript.

Funding

This research was funded by the Minister of Science and Higher Education in the range of the program entitled “Regional Initiative of Excellence” for the years 2019-2022, Project No. 010/RID/2018/19.

Conflicts of Interest

The authors declare no conflict of interest. The funders had no role in the design of the study; in the collection, analyses, or interpretation of data; in the writing of the manuscript, or in the decision to publish the results.

References

  1. Dean, R.; Van Kan, J.A.L.; Pretorius, Z.A.; Hammond-Kosack, K.E.; Di Pietro, A.; Spanu, P.D.; Rudd, J.J.; Dickman, M.; Kahmann, R.; Ellis, J.; et al. The Top 10 fungal pathogens in molecular plant pathology. Mol. Plant Pathol. 2012, 13, 414–430. [Google Scholar] [CrossRef] [Green Version]
  2. Sreenivasaprasad, S.; Talhinhas, P. Genotypic and phenotypic diversity in Colletotrichum acutatum, a cosmopolitan pathogen causing anthracnose on a wide range of hosts. Mol. Plant Pathol. 2005, 6, 361–378. [Google Scholar] [CrossRef] [PubMed]
  3. Jayawardena, R.S.; Hyde, K.D.; Jeewon, R.; Li, X.H.; Liu, M.; Yan, J.Y. Mycosphere Essay 6: Why is it important to correctly name Colletotrichum species? Mycosphere 2016, 7, 1076–1092. [Google Scholar] [CrossRef]
  4. Farr, D.F.; Rossman, A.Y. Fungal Databases, U.S. National Fungus Collections, ARS, USDA. Available online: https://nt.ars-grin.gov/fungaldatabases (accessed on 20 September 2019).
  5. Cannon, P.F.; Damm, U.; Johnston, P.R.; Weir, B.S. Colletotrichum current status and future directions. Stud. Mycol. 2012, 73, 181–213. [Google Scholar] [CrossRef] [PubMed] [Green Version]
  6. Damm, U.; Cannon, P.F.; Woudenberg, J.H.C.; Crous, P.W. The Colletotrichum acutatum species complex. Stud. Mycol. 2012, 73, 37–113. [Google Scholar] [CrossRef] [PubMed] [Green Version]
  7. Prusky, D.; Alkan, N.; Mengiste, T.; Fluhr, R. Quiescent and necrotrophic lifestyle choice during postharvest disease development. Annu. Rev. Phytopathol. 2013, 51, 155–176. [Google Scholar] [CrossRef]
  8. Prusky, D. Pathogen quiescence in postharvest diseases. Annu. Rev. Phytopathol. 1996, 34, 413–434. [Google Scholar] [CrossRef] [Green Version]
  9. Von Arx, J.A. Die Arten der Gattung Colletotrichum. Phytopathol. Z. 1957, 29, 413–468. [Google Scholar]
  10. Sutton, B.C. The genus Glomerella and its anamorph Colletotrichum. In Colletotrichum: Biology, Pathology, and Control; Bailey, J.A., Jeger, M.J., Eds.; CAB International: Wallingford, UK, 1992; pp. 1–26. [Google Scholar]
  11. Index Fungorum. Available online: https://indexfungorum.org/names/Names.asp (accessed on 19 November 2019).
  12. Vargas, W.A.; Martín, J.M.; Rech, G.E.; Rivera, L.P.; Benito, E.P.; Díaz-Mínguez, J.M.; Thon, M.R.; Sukno, S.A. Plant defense mechanisms are activated during biotrophic and necrotrophic development of Colletotricum graminicola in maize. Plant Physiol. 2012, 158, 1342–1358. [Google Scholar] [CrossRef] [Green Version]
  13. Talhinhas, P.; Baroncelli, R.; Le Floch, G. Anthracnose of lupins caused by Colletotrichum lupini: A recent disease and a successful worldwide pathogen. J. Plant Pathol. 2016, 98, 5–14. [Google Scholar]
  14. Pszczółkowska, A.; Okorski, A.; Paukszto, Ł.; Jastrzębski, J.P. First report of anthracnose disease caused by Colletotrichum fioriniae on blueberry in Western Poland. Plant Dis. 2016, 100, 2167. [Google Scholar] [CrossRef]
  15. Pszczółkowska, A.; Okorski, A.; Paukszto, Ł.; Jastrzębski, J.P.; Gorzkowska, A.; Chareńska, A. First report of Fagus sylvatica leaf spot infection by Colletotrichum fioriniae in forest nurseries in Northeastern Poland. Plant Dis. 2017, 101, 1822. [Google Scholar] [CrossRef]
  16. Pszczółkowska, A.; Okorski, A.; Kotecki, A.; Gas, M.; Kulik, T.; Reczek, A. Incidence of seed-borne fungi on Lupinus mutabilis depending on a plant morphotype, sowing date and plant density. J. Elem. 2016, 21, 501–512. [Google Scholar] [CrossRef] [Green Version]
  17. Pszczółkowska, A.; Okorski, A.; Fordoński, G.; Prusiński, J.; Faligowska, A.; Borowska, M. Fungal colonization of seeds of three lupine species in different regions of Poland. Acta Agrobot. 2017, 70, 1714. [Google Scholar] [CrossRef] [Green Version]
  18. Okorski, A.; Pszczółkowska, A.; Sulima, P.; Paukszto, Ł.; Jastrzębski, J.P.; Przyborowski, J.; Makowczenko, K.G. First report of willow anthracnose caused by Colletotrichum salicis in Poland. Plant Dis. 2018, 102, 2036. [Google Scholar] [CrossRef]
  19. Baroncelli, R.; Amby, D.B.; Zapparata, A.; Sarrocco, S.; Vannacci, G.; Le Floch, G.; Harrison, R.J.; Holub, E.; Sukno, S.A.; Sreenivasaprasad, S.; et al. Gene family expansions and contractions are associated with host range in plant pathogens of the genus Colletotrichum. BMC Genom. 2016, 17, 555. [Google Scholar] [CrossRef] [Green Version]
  20. Baroncelli, R.; Talhinhas, P.; Pensec, F.; Sukno, S.A.; Le Floch, G.; Thon, M.R. The Colletotrichum acutatum species complex as a model system to study evolution and host specialization in plant pathogens. Front. Microbiol. 2017, 8, 2001. [Google Scholar] [CrossRef] [Green Version]
  21. Xu, J. Fungal DNA barcoding. Genome 2016, 59, 913–932. [Google Scholar] [CrossRef] [Green Version]
  22. Kearse, M.; Moir, R.; Wilson, A.; Stones-Havas, S.; Cheung, M.; Sturrock, S.; Buxton, S.; Cooper, A.; Markowitz, S.; Duran, C.; et al. Geneious Basic: An integrated and extendable desktop software platform for the organization and analysis of sequence data. Bioinformatics 2012, 28, 1647–1649. [Google Scholar] [CrossRef]
  23. MFannot Tool. Available online: https://megasun.bch.umontreal.ca/cgi-bin/dev_mfa/mfannotInterface.pl (accessed on 6 May 2020).
  24. Dong, X.; Stothard, P.; Forsythe, I.J.; Wishart, D.S. PlasMapper: A webserver for drawing and auto-annotating plasmid maps. Nucleic Acids Res. 2004, 32, W660–W664. [Google Scholar] [CrossRef] [Green Version]
  25. Frazer, K.A.; Pachter, L.; Poliakov, A.; Rubin, E.M.; Dubchak, I. VISTA: Computational tools for comparative genomics. Nucleic Acids Res. 2004, 32, 273–279. [Google Scholar] [CrossRef] [PubMed]
  26. Katoh, K.; Standley, D.M. MAFFT multiple sequence alignment software version 7: Improvements in performance and usability. Mol. Biol. Evol. 2013, 30, 772–780. [Google Scholar] [CrossRef] [PubMed] [Green Version]
  27. Kim, J.O.; Choi, K.Y.; Han, J.H.; Choi, I.Y.; Lee, Y.H.; Kim, K.S. The complete mitochondrial genome sequence of the ascomycete plant pathogen Colletotrichum acutatum. Mitochondrial DNA Part A 2016, 27, 4547–4548. [Google Scholar] [CrossRef] [PubMed]
  28. Liang, X.; Tian, X.; Liu, W.; Wei, T.; Wang, W.; Dong, Q.; Wang, B.; Meng, Y.; Zhang, R.; Gleason, M.L.; et al. Comparative analysis of the mitochondrial genomes of Colletotrichum gloeosporioides sensu lato: Insights into the evolution of a fungal species complex interacting with diverse plants. BMC Genom. 2017, 18, 171. [Google Scholar] [CrossRef] [Green Version]
  29. Vaillancourt, L.; Ma, L.-J.; Thon, M.; O’Connell, R.; van Themaat, E.V.L.; Young, S.K.; Zeng, Q.; Gargeya, S.; Alvarado, L.; Berlin, A.; et al. Direct Submission; Broad Institute of MIT and Harvard, 7 Cambridge Center: Cambridge, MA, USA, 2015. [Google Scholar]
  30. Gutierrez, P.; Alzate, J.; Yepes, M.S.; Marin, M. Complete mitochondrial genome sequence of the common bean anthracnose pathogen Colletotrichum lindemuthianum. Mitochondrial DNA Part A 2016, 27, 136–137. [Google Scholar] [CrossRef]
  31. Rozas, J.; Ferrer-Mata, A.; Sánchez-Del Barrio, J.C.; Guirao-Rico, S.; Librado, P.; Ramos-Onsins, S.E.; Sánchez-Gracia, A. DnaSP 6: DNA sequence polymorphism analysis of large datasets. Mol. Biol. Evol. 2017, 34, 3299–3302. [Google Scholar] [CrossRef]
  32. Kurtz, S.; Choudhuri, J.V.; Ohlebusch, E.; Schleiermacher, C.; Stoye, J.; Giegerich, R.; Giegerich, R. REPuter: The manifold applications of repeat analysis on a genomic scale. Nucleic Acids Res. 2001, 29, 4633–4642. [Google Scholar] [CrossRef] [Green Version]
  33. Mayer, C. Phobos 3.3.11. 2006–2010. Available online: http://www.rub.de/spezzoo/cm/cm_phobos.htm (accessed on 12 November 2019).
  34. Sablok, G.; Raju, G.V.P.; Mudunuri, S.B.; Prabha, R.; Singh, D.P.; Baev, V.; Yahubyan, G.; Ralph, P.J.; La Porta, N. ChloroMitoSSRDB 2.00: More genomes, more repeats, unifying SSRs search patterns and on-the-fly repeat detection. Database 2015, 2015, bav084. [Google Scholar] [CrossRef] [Green Version]
  35. Huelsenbeck, J.P.; Ronquist, F. MRBAYES: Bayesian inference of phylogenetic trees. Bioinformatics 2001, 17, 754–755. [Google Scholar] [CrossRef] [Green Version]
  36. Ronquist, F.; Huelsenbeck, J.P. MrBayes 3: Bayesian phylogenetic inference under mixed models. Bioinformatics 2003, 19, 1572–1574. [Google Scholar] [CrossRef] [Green Version]
  37. Guindon, S.; Dufayard, J.-F.; Lefort, V.; Anisimova, M.; Hordijk, W.; Gascuel, O. New algorithms and methods to estimate maximum-likelihood phylogenies: Assessing the performance of PhyML 3.0. Syst. Biol. 2010, 59, 307–321. [Google Scholar] [CrossRef] [PubMed] [Green Version]
  38. Kumar, S.; Stecher, G.; Tamura, K. MEGA7: Molecular Evolutionary Genetics Analysis Version 7.0 for Bigger Datasets. Mol. Biol. Evol. 2016, 33, 1870–1874. [Google Scholar] [CrossRef] [PubMed] [Green Version]
  39. NCBI Website. Organelle Genome Resources. Available online: https://www.ncbi.nlm.nih.gov/genome/browse#!/organelles/ (accessed on 14 September 2019).
  40. Burger, G.; Gray, M.W.; Lang, B.F. Mitochondrial genomes: Anything goes. Trends Genet. 2003, 19, 709–716. [Google Scholar] [CrossRef] [PubMed]
  41. Fourie, G.; van der Merwe, N.A.; Wingfield, B.D.; Bogale, M.; Tudzynski, B.; Wingfield, M.J.; Steenkamp, E.T. Evidence for inter-specific recombination among the mitochondrial genomes of Fusarium species in the Gibberella fujikuroi complex. BMC Genom. 2013, 14, 605. [Google Scholar] [CrossRef] [Green Version]
  42. Salavirta, H.; Oksanen, I.; Kuuskeri, J.; Mäkelä, M.; Laine, P.; Paulin, L.; Lundell, T. Mitochondrial genome of Phlebia radiata is the second largest (156 kbp) among fungi and features signs of genome flexibility and recent recombination events. PLoS ONE 2014, 9, e97141. [Google Scholar] [CrossRef]
  43. Torriani, S.F.F.; Penselin, D.; Knogge, W.; Felder, M.; Taudien, S.; Platzer, M.; McDonald, B.A.; Brunner, P.C. Comparative analysis of mitochondrial genomes from closely related Rhynchosporium species reveals extensive intron invasion. Fungal Genet. Biol. 2014, 62, 34–42. [Google Scholar] [CrossRef] [Green Version]
  44. Zhang, Y.; Zhang, S.; Zhang, G.; Liu, X.; Wang, C.; Xu, J. Comparison of mitochondrial genomes provides insights into intron dynamics and evolution in the caterpillar fungus Cordyceps militaris. Fungal Genet. Biol. 2015, 77, 95–107. [Google Scholar] [CrossRef]
  45. Bullerwell, C.E.; Lang, B.F. Fungal evolution: The case of the vanishing mitochondrion. Curr. Opin. Microbiol. 2005, 8, 362–369. [Google Scholar] [CrossRef]
  46. Aguileta, G.; de Vienne, D.M.; Ross, O.N.; Hood, M.E.; Giraud, T.; Petit, E.; Gabaldón, T. High variability of mitochondrial gene order among fungi. Genome Biol. Evol. 2014, 6, 451–465. [Google Scholar] [CrossRef] [Green Version]
  47. Lambowitz, A.M.; Belfort, M. Introns as mobile genetic elements. Annu. Rev. Biochem. 1993, 62, 587–622. [Google Scholar] [CrossRef]
  48. Saguez, C.; Lecellier, G.; Koll, F. Intronic GIY-YIG endonuclease gene in the mitochondrial genome of Podospora curvicolla: Evidence for mobility. Nucleic Acids Res. 2000, 28, 1299–1306. [Google Scholar] [CrossRef] [PubMed] [Green Version]
  49. Kimura, M. The Neutral Theory of Molecular Evolution; Cambridge University Press: Cambridge, UK, 1983. [Google Scholar]
  50. Makalowski, W.; Boguski, M.S. Evolutionary parameters of the transcribed mammalian genome: An analysis of 2,820 orthologous rodent and human sequences. Proc. Natl. Acad. Sci. USA 1998, 95, 9407–9412. [Google Scholar] [CrossRef] [PubMed] [Green Version]
  51. Lin, R.; Liu, C.; Shen, B.; Bai, M.; Ling, J.; Chen, G.; Mao, Z.; Cheng, X.; Xie, B. Analysis of the complete mitochondrial genome of Pochonia chlamydosporia suggests a close relationship to the invertebrate-pathogenic fungi in Hypocreales. BMC Microbiol. 2015, 15, 5. [Google Scholar] [CrossRef] [PubMed] [Green Version]
  52. Terpstra, P.; Butow, R.A. The role of var1 in the assembly of yeast mitochondrial ribosomes. J. Biol. Chem. 1979, 254, 12662–12669. [Google Scholar] [PubMed]
  53. Terpstra, P.; Zanders, E.; Butow, R.A. The association of var1 with the 38S mitochondrial ribosomal subunit in yeast. J. Biol. Chem. 1979, 254, 2653–12661. [Google Scholar]
  54. Sethuraman, J.; Majer, A.; Iranpour, M.; Hausner, G. Molecular evolution of the mtDNA encoded rps3 gene among filamentous ascomycetes fungi with an emphasis on the ophiostomatoid fungi. J. Mol. Evol. 2009, 69, 372–385. [Google Scholar] [CrossRef]
  55. Wooll, G. Extraribosomal functions of ribosomal proteins. Trends Biochem. Sci. 1996, 21, 164–165. [Google Scholar] [CrossRef]
  56. Wai, A.; Shen, C.; Carta, A.; Dansen, A.; Crous, P.W.; Hausner, G. Intronencoded ribosomal proteins and N-acetyltransferases within the mitochondrial genomes of fungi: Here today, gone tomorrow? Mitochondrial DNA Part A 2019, 30, 573–584. [Google Scholar] [CrossRef]
  57. Korovesi, A.G.; Ntertilis, M.; Kouvelis, V.N. Mt-rps3 is an ancient gene which provides insight into the evolution of fungal mitochondrial genomes. Mol. Phylogenet. Evol. 2018, 127, 74–86. [Google Scholar] [CrossRef]
  58. Rokas, A.; Williams, B.L.; King, N.; Carroll, S.B. Genome-scale approaches to resolving incongruence in molecular phylogenies. Nature 2003, 425, 798–804. [Google Scholar] [CrossRef]
  59. Kuramae, E.E.; Robert, V.; Snel, B.; Weiß, M.; Boekhout, T. Phylogenomics reveal a robust fungal tree of life. FEMS Yeast Res. 2006, 6, 6–1213. [Google Scholar] [CrossRef] [PubMed]
  60. Hibbett, D.S.; Binder, M.; Bischoff, J.F.; Blackwell, M.; Cannon, P.F.; Eriksson, O.E.; Huhndorf, S.; James, T.; Kirk, P.M.; Lucking, R.; et al. A higher-level phylogenetic classification of the fungi. Mycol. Res. 2007, 111, 509–547. [Google Scholar] [CrossRef] [PubMed]
  61. Kang, X.; Hu, L.; Shen, P.; Li, R.; Liu, D. SMRT Sequencing Revealed Mitogenome Characteristics and Mitogenome-Wide DNA Modification Pattern in Ophiocordyceps sinensis. Front. Microbiol. 2017, 8, 1422. [Google Scholar] [CrossRef] [PubMed]
  62. Sreenivasaprasad, S.; Brown, A.E.; Mills, P.R. DNA sequence variation and interrelationship among Colletotrichum species causing strawberry anthracnose. Physiol. Mol. Plant Pathol. 1992, 41, 265–281. [Google Scholar] [CrossRef]
  63. Crouch, J.A.; Clarke, B.B.; Hillman, B.I. What is the value of ITS sequence data in Colletotrichum systematics and species diagnosis? A case study using the falcate-spored graminicolous Colletotrichum group. Mycologia 2009, 101, 648–656. [Google Scholar] [CrossRef] [PubMed]
  64. Vieira, W.A.S.; Lima, W.G.; Nascimento, E.S.; Michereff, S.J.; Camara, M.P.S.; Doyle, V.P. The impact of phenotypic and molecular data on the inference of Colletotrichum diversity associated with Musa. Mycologia 2017, 109, 912–934. [Google Scholar] [CrossRef]
  65. Hyde, K.D.; Cai, L.; McKenzie, E.H.C.; Yang, Y.L.; Zhang, J.Z.; Prihastuti, H. Colletotrichum: A catalogue of confusion. Fungal Divers. 2009, 39, 1–17. [Google Scholar]
  66. Liu, F.; Wang, M.; Damm, U.; Crous, P.W.; Cai, L. Species boundaries in plant pathogenic fungi: A Colletotrichum case study. BMC Evol. Biol. 2016, 16, 81. [Google Scholar] [CrossRef] [Green Version]
  67. Vieira, W.A.S.; Bezerra, P.A.; da Silva, A.C.; Veloso, J.S.; Câmara, M.P.S.; Doyle, V.P. Optimal markers for the identification of Colletotrichum species. Mol. Phylogenet. Evol. 2020, 143, 106694. [Google Scholar] [CrossRef]
  68. Kane, N.C.; Cronk, Q. Botany without borders: Barcoding in focus. Mol. Ecol. 2008, 17, 5175–5517. [Google Scholar] [CrossRef]
  69. Du, M.; Schardl, C.L.; Nuckles, E.M.; Vaillancourt, L.J. Using mating-type gene sequences for improved phylogenetic resolution of Collectotrichum species complexes. Mycologia 2005, 97, 641–658. [Google Scholar] [CrossRef] [PubMed]
  70. Cai, L.; Hyde, K.D.; Taylor, P.W.J.; Weir, B.; Waller, J.; Abang, M.M.; Zhang, Z.J.; Yang, Y.L.; Phoulivong, S.; Liu, Z.Y.; et al. A polyphasic approach for studying Colletotrichum. Fungal Divers. 2009, 39, 183–204. [Google Scholar]
  71. Sharma, G.; Kumar, N.; Weir, B.S.; Hyde, K.D.; Shenoy, B.D. The ApMat marker can resolve Colletotrichum species: A case study with Mangifera indica. Fungal Divers. 2013, 61, 117–138. [Google Scholar] [CrossRef]
  72. Baroncelli, R.; Sanz-MartõÂn, J.M.; Rech, G.E.; Sukno, S.A.; Thon, M.R. Draft genome sequence of Colletotrichum sublineola, a destructive pathogen of cultivated sorghum. Genome Announc. 2014, 2, e00540-14. [Google Scholar] [CrossRef] [Green Version]
  73. Pszczółkowska, A.; Okorski, A.; Jastrzębski, J.P.; Paukszto, Ł.; Fordoński, G. The complete mitogenome of Colletotrichum lupini var. setosum. Mitochondrial DNA Part B 2016, 1, 41–42. [Google Scholar]
  74. Gan, P.; Narusaka, M.; Kumakura, N.; Tsushima, A.; Takano, Y.; Narusaka, Y. Genus-wide comparative genome analyses of Colletotrichum species reveal specific gene family losses and gains during adaptation to specific infection lifestyles. Genome Biol. Evol. 2016, 8, 1467–1481. [Google Scholar] [CrossRef] [Green Version]
  75. Gan, P.; Narusaka, M.; Tsushima, A.; Narusaka, Y.; Takano, Y.; Shirasu, K. Draft genome assembly of Colletotrichum chlorophyti, a pathogen of herbaceous plants. Genome Announc. 2017, 5, e01733-16. [Google Scholar] [CrossRef] [Green Version]
  76. Queiroz, C.B.; de Correia, H.L.N.; Menicucci, R.P.; Vidigal, P.M.P.; de Queiroz, M.V. Draft genome sequences of two isolates of Colletotrichum lindemuthianum, the causal agent of anthracnose in common beans. Genome Announc. 2017, 5, e00214–e00217. [Google Scholar] [CrossRef] [Green Version]
  77. Liang, X.; Wang, B.; Dong, Q.; Li, L.; Rollins, J.A.; Zhang, R.; Sun, G. Pathogenic adaptations of Colletotrichum fungi revealed by genome wide gene family evolutionary analyses. PLoS ONE 2018, 13, e0196303. [Google Scholar] [CrossRef]
Figure 1. Linear maps of the mitochondrial genomes of 11 Colletotrichuim species. All genes, excluding DNA polymerase in the C. graminicola mt genome, are encoded on the same strand. Standard nomenclature was applied for protein and rRNA genes, whereas for tRNA genes, single-letter abbreviations were used. The presented maps include updated genome annotation data for C. graminicola, and C. lindemuthianum (striped bars for rns and rnl).
Genes 11 00552 g001
Figure 2. The distribution of non-synonymous (Ka) to synonymous (Ks) substitutions ratio among 15 protein-coding mitochondrial genes of eleven Colletotrichum species, using C. acutatum as reference genome. For rps3, due to its highest variation, different Ka/Ks ratio scale was applied.
Genes 11 00552 g002
Figure 3. Phylogenetic tree based on sequences of 15 shared protein-coding genes from 11 Colletotrichum species, 33 other Sordariomycetes representatives, and two Penicillium sp., developed using Bayesian posterior probabilities (PP). Bayesian PP are given at each node.
Genes 11 00552 g003
Table 1. GenBank accession numbers and references for Colletotrichum cp genomes used in this study.
SpeciesComplexAccession numberReference
C. acutatumacutatumNC_027280Kim et al. 2016 [27]
C. lupiniNC_029213This study
C. fioriniaeNC_030052This study
C. salicisNC_035496This study
C. tamarilloiNC_029706This study
C. gloeosporioidesgloeosporioidesKX885104Liang et al. 2017 [28]
C. aenigmaKX885105Liang et al. 2017 [28]
C. fructicolaKX034082Liang et al. 2017 [28]
C. siamenseKX885102Liang et al. 2017 [28]
C. graminicolagraminicolaNW_007361658Vaillancourt et al. 2015 [29]
C. lindemuthianumorbiculareNC_023540Gutierrez et al. 2016 [30]
Table 2. General features of the mitochondrial genomes of selected Colletotrichum species.
SpeciesLength [bp]%GCStart codon Stop codonPCGsrRNAstRNAsIntrons
TotalCDSAUGUUGAUU UAAUAG
C. acutatum30,89214,42430.511500 141 (nad6)152281
C. lupini36,55414,42129.911500 141 (nad6)152291
C. fioriniae30,02014,43630.041500 141 (nad6)152291
C. salicis33,95014,42430.441500 141 (nad6)152292
C. tamarilloi30,82414,42130.501500 141 (nad6)152291
C. gloeosporioides55,16914,72134.55141 (cox3)0 132 (cox3 and nad6)152278
C. aenigma57,25214,74834.28141 (cox3)0 132 (cox3 and nad6)152279
C. fructicola56,05114,47534.04141 (cox3)0 132 (cox3 and nad6)152279
C. siamense54,64514,74534.30141 (cox3)0 132 (cox3 and nad6)152277
C. graminicola39,64916,48229.891501 (atp6) 151 (nad6)162252
C. lindemuthianum36,95715,01230.881501 142 (cox1 and nad6)162272
CDS: Coding sequences; PCGs: Protein Coding Genes

