Communication

Transcriptomic Prediction of Pig Liver-Enriched Gene 1 Functions in a Liver Cell Line

1
Department of Animal Science, College of Animal Sciences, Zhejiang University, Hangzhou 310058, China
2
Department of Veterinary Medicine, College of Animal Sciences, Zhejiang University, Hangzhou 310058, China
3
Department of Chemical Engineering, Hindustan Institute of Technology and Science, Chennai 603103, India
*
Author to whom correspondence should be addressed.
Genes 2020, 11(4), 412; https://doi.org/10.3390/genes11040412
Submission received: 13 March 2020 / Revised: 27 March 2020 / Accepted: 9 April 2020 / Published: 10 April 2020
(This article belongs to the Section Animal Genetics and Genomics)

Abstract

:
The newly identified liver-enriched gene 1 (LEG1) encodes a protein with a characteristic domain of unknown function 781 (DUF781/LEG1), constituting a protein family with only one member in mammals. A functional study in zebrafish suggested that LEG1 genes are involved in liver development, while the platypus LEG1 homolog, Monotreme Lactation Protein (MLP), which is enriched in the mammary gland and milk, acts as an antibacterial substance. However, no functional studies on eutherian LEG1s have been published to date. Thus, we here report the first functional prediction study at the cellular level. As previously reported, eutherian LEG1s can be classified into three paralogous groups. Pigs have all three LEG1 genes (pLEG1s), while humans and mice have retained only LEG1a. Hence, pLEG1s might represent an ideal model for studying LEG1 gene functions. RNA-seq was performed by the overexpression of pLEG1s and platypus MLP in HepG2 cells. Enrichment analysis showed that pLEG1a and pLEG1b might exhibit little function in liver cells; however, pLEG1c is probably involved in the endoplasmic reticulum (ER) stress response and protein folding. Additionally, gene set enrichment analysis revealed that platypus MLP shows antibacterial activity, confirming the functional study in platypus. Therefore, our study showed from the transcriptomic perspective that mammalian LEG1s have different functions in liver cells due to the subfunctionalization of paralogous genes.

1. Introduction

Limited information is currently available concerning the biological functions of liver-enriched gene 1 (LEG1 or C6orf58 homolog), which encodes a protein with the characteristic domain of unknown function 781 (DUF781 or LEG1 domain). The name of the gene is based on its enrichment in zebrafish liver, and it was experimentally shown to participate in liver development and to mediate an anti-stress pathway during liver development [1,2]. Two LEG1 copies are found in the zebrafish genome (zleg1a and zleg1b), which exhibit functional redundancy. The encoded LEG1 proteins are glycosylated secreted proteins, as indicated by several potential N-glycosylated sites and a signal peptide preceding the LEG1 domain. These features have been validated in numerous proteomic studies in mammals, in which glycosylated LEG1 proteins are present in the saliva, milk, and seminal plasma [3,4,5,6,7]. However, the only functional study of mammalian LEG1 thus far was carried out in platypus, in which the mammary gland- and milk-enriched LEG1 homolog Monotreme Lactation Protein (MLP) plays a role in antibacterial activity during the nipple-less delivery of milk to pups [8]. To elucidate the function of LEG1 genes, we previously conducted a phylogenetic analysis using all the available LEG1 protein information, which was predicted based on the presence of the LEG1 domain [9]. In that study, mammalian LEG1 genes could be classified into three separate clades: LEG1a, LEG1b, and LEG1c. These different clades might have undergone subfunctionalization, thus conferring different functions upon each clade. Among the species included in the analysis, humans and mice only have one copy of the LEG1 gene, belonging to LEG1a (hLEG1a and mLeg1a). Pigs, on the other hand, exhibit all three copies, designated pLEG1a, pLEG1b, and pLEG1c, the last of which phylogenetically clusters with platypus MLP. Therefore, platypus MLP and pLEG1c might share similar functions, while the orthologous genes hLEG1a, mLeg1a, and pLEG1a preserve other functions [9].
To decipher the biological roles of each clade of mammalian LEG1 genes, we performed a gain-of-function study. The three pig LEG1 genes were overexpressed in the HepG2 liver cell line to determine whether the overexpression of LEG1 genes could result in biological alterations in the cell line. We first predicted the functions of the genes using two bioinformatics tools. Then, RNA-seq and enrichment analyses were employed to investigate the results. We show here that pLEG1a and pLEG1b play few roles in hepatic cells, while pLEG1c might be involved in misfolded protein processing and endoplasmic reticulum stress responses. We also confirmed that some antibacterial Gene Ontology (GO)/Kyoto Encyclopedia of Genes and Genomes (KEGG) terms were altered by overexpressing platypus MLP. Therefore, the different clades of LEG1 genes might have experienced subfunctionalization after duplication in mammalian genomes.

2. Materials and Methods

2.1. Cell Culture and Transfection

HepG2 cells were purchased from the American Type Culture Collection (ATCC, Manassas, VA, USA) and cultured in Dulbecco’s Modified Eagle Medium (HyClone, GE, Beijing, China) with 10% fetal bovine serum (HyClone, GE, Beijing, China). Transfection reactions were performed when 1 × 10⁶ cells reached 80% confluency in 6-well plates with 3 micrograms of endotoxin-free plasmids (Endofree Mini Plasmid Kit II, Tiangen, Beijing, China) using Lipofectamine 3000 (Thermo Fisher, Shanghai, China) according to the manufacturers’ guidelines. For each plasmid, transfections were carried out at least three times.

2.2. Plasmid Preparation

The pig LEG1 gene expression plasmids pCAG-pleg1a-3×FLAG, pCAG-pleg1b-3×HA, and pCAG-pleg1c-3×FLAG were constructed previously [9]. Using similar strategies, the pCAG-platypusMLP-3×FLAG plasmid was generated. Briefly, the platypus MLP coding sequence (NM_001323776) was modified by adding a Kozak site to the 5′ end and a 3×FLAG sequence to the 3′ end. Then, two NotI sites were added to either end. Thereafter, the designed sequence (NotI-Kozak-MLP-3×FLAG-NotI) was synthesized by GenScript (Nanjing, China) and subcloned into the pUC57 vector. Finally, the NotI-digested fragment from the pUC57 vector was gel purified (Thermo Fisher, Shanghai, China) and subcloned into the NotI site of the pCAG-floxP-neo plasmid to generate the pCAG-platypusMLP-3×FLAG plasmid. The empty vector (pCAG-floxP-neo) without the LEG1 gene was used as a control. The schemes of four LEG1 containing plasmids are shown in Figure S1.

2.3. RNA Extraction, Reverse-Transcription PCR (RT-PCR), Quantitative Real-Time PCR (qRT-PCR), and RNA-seq

One million nontransfected HepG2 cells were first subjected to RNA extraction using a Total RNA Kit I (Omegabiotek, Guangzhou, China). First-strand cDNA was synthesized using the M-MLV kit from Promega (Madison, WI, USA). RT-PCR was carried out in a 15 μL reaction containing either hLEG1a-specific primers (hLeg1a-F: TTTATGGGGGTTGCCTCTGC, hLeg1a-R: CCACAGTTTGTCCTTCGGGT) or human ACTB primers (hbactin-F: CCCCAAGGCCAACCGCGAGAAGAT, hbactin-R: AGGTCCCGGCCAGCCAGGTCCAG).
Forty-eight hours after the transfection of HepG2 cells with different plasmids, total RNA was prepared using the MiniBEST Universal RNA Extraction Kit (Takara, Dalian, China). One microgram RNA was used for subsequent qRT-PCR validations, which were performed in a 15 μL reaction with 7.5 μL SYBR Green (Takara, Dalian, China), 0.2 μM primer, and 1 μL reversely transcribed cDNA. The primers for qRT-PCR are as follows: pLEG1a (pLeg1a-F: GGATGCACACATTTCAGCCT, pLeg1a-R: ACAAGGACTCGTGGTGGTAG), pLEG1b (pLeg1b-F: CCCTCTTCCCTACGACTTTGA, pLeg1b-R: AACAAGCATTCGTGTTGGC), pLEG1c (pLeg1c-F: GCATCGGCTTCTATGTGCTT, pLeg1c-R: TGCCTCTATCCATAGCTCGTG), platypus MLP (MLP-F: TCATTCCCTTTCAGGTGGCT, MLP-R: AAGTGGAGACTGAGCTGGAC), and human ACTB (hbactin-F and hbactin-R).
Then, the rest of the RNA was used for library construction and subjected to sequencing on the Illumina HiSeq X Ten platform (San Diego, CA, USA) and quality control was according to the pipeline of Novogene (Beijing, China). The software Salmon [10], which can efficiently quantify transcript abundance, without aligning reads to a reference genome, was used to quantify transcription levels with a human target transcriptome as a reference. The target transcriptome used here was composed of human genes’ cDNA sequences and the plasmid sequences containing pig LEG1 genes and platypus MLP gene. After expression profiles of these genes were measured, differentially expressed gene (DEG) set (adjusted p-value < 0.05 and |log2fold change| > 0.5849) identification was then performed using DESeq2 [11]. Sample-level principal component analysis (PCA) was conducted based on the variance stabilization transformation of counts (vst function of DESeq2). The RNA-seq data were submitted to the Gene Expression Omnibus under accession number GSE145329.

2.4. Enrichment Analysis

The DEGs were first subjected to searches with either the Database for Annotation, Visualization and Integrated Discovery (DAVID) tool [12,13] or the Molecular Signatures Database (MSigD) [14] to identify significantly enriched Gene Ontology (GO) [15] terms and Kyoto Encyclopedia of Genes and Genomes (KEGG) [16] pathways using default parameters (EASE score/modified Fisher’s exact p-value < 0.1 or false discovery rate (FDR) < 0.05, respectively).
Then, gene set enrichment analysis (GSEA) [14] was performed for each gene set using GSEA (v.4.0.3, Broad Institute Inc., San Diego, CA, USA) with default parameters (1000× permutation; Signal2Noise as the metric for ranking genes). C5 collection (GO) and C2 (KEGG) were utilized to identify GO terms and KEGG pathways that were differentially regulated in different comparisons. Significantly enriched terms were identified according to a p-value < 0.05, FDR < 0.25, and |Normalized Enrichment Score (NES)| > 1.

2.5. Bioinformatic Prediction of the Functions of LEG1 Proteins

Two bioinformatics tools were employed: PANDA and I-TASSER, which predict protein functions based on the homolog searches and protein structure, respectively [17,18]. Default parameters were used by submitting the following sequences: pLEG1a (XP_003121259.1), pLEG1b (XP_020930551.1), pLEG1c (XP_020940144.1), and platypus MLP (NP_001310705.1).

2.6. Statistics

One-way ANOVA with Tukey’s honestly significance difference (HSD) post hoc method was used to compare the expression levels (transcripts per million, TPM) of the hLEG1a, pLEG1a, pLEG1b, pLEG1c, and platypus MLP genes in different transfection groups. Two-way ANOVA with interaction effect (group × gene) combined with Tukey’s HSD were then employed to measure the exogenous gene expression levels measured by the qRT-PCR in each group. Data are presented as the means ± standard errors of the mean (SEMs). Type I error was set at 0.05.

2.7. Ethical Statement

The current experiment was conducted according to the guidelines of China Council on Animal Care and Protocol and approved by the Animal Welfare Committee of Zhejiang University (no. 11834 issued on 26 February 2018).

3. Results

3.1. Bioinformatic Prediction of LEG1 Functions

Currently, insufficient information regarding the function of LEG1 proteins is available. Thus, in our study, in silico methods were first used to predict the functions of these proteins. PANDA predicted that pLEG1a, pLEG1b, pLEG1c, and platypus MLP are all secreted proteins involved in multicellular organism development, while pLEG1c and MLP play additional roles in the liver and digestive system development (Table S1). In contrast, the I-TASSER method showed that these LEG1 proteins were all involved in respiration-related processes and neural cell-related processes (Table S2). The cellular components predicted by I-TASSER belonged to the intracellular, plasma membrane, and mitochondrial inner membrane categories, in contrast to the results of PANDA (Tables S1 and S2). Overall, the in silico predictions produced by the two approaches raised fairly different results, necessitating the experimental prediction method.

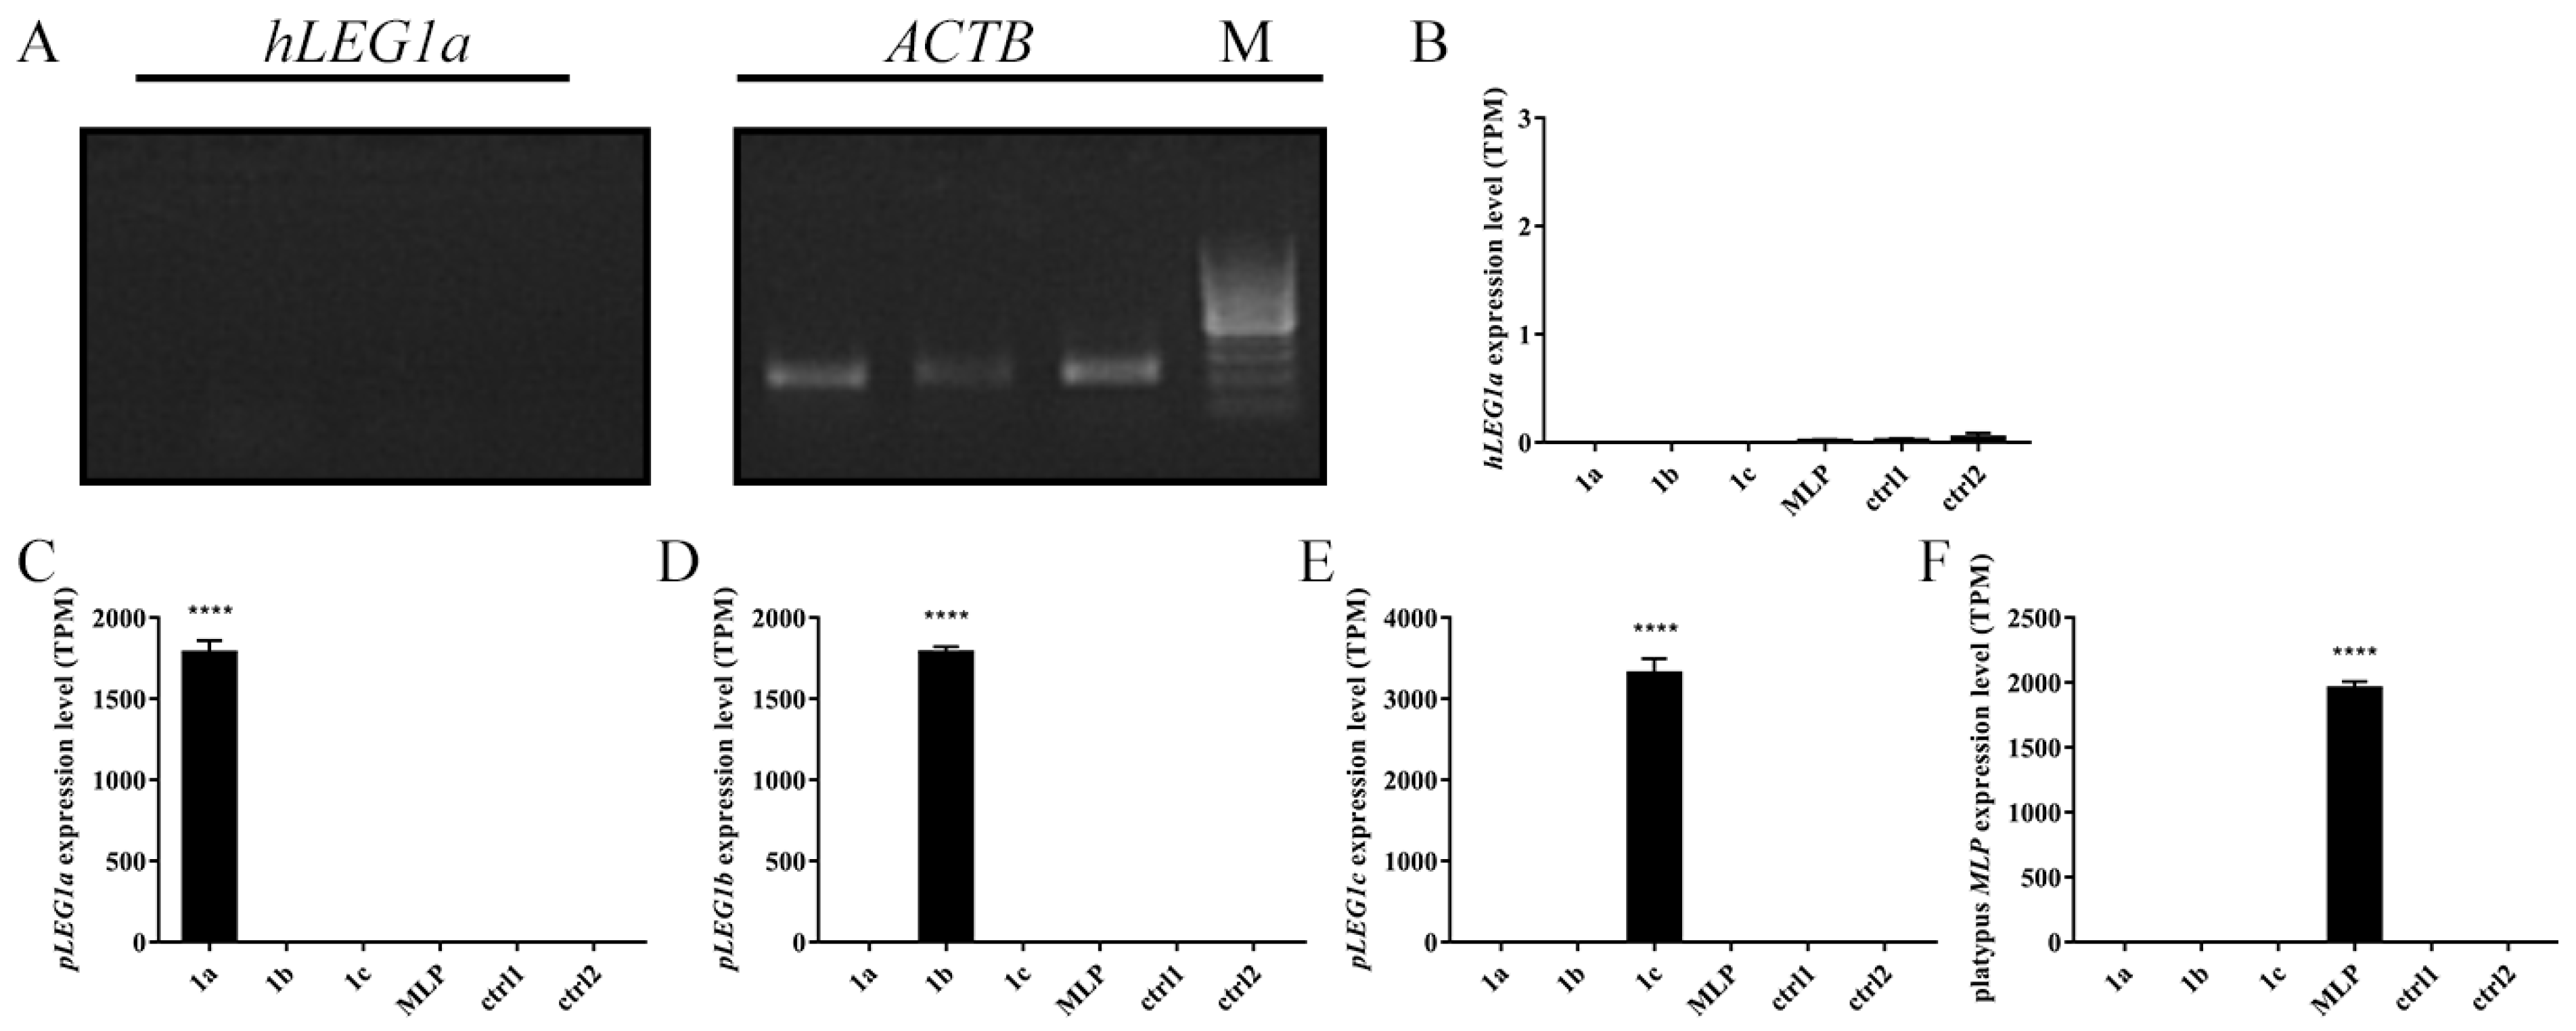
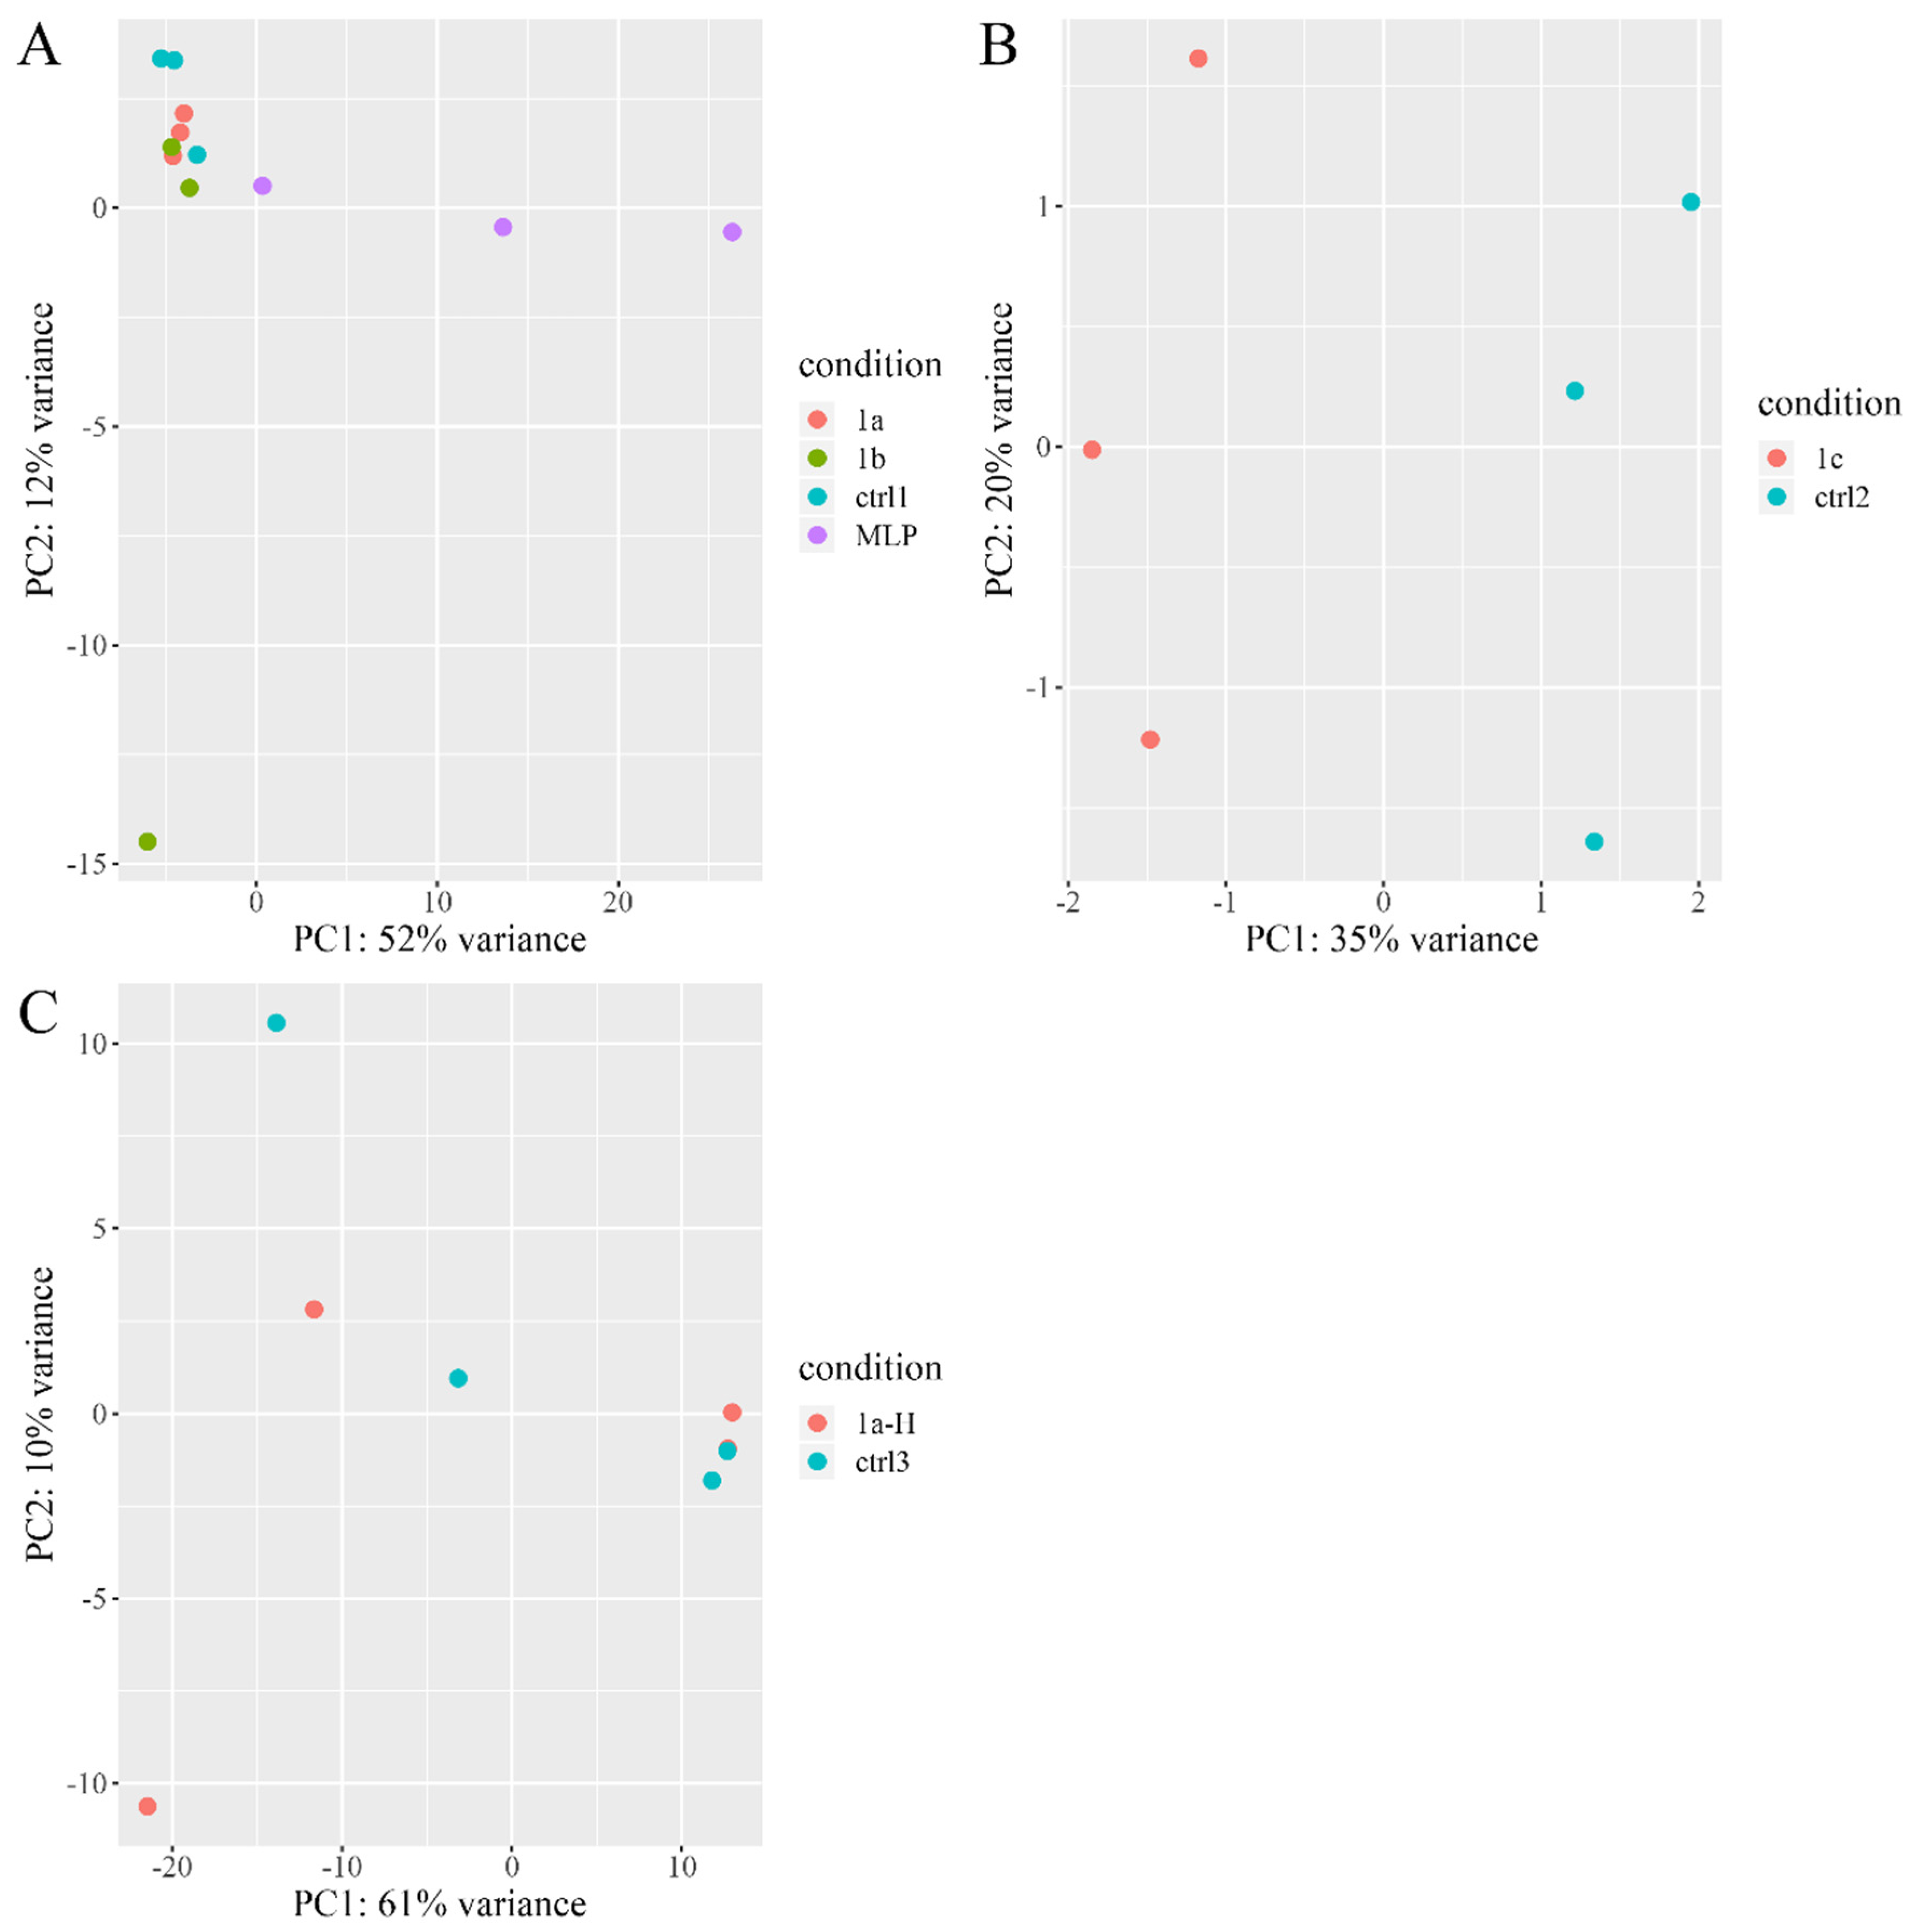
3.2. HepG2 Cells Transfected with LEG1 Genes

As a human liver cancer cell line, the HepG2 cell line was used in our experiment to elucidate the function of “liver-enriched genes”. The lack of endogenous expression of hLEG1a shown by RT-PCR (Figure 1A) precluded the application of a loss-of-function study. Alternatively, a gain-of-function study by the overexpression of pig LEG1s and platypus MLP was performed. Two batches of experiments were conducted in series. In the first batch, the HepG2 cells were transfected with pLEG1a, pLEG1b, and platypus MLP expression plasmids and an empty vector (designated hereafter as the 1a, 1b, MLP, and ctrl1 groups); the second batch consisted of experiments using the pLEG1c plasmid and the empty vector (1c and ctrl2 hereafter). Total RNA was extracted 48 h later and subjected to RNA-seq analysis, in which the DEGs were analyzed using 1a, 1b, and MLP compared with ctrl1 and 1c compared with ctrl2. By comparing the RNA-seq readouts, each exogenous gene was found to be highly and specifically expressed in transfected cells, while endogenous hLEG1a levels were barely detectable, confirming the RT-PCR results (Figure 1). qRT-PCR was then employed to validate the RNA-seq results, in which the exogenous gene expression levels were comparable in each group (Table S3). RNA-seq analysis showed that in 1a cells, there were only 7 DEGs, among which 4 genes were upregulated, and 3 were downregulated; in the 1b group, 16 DEGs were found, among which 10 were upregulated, and 6 were downregulated; in 1c cells, 33 DEGs were detected, among which 31 were upregulated, and 2 were downregulated; in MLP transfected cells, 1305 DEGs were discovered, among which 539 were upregulated, and 766 were downregulated (Figure 2A). No DEGs were shared by the four groups. In addition, only a few genes were shared between groups, indicating that the functions of the genes might differ (Figure 2B). Next, a heatmap of the transcription profiles was constructed using all of the DEGs identified (1335 DEGs) in combination with the RNA-seq results from our previous HEK293T study, which served as an outgroup (GSE134920) [9]. The comparison showed that platypus MLP triggered significantly different transcriptomic alterations compared to the other groups (Figure S2). PCA analysis indicated that 1a and 1b were grouped with ctrl1, while the 1c and MLP groups exhibited more differences from their respective controls (Figure 3).

3.3. Enrichment Analysis Using DAVID and MSigD

The DEGs identified by RNA-seq were subjected to GO and KEGG analysis using DAVID and MSigD. For the 1a group, no hits were found using either of the methods (Table 1, Tables S4 and S5). For the 1b group, GO terms related to transcriptional regulation were identified using DAVID (Table 1 and Table S4). DAVID analysis of the DEGs from the 1c group showed that cell differentiation, autophagy, glucose transport, protein stability, and unfolded protein terms were enriched (Table 1 and Table S4). MSigD only showed that the endoplasmic reticulum (ER) stress-related process was changed in the 1c group (Table S5). Thus, pLEG1c might primarily regulate improperly folded proteins in the ER. More than 1300 DEGs were identified in the MLP group, resulting in numerous potentially disturbed pathways or biological processes. The GO_BP terms identified mitochondrial-related pathways such as mitochondrial translation, protein transport, respiratory chain complex I assembly, and electron transport; transcription and translation modulation; gene silencing; cell cycle regulation; organ, tissue, and cell development and differentiation; and neurogenesis and cerebral cortex development. The KEGG terms were associated with many cancer-related diseases, including renal cell carcinoma, viral carcinogenesis, and prostate cancer, neural system disorders, including Huntington’s disease, Alzheimer’s disease, Parkinson’s disease, and non-alcoholic fatty liver disease (Table 1 and Tables S4 and S5). Thus, platypus MLP might have broad biological functions related to the neural system, mitochondria, and development.

3.4. GSEA

To complement our enrichment analysis, the genes identified in the RNA-seq experiments were subjected to GSEA despite the significance levels. An additional term in the 1a group was detected that participates in the negative regulation of translational initiation (Table 2). Hormone biosynthesis, synapse localization, and systemic lupus erythematosus terms were identified in the 1c group (Table 2). GSEA of platypus MLP showed terms such as detoxification, defense response to fungus, defense response to Gram-negative bacterium, antigen processing and presentation, and virion assembly, implying an anti-extracellular biotic stress function of MLP (Table 2 and Table S6).

4. Discussion

Our previous study suggested that mammalian LEG1 genes could be divided into three classes, LEG1a, LEG1b, and LEG1c [9]. Tandem duplication occurred first in the common ancestor of mammals, giving rise to the LEG1c and LEG1 branches. Then, another duplication event took place in the common ancestor of eutherian mammals. Therefore, three copies of LEG1 can be found in some eutherian species, such as pig, while only two copies existed in proto- and metatherian species, such as the platypus. However, in the majority of eutherian animals, only the LEG1a gene has been preserved due to the pseudogenization of LEG1b and LEG1c (e.g., hLEG1a and mLeg1a). Therefore, the pig might be a better model for elucidating the functions of each LEG1 clade, since it retains all LEG1 copies [9]. Thus, pLEG1a, pLEG1b, and pLEG1c were subjected to subsequent studies.
Thus far, functional studies regarding LEG1 have only been conducted on zleg1 and platypus MLP [1,2,8,19]. In the former species, zleg1 genes were suggested to play a role in liver development, since the knockdown of zleg1 genes results in a small liver phenotype [1]. In the latter species, MLP shows antibacterial activity in milk [8]. No functional studies on eutherian LEG1 have yet been published. Hence, to determine the potential roles of the genes, bioinformatics tools were employed first to predict the functions of the pLEG1 genes. As prediction methods are all based on a priori knowledge, each LEG1 protein was predicted to exhibit nearly identical functions using each approach. This may be because the LEG1 proteins constitute a protein family containing no other proteins, and the different paralogs could not be discerned by in silico prediction methods. PANDA predicted that platypus MLP and pig pLEG1c are involved in digestive system/liver development, which may be based on the study of zleg1. However, in our study, we did not find any entries related to liver or digestive system development except for non-alcoholic fatty liver disease entry in MLP-transfected cells (Table S4). In contrast, the I-TASSER method predicted that LEG1 proteins play roles in the mitochondria, respiration, heme binding, and neural system, as related terms were identified in our experiment (Tables S4–S6).
According to previous transcription profiling experiments, hLEG1a, mLeg1a, and pLEG1a could only be detected in the salivary glands, while pLEG1b and pLEG1c were not detectable in the examined tissues, in contrast to the ubiquitous expression of platypus MLP [8,9,20,21]. Thus, we proposed in our previous paper that after the duplication events, the mammalian LEG1 genes underwent subfunctionalization, leading to different functions of each of the LEG1 copies [9,22,23]. Therefore, we initially decided to study each clade of LEG1 genes in the liver or salivary gland epithelial cells. However, no authenticated immortalized salivary gland epithelial cell lines exist at present, as previously established cell lines have been reported to be contaminated by other cells or are not well characterized or widely used [24,25,26,27]. Therefore, only the HepG2 liver cell line was employed in our current study. As demonstrated by RT-PCR, no endogenous hLEG1a expression was detected in the cell line, and the gain-of-function approach by the overexpression of pLEG1 genes and platypus MLP in the cells was utilized.
By the overexpression of LEG1 genes in HepG2 cells, gene functions could be predicted based on the altered transcriptomes [28]. Our RNA-seq analysis confirmed the highly specific expression of each LEG1 gene in the cells 48 hours after transfection (Figure 1 and Table S3). Additionally, the expression levels of each LEG1 gene detected by qRT-PCR were comparable, precluding the effect of different expressions on the altered transcriptomes (Table S3). Then, the DEGs were first used in searches against DAVID [12,13] and MSigD [14] databases by the simple Fisher’s exact test for overrepresented biological processes archived in the GO [15] and KEGG [16] databases. Moreover, the RNA-seq experiment revealed either a few DEGs or numerous DEGs, which are more suitable for GSEA [14] irrespective of the number of DEGs. Thus, GSEA was employed to provide additional information regarding the functions of the LEG1 genes. In order to provide a more comprehensive prediction of the pLEG1a functions, loose parameters (the p-values rather than the adjusted p-values), were utilized to identify the DEGs in HEK293T cells transfected with pLEG1a in our previous work, in spite of more false-positive hits [9]. To reduce the false-positive prediction, our current work used the stringent parameters. In pLEG1a- and pLEG1b-overexpressing cells, only 7 and 16 DEGs were identified, which showed potential roles in translation or transcriptional regulation, respectively, using different enrichment approaches. However, due to the relatively small number of DEGs and altered pathways/biological processes identified, in combination with the PCA results showing the clustering of the 1a and 1b groups with the ctrl1 group, pLEG1a and pLEG1b may not be functional in liver cells, confirming a subfunctionalization model from our previous study [9]. Regarding the pLEG1c gene, the functional predictions using GO and KEGG showed that it might play a major role in ER stress and misfolded protein regulation, with additional roles in autophagy, cell differentiation, and glucose transport. However, these functions could be dispensable since pLEG1c was not expressed in the tissues tested [9]. As platypus MLP could be detected in several tissues, including the liver [8], the examination of platypus MLP revealed numerous disturbed GO and KEGG terms, suggesting its role in organ/tissue/cell development, the neural system, cell cycle regulation, and mitochondria-related pathways, consistent with the prediction results of I-TASSER. Platypus MLP and pLEG1c are orthologs; thus, some potential biological roles were shared by the two genes, such as autophagy and neuron-related processes. One interesting role of platypus MLP is its antibacterial activity, and in our analysis some immune-related pathways and viral, fungal, and bacterial-related pathways were also identified (Table 2). In the platypus MLP experiment, the protein showed antibacterial activity against Gram-positive bacteria, with no effect on Gram-negative microbes, which is contrary to the anti-Gram-negative bacteria GO term (Table 2) [8]. Therefore, further experimental validation is needed. In the current study, we did not find that pLEG1c was associated with antibacterial activity, nor did the pLEG1s or platypus MLP show any functional roles in liver development compared to the orthologous zebrafish leg1s. It has been reported that LEG1 genes exhibit differential expression patterns and functional differences. In addition, strong purifying selection across vertebrate LEG1 genes has also been noticed [9]. Similar results have been presented in other genes as well [29,30], which suggests subfunctionalization events after gene duplications [22,23]. Therefore, each of the LEG1 duplicates retained a subset of ancestral LEG1 gene function.

5. Conclusions

Using RNA-seq-based prediction methods, it was found that pLEG1 genes, as representatives of mammalian LEG1 genes, may exert different functions in liver cells, confirming a subfunctionalization event during evolution.

Supplementary Materials

The following are available online at https://www.mdpi.com/2073-4425/11/4/412/s1, Figure S1. Schematic representation of the four LEG1 containing plasmids. Figure S2. Heatmap showing the expression profiles of 1335 DEGs in each LEG1 transgenic group versus the respective controls. Hierarchical clustering was applied to the samples (columns) and DEGs (rows). The HEK293T cells with pLEG1a expression (1a-H1, -H2, -H3, and -H4) and without pLEG1a expression (ctrl 3-1, -2, -3, and -4) were used as outgroups. Table S1. PANDA prediction of the functions of LEG1s. Table S2. TASSER prediction of the functions of LEG1s. Table S3. qRT-PCR validation of LEG1 gene expression in each group. Table S4. Complete list of significantly enriched GO and KEGG terms/pathways identified by DAVID. Table S5. Complete list of significantly enriched GO terms identified by MSigD. Table S6. Complete list of significantly enriched GO and KEGG terms/pathways identified by GSEA.

Author Contributions

J.H. conceived the study and designed the experiment. Z.Z., Z.W., Y.D., and J.W. performed the experiments. Z.Z., S.J., and J.H. analyzed the data. J.H. wrote the manuscript. Z.Z., Y.D., Z.W., J.W., H.W., S.J., and J.H. edited the manuscript. All authors have read and agreed to the published version of the manuscript.

Funding

This work and the APC were supported/funded by the National Natural Science Foundation of China (No. 31802029).

Conflicts of Interest

The authors declare no conflicts of interest.

Abbreviations

LEG1liver-enriched gene 1
MLPmonotreme lactation protein
DUF781domain of unknown function 781
GOGene Ontology
KEGGKyoto Encyclopedia of Genes and Genomes
DEGdifferentially expressed gene
BPbiological process
CCcellular component
MFmolecular function
PCAprincipal component analysis
DAVIDDatabase for Annotation Visualization and Integrated Discovery tool
MSigDMolecular Signature Database
GSEAGene set enrichment analysis
TPMtranscripts per million
NESNormalized enrichment score
EREndoplasmic reticulum

References

  1. Chang, C.; Hu, M.; Zhu, Z.; Lo, L.J.; Chen, J.; Peng, J. Liver-enriched gene 1a and 1b Encode Novel Secretory Proteins Essential for Normal Liver Development in Zebrafish. PLOS ONE 2011, 6, e22910. [Google Scholar] [CrossRef] [Green Version]
  2. Hu, M.; Bai, Y.; Zhang, C.; Liu, F.; Cui, Z.; Chen, J.; Peng, J. Liver-Enriched Gene 1, a Glycosylated Secretory Protein, Binds to FGFR and Mediates an Anti-stress Pathway to Protect Liver Development in Zebrafish. PLoS Genet. 2016, 12, e1005881. [Google Scholar] [CrossRef] [PubMed] [Green Version]
  3. Yang, H.; Zhou, B.; Deng, H.; Prinz, M.; Siegel, D. Body fluid identification by mass spectrometry. Int. J. Leg. Med. 2013, 127, 1065–1077. [Google Scholar] [CrossRef] [PubMed]
  4. Ramachandran, P.; Boontheung, P.; Pang, E.; Yan, W.; Wong, D.T.; Loo, J.A. Comparison of N-linked Glycoproteins in Human Whole Saliva, Parotid, Submandibular, and Sublingual Glandular Secretions Identified using Hydrazide Chemistry and Mass Spectrometry. Clin. Proteom. 2008, 4, 80–104. [Google Scholar] [CrossRef] [PubMed] [Green Version]
  5. Pini, T.; Leahy, T.; Soleilhavoup, C.; Tsikis, G.; Labas, V.; Combes-Soia, L.; Harichaux, G.; Rickard, J.; Druart, X.; De Graaf, S.P. Proteomic Investigation of Ram Spermatozoa and the Proteins Conferred by Seminal Plasma. J. Proteome Res. 2016, 15, 3700–3711. [Google Scholar] [CrossRef]
  6. Karn, R.C.; Chung, A.G.; Laukaitis, C.M. Shared and Unique Proteins in Human, Mouse and Rat Saliva Proteomes: Footprints of Functional Adaptation. Proteomes 2013, 1, 275–289. [Google Scholar] [CrossRef] [Green Version]
  7. Bisana, S.; Kumar, S.; Rismiller, P.; Nicol, S.C.; Lefevre, C.; Nicholas, K.R.; Sharp, J.A. Identification and Functional Characterization of a Novel Monotreme- Specific Antibacterial Protein Expressed during Lactation. PLOS ONE 2013, 8, e53686. [Google Scholar] [CrossRef]
  8. Enjapoori, A.K.; Grant, T.R.; Nicol, S.C.; Lefèvre, C.M.; Nicholas, K.R.; Sharp, J.A. Monotreme Lactation Protein Is Highly Expressed in Monotreme Milk and Provides Antimicrobial Protection. Genome Boil. Evol. 2014, 6, 2754–2773. [Google Scholar] [CrossRef]
  9. Dang, Y.; Wang, J.-Y.; Liu, C.; Zhang, K.; Jinrong, P.; He, J. Evolutionary and Molecular Characterization of liver-enriched gene 1. Sci. Rep. 2020, 10, 4262. [Google Scholar] [CrossRef]
  10. Patro, R.; Duggal, G.; Love, M.I.; A Irizarry, R.; Kingsford, C. Salmon provides fast and bias-aware quantification of transcript expression. Nat. Methods 2017, 14, 417–419. [Google Scholar] [CrossRef] [Green Version]
  11. Love, M.I.; Huber, W.; Anders, S. Moderated estimation of fold change and dispersion for RNA-seq data with DESeq2. Genome Biol 2014, 15, 002832. [Google Scholar] [CrossRef] [PubMed] [Green Version]
  12. Huang, D.W.; Sherman, B.T.; Lempicki, R.A. Systematic and integrative analysis of large gene lists using DAVID bioinformatics resources. Nat. Protoc. 2009, 4, 44–57. [Google Scholar] [CrossRef] [PubMed]
  13. Huang, D.W.; Sherman, B.T.; Lempicki, R. Bioinformatics enrichment tools: paths toward the comprehensive functional analysis of large gene lists. Nucleic Acids Res. 2008, 37, 1–13. [Google Scholar] [CrossRef] [Green Version]
  14. Subramanian, A.; Tamayo, P.; Mootha, V.K.; Mukherjee, S.; Ebert, B.L.; Gillette, M.A.; Paulovich, A.; Pomeroy, S.L.; Golub, T.R.; Lander, E.S.; et al. Gene set enrichment analysis: A knowledge-based approach for interpreting genome-wide expression profiles. Proc. Natl. Acad. Sci. USA 2005, 102, 15545–15550. [Google Scholar] [CrossRef] [PubMed] [Green Version]
  15. Ashburner, M.; Ball, C.A.; A Blake, J.; Botstein, D.; Butler, H.; Cherry, J.M.; Davis, A.P.; Dolinski, K.; Dwight, S.S.; Eppig, J.T.; et al. Gene Ontology: Tool for the unification of biology. Nat. Genet. 2000, 25, 25–29. [Google Scholar] [CrossRef] [PubMed] [Green Version]
  16. Kanehisa, M. KEGG: Kyoto Encyclopedia of Genes and Genomes. Nucleic Acids Res. 2000, 28, 27–30. [Google Scholar] [CrossRef]
  17. Wang, Z.; Zhao, C.; Wang, Y.; Sun, Z.; Wang, N. PANDA: Protein function prediction using domain architecture and affinity propagation. Sci. Rep. 2018, 8, 3484. [Google Scholar] [CrossRef]
  18. Yang, J.; Zhang, Y. I-TASSER server: New development for protein structure and function predictions. Nucleic Acids Res. 2015, 43, W174–W181. [Google Scholar] [CrossRef] [Green Version]
  19. Lin, T.-Y.; Chou, C.-F.; Chung, H.-Y.; Chiang, C.-Y.; Li, C.-H.; Wu, J.-L.; Lin, H.-J.; Pai, T.-W.; Hu, C.-H.; Tzou, W.-S. Hypoxia-Inducible Factor 2 Alpha Is Essential for Hepatic Outgrowth and Functions via the Regulation of leg1 Transcription in the Zebrafish Embryo. PLOS ONE 2014, 9, e101980. [Google Scholar] [CrossRef]
  20. Zhu, Z.-H.; Hu, M.-J.; Chang, C.-Q.; Peng, J. Analysis of expression pattern of zebrafish leg1 homologus gene mu-leg1 in mouse. Hered. (Beijing) 2012, 34, 1174–1180. [Google Scholar]
  21. Freeman, T.C.; Ivens, A.; Baillie, J.K.; Beraldi, D.; Barnett, M.W.; Dorward, D.; Downing, A.; Fairbairn, L.; Kapetanovic, R.; Raza, S.; et al. A gene expression atlas of the domestic pig. BMC Boil. 2012, 10, 90. [Google Scholar] [CrossRef] [PubMed] [Green Version]
  22. Prince, V.; Pickett, F.B. Splitting pairs: the diverging fates of duplicated genes. Nat. Rev. Genet. 2002, 3, 827–837. [Google Scholar] [CrossRef] [PubMed]
  23. Force, A.; Lynch, M.; Pickett, F.B.; Amores, A.; Yan, Y.L.; Postlethwait, J. Preservation of duplicate genes by complementary, degenerative mutations. Genet. 1999, 151, 1531–1545. [Google Scholar]
  24. Lin, L.-C.; Elkashty, O.; Ramamoorthi, M.; Trinh, N.; Liu, Y.; Sunavala-Dossabhoy, G.; Pranzatelli, T.; Michael, D.G.; Chivasso, C.; Perret, J.; et al. Cross-contamination of the human salivary gland HSG cell line with HeLa cells: A STR analysis study. Oral Dis. 2018, 24, 1477–1483. [Google Scholar] [CrossRef] [PubMed]
  25. Phuchareon, J.; Ohta, Y.; Woo, J.M.; Eisele, D.W.; Tetsu, O. Genetic Profiling Reveals Cross-Contamination and Misidentification of 6 Adenoid Cystic Carcinoma Cell Lines: ACC2, ACC3, ACCM, ACCNS, ACCS and CAC2. PLOS ONE 2009, 4, 6040. [Google Scholar] [CrossRef] [PubMed]
  26. Beucler, M.; Miller, W.E. Isolation of Salivary Epithelial Cells from Human Salivary Glands for In Vitro Growth as Salispheres or Monolayers. J. Vis. Exp. 2019, 149. [Google Scholar] [CrossRef] [PubMed] [Green Version]
  27. Steinacker, R.; Liehr, T.; Kosyakova, N.; Rincic, M.; Azawi, S.S.H. Molecular cytogenetic characterization of two murine cancer cell lines derived from salivary gland. Boil. Commun. 2018, 63, 243–255. [Google Scholar] [CrossRef]
  28. Mehta, A.S.; Luz-Madrigal, A.; Li, J.-L.; Tsonis, P.A.; Singh, A. Comparative transcriptomic analysis and structure prediction of novel Newt proteins. PLOS ONE 2019, 14, e0220416. [Google Scholar] [CrossRef] [Green Version]
  29. Zhang, Z.; Zhao, Y.; Feng, X.; Luo, Z.; Kong, S.; Zhang, C.; Gong, A.; Yuan, H.; Cheng, L.; Wang, X. Genomic, molecular evolution, and expression analysis of NOX genes in soybean (Glycine max). Genom. 2019, 111, 619–628. [Google Scholar] [CrossRef]
  30. Liu, L.; Wu, Y.; Liao, Z.; Xiong, J.; Wu, F.; Xu, J.; Lan, H.; Tang, Q.; Zhou, S.; Liu, Y.; et al. Evolutionary conservation and functional divergence of the LFK gene family play important roles in the photoperiodic flowering pathway of land plants. Hered. 2017, 120, 310–328. [Google Scholar] [CrossRef] [Green Version]
Figure 1. Detection of liver-enriched gene 1 (LEG1) gene expression in HepG2 cells. (A). Endogenous hLEG1a expression was not detected in HepG2 cells using RT-PCR. Beta-actin (ACTB) was used as an internal control. (BF). The expression levels (transcripts per million, TPM) of hLEG1a (B), pLEG1a (C), pLEG1b (D), pLEG1c (E), and platypus MLP (F) were calculated in each cell transfection group by RNA-seq. Data are the means ± standard errors of the mean (SEMs) with **** indicating a p-value < 0.0001.
Genes 11 00412 g001
Figure 2. Comprehensive analysis of the RNA-seq results. (A) Volcano plots showing the differentially expressed genes (DEGs) identified from each LEG1 transgenic group versus their respective controls. The DEGs, indicated by red dots, were identified according to an adjusted p-value < 0.05 and |log2 fold change| > 0.5849. (B) The Venn diagram of the DEGs shows that only a few genes were shared between groups.
Genes 11 00412 g002
Figure 3. Scatter plot presenting the distribution of samples in the two-dimensional coordinate system determined by the first (PC1) and the second (PC2) principal components, which were calculated using the expression values normalized by the vst function implemented in DESeq2 R package. (A) PCA result of pLEG1a (1a), pLEG1b (1b), platypus MLP (MLP), and ctrl1. (B) PCA results of pLEG1c (1c) and ctrl2. (C) PCA result of HEK293T cells overexpressing pLEG1a (1a-H) or empty control (ctrl3).
Genes 11 00412 g003
Table 1. Significantly enriched Gene Ontology (GO) and Kyoto Encyclopedia of Genes and Genomes (KEGG) terms/pathways identified by DAVID.
GroupCategoryTerm/Pathwayp-Value
1bGO_BPNegative regulation of transcription from RNA polymerase II promoter0.01
GO_BPRegulation of transcription from RNA polymerase II promoter0.03
GO_MFTranscription factor activity, sequence-specific DNA binding0.027
1cGO_BPRegulation of protein complex stability0.009
GO_BPautophagy0.018
GO_BPCell differentiation0.034
GO_BPPositive regulation of glucose import0.045
GO_BPProtein secretion0.048
GO_CCEndoplasmic reticulum0.001
GO_CCEndoplasmic reticulum chaperone complex0.017
GO_CCEndoplasmic reticulum lumen0.035
GO_CCSmooth endoplasmic reticulum0.039
GO_MFProtein binding9 × 10−4
GO_MFUnfolded protein binding0.01
GO_MFGrowth factor activity0.02
KEGGProtein processing in endoplasmic reticulum2.9 × 10−4
MLPGO_BPtranslation1.6 × 10−13
GO_BPMitochondrial translational termination4.2 × 10−6
GO_BPProtein import into mitochondrial inner membrane0.002
GO_BPMitochondrial respiratory chain complex I assembly0.005
GO_BPCell cycle arrest0.014
GO_BPCerebral cortex development0.021
KEGGRibosome3.3 × 10−15
KEGGHuntington’s disease2.6 × 10−4
KEGGAlzheimer’s disease0.001
Table 2. Significantly enriched GO and KEGG terms/pathways identified by gene set enrichment analysis (GSEA).
GroupUp/Down Regulated DEGsCategoryTerm/Pathway
1aUpGONegative regulation of translational initiation
1cUpGORegulation of response to endoplasmic reticulum stress
GOChaperone mediated protein complex assembly
GOSmooth endoplasmic reticulum
GOCellular response to topologically incorrect protein
GOProtein localization to synapse
GOProtein folding in the endoplasmic reticulum
GOUnfolded protein binding
GOIRE1 mediated unfolded protein response
KEGGSteroid hormone biosynthesis
DownKEGGSystemic lupus erythematosus
MLPUpGODetoxification
GODefense response to fungus
GODefense response to Gram-negative bacterium
GOAntigen processing and presentation
GOVirion assembly
DownGOLow-density lipoprotein particle binding
KEGGAdherens junction

