Article

Domesticated gag Gene of Drosophila LTR Retrotransposons Is Involved in Response to Oxidative Stress

1
Laboratory of Exercise Physiology, Institute of Biomedical Problems of the Russian Academy of Sciences, Moscow 123007, Russia
2
Department of Genetics, Faculty of Biology, Lomonosov Moscow State University, Moscow 119234, Russia
*
Author to whom correspondence should be addressed.
Genes 2020, 11(4), 396; https://doi.org/10.3390/genes11040396
Submission received: 11 March 2020 / Revised: 29 March 2020 / Accepted: 1 April 2020 / Published: 6 April 2020

Abstract

:
Drosophila melanogaster is one of the most extensively used genetic model organisms for studying LTR retrotransposons that are represented by various groups in its genome. However, the phenomenon of molecular domestication of LTR retrotransposons has been insufficiently studied in Drosophila, as well as in other invertebrates. The present work is devoted to studying the role of the domesticated gag gene, Gagr, in the Drosophila genome. The Gagr gene has been shown to be involved in the response to stress caused by exposure to ammonium persulfate, but not in the stress response to oligomycin A, zeomycin, and cadmium chloride. Ammonium persulfate tissue specifically activates the expression of Gagr in the tissues of the carcass, but not in the gut. We found that the Gagr gene promoter contains one binding motif for the transcription factor kayak, a component of the JNK signaling pathway, and two binding motifs for the transcription factor Stat92E, a component of the Jak-STAT signaling pathway. Remarkably, Gagr orthologs contain the second binding motif for Stat92E only in D. melanogaster, D. simulans and D. sechellia, whereas in D. yakuba and D. erecta, Gagr orthologs contain a single motif, and there are no binding sites for Stat92E in the promoters of Gagr orthologs in D. ananassae and in species outside the melanogaster group. The data obtained indicate the formation of the protective function of the Gagr gene during evolution.

1. Introduction

Despite their selfish nature, retroelements are a powerful genetic resource for the host organism and can play a significant evolutionary and adaptive role in eukaryotes [1,2,3]. There are various mechanisms by which new genes arise; one of them is molecular domestication of retroelement (retrotransposon or retrovirus) sequences [4]. The term “molecular domestication” was first proposed by Wolfgang Miller in 1997 to describe the phenomenon of the adaptation of the sequences of mobile elements by the organism for its own benefit [5]. The most important concept applicable to the evolutionary role of sequences of mobile elements is “exaptation”. This term implies the formation of new genetic structures and functions that, as a rule, appeared as a result of the long evolution of sequences of domesticated mobile elements [4,6].
The most studied cases of molecular domestication/exaptation of retroelements are the domestication of retrotransposons with long terminal repeats (LTR retrotransposons) and endogenous retroviruses. For all three genes of LTR retroelements, gag, pol, and env, domesticated homologs with functions beneficial for the host organism have been discovered. The greatest variety of such genes has been found for homologs of the capsid gene, gag [3]. Examples of gag domestication in mammals are represented by the gene families MART (Mammalian RetroTransposons), or SIRH (Sushi-Ichi Retrotransposon Homologues), and PNMA (Paraneoplastic Ma antigens) [4]. The MART/SIRH and PNMA families originate from independent domestications of LTR retroelements (in the first case, from the sushi-ichi group, in the second, from the Ty3/Gypsy group) [7,8]. Many genes of the MART family are expressed in the placenta, and some are necessary in the early stages of placenta formation and its development [9,10]. On the other hand, among the genes of the PNMA family there are apoptosis regulators [11]. Another example of successful gag domestication is the emergence of the SCAN domain which is widely represented among the transcription factors of Tetrapoda. SCAN originated as a result of the domestication of an LTR retrotransposon of the Gmr1-like group about 300 Ma ago [12,13]. Many of the genes that have the sequence encoding the SCAN domain of transcription factors that control various biological processes: embryonic development, hematopoiesis, metabolism, etc. [4]. Of particular interest is the gag homolog with a specific antiviral function, Fv1 (friend-virus-susceptibility-1), which is a factor limiting exogenous mouse leukemia virus (MLV) and other types of retroviruses. Fv1 is derived from the gag gene of the endogenous retrovirus MERV-L [14,15,16].
The molecular domestication of LTR retrotransposons in invertebrates is poorly understood. In Drosophila melanogaster, the host Gagr gene (Gag-related protein) is described as a homologue of the gag gene of LTR retrotransposons of the Gypsy group. At present, the specific function of Gagr is unknown and little is known about the regulation of its expression. Orthologs of this gene are found in all sequenced genomes of the Drosophila genus; they possess a highly conservative structure and are the result of long-term domestication [17]. There are several research results for the Gagr gene that indirectly indicate its involvement in a number of important processes related to stress reactions. Gagr expression is activated in response to the induction by bacterial lipopolysaccharides in S2 cells, and this activation depends on the regulators of the MAPK/JNK stress signaling pathways Tak1, hep and bsk [18]. Gagr expression increases significantly after intraabdominal injection of DCV viruses (Drosophila C virus), FHV (Flock House virus) and SINV (Sindbis virus) [19]. To predict the function of the Gagr protein, its interactions with other proteins that were established during the identification of protein–protein complexes in S2R+ D. melanogaster cells are of importance [20]. At least three Gagr partners, 14-3-3epsilon, Pdi and eIF3j, are involved in stress-related functions. 14-3-3epsilon is a conservative regulator of the activity of MAPK and other stress signaling pathways in animals [21]. Chaperone Pdi plays an important role in endoplasmic reticulum stress (ER-stress) and UPR (unfolded protein response) [22,23]. eIF3j is a subunit of translation initiation factor. eIF3j has been shown to be necessary for IRES-dependent translation which occurs under conditions of cell stress [24]. Thus, it is necessary to study the role of the Gagr gene in cell stress, taking into account the known data on its activation and protein–protein interactions. This will reveal new functions and evolutionary capabilities that are provided by domestication of LTR retroelements in eukaryotes.

2. Materials and Methods

2.1. Drosophila Strains and Treatments

D. melanogaster Canton-S strain was used in all experiments. Fly stocks were maintained in a standard nutrient agar medium at 25 °C. Adult flies 6–8 days old were used in all experiments.
Four stress agents were used in the study: ammonium persulfate, oligomycin A, cadmium chloride or zeocin. To induce stress, flies were placed in test tubes with a nutrient medium containing the active substance, and after 24 h, flies or organs were collected to isolate total RNA. As controls, intact flies incubated with an equivalent amount of solvent or appropriate salt in the feed without an active agent were used, depending on the effect (Table 1). In the experiments, cadmium chloride (SigmaAldrich, St. Louis, MO, USA, cat#202908) was used as an inducer of endoplasmatic reticulum (ER) stress; oligomycin A (SigmaAldrich, USA, cat#75351) was used as an inducer of mitochondrial stress; zeocin (Thermo Fisher Scientific, Waltham, MA, USA, cat#R25001) was used as an inducer of stress associated with DNA damage; ammonium persulfate (Thermo Fisher Scientific, USA, cat#17874) was used as an inducer of oxidative stress (Table 1). The concentrations of the stress agents were selected based on the observed mortality (~ 5-10%) after 24 h of exposure. The start time of the experiment was chosen, taking into account the possible influence of circadian factors, nutrition status and light mode. The degree of stress was evaluated by upd3 cytokine expression level.
In experiments to study the temporal dynamics of gene expression in response to ammonium persulfate, exposure periods of 6, 12, 24, 30 h were used. After 30 h exposure, the flies were transferred to a favorable environment and kept for 2 and 12 h. In the experiments, a 24 h exposure to 0.1 M ammonium persulfate and an intact control were used to evaluate gene expression in organs.

2.2. RNA Isolation and Quantitative RT-PCR

RNA was isolated from pools (five females, seven males or 20 separate organs) in 5–7 biological replicates using the ExtractRNA reagent (Evrogen, Moscow, Russia), according to the manufacturer’s protocol, then it was treated with DNase I (Thermo Fisher Scientific, USA). Reverse transcription was carried out using an MMLV-RT kit (Evrogen, Russia), according to the manufacturer’s protocol, with random primers (Evrogen, Russia).
For quantitative PCR with the obtained cDNA, a Taq polymerase-based reaction mixture with intercalating dye SYBRGreen I (Evrogen, Russia) was used in accordance with the manufacturer’s protocol. The reaction was performed using a Mini Opticon Real-Time PCR System (Bio-Rad Laboratories, Hercules, CA, USA). The relative expression of the genes Gagr, vir-1, Relish, upd3, hid, sid, Tspo, and Hsp22, normalized to the expression of three reference genes, αTub84D, RpL40, EloB («2ΔCt» method), was analyzed. Amplification was performed with primers shown in Table 2.

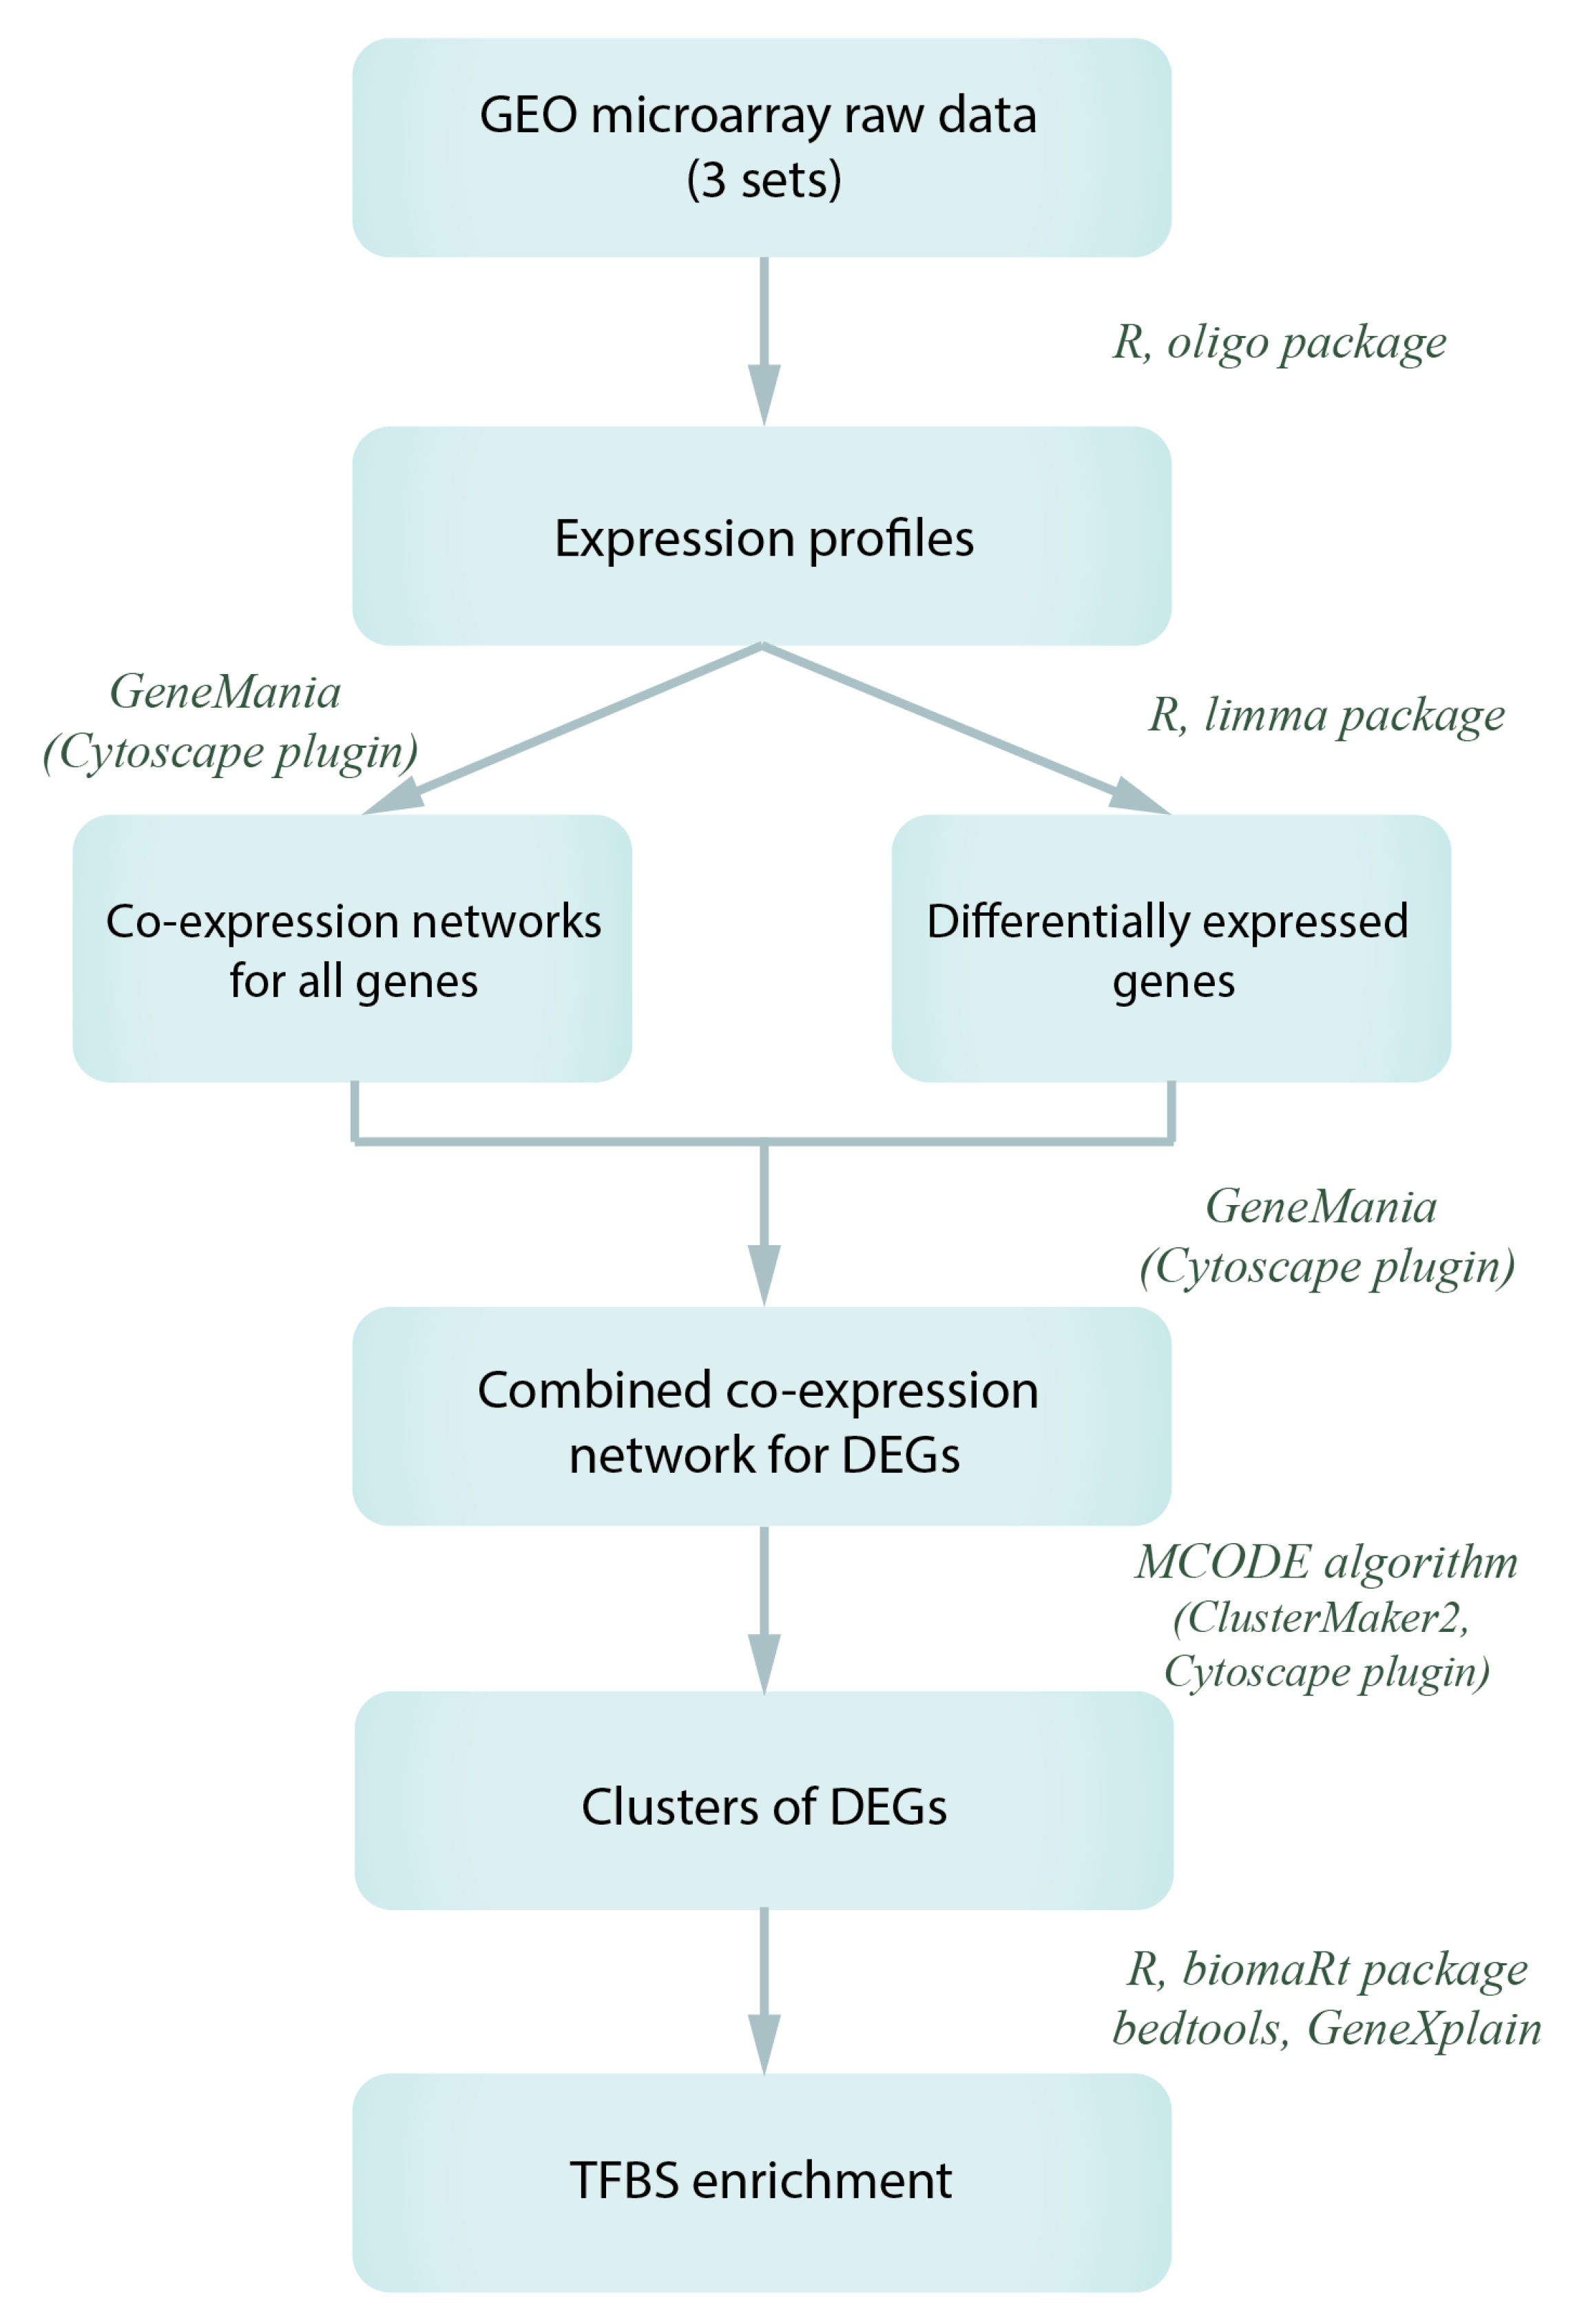
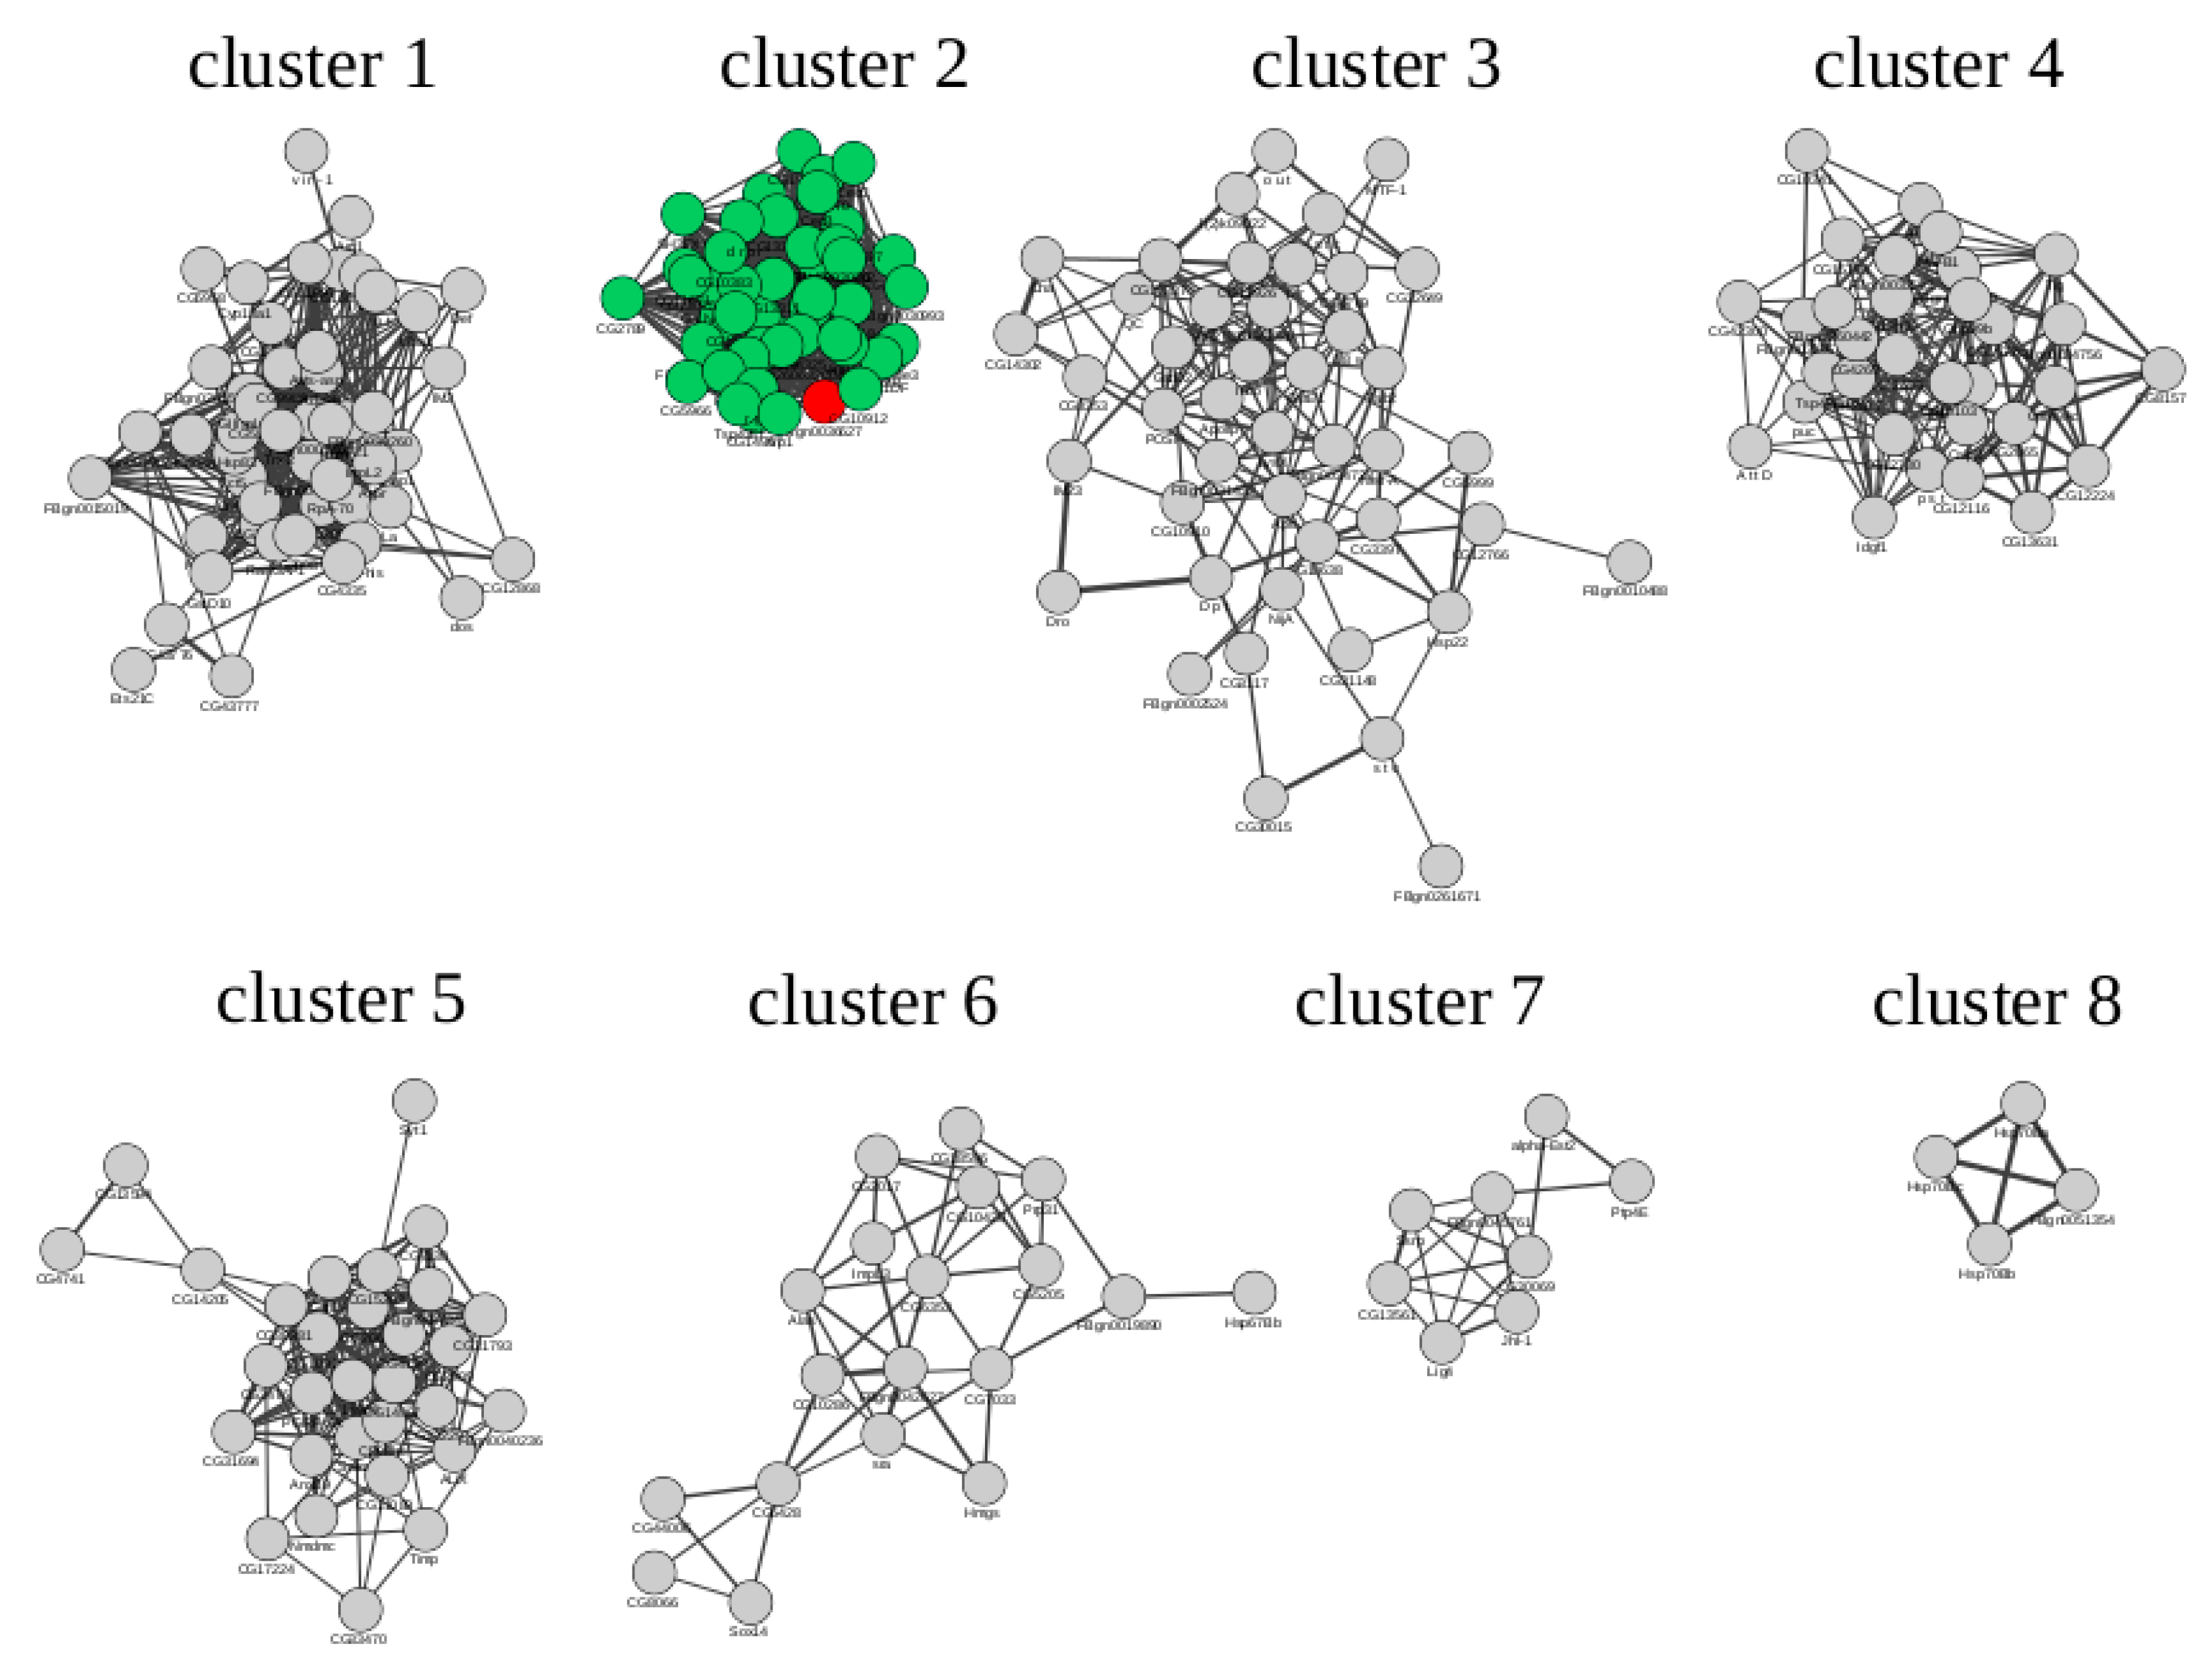
2.3. Microarray Data Reprocessing and Co-Expression Network Analysis

To search for co-expressed genes, we used three sets of transcriptomic data (DNA microarrays), in which the activation of Gagr gene expression is observed. The analysis used the data presented in the GEO database: GSE2828 (all samples), GSE31542 (all samples), GSE42255 (all samples, except sugar treatment and young flies). All raw data were reprocessed by oligo and limma R packages (rma normalization, empirical Bayes statistics for differential expression, separate multiple testing model with a cutoff score for Padj (Benjamini-Hochberg correction) < 0.05 and for Fold Change > 2). For each of three expression profiles we constructed a co-expression network by GeneMania algorithm (v.3.5.1, Cytoscape plugin). Furthermore, these networks were used to construct a network for genes demonstrating differential expression under the same conditions (at least in one) as the Gagr gene. Using the MCODE algorithm (ClusterMaker2 plugin of Cytoscape, options—‘Haircut’, ‘Fluff’, Node Score Cutoff = 0.2), we obtained eight co-expression clusters. The bioinformatic analysis scheme is shown in Figure 1.

2.4. TFBS Enrichment Analysis and Search for Potential Transcription Regulators of Gagr and Co-Expressed Genes

To find potential regulators for each co-expression cluster, we performed TFBS enrichment in the promoter regions of selected genes relative to a random sample of 5000 protein-coding genes. Using the biomaRt package of the R programming software (https://bioconductor.org/packages/release/bioc/html/biomaRt.html) and the bedtools (https://bedtools.readthedocs.io/), the promoter regions (from –1000 bp to +100 bp relative to transcription starts) were isolated for all genes. The search for binding sites was performed with the positional weight matrices of the Transfac 2019.2 database (insects) using the GeneXplain platform (function “Search for enriched TFBSs (tracks)”) [34]. To search for significantly enriched weight matrices for each group of promoters, the Fisher test (random value is the number of promoters in which at least one binding site for a specific transcription factor is present) and the binomial test (random value is the site frequency per 1000 bp of a promoter) were performed. The maximum adjusted fold enrichment (statistically corrected odds ratios with a 99% confidence interval) was determined for each matrix (with maximum site frequency of one per 2000 bp). Adjusted fold enrichment >1 and FDR <0.05 for the binomial test were set as denoting significantly enriched TFBSs. The search for TFBSs in the Gagr gene promoter was carried out in the region of -1000 bp to + 100 bp (the threshold PWM score was set to the minimum site frequency of 1 per 2000 bp).

2.5. Alignment of The Promoter Regions of The Gagr Gene of Various Drosophila Species and Phylogenetic Analysis

Alignment of nucleotide sequences was carried out using the Muscle tool (https://www.ebi.ac.uk/Tools/msa/muscle/). The promoter regions of Gagr orthologs limited to conservative regions in the studied species were identified. These regions correspond to the coordinates of –881 bp to +119 bp in the TSS Gagr-A transcript for D. melanogaster. The phylogenetic trees were built by the maximum likelihood method using the UGENE program (http://ugene.net/): substitution model—HKY85, bootstrap—1000 replicates.

3. Results

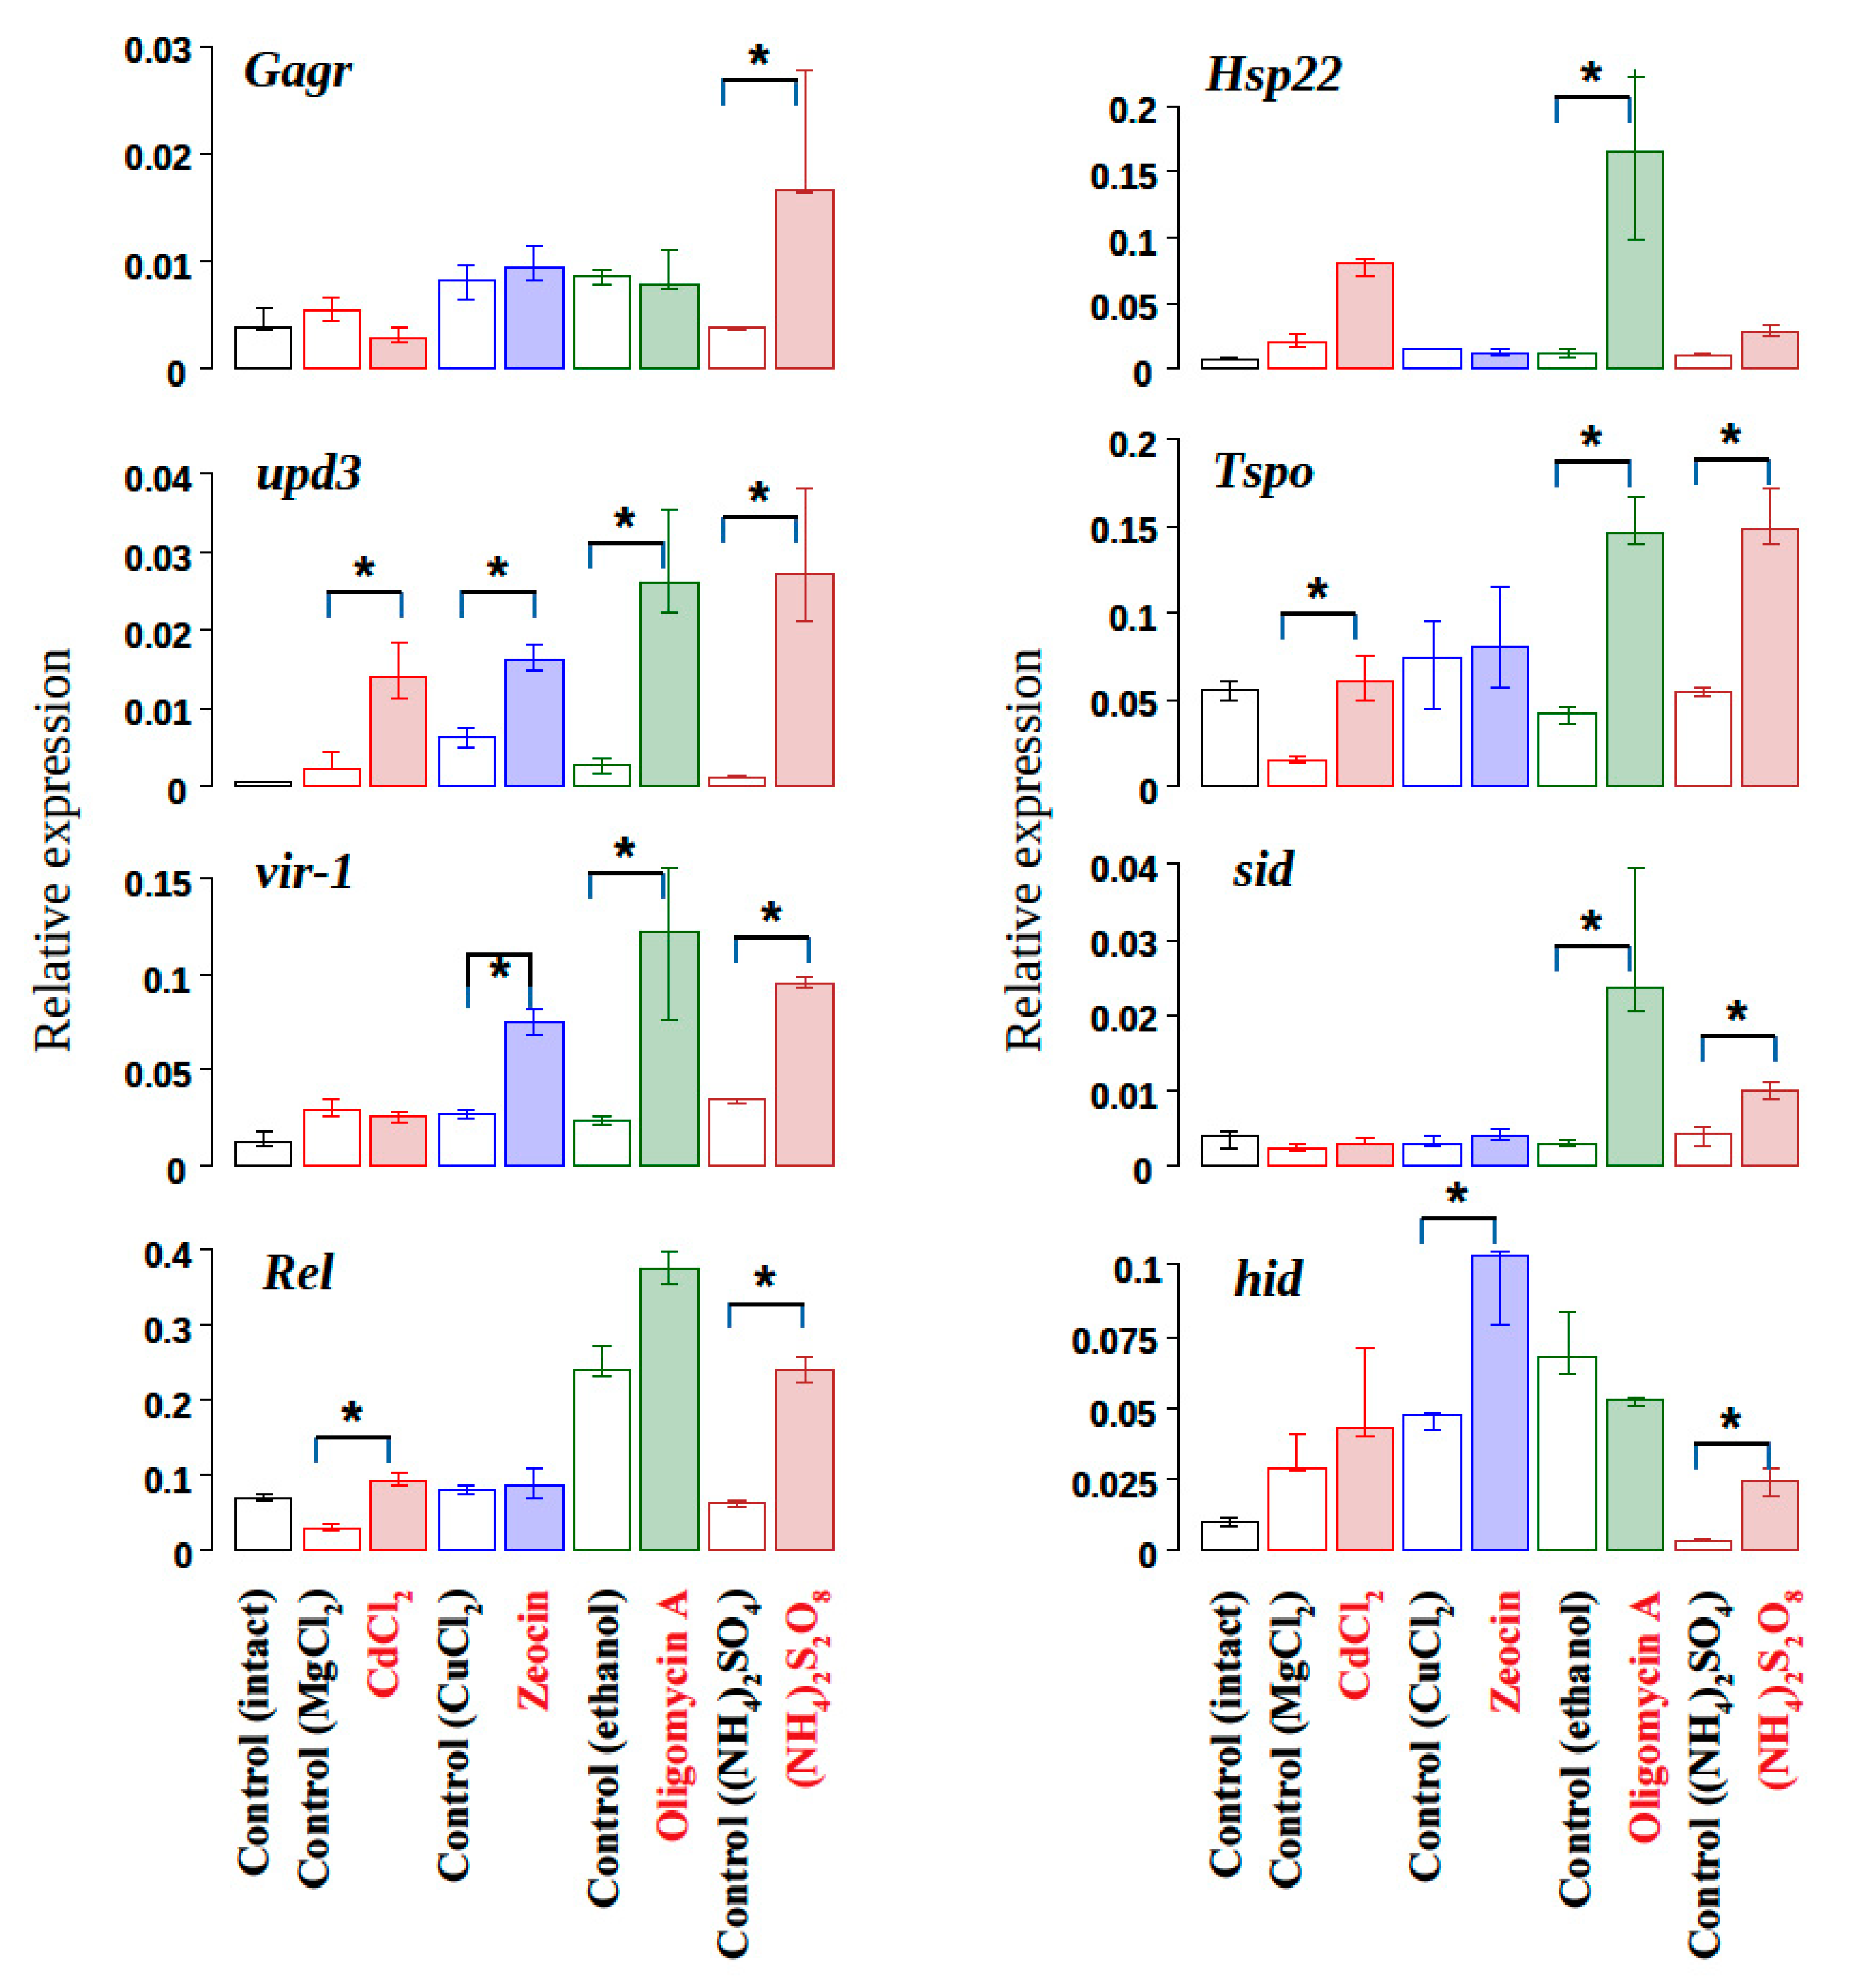
3.1. The Influence of Exogenous Stress Factors Causing Cell Homeostasis Disturbance on The Expression of The Gagr Gene in D. melanogaster Imago

Activation of Gagr transcription is associated with both non-specific viral exposure [19] and the influence of other biotic stress factors, such as bacterial injection of Bacillus cereus [35] or bacterial lipopolysaccharides [18]. Such regulation of expression may be associated with specific immune response, or with the activation of universal stress signaling cascades (JNK, MAPK or Jak-STAT) due to impaired tissue/cell homeostasis. Therefore, we investigated the effect of various agents that damage biological macromolecules (proteins, DNA) and disrupt cell homeostasis (ammonium persulfate, oligomycin A, cadmium chloride and zeocin) on the expression of the Gagr gene in D. melanogaster Canton-S females. To assess the development of stress, we analyzed the expression of a number of known stress-induced genes in response to stress agents (Table 3).
The experiments showed that all the stressors lead to a significant activation of the expression of the stress-induced cytokine upd3 compared to the control conditions (Figure 2). For other genes, specific activation by certain stresses was observed. The activation of Gagr gene expression (~4-fold) was observed only after a 24 h exposure to ammonium persulfate. It is noteworthy that exposure to ammonium persulfate also led to a significant increase in the expression of all used stress-induced genes compared to the controls. Exposure to zeocin, oligomycin A and cadmium chloride did not lead to changes in the level of Gagr expression compared to the control.
The experimental results showed that Gagr expression can increase significantly not only in response to a viral infection [19], but also in response to abiotic stimuli leading to stress. We found that it depends on the specific stress caused by exposure to peroxo compounds (ammonium persulfate). The mechanism of action of persulfate on the cell is poorly understood, but its oxidative potential and the ability to initiate radical reactions suggest its nonspecific action on the cell and the induction of various oxidative stress reactions. The result of this effect may be the oxidation of biological macromolecules and the disruption of protein folding in various cell compartments (ER, cytoplasm, mitochondria) or the damage of cells and the development of a systemic stress response. However, when we studied the effect of other specific stress agents that disrupt cell homeostasis, we did not detect the activation of Gagr expression. Mitochondrial stress caused by oligomycin A was accompanied by a significant activation of expression of the stress-induced genes studied, but did not lead to Gagr activation. This result suggests that the signaling mechanisms that are activated during mitochondrial stress are insufficient or do not play a decisive role in the stress-induced activation of Gagr. Little is known about the mechanisms of mitochondrial stress development and implicated signaling pathways in Drosophila. Nevertheless, for other model organisms, the JNK cascade and Atf4 transcription factor were shown to be involved in the response [48,49]. Given this fact, the activation of the JNK cascade can be assumed to be insufficient for the stress-induced activation of the Gagr gene, which is likely to occur via other specific mechanisms. To evaluate the effect of ER stress on Gagr activation, we used cadmium chloride. Despite a high concentration of cadmium chloride (0.1 M) in the nutrient medium, we observed a more specific and less significant activation of the expression of the studied stress markers in comparison with the effect of oligomycin A or ammonium persulfate, whereas Gagr expression was not affected by cadmium salts. Thus, the ER stress caused by such exposure is not crucial or sufficient to activate Gagr expression. The experiment with zeocin showed significant activation of the hid gene, a target of the p53 cascade activated by DNA damage. But activation of Gagr expression is probably independent of the stress associated with such DNA damage.

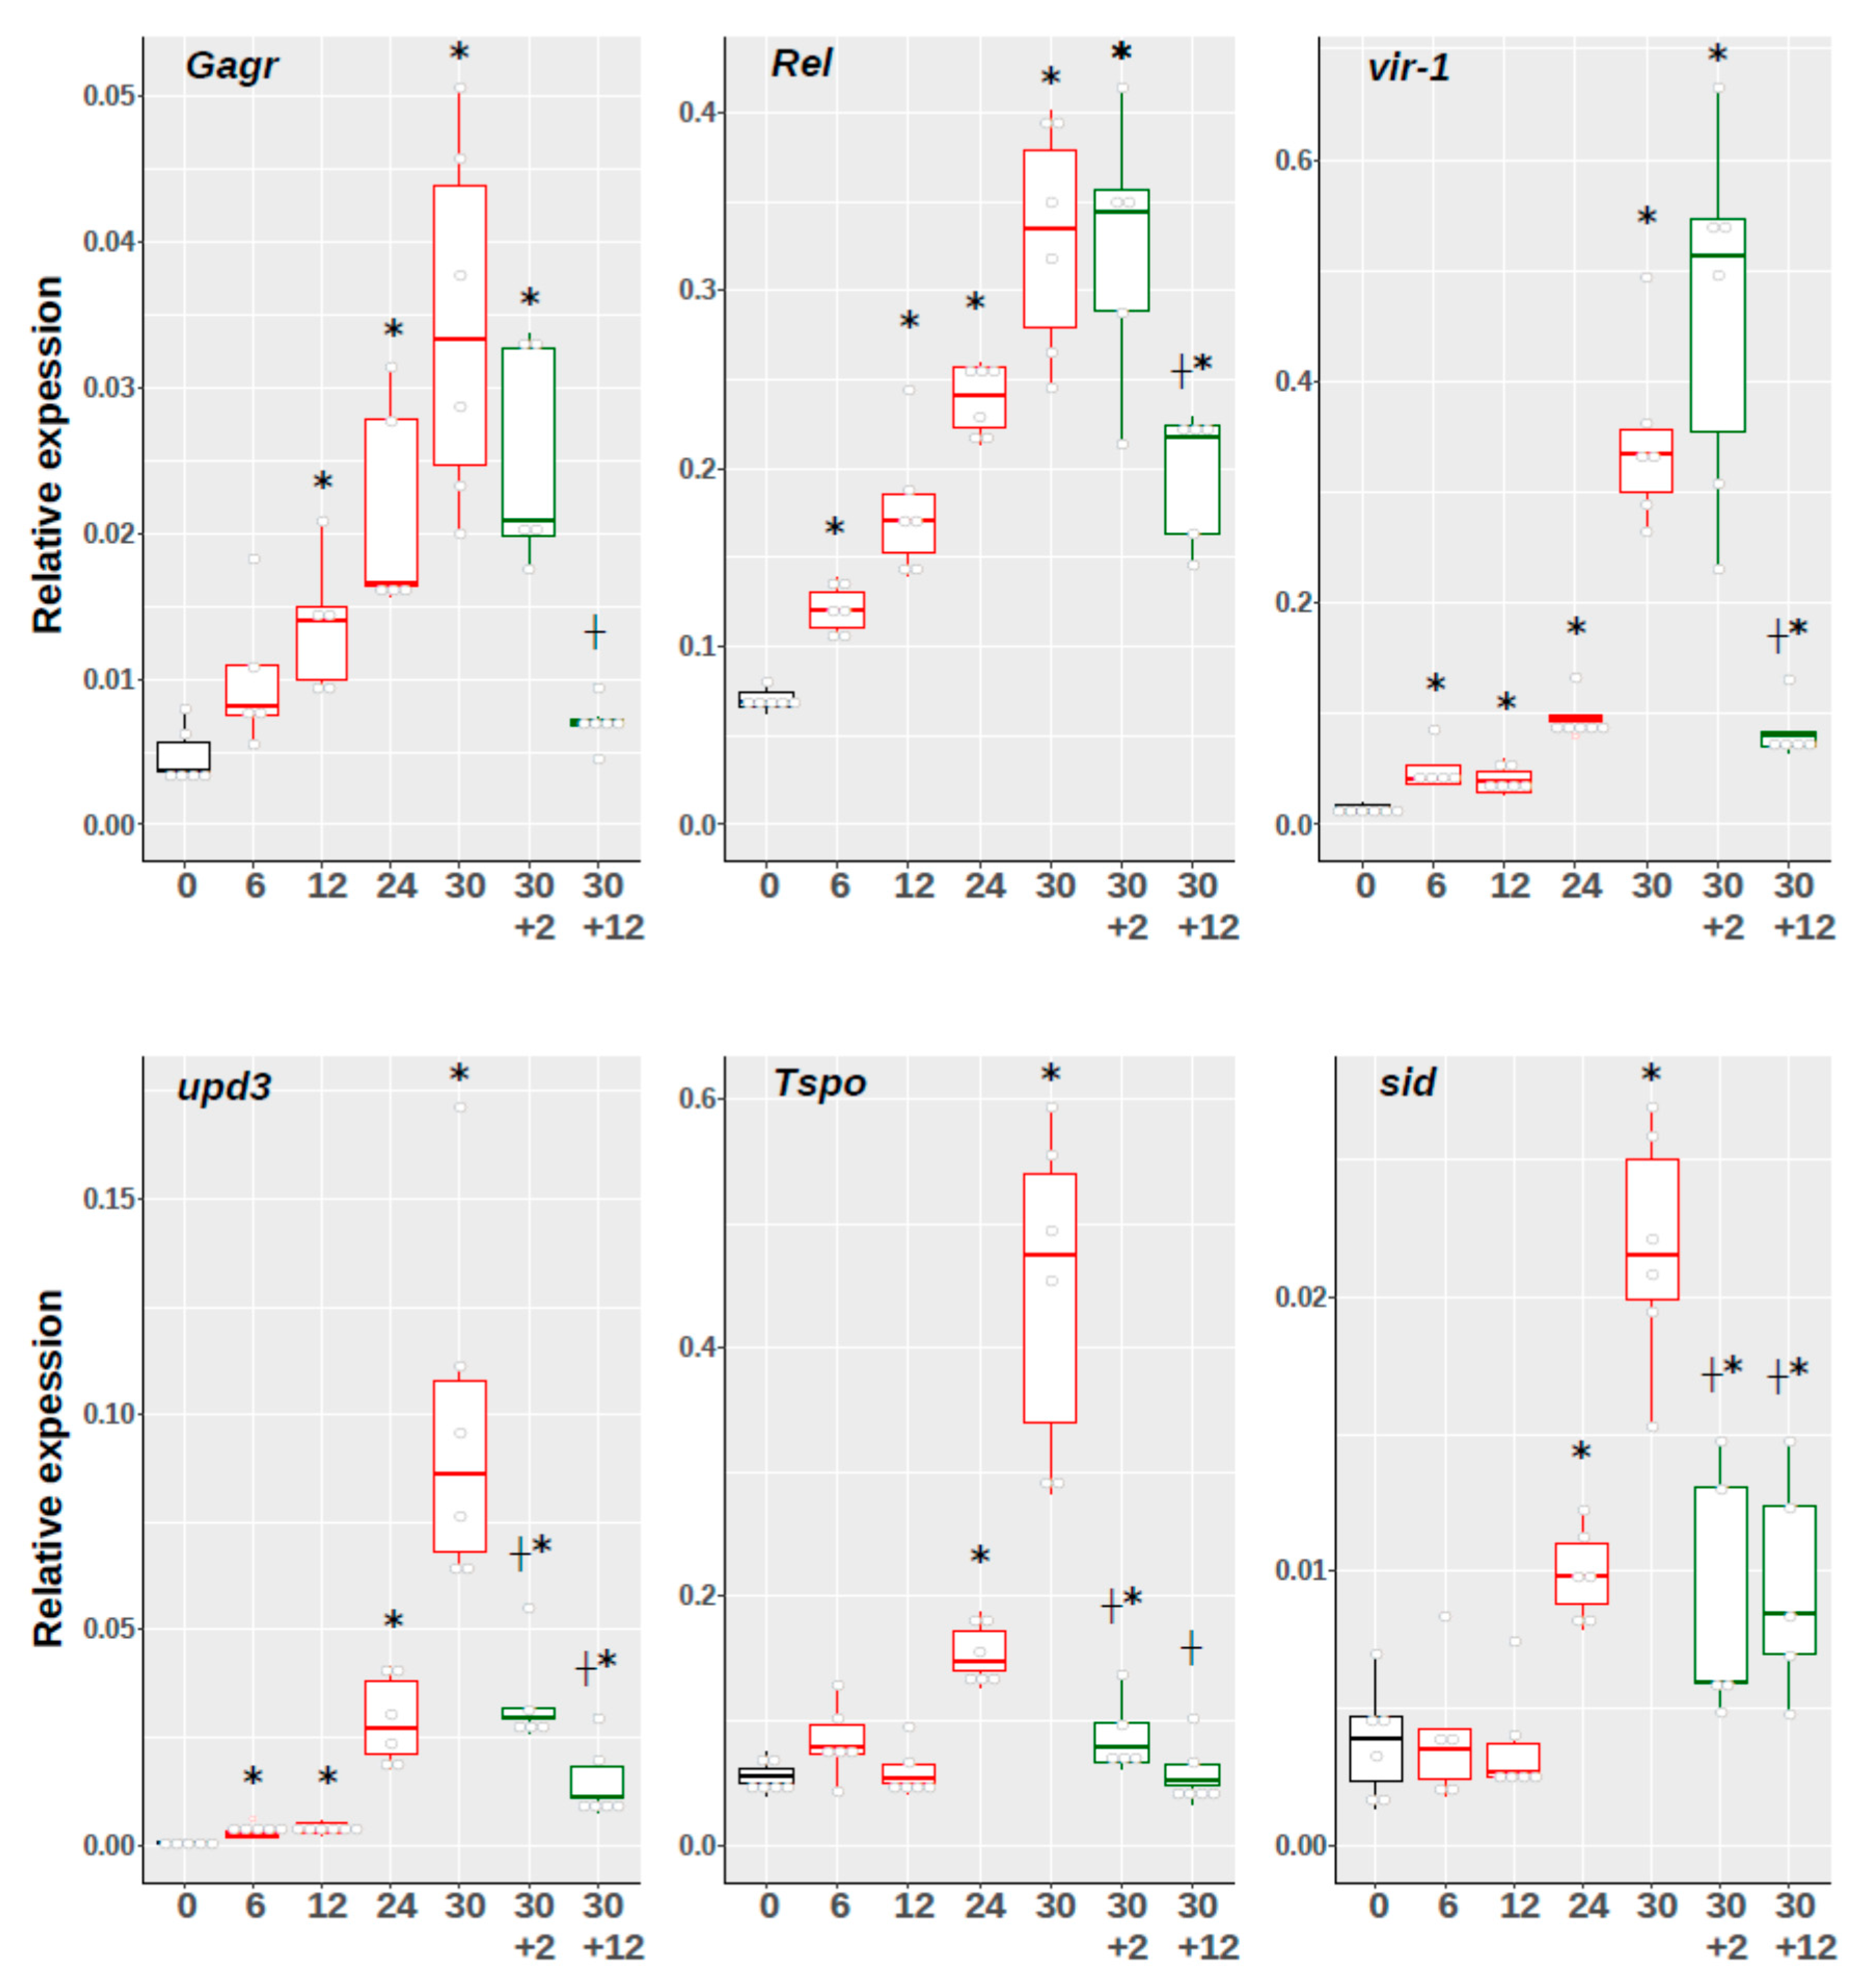
3.2. Investigation of The Temporal Dynamics of Expression of Gagr Gene and Stress Response Effector Genes Upon Exposure to Ammonium Persulfate in D. melanogaster Imago

We found that ammonium persulfate activates Gagr expression after 24 hours of exposure in females. It is known that the response to stressful stimuli (e.g., starvation or oxidative stress) may be sex-specific in Drosophila [50]; therefore, we evaluated how different times (12, 24, and 30 h) of exposure to 0.1 M ammonium persulfate affect Gagr expression in females and males. In females, the level of Gagr mRNA was shown to increase after 12 h, while in males at this time point it remained at the basal level, increasing after 24 and 30 h exposure. Moreover, the differences in the level of Gagr mRNA in females and males are observed only at the basal level (Figure 3). These data indicate different mechanisms of activation of Gagr expression during stress development. Besides, the female-specific activation of Gagr expression was observed after Kallithea virus infection [51].
We observed the significant activation of Gagr expression after 30 hours of exposure to ammonium persulfate. However, it is not clear what this activation is associated with: direct accumulation of a stress agent or with long recovery processes that are not dependent on the presentation of a stress factor. To find out, we evaluated how different times (6, 12, 24, and 30 h) of exposure to ammonium persulfate to see if this would affect the expression of the Gagr gene and stress-induced genes in females. In addition, after 30 h exposure, the flies were transplanted into a favorable environment and gene expression was evaluated after a short (2 h) and long (12 h) recovery period. The mRNA levels of the upd3, vir-1 and Rel genes were found to be significantly increased after a 6 h exposure relative to the basal levels, significantly increasing after 24 and 30 h. On the other hand, the mRNA levels of the Tspo and sid genes (proapoptotic) were significantly higher than the basal levels only after 24 and 30 h exposure. Moreover, a short recovery period (2 h) was shown to lead to a significant decrease in the expression of Tspo and sid, as well as the cytokine upd3 genes, while the Gagr, vir-1 and Rel mRNA levels remained high, but significantly decreased after a long recovery period relative to “30 h” (Gagr expression decreased to basal level) (Figure 4).
Thus, we identified the phase in which significant systemic stress develops (after 24 h exposure). This phase of stress development is characterized by a significant activation of the transcription of the effector genes vir-1, upd3 and Rel, as well as the genes for proapoptotic factors: the sid gene (stress-induced DNase) and the Tspo gene (mitochondrial translocon). The Gagr gene is also significantly activated precisely in this phase: its expression increases almost tenfold after 30 h exposure to ammonium persulfate. We found that after a short recovery period (2 h) the Gagr mRNA is maintained at a high level. However, after a long recovery period (12 h), its expression becomes comparable to the basal level. These data indicate that Gagr function is necessary during stress development to a greater extent than during the recovery period; however, its mRNA level is not so dependent on the presence of the stress factor as the mRNA level of the proapoptotic genes sid and Tspo. Such diverse dynamics of expression in a short recovery period (2h) can be associated both with the specificity of the stress-related gene regulation and with the properties of different mRNAs (determinants of its stability or decay) under stress conditions.

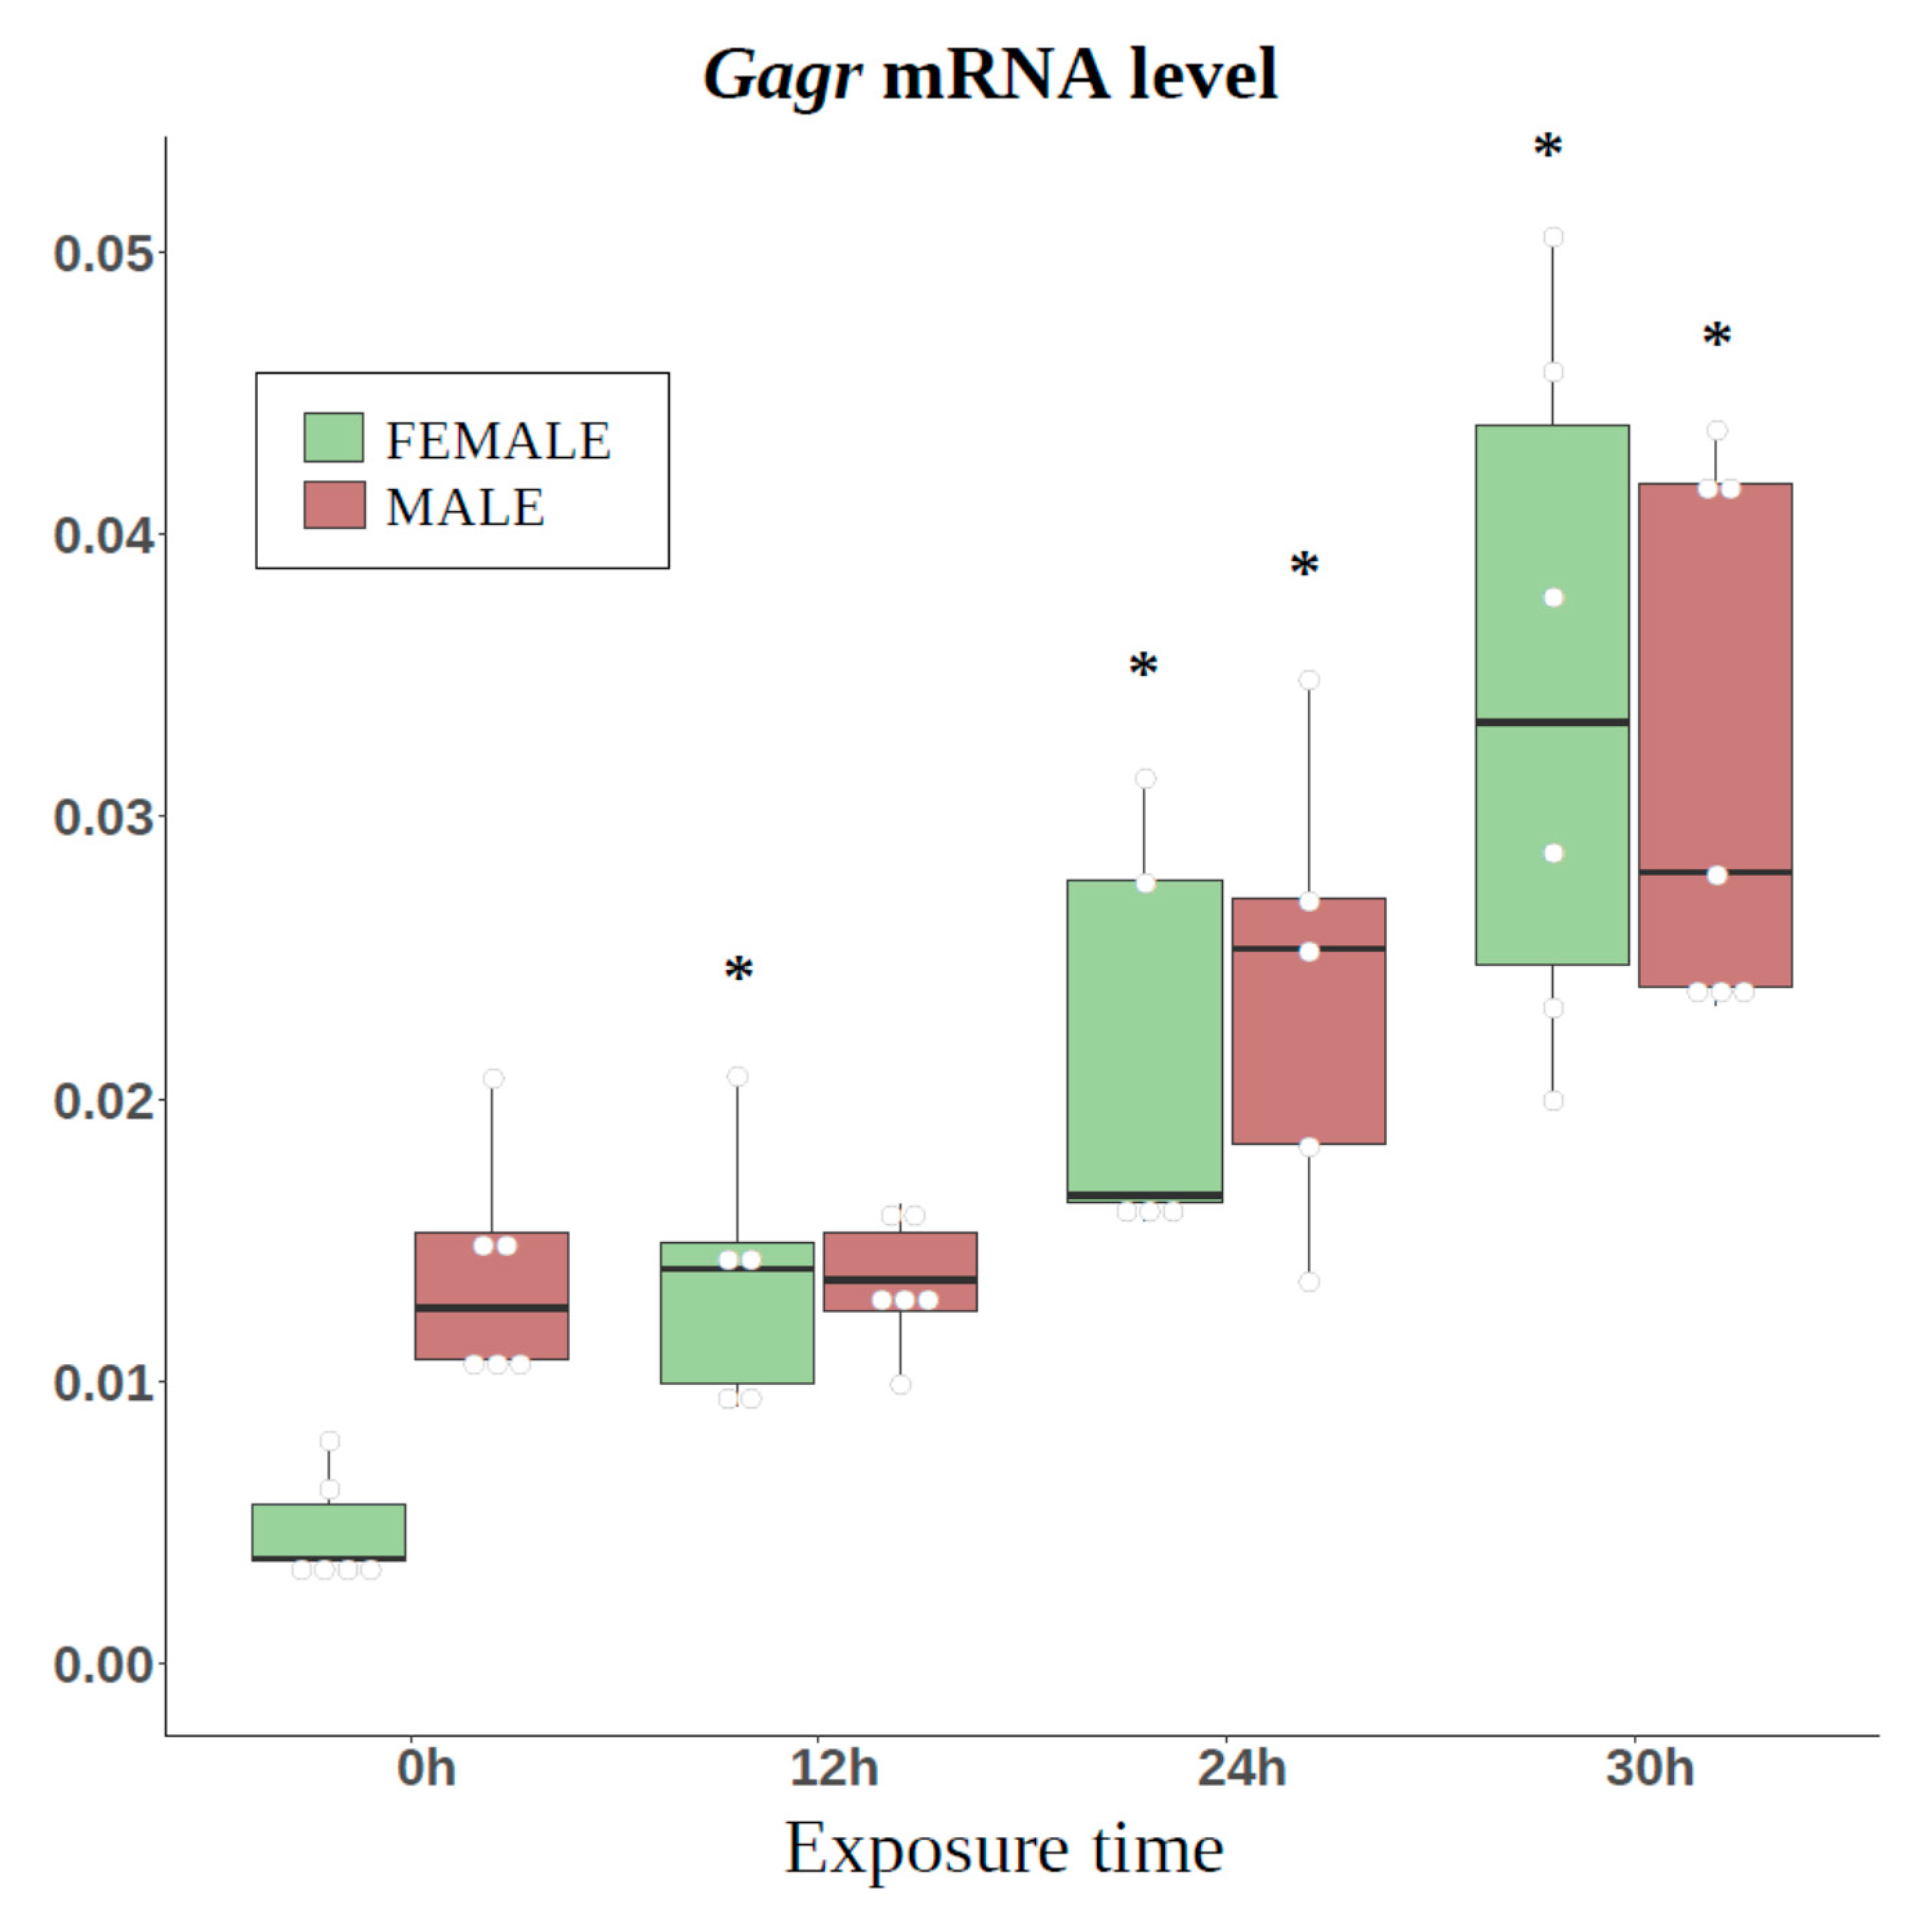
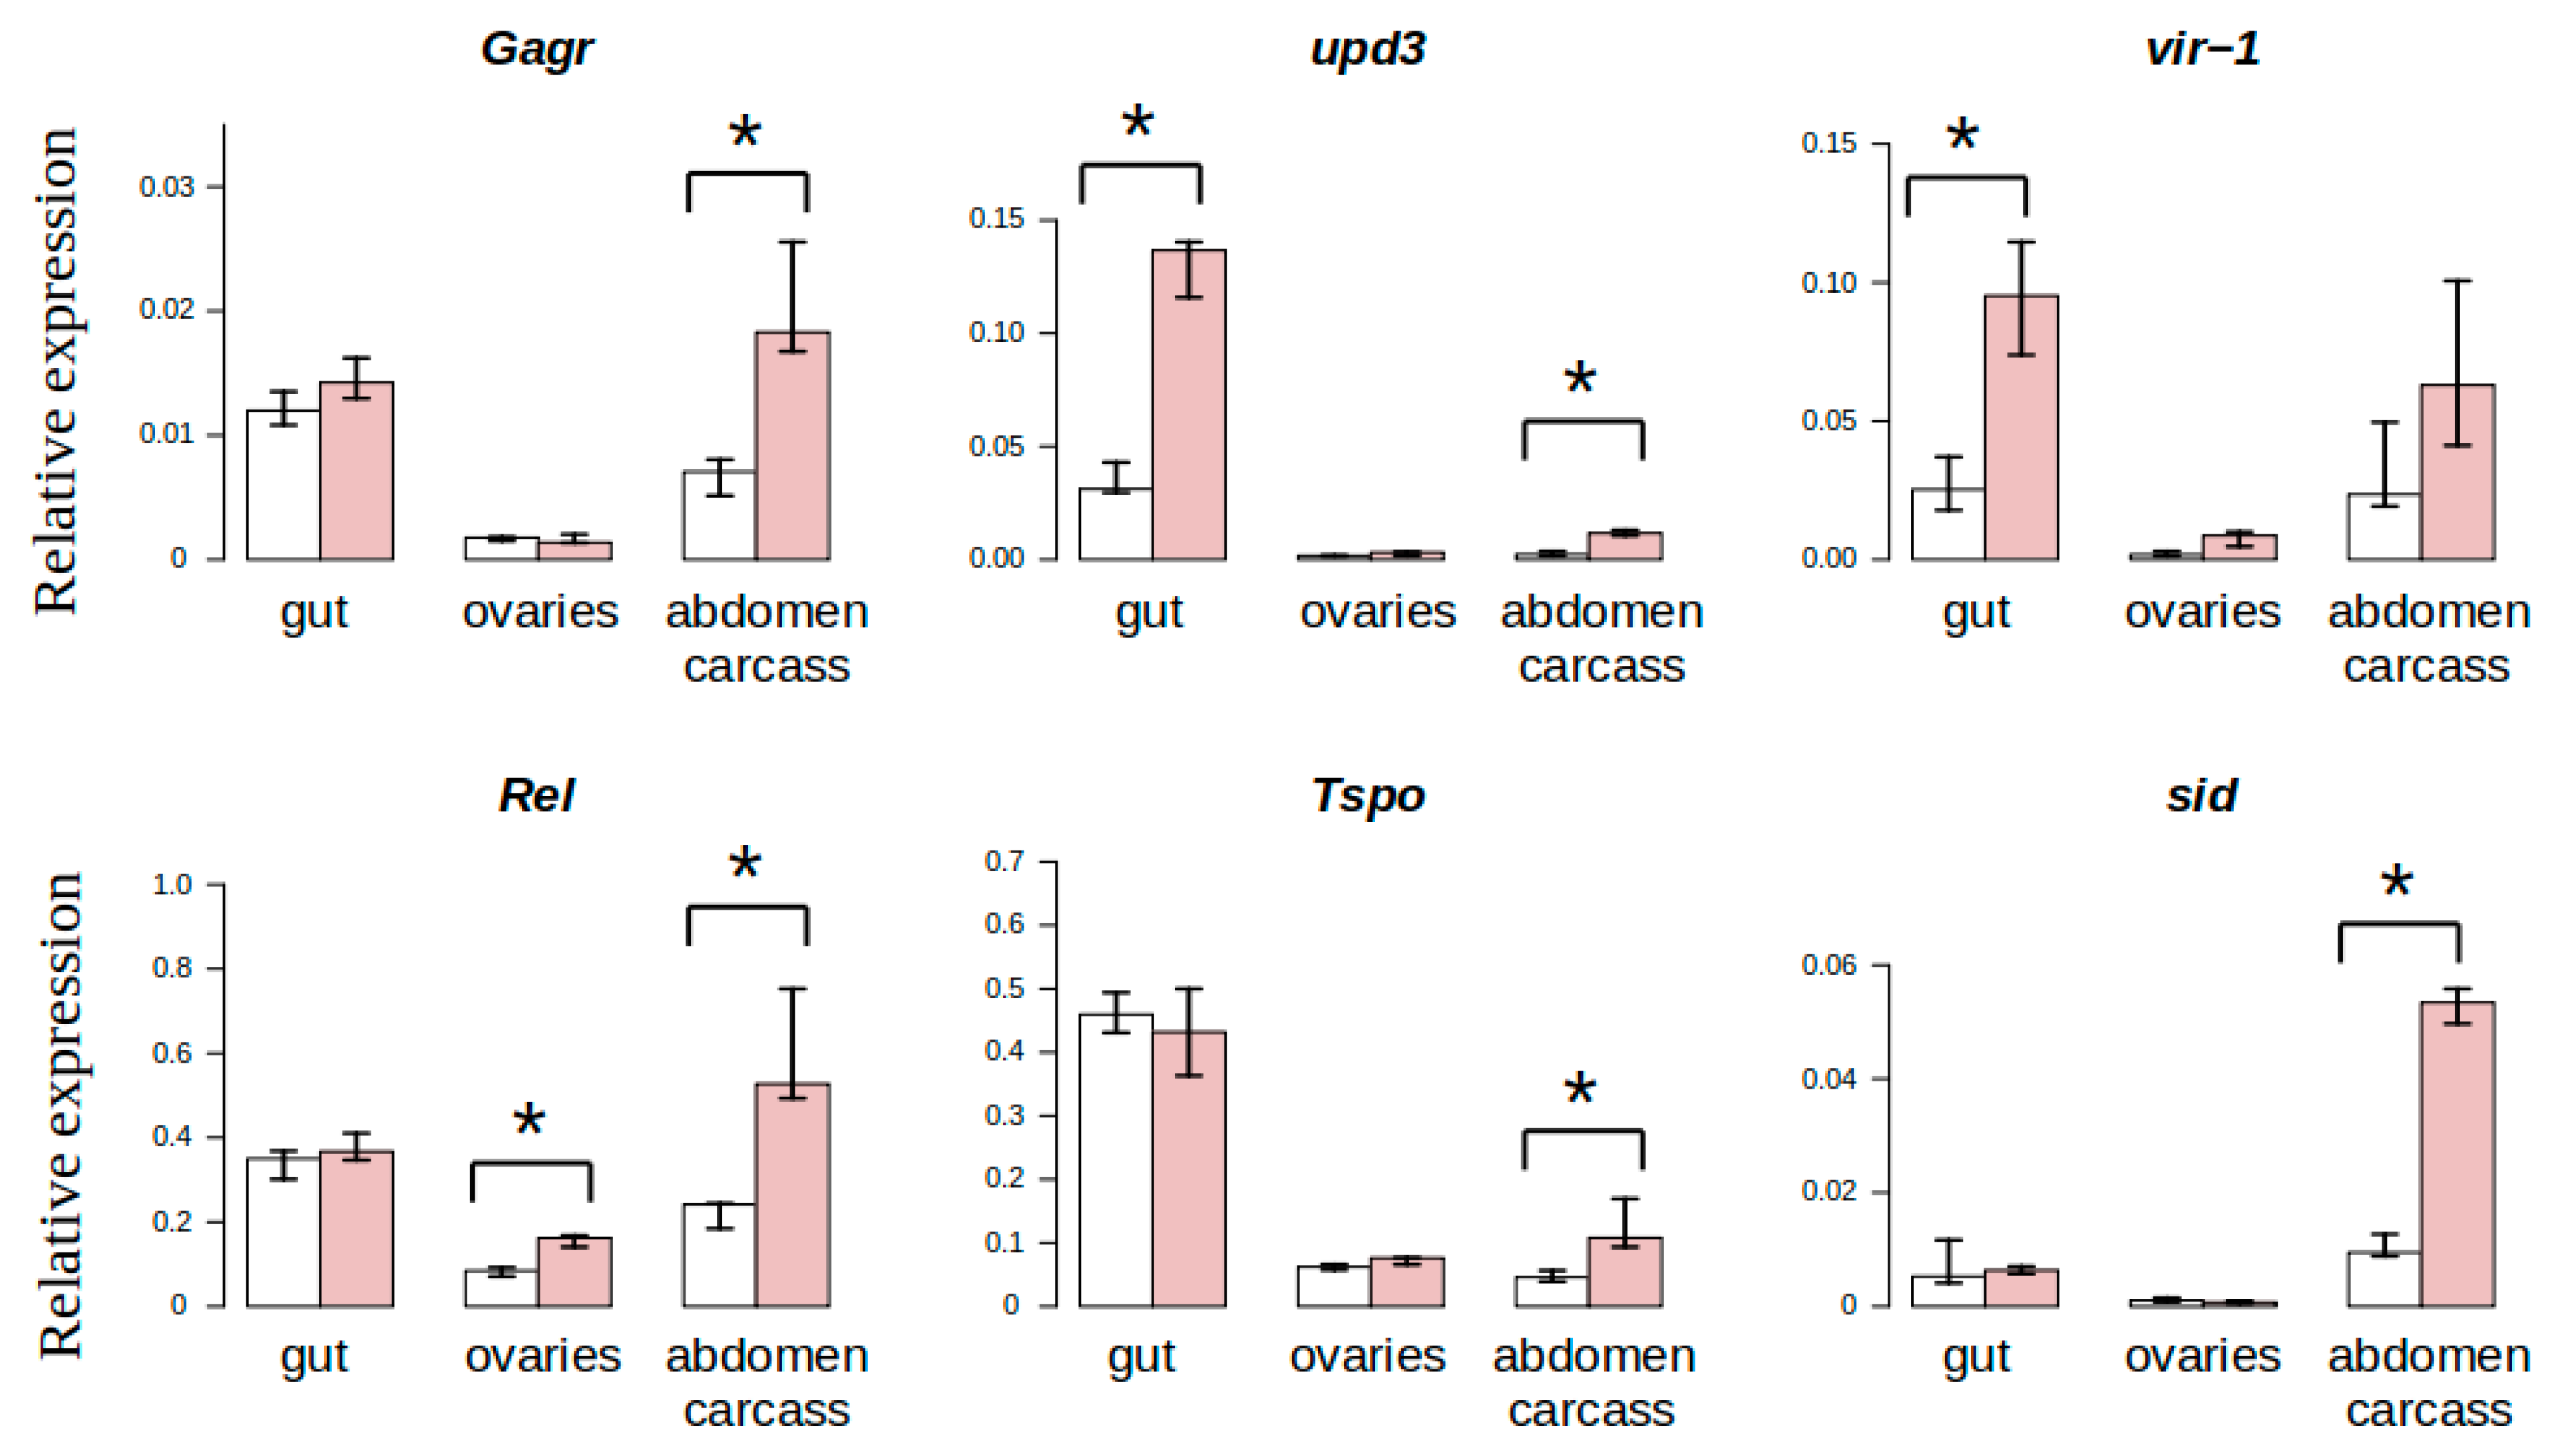
3.3. Study of Tissue-Specific Activation of Gagr Gene Expression in D. melanogaster Females Induced by Ammonium Persulfate

In order to evaluate in which tissues Gagr gene activation caused by peroxo compounds occurs, we experimentally examined the levels of Gagr mRNA and stress-induced genes in various tissues of females (ovaries, gut, and abdomen carcass) in response to 24 h exposure to 0.1 M ammonium persulfate. As a result of the experiment, ammonium persulfate was found to tissue-specifically activate the expression of Gagr and individual genes (Rel, sid and Tspo), their mRNA levels were significantly increased in the tissues of the carcass, but not in the gut relative to the intact control (Figure 5). Thus, Gagr expression in the gut and ovaries does not change, but in the tissues of the carcass increases. At the same time, the basal level of Gagr expression in the gut is high. Such tissue-specific expression is also characteristic for some of the stress-induced genes studied: Tpso, sid, and to a lesser degree for Rel. Observed tissue-specific regulation of the Gagr expression can be considered with the different status of stress-associated signaling pathways, as well as the functions of investigated tissues. The fat body, which makes up a significant part of the abdominal carcass, differs from gut in metabolic activity, specificity of humoral regulation and a set of expressed tissue-specific cytokines [52]. A systemic response develops in the fat body, in which a large number of mechanisms are involved, including upd3-dependent activation of the Jak-STAT signaling pathway [53]. Probably, some of these systemic or humoral mechanisms can provide stress-dependent activation of Gagr expression in the fat body. In turn, intestinal tissues may have the activated status of some stress-related pathways under intact conditions, which determines the absence of changes in Gagr expression in the gut. In particular, in this experiment, we observed a very high level of expression of upd3 and Tspo in the gut relative to the carcass ones under intact conditions.

3.4. Search for Potential Regulators of Stress-Induced Activation of Expression of The Gagr Gene in D. melanogaster Imago

The study was based on the search for overrepresented TFBS in promoters of co-expressed with Gagr genes (relative to the reference set of promoters of randomly selected 5000 genes). In order to identify genes co-expressed with Gagr in D. melanogaster imago, we used transcriptional data on the effects of DCV (Drosophila C virus) [51], FHV (Flock house virus) and SINV (Sindbis virus) on gene expression in the adult male of the Oregon-R strain [19], as well as data on the influence of various stress factors (heat shock, ionizing radiation, hyperoxia, hydrogen peroxide, aging) on the transcriptome of adult males of the Oregon-R strain [54]. These microarray data were reprocessed, and expression profiles were used for co-expression network construction and for meta-analysis provided by GeneMania algorithm for selected genes. The final co-expression network was built for genes with differential expression under the same conditions as the Gagr gene. The co-expression network was divided into clusters by the graph-oriented MCODE algorithm (Figure 6; see network’s nodes and edges information in Table S1).
Overrepresented TFBS were found in the promoter regions for each gene cluster using the algorithms of the GeneXplain platform and the TRANSFAC database. For various clusters, TFBS enrichment for TF involved in stress and immune responses (ATF/CREB, AP1, GATA, STAT, Dif, Rel, Tfam, Hsf, and cnc) were found. The result of TFBS enrichment is presented in Table 4 (see full data in Table S2).
We found that different clusters were enriched for specific sets of TFBSs. For example, promoters of cluster 4 were enriched with motifs of the ER-stress-related TFs (Atf2, Atf6, CREBA) [55], and cluster 6 was characterized by enrichment with Heat shock factor and cnc motifs, which play an important role in unfolded protein response and oxidative stress [56] (Table 4). Additionally, we noted the activated status of the stress-related JNK cascade and transcription factors kay or Jra (enriched in clusters 1, 2, 4, 5; Table 4). The Gagr co-expression group (cluster 2) promoters were enriched with motifs of kayak, GATA family transcription factors, Stat92E, Dif, Rel, and Tfam (Table 4). We evaluated which of the motifs were present in the promoter of the Gagr gene (from −1000 to +100 bp relative to the start of transcription). We found one binding motif for kayak (JNK cascade), two binding motifs for Stat92E (Jak-STAT pathway), and one binding motif for Dif (Toll pathway) (Figure 7A). All these sites have a high PWM score. It is noteworthy that we identified these TFs as the most probable ones involved in the regulation of stress-induced genes co-expressed with the Gagr gene.
The JNK and Jak-STAT signaling pathways are the most important cascades in the early stages of regeneration after acute stress or injury [57]. The assumption of such regulation is in good agreement with the results of our experiments and other studies in which the activation of Gagr expression is observed in response to significant stress (viral infection, oxidative stress caused by peroxo compounds). It is also possible that the Toll signaling pathway may participate in the stress response in D. melanogaster.

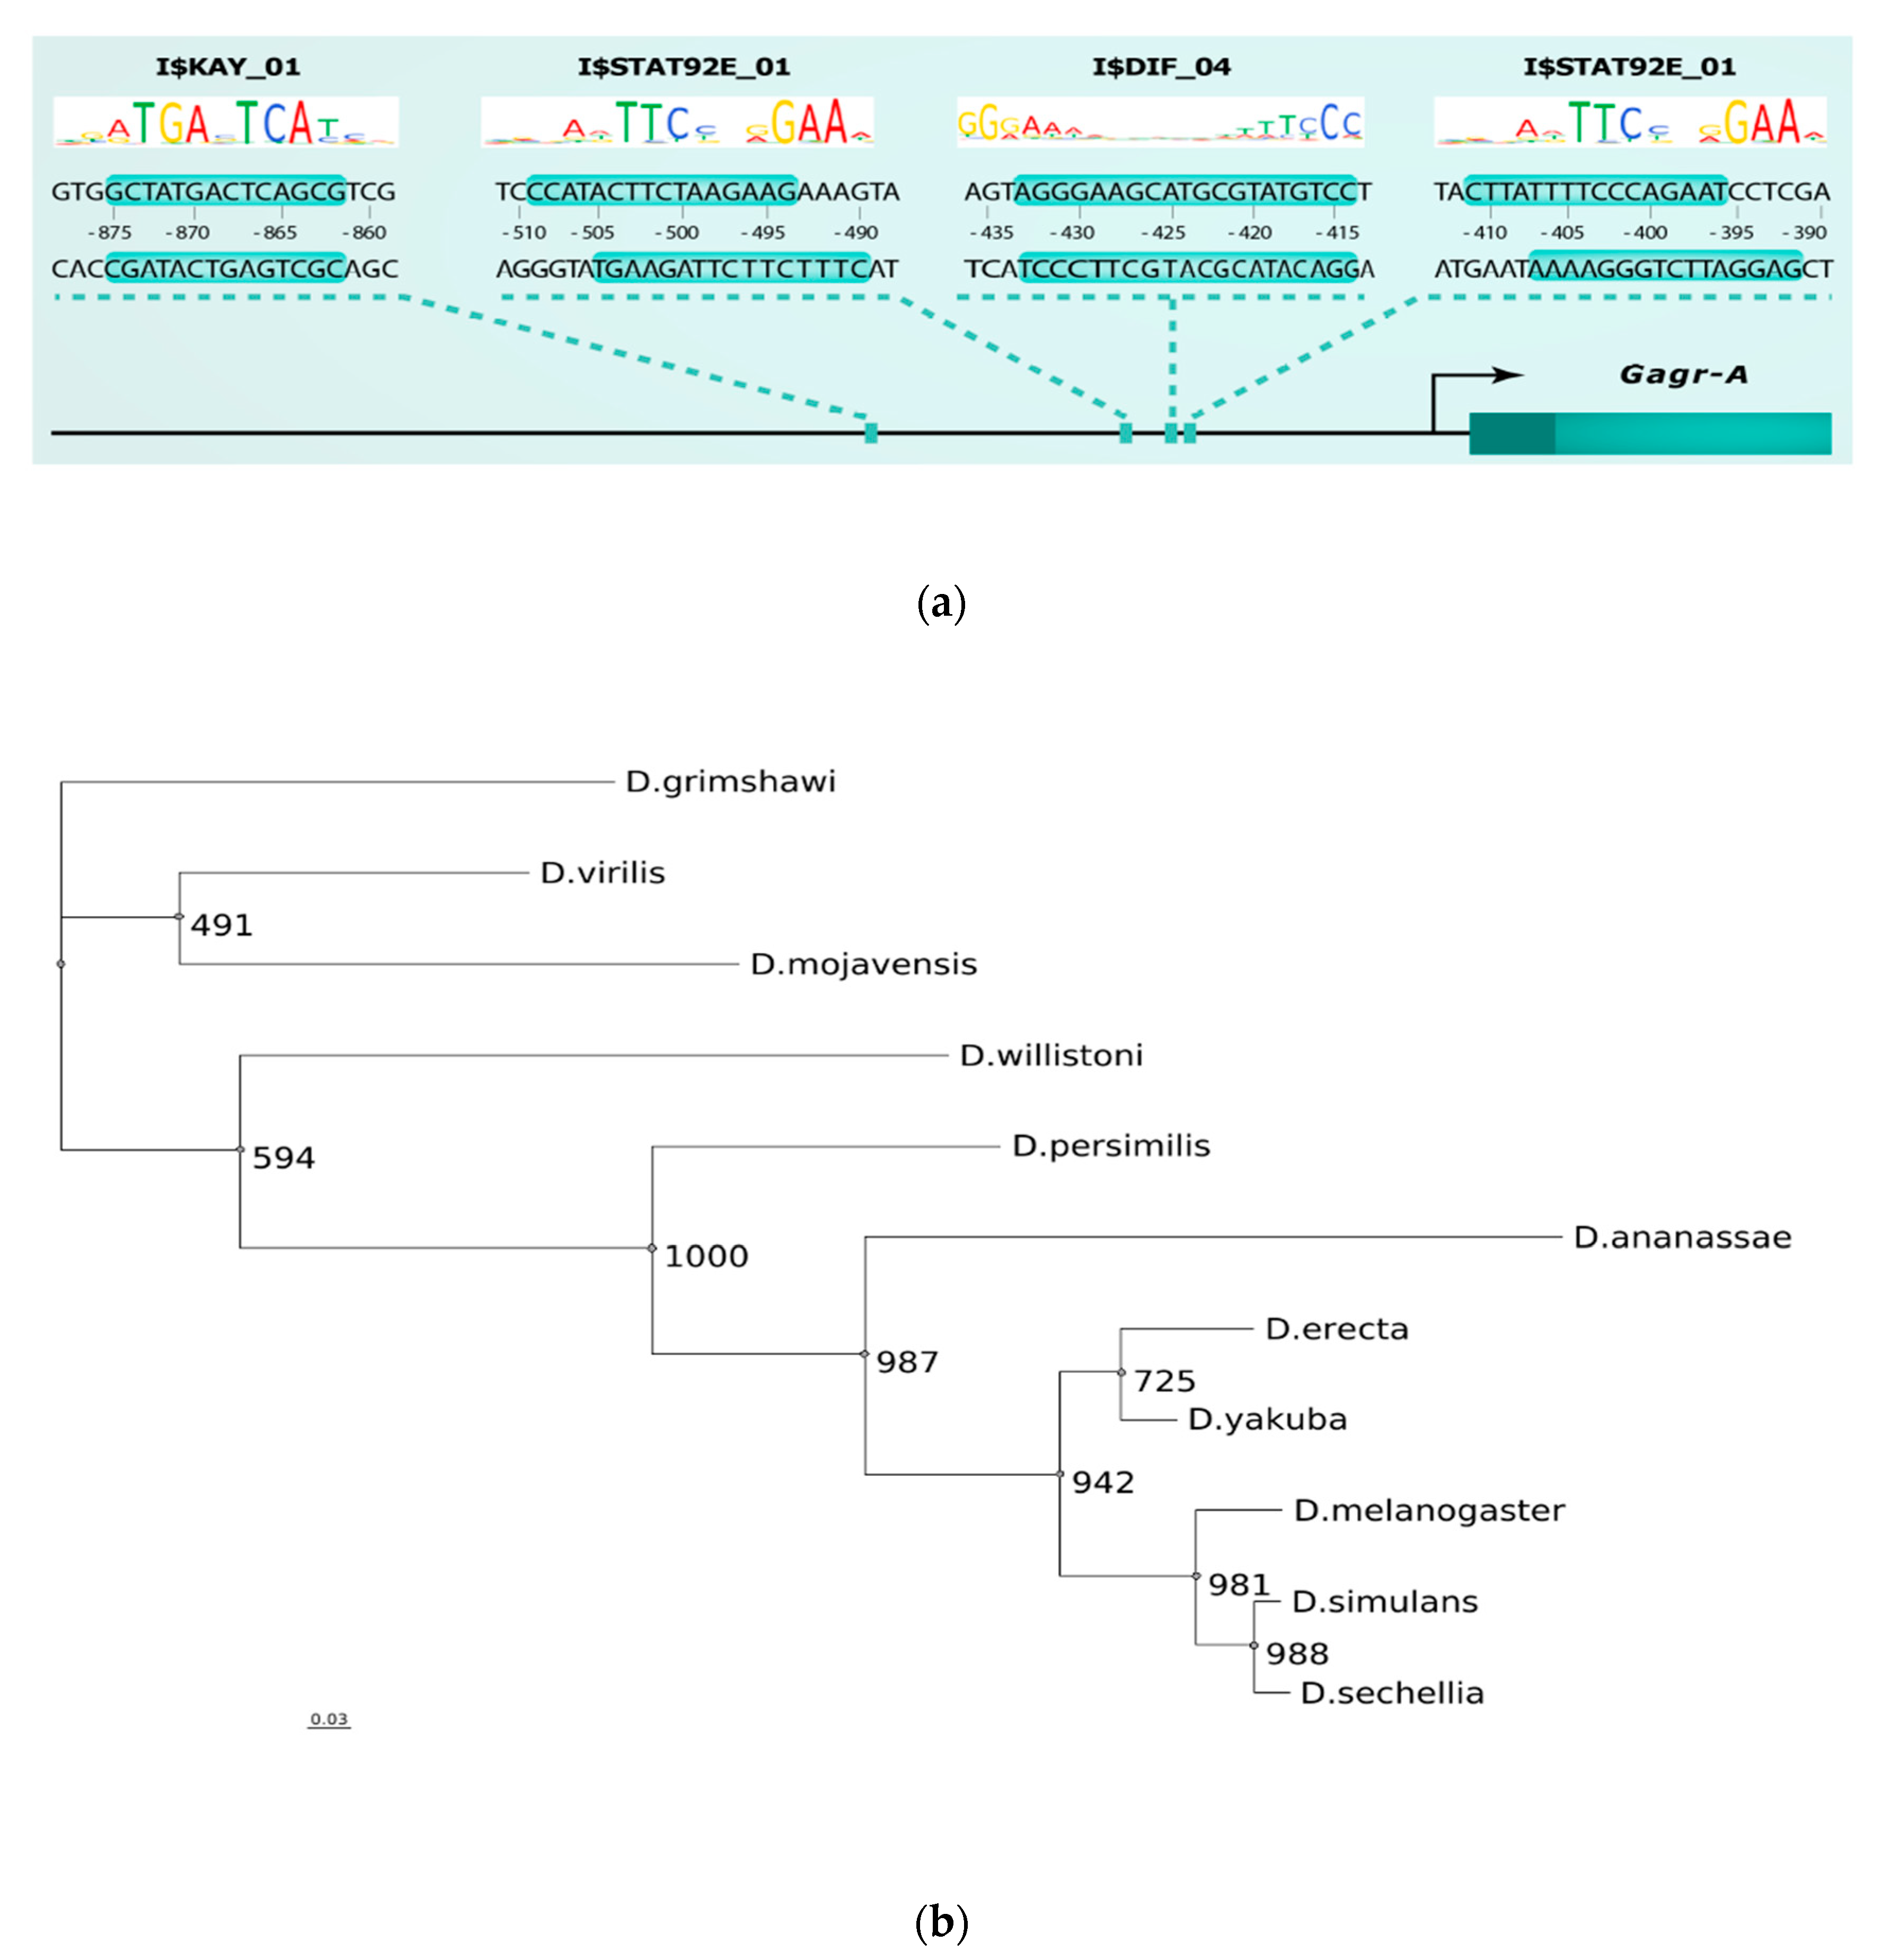
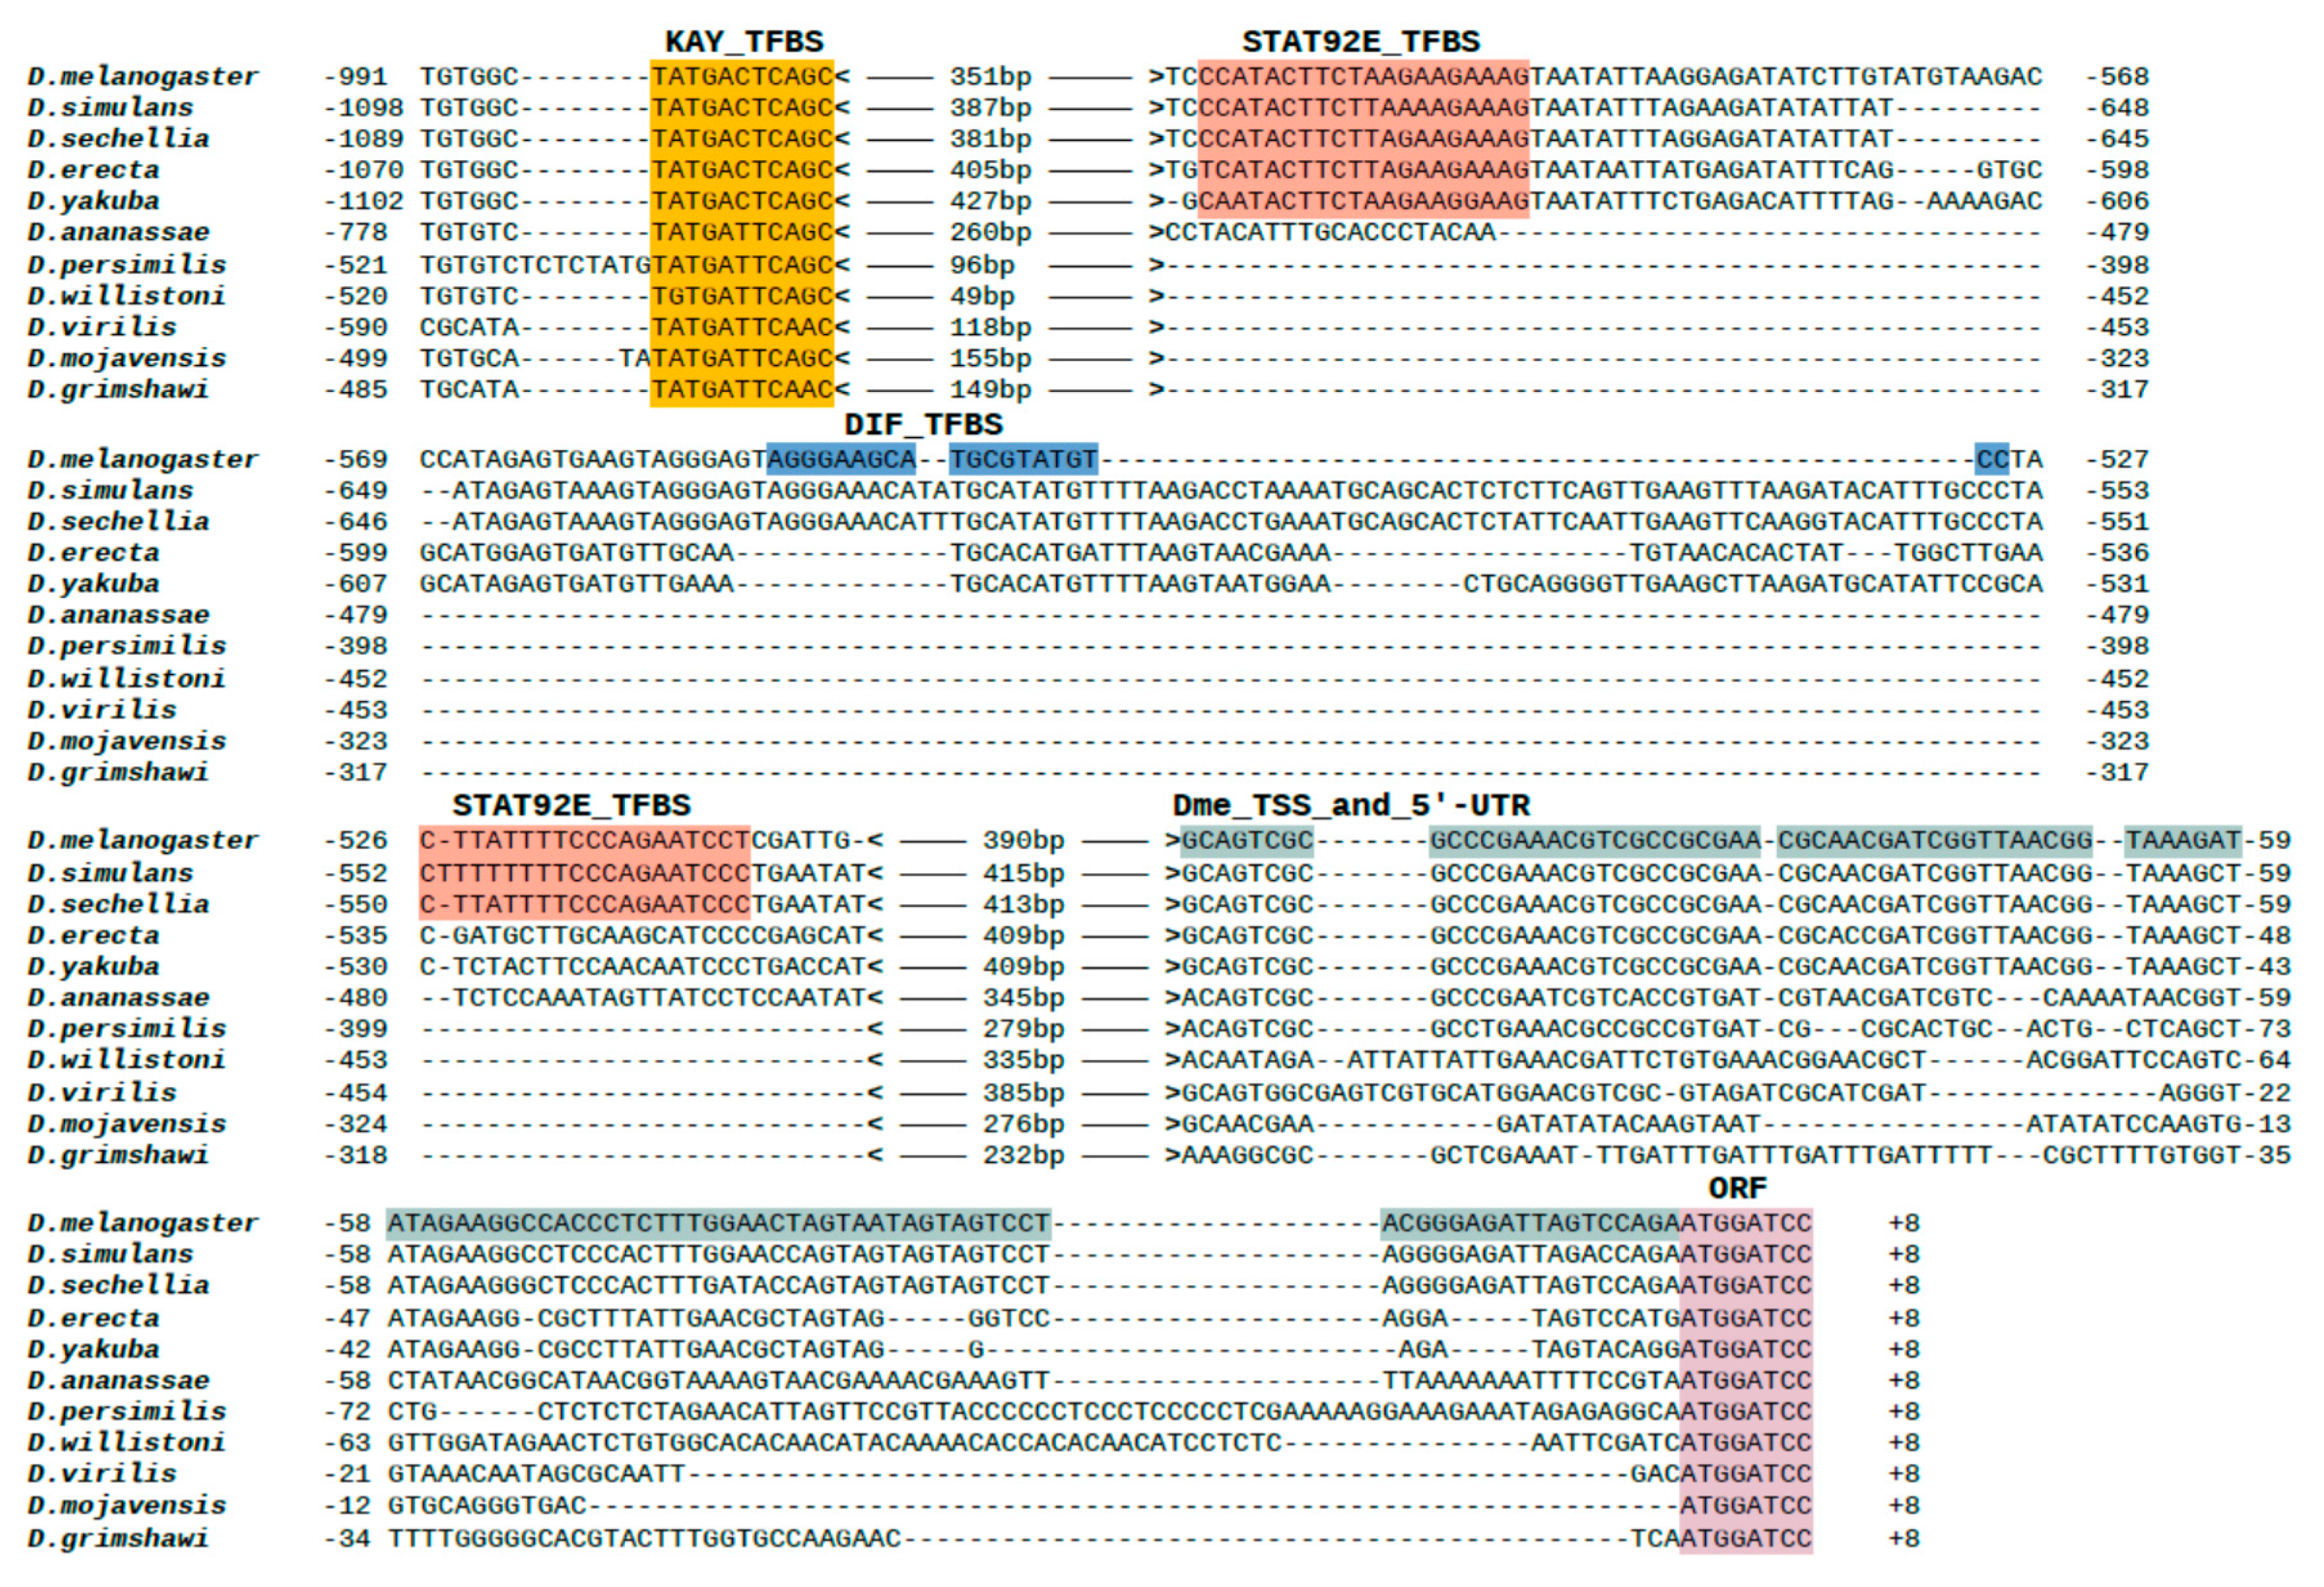
3.5. Phylogenetic Analysis of Promoter Regions of The Gagr Gene in Various Species of The Genus Drosophila

To assess the functional and evolutionary significance of the detected motifs, we examined how conservative their presence and localization in the Gagr gene and its orthologs’ promoters. For study, we isolated the promoter regions of the Gagr gene orthologs in sequenced genomes of Drosophila species of the melanogaster group (D. simulans, D. sechellia, D. melanogaster, D. yakuba, D. erecta, D. ananassae) and other groups (D. persimilis, D. willistoni, D. virilis, D. mojavensis, D. grimshawi).
As a result of the analysis of the promoter regions, one motif I$KAY_01 was found in all species, whereas the motif I$STAT92E_01 is present only in species of the melanogaster group; the binding motif for Dif (I$DIF_04) is non-conservative and is found only in D. melanogaster (Figure 8; see full multiple alignment in File S1). We examined the localization of these motifs in a consensus alignment sequence and found that the motif I$KAY_01 is localized uniquely in the promoter region conserved in all studied species (Figure 5). On the other hand, the motif I$STAT92E_01 is absent in D. ananassae and in species that are not members of the melanogaster group, while D. melanogaster, D. simulans and D. sechellia have a second motif for binding to Stat92E (Figure 8). We also constructed a phylogenetic tree using Gagr promoter sequences and found that the obtained tree has a topology that fully reflects the known phylogenetic relationships between the studied Drosophila species (Figure 7B).
Alignment of the promoter regions of the Gagr orthologs of various Drosophila species showed that the kayak binding motif was present in the promoter region of the Gagr gene before the separation of Sophophora and Drosophila (since its localization is the same in all studied species). In addition, there is a binding motif for Stat92E in the melanogaster subgroup, but it is absent in D. ananassae. Finally, the second Stat92E motif is found only in a group of related species: D. melanogaster, D. simulans, and D. sechellia.
Thus, based on an analysis of potential regulators of stress-induced activation of Gagr and a search for appropriate motifs in various Drosophila species, we conclude that Stat92E and kayak are the main candidates for activating Gagr under stress. The presence of the binding motif for regulation of the Gagr gene by the JNK cascade is conservative among all of the Drosophila species studied, but the regulation of the Gagr gene expression by the Jak-STAT pathway was probably acquired by the species of the melanogaster group during evolution. It is noteworthy that the JNK-dependent regulation of stress-induced activation of Gagr was indirectly confirmed by an experiment on the induction of an immune response by bacterial lipopolysaccharides in the cultures of S2 cells carrying mutations in regulators of stress MAPK/JNK signaling pathways [18].

4. Conclusions

Drosophila studies allow us to expand our understanding of the role of domesticated genes of retroelements in the host organism. Drosophila has two examples of domestication of the env and gag genes of LTR-retrotransposons — the Iris and Gagr genes, respectively [17,58]. Gagr homologs are found in all sequenced genomes of the genus Drosophila; their structure is maintained by stabilizing selection, which indicates the important function of the Gagr gene. Earlier, we have shown that, despite a high conservatism of the gene structure as a whole, its individual sections are under the influence of motif selection, as a result of which the products of the Gagr gene and its homologs from the melanogaster subgroup evolved towards the acquisition of a transmembrane domain [17]. At the same time, as shown in the present work, the promoter region of the gene underwent evolution, and as a result, binding sites for the transcription factor STAT appeared. This indicates the formation of a novel gene function in the Drosophila genome. The data obtained in this work will contribute to our understanding of the evolutionary potential of retrotransposon gene sequences and their role in stress reactions in Drosophila. To clarify and resolve issues relating Gagr gene evolution, we plan to analyze the evolution of the expression of the Gagr gene in response to stress in different species of Drosophila.

Supplementary Materials

The following are available online at https://www.mdpi.com/2073-4425/11/4/396/s1, Table S1: Nodes and edges of co-expression networks. Table S2: Weight matrices found in the study of promoters co-expressed with Gagr genes. File S1: Multiple alignment: Alignment of the promoter regions of the Gagr gene and its orthologs.

Author Contributions

Conceptualization, P.M., L.N. and A.K.; methodology, P.M., Y.B., and A.L.; validation, P.M. and I.K.; investigation, P.M., Y.B., L.N., A.L., and I.K.; writing—original draft preparation, P.M., Y.B.; writing—review and editing, L.N. and I.K.; visualization, Y.B.; supervision, A.K. All authors have read and agreed to the published version of the manuscript.

Funding

The work was supported by the RFBR Grant # 17-04-01250 A.

Conflicts of Interest

The authors declare no conflicts of interest.

References

  1. Volff, J.-N. Turning junk into gold: Domestication of transposable elements and the creation of new genes in eukaryotes. Bioessays 2006, 28, 913–922. [Google Scholar] [CrossRef] [PubMed]
  2. Fedoroff, N.V. Presidential address. Transposable elements, epigenetics, and genome evolution. Science 2012, 758–767. [Google Scholar] [CrossRef] [PubMed] [Green Version]
  3. Kaneko-Ishino, T.; Ishino, F. The role of genes domesticated from LTR retrotransposons and retroviruses in mammals. Front Microbiol. 2012, 3, 262. [Google Scholar] [CrossRef] [PubMed] [Green Version]
  4. Schrader, L.; Schmitz, J. The impact of transposable elements in adaptive evolution. Mol. Ecol. 2019, 28, 1537–1549. [Google Scholar] [CrossRef]
  5. Miller, W.J.; Mcdonald, J.F.; Pinsker, W. Molecular domestication of mobile elements. Genetica 1997, 261–270. [Google Scholar] [CrossRef]
  6. Volff, J.-N. Gene and protein evolution. Preface. Genome Dyn. 2007, 3, VII. [Google Scholar]
  7. Kokosar, J.; Kordis, D. Genesis and regulatory wiring of retroelement-derived domesticated genes: A phylogenomic perspective. Mol. Biol. Evol. 2013, 30, 1015–1031. [Google Scholar] [CrossRef] [Green Version]
  8. Ono, R.; Kuroki, Y.; Naruse, M.; Ishii, M.; Iwasaki, S.; Toyoda, A.; Fujiyama, A.; Shaw, G.; Renfree, M.B. Identification of tammar wallaby SIRH12, derived from a marsupial-specific retrotransposition event. DNA Res. 2011, 18, 211–219. [Google Scholar] [CrossRef] [Green Version]
  9. Emera, D.; Wagner, G.P. Transposable element recruitments in the mammalian placenta: Impacts and mechanisms. Brief. Funct. Genom. 2012, 11, 267–276. [Google Scholar] [CrossRef]
  10. Henke, C.; Strissel, P.L.; Schubert, M.-T.; Mitchell, M.; Stolt, C.C.; Faschingbauer, F.; Beckmann, M.W.; Strick, R. Selective expression of sense and antisense transcripts of the sushi-ichi-related retrotransposon--derived family during mouse placentogenesis. Retrovirology 2015, 12, 9. [Google Scholar] [CrossRef] [Green Version]
  11. Pang, S.W.; Lahiri, C.; Poh, C.L.; Tan, K.O. PNMA family: Protein interaction network and cell signalling pathways implicated in cancer and apoptosis. Cell Signal. 2018, 45, 54–62. [Google Scholar] [CrossRef] [PubMed]
  12. Ivanov, D.; Stone, J.R.; Maki, J.L.; Collins, T.; Wagner, G. Mammalian SCAN domain dimer is a domain-swapped homolog of the HIV capsid C-terminal domain. Mol. Cell 2005, 17, 137–143. [Google Scholar] [CrossRef] [PubMed]
  13. Emerson, R.O.; Thomas, J.H. Gypsy and the birth of the SCAN domain. J. Virol. 2011, 85, 12043–12052. [Google Scholar] [CrossRef] [PubMed] [Green Version]
  14. Benit, L.; De Parseval, N.; Casella, J.F.; Callebaut, I.; Cordonnier, A.; Heidmann, T. Cloning of a new murine endogenous retrovirus, MuERV-L, with strong similarity to the human HERV-L element and with a gag coding sequence closely related to the Fv1 restriction gene. J. Virol. 1997, 71, 5652–5657. [Google Scholar] [CrossRef] [Green Version]
  15. Yap, M.W.; Colbeck, E.; Ellis, S.A.; Stoye, J.P. Evolution of the retroviral restriction gene Fv1: Inhibition of non-MLV retroviruses. PLoS Pathog. 2014, 10, e1003968. [Google Scholar] [CrossRef] [Green Version]
  16. Best, S.; Le Tissier, P.; Towers, G.; Stoye, J.P. Positional cloning of the mouse retrovirus restriction gene Fv1. Nature 1996, 382, 826–829. [Google Scholar] [CrossRef]
  17. Nefedova, L.N.; Kuzmin, I.V.; Makhnovskii, P.A.; Kim, A.I. Domesticated retroviral GAG gene in Drosophila: New functions for an old gene. Virology 2014, 450–451, 196–204. [Google Scholar] [CrossRef] [Green Version]
  18. Silverman, N.; Zhou, R.; Erlich, R.L.; Hunter, M.; Bernstein, E.; Schneider, D.; Maniatis, T. Immune activation of NF-kappaB and JNK requires Drosophila TAK1. J. Biol. Chem. 2003, 278, 48928–48934. [Google Scholar]
  19. Kemp, C.; Mueller, S.; Goto, A.; Barbier, V.; Paro, S.; Bonnay, F.; Dostert, C.; Troxler, L.; Hetru, C.; Meignin, C.; et al. Broad RNA interference-mediated antiviral immunity and virus-specific inducible responses in Drosophila. J. Immunol. 2013, 190, 650–658. [Google Scholar] [CrossRef] [Green Version]
  20. Guruharsha, K.G.; Rual, J.-F.; Zhai, B.; Mintseris, J.; Vaidya, P.; Vaidya, N.; Beekman, C.; Wong, C.; Rhee, D.Y.; Cenaj, O.; et al. A protein complex network of Drosophila melanogaster. Cell 2011, 147, 690–703. [Google Scholar] [CrossRef] [Green Version]
  21. Ashton-Beaucage, D.; Udell, C.M.; Gendron, P.; Sahmi, M.; Lefrancois, M.; Baril, C.; Guenier, A.S.; Duchaine, J.; Lamarre, D.; Lemieux, S.; et al. A functional screen reveals an extensive layer of transcriptional and splicing control underlying RAS/MAPK signaling in Drosophila. PLoS Biol. 2014, 12, e1001809. [Google Scholar]
  22. Ko, H.S.; Uehara, T.; Nomura, Y. Role of ubiquilin associated with protein-disulfide isomerase in the endoplasmic reticulum in stress-induced apoptotic cell death. J. Biol. Chem. 2002, 277, 35386–35392. [Google Scholar] [CrossRef] [PubMed] [Green Version]
  23. Grek, C.; Townsend, D.M. Protein disulfide isomerase superfamily in disease and the regulation of apoptosis. endoplasmic reticulum. Stress. Dis. 2014, 1, 4–17. [Google Scholar]
  24. Majzoub, K.; Hafirassou, M.L.; Meignin, C.; Goto, A.; Marzi, S.; Fedorova, A.; Verdier, Y.; Vinh, J.; Hoffmann, J.A.; Martin, F.; et al. RACK1 controls IRES-mediated translation of viruses. Cell 2014, 159, 1086–1095. [Google Scholar] [CrossRef] [PubMed] [Green Version]
  25. Eilers, M.; Oppliger, W.; Schatz, G. Both ATP and an energized inner membrane are required to import a purified precursor protein into mitochondria. EMBO J. 1987, 6, 1073–1077. [Google Scholar] [CrossRef] [PubMed]
  26. Haynes, C.M.; Fiorese, C.J.; Lin, Y.-F. Evaluating and responding to mitochondrial dysfunction: The mitochondrial unfolded-protein response and beyond. Trends Cell Biol. 2013, 23, 311–318. [Google Scholar] [CrossRef] [PubMed] [Green Version]
  27. Kim, J.; Song, H.; Heo, H.-R.; Kim, J.W.; Kim, H.-R.; Hong, Y.; Yang, S.-R.; Han, S.-S.; Lee, S.-J.; Kim, W.-J.; et al. Cadmium-induced ER stress and inflammation are mediated through C/EBP-DDIT3 signaling in human bronchial epithelial cells. Exp. Mol. Med. 2017, 49, e372. [Google Scholar] [CrossRef]
  28. Liu, J.; Luo, L.-F.; Wang, D.-L.; Wang, W.-X.; Zhu, J.-L.; Li, Y.-C.; Chen, N.-Z.; Huang, H.-L.; Zhang, W.-C. Cadmium induces ovarian granulosa cell damage by activating PERK-eIF2alpha-ATF4 through endoplasmic reticulum stress. Biol. Reprod. 2019, 100, 292–299. [Google Scholar] [CrossRef]
  29. Chen, C.-Y.; Zhang, S.-L.; Liu, Z.-Y.; Tian, Y.; Sun, Q. Cadmium toxicity induces ER stress and apoptosis via impairing energy homoeostasis in cardiomyocytes. Biosci. Rep. 2015, 35, e00214. [Google Scholar] [CrossRef]
  30. Chen, Z.J.; Chen, J.X.; Wu, L.K.; Li, B.Y.; Tian, Y.F.; Xian, M.; Huang, Z.P.; Yu, R.A. Induction of Endoplasmic reticulum stress by cadmium and its regulation on Nrf2 Signaling pathway in kidneys of rats. Biomed. Environ. Sci. 2019, 32, 1–10. [Google Scholar]
  31. Shao, C.-C.; Li, N.; Zhang, Z.-W.; Su, J.; Li, S.; Li, J.-L.; Xu, S.-W. Cadmium supplement triggers endoplasmic reticulum stress response and cytotoxicity in primary chicken hepatocytes. Ecotoxicol. Environ. Saf. 2014, 106, 109–114. [Google Scholar] [CrossRef] [PubMed]
  32. Chankova, S.G.; Dimova, E.; Dimitrova, M.; Bryant, P.E. Induction of DNA double-strand breaks by zeocin in Chlamydomonas reinhardtii and the role of increased DNA double-strand breaks rejoining in the formation of an adaptive response. Radiat. Environ. Biophys. 2007, 46, 409–416. [Google Scholar] [CrossRef] [PubMed]
  33. Zimmermann, M.; Lottersberger, F.; Buonomo, S.B.; Sfeir, A.; de Lange, T. 53BP1 regulates DSB repair using Rif1 to control 5’ end resection. Science 2013, 339, 700–704. [Google Scholar] [CrossRef] [PubMed] [Green Version]
  34. Koschmann, J.; Bhar, A.; Stegmaier, P.; Kel, A.E.; Wingender, E. “Upstream analysis”: An Integrated promoter-pathway analysis approach to causal interpretation of microarray data. Microarrays 2015, 4, 270–286. [Google Scholar] [CrossRef]
  35. Makhnovskii, P.A.; Kuzmin, I.V.; Nefedova, L.N.; Kim, A.I. Functional analysis of Grp and Iris, the gag and env domesticated errantivirus genes, in the Drosophila melanogaster genome. Mol. Biol. 2016, 50, 435–444. [Google Scholar] [CrossRef]
  36. Santabarbara-Ruiz, P.; Lopez-Santillan, M.; Martinez-Rodriguez, I.; Binagui-Casas, A.; Perez, L.; Milan, M.; Corominas, M.; Serras, F. ROS-induced JNK and p38 signaling is required for unpaired cytokine activation during Drosophila regeneration. PLoS Genet. 2015, 11, e1005595. [Google Scholar] [CrossRef] [Green Version]
  37. Bunker, B.D.; Nellimoottil, T.T.; Boileau, R.M.; Classen, A.K.; Bilder, D. The transcriptional response to tumorigenic polarity loss in Drosophila. Elife 2015, 4. [Google Scholar] [CrossRef]
  38. Dostert, C.; Jouanguy, E.; Irving, P.; Troxler, L.; Galiana-Arnoux, D.; Hetru, C.; Hoffmann, J.A.; Imler, J.L. The Jak-STAT signaling pathway is required but not sufficient for the antiviral response of Drosophila. Nat. Immunol. 2005, 6, 946–953. [Google Scholar] [CrossRef]
  39. Paradkar, P.N.; Trinidad, L.; Voysey, R.; Duchemin, J.-B.; Walker, P.J. Secreted Vago restricts West Nile virus infection in Culex mosquito cells by activating the Jak-STAT pathway. Proc. Natl. Acad. Sci. USA 2012, 109, 18915–18920. [Google Scholar] [CrossRef] [Green Version]
  40. Carpenter, J.; Hutter, S.; Baines, J.F.; Roller, J.; Saminadin-Peter, S.S.; Parsch, J.; Jiggins, F.M. The transcriptional response of Drosophila melanogaster to infection with the sigma virus (Rhabdoviridae). PLoS ONE 2009, 4, e6838. [Google Scholar] [CrossRef] [Green Version]
  41. Gruenewald, C.; Botella, J.A.; Bayersdorfer, F.; Navarro, J.A.; Schneuwly, S. Hyperoxia-induced neurodegeneration as a tool to identify neuroprotective genes in Drosophila melanogaster. Free Radic. Biol. Med. 2009, 46, 1668–1676. [Google Scholar] [CrossRef] [PubMed]
  42. Zou, S.; Meadows, S.; Sharp, L.; Jan, L.Y.; Jan, Y.N. Genome-wide study of aging and oxidative stress response in Drosophila melanogaster. Proc. Natl. Acad. Sci. USA 2000, 97, 13726–13731. [Google Scholar] [CrossRef] [PubMed] [Green Version]
  43. Park, J.M.; Brady, H.; Ruocco, M.G.; Sun, H.; Williams, D.; Lee, S.J.; Kato, T., Jr.; Richards, N.; Chan, K.; Mercurio, F.; et al. Targeting of TAK1 by the NF-kappa B protein Relish regulates the JNK-mediated immune response in Drosophila. Genes Dev. 2004, 18, 584–594. [Google Scholar] [CrossRef] [PubMed] [Green Version]
  44. Morrow, G.; Samson, M.; Michaud, S.; Tanguay, R.M. Overexpression of the small mitochondrial Hsp22 extends Drosophila life span and increases resistance to oxidative stress. FASEB J. 2004, 18, 598–599. [Google Scholar] [CrossRef] [Green Version]
  45. Lin, R.; Angelin, A.; Da Settimo, F.; Martini, C.; Taliani, S.; Zhu, S.; Wallace, D.C. Genetic analysis of dTSPO, an outer mitochondrial membrane protein, reveals its functions in apoptosis, longevity, and Ab42-induced neurodegeneration. Aging Cell 2014, 13, 507–518. [Google Scholar] [CrossRef]
  46. Seong, C.-S.; Varela-Ramirez, A.; Tang, X.; Anchondo, B.; Magallanes, D.; Aguilera, R.J. Cloning and characterization of a novel Drosophila stress induced DNase. PLoS ONE 2014, 9, e103564. [Google Scholar] [CrossRef] [Green Version]
  47. Shlevkov, E.; Morata, G. A dp53/JNK-dependant feedback amplification loop is essential for the apoptotic response to stress in Drosophila. Cell Death Differ. 2012, 19, 451–460. [Google Scholar] [CrossRef] [Green Version]
  48. Silva, J.M.; Wong, A.; Carelli, V.; Cortopassi, G.A. Inhibition of mitochondrial function induces an integrated stress response in oligodendroglia. Neurobiol. Dis. 2009, 34, 357–365. [Google Scholar] [CrossRef]
  49. Martínez-Reyes, I.; Sánchez-Aragó, M.; Cuezva, J.M. AMPK and GCN2-ATF4 signal the repression of mitochondria in colon cancer cells. Biochem. J. 2012, 444, 249–259. [Google Scholar] [CrossRef]
  50. Argue, K.J.; Neckameyer, W.S. Altering the sex determination pathway in Drosophila fat body modifies sex-specific stress responses. Am. J. Physiol. Regul. Integr. Comp. Physiol. 2014, 307, R82–R92. [Google Scholar] [CrossRef] [Green Version]
  51. Palmer, W.H.; Medd, N.C.; Beard, P.M.; Obbard, D.J. Isolation of a natural DNA virus of Drosophila melanogaster, and characterisation of host resistance and immune responses. PLoS Pathog. 2018, 14, e1007050. [Google Scholar] [CrossRef] [PubMed]
  52. Li, S.; Yu, X.; Feng, Q. Fat Body Biology in the Last Decade. Annu. Rev. Entomol. 2019, 64, 315–333. [Google Scholar] [CrossRef] [PubMed]
  53. Woodcock, K.J.; Kierdorf, K.; Pouchelon, C.A.; Vivancos, V.; Dionne, M.S.; Geissmann, F. Macrophage-derived upd3 cytokine causes impaired glucose homeostasis and reduced lifespan in Drosophila fed a lipid-rich diet. Immunity 2015, 42, 133–144. [Google Scholar] [CrossRef] [PubMed] [Green Version]
  54. Landis, G.; Shen, J.; Tower, J. Gene expression changes in response to aging compared to heat stress, oxidative stress and ionizing radiation in Drosophila melanogaster. Aging 2012, 4, 768–789. [Google Scholar] [CrossRef] [PubMed] [Green Version]
  55. Ryoo, H.D. Drosophila as a model for unfolded protein response research. BMB Rep. Korea (South) 2015, 48, 445–453. [Google Scholar] [CrossRef] [Green Version]
  56. Wang, L.; Zeng, X.; Ryoo, H.D.; Jasper, H. Integration of UPRER and oxidative stress signaling in the control of intestinal stem cell proliferation. PLoS Genet. 2014, 10, e1004568. [Google Scholar] [CrossRef]
  57. Ahmed-de-Prado, S.; Diaz-Garcia, S.; Baonza, A. JNK and JAK/STAT signalling are required for inducing loss of cell fate specification during imaginal wing discs regeneration in Drosophila melanogaster. Dev. Biol. 2018, 441, 31–41. [Google Scholar] [CrossRef]
  58. Malik, H.S.; Henikoff, S. Positive selection of Iris, a retroviral envelope-derived host gene in Drosophila melanogaster. PLoS Genet. 2005, 1, e44. [Google Scholar] [CrossRef] [Green Version]
Figure 1. Workflow for the search and analysis of co-expression groups for the Gagr gene and genes with virus-induced expression. DEGs—differently expressed genes; TFBS—transcription factor binding sites.
Genes 11 00396 g001
Figure 2. Analysis of the expression of Gagr and stress-induced genes in D. melanogaster females in response to various stress agents after 24 h exposure. *—significant differences in exposure relative to control (Mann-Whitney test, p-value < 0.01, N = 5-7). The data are presented as median and interquartile range.
Genes 11 00396 g002
Figure 3. Activation of Gagr expression of D. melanogaster females and males in response to different times of exposure to 0.1 M ammonium persulfate. *—significant differences relative to the basal level (Mann-Whitney test, p-value < 0.01, N = 5–7). The data are presented as scatterplots and boxplots (median, interquartile range, 5 to 95 percentile).
Genes 11 00396 g003
Figure 4. Relative expression of Gagr and stress-induced genes in D. melanogaster females in response to different times of exposure to 0.1 M ammonium persulfate and after 30 h exposure followed by 2 or 12 h recovery periods. The horizontal axis shows the exposure time, 2 and 12 h recovery periods are marked on the axis as “30 + 2” and “30 + 12”. *—significant differences relative to the basal level, —significant differences after the recovery period relative to the level after 30 h (Mann-Whitney test, p-value < 0.01, N = 5–6). The data are presented as scatterplots and boxplots (median, interquartile range, 5 to 95 percentile).
Genes 11 00396 g004
Figure 5. Tissue-specific activation of Gagr expression and stress-induced genes in D. melanogaster females in response to 24 h exposure to 0.1 M ammonium persulfate. White bars correspond to intact control; red bars correspond to the effects of ammonium persulfate. *—significant differences relative to control (Mann-Whitney test, p-value < 0.01, N = 5-6. The data are presented as median and interquartile range.
Genes 11 00396 g005
Figure 6. Co-expression clusters of genes with virus-induced expression (according to GEO: GSE2828, GSE31542, GSE42255). The genes in the cluster with Gagr (cluster 2) are marked in green, the Gagr gene is marked in red.
Genes 11 00396 g006
Figure 7. Analysis of the promoter regions of the Gagr gene and its orthologs. (A) Localization of binding sites for the transcription factors Dif, kay and Stat92E in the Gagr gene promoter. (B) Phylogram based on the promoter sequences of the Drosophila Gagr gene; bootstrap branch values are presented (the number of bootstrap replicas is 1000).
Genes 11 00396 g007
Figure 8. Alignment of Gagr promoter regions for different Drosophila species. Features marked in color: TFBS –Transcription factor binding sites; Dme_TSS_and_5’-UTR—Transcription start site and 5’-untraslated region of D. melanogaster Gagr; ORF—Open reading frame.
Genes 11 00396 g008
Table 1. Stress agents and controls used in experiments and stress effects.
Stress AgentExpected Biological EffectTreatment Control
Ammonium persulfate, 0.1 MOxidative stressAmmonium sulfate, 0.1 M
(as a control of salt stress and of ammonium ions)
Oligomycin A, 1 mM
(ethanol solution)
Disruption of mitochondrial proteostasis, inhibition of mitochondrial ATP synthase [25,26]Ethanol, ~5%
Cadmium chloride, 0.1 MER stress, unfolded protein response [27,28,29,30,31]Magnesium chloride, 0.1 M
(as a divalent metal salt)
Zeocin, 10 mM
(chelated with copper (II) ions)
Initiation of double-strand DNA breaks [32,33]Copper (II) chloride, 15 mM
Table 2. Primers used in quantitative PCR experiments.
GeneForward PrimerReverse Primer
GagrAACTTCGATGGCAGTGATCCGCTCATTTGTCGCGTGAAGA
vir-1CGTAAAGAGTGCCATCATCGTGTTCCTGCTCCAAATCT
RelishTCATACACACCGCCAAGAAGCTGTCTCCTGATGCAGTTCC
upd3AACGGCCAGAACCAGGAATCGAGAGGGCAAACTGGGACAT
hidGGAAGGAAGCGGATAAGGACACCCGATGAACTCGACGCTAC
sidGGAAGTGTTCAAGCGAATTGAGCAGATACAACGTCTGGTG
TspoCTAGCAGCCACGCTAAGTCGTTCGATAGGTCGGAAAGC
Hsp22CTTTCACGCCTTCTTCCACGTGAGTTTGTAGCCATCCTTG
alphaTub84DGTGCATGTTGTCCAACACCACAGAACTCTCCCTCCTCCATA
RpL40CTGCGTGGTGGTATCATTGCAGGTTGTTGGTGTGTCC
EloBGCACAAACATACACACTCACGTTTCCTACTTCGCTTGCACC
Table 3. Expression stress markers used in experiments.
GeneDescription
upd3Target of JNK signaling cascade and transcription factor AP-1 [36]; ligand that activates Jak-STAT signaling pathway [37]; one of key cytokines in response to various stress factors.
vir-1Prospective target of Jak-STAT signaling pathway [38,39]. Expression of vir-1 is activated in response to viral infection [19,38,40] and oxidative stress [41,42].
RelNFkB transcription factor. Stress-induced activation of Rel expression depends on JNK signaling [43].
Hsp22Chaperone; involved in oxidative stress reactions in mitochondria [44]
TspoMitochondrial protein; positive regulator of apoptosis; plays important role in oxidative stress [45]
SidDNase gene activated by oxidative stress [46]
HidTarget of transcription factor foxo; positive regulator of apoptosis [38]; p53 cascade target [47]
Table 4. TFBS enrichment analysis for promoter regions of co-expressed genes. Values presented: adjusted fold enrichment (statistically corrected odds ratios with a 99% confidence interval) for weight matrices of stress-associated transcription factors; significant enrichment is marked in red.
PWM_IDTFCluster 1Cluster 2Cluster 3Cluster 4Cluster 5Cluster 6
I$KAY_01Kay1.242.840.700.761.100.57
I$KAY_02Kay0.650.600.751.010.540.51
I$JRA_01Jra0.590.660.721.030.510.54
I$ATF2_01Atf20.670.740.951.030.560.48
I$ATF6_02Atf60.730.630.701.090.520.56
I$CREBA_02CrebA0.810.700.731.190.530.57
I$GATAE_01GATAe0.641.171.220.650.720.48
I$GRN_01Grn0.631.681.130.690.680.40
I$PNR_02Pnr0.631.010.770.680.560.49
I$PNR_03Pnr0.631.601.150.660.670.42
I$SRP_01Srp0.631.701.120.710.680.40
I$MTTFA_01Tfam0.601.631.270.620.660.44
I$DIF_01Dif0.571.780.810.690.590.27
I$DIF_02Dif0.601.520.850.660.610.27
I$DIF_03Dif0.521.020.930.681.170.45
I$REL_01Rel0.601.380.690.670.720.30
I$STAT_01Stat92E0.561.160.630.730.370.48
I$STAT92E_01Stat92E0.611.080.630.530.530.38
I$CNC_01Cnc0.590.610.730.700.601.10
I$HSF_05Hsf0.570.740.670.640.481.06

