Genes ScBx1 and ScIgl—Competitors or Cooperators?

 , , ,
, , ,  and
and
Abstract
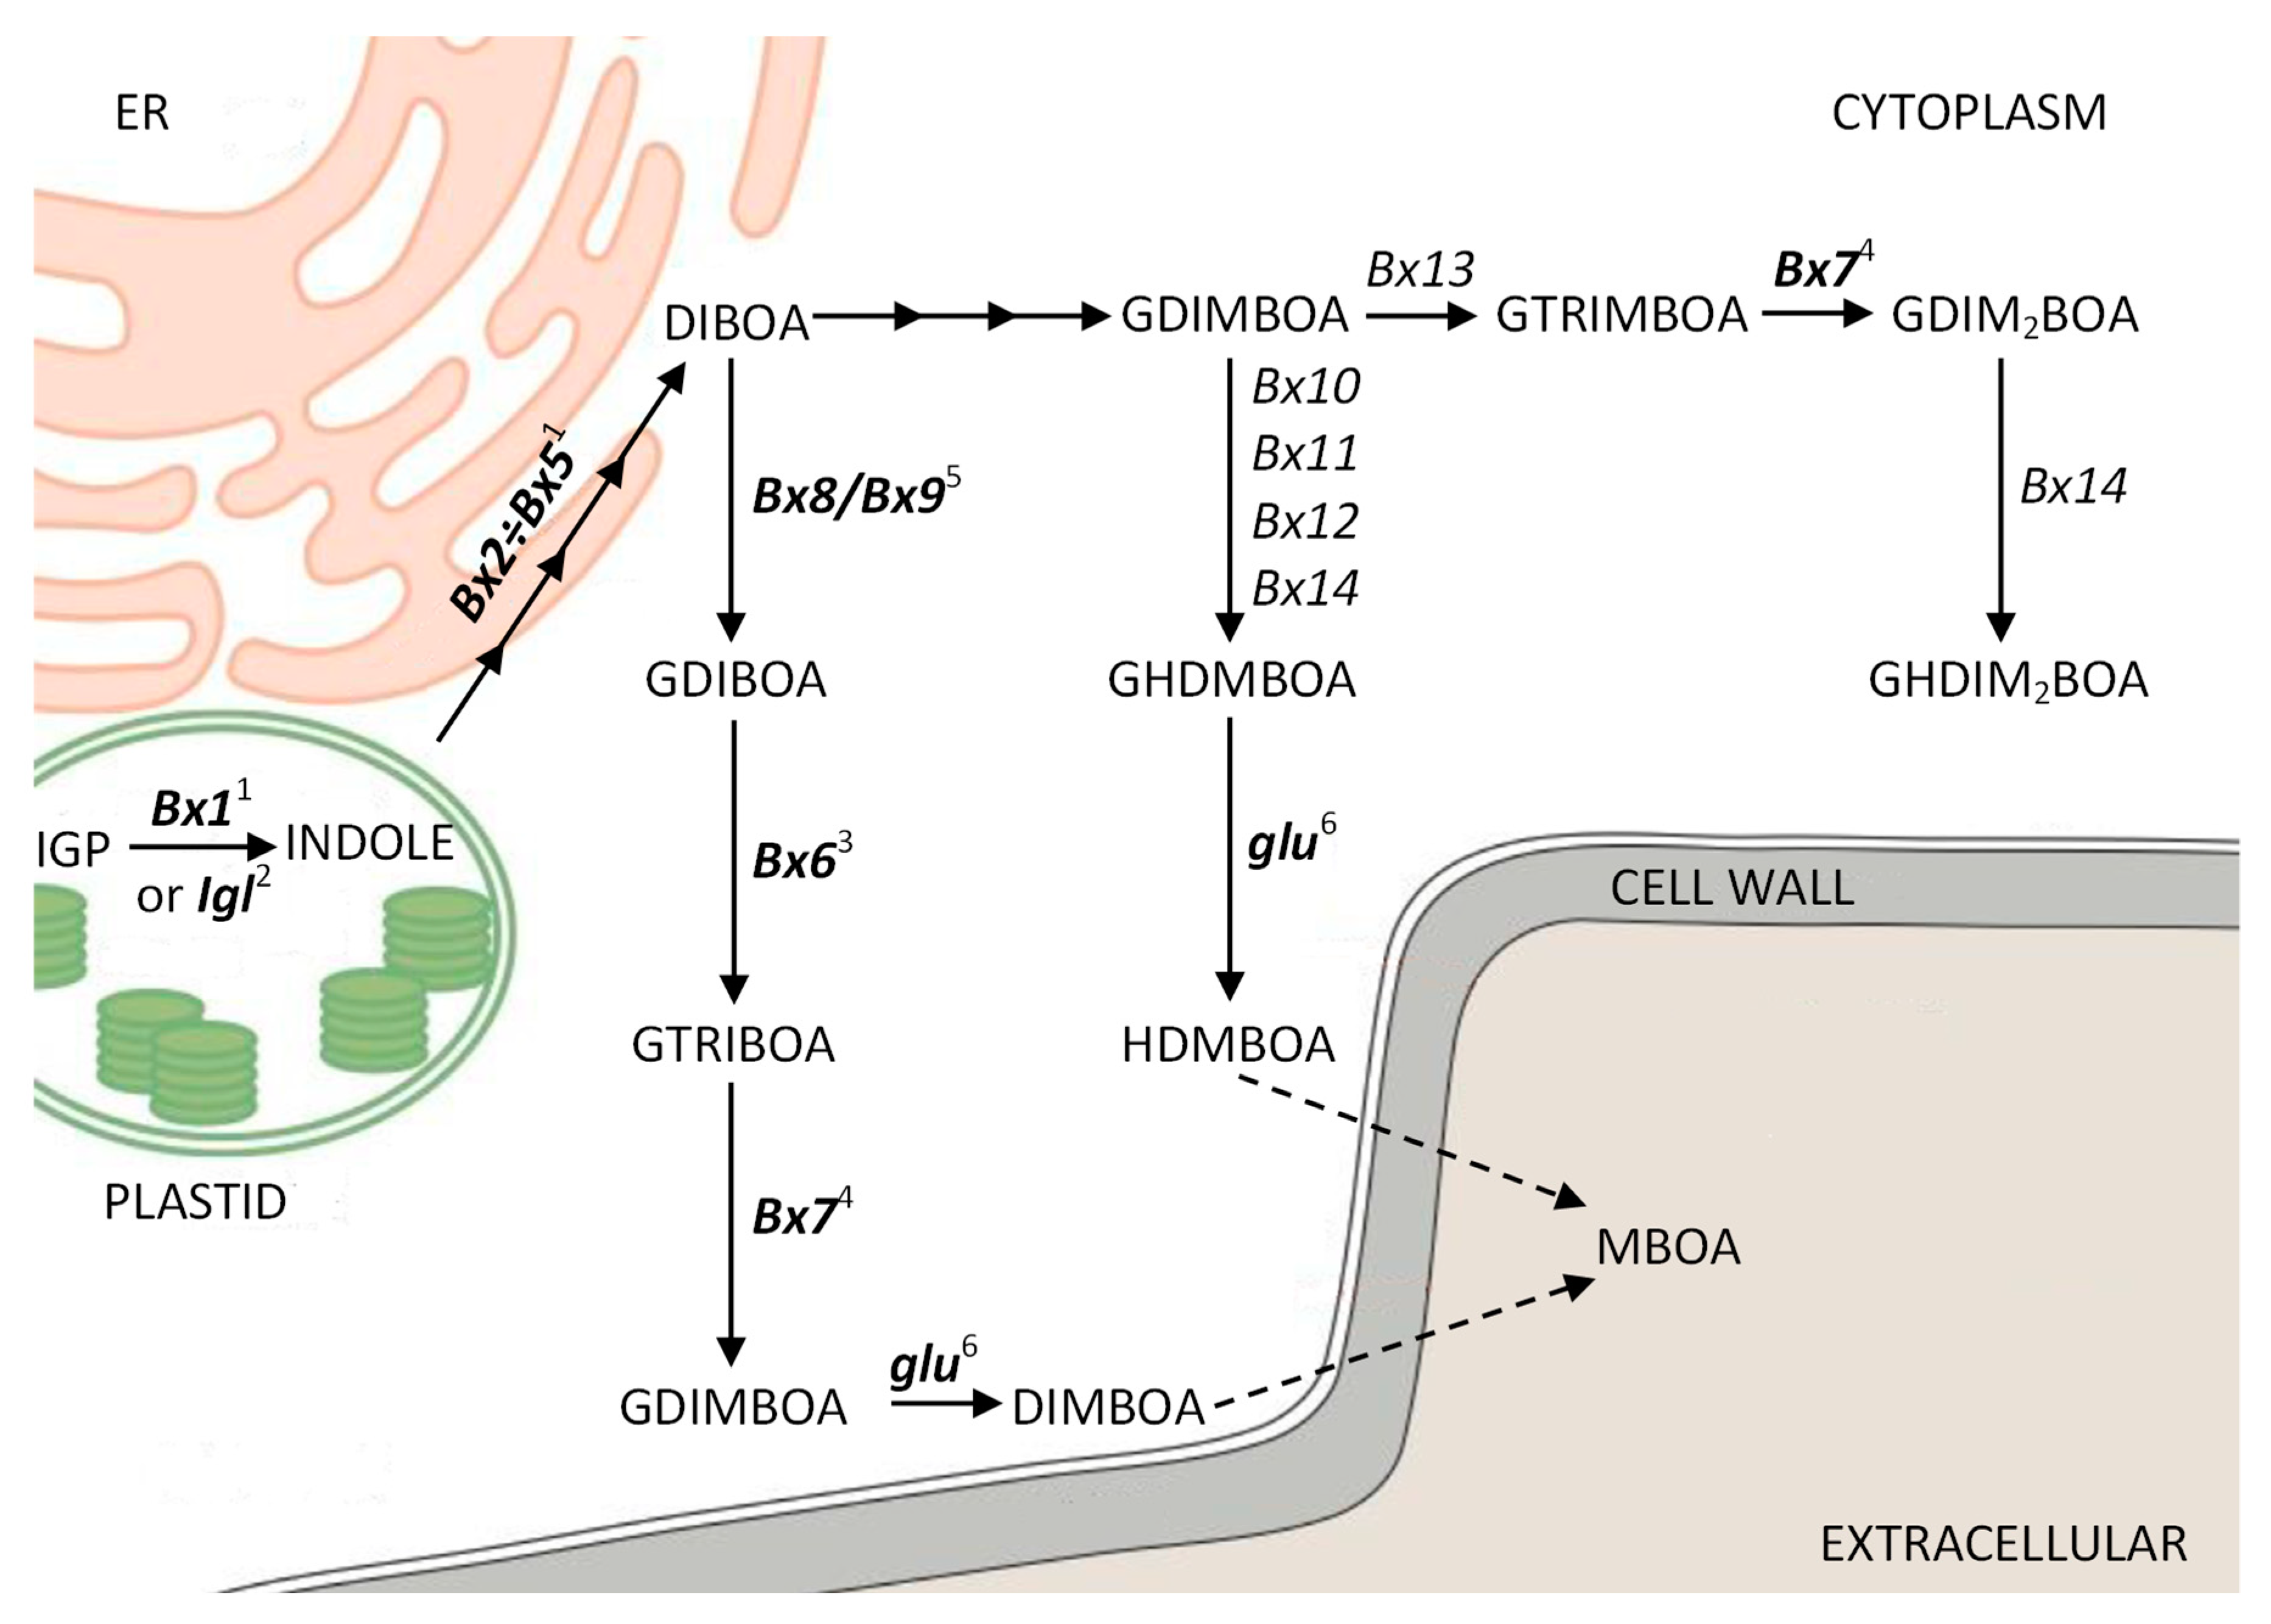
1. Introduction
2. Materials and Methods
2.1. Plant Materials
2.2. RNA Isolation
2.3. cDNA Synthesis
2.4. qRT-PCR
2.5. Analysis of ScBx1 and ScIgl Expression in Plants with Silenced ScBx1
2.6. In Vivo Analysis of Promoter Sequences
2.7. Biochemical Analysis
2.8. Statistical Analysis
3. Results
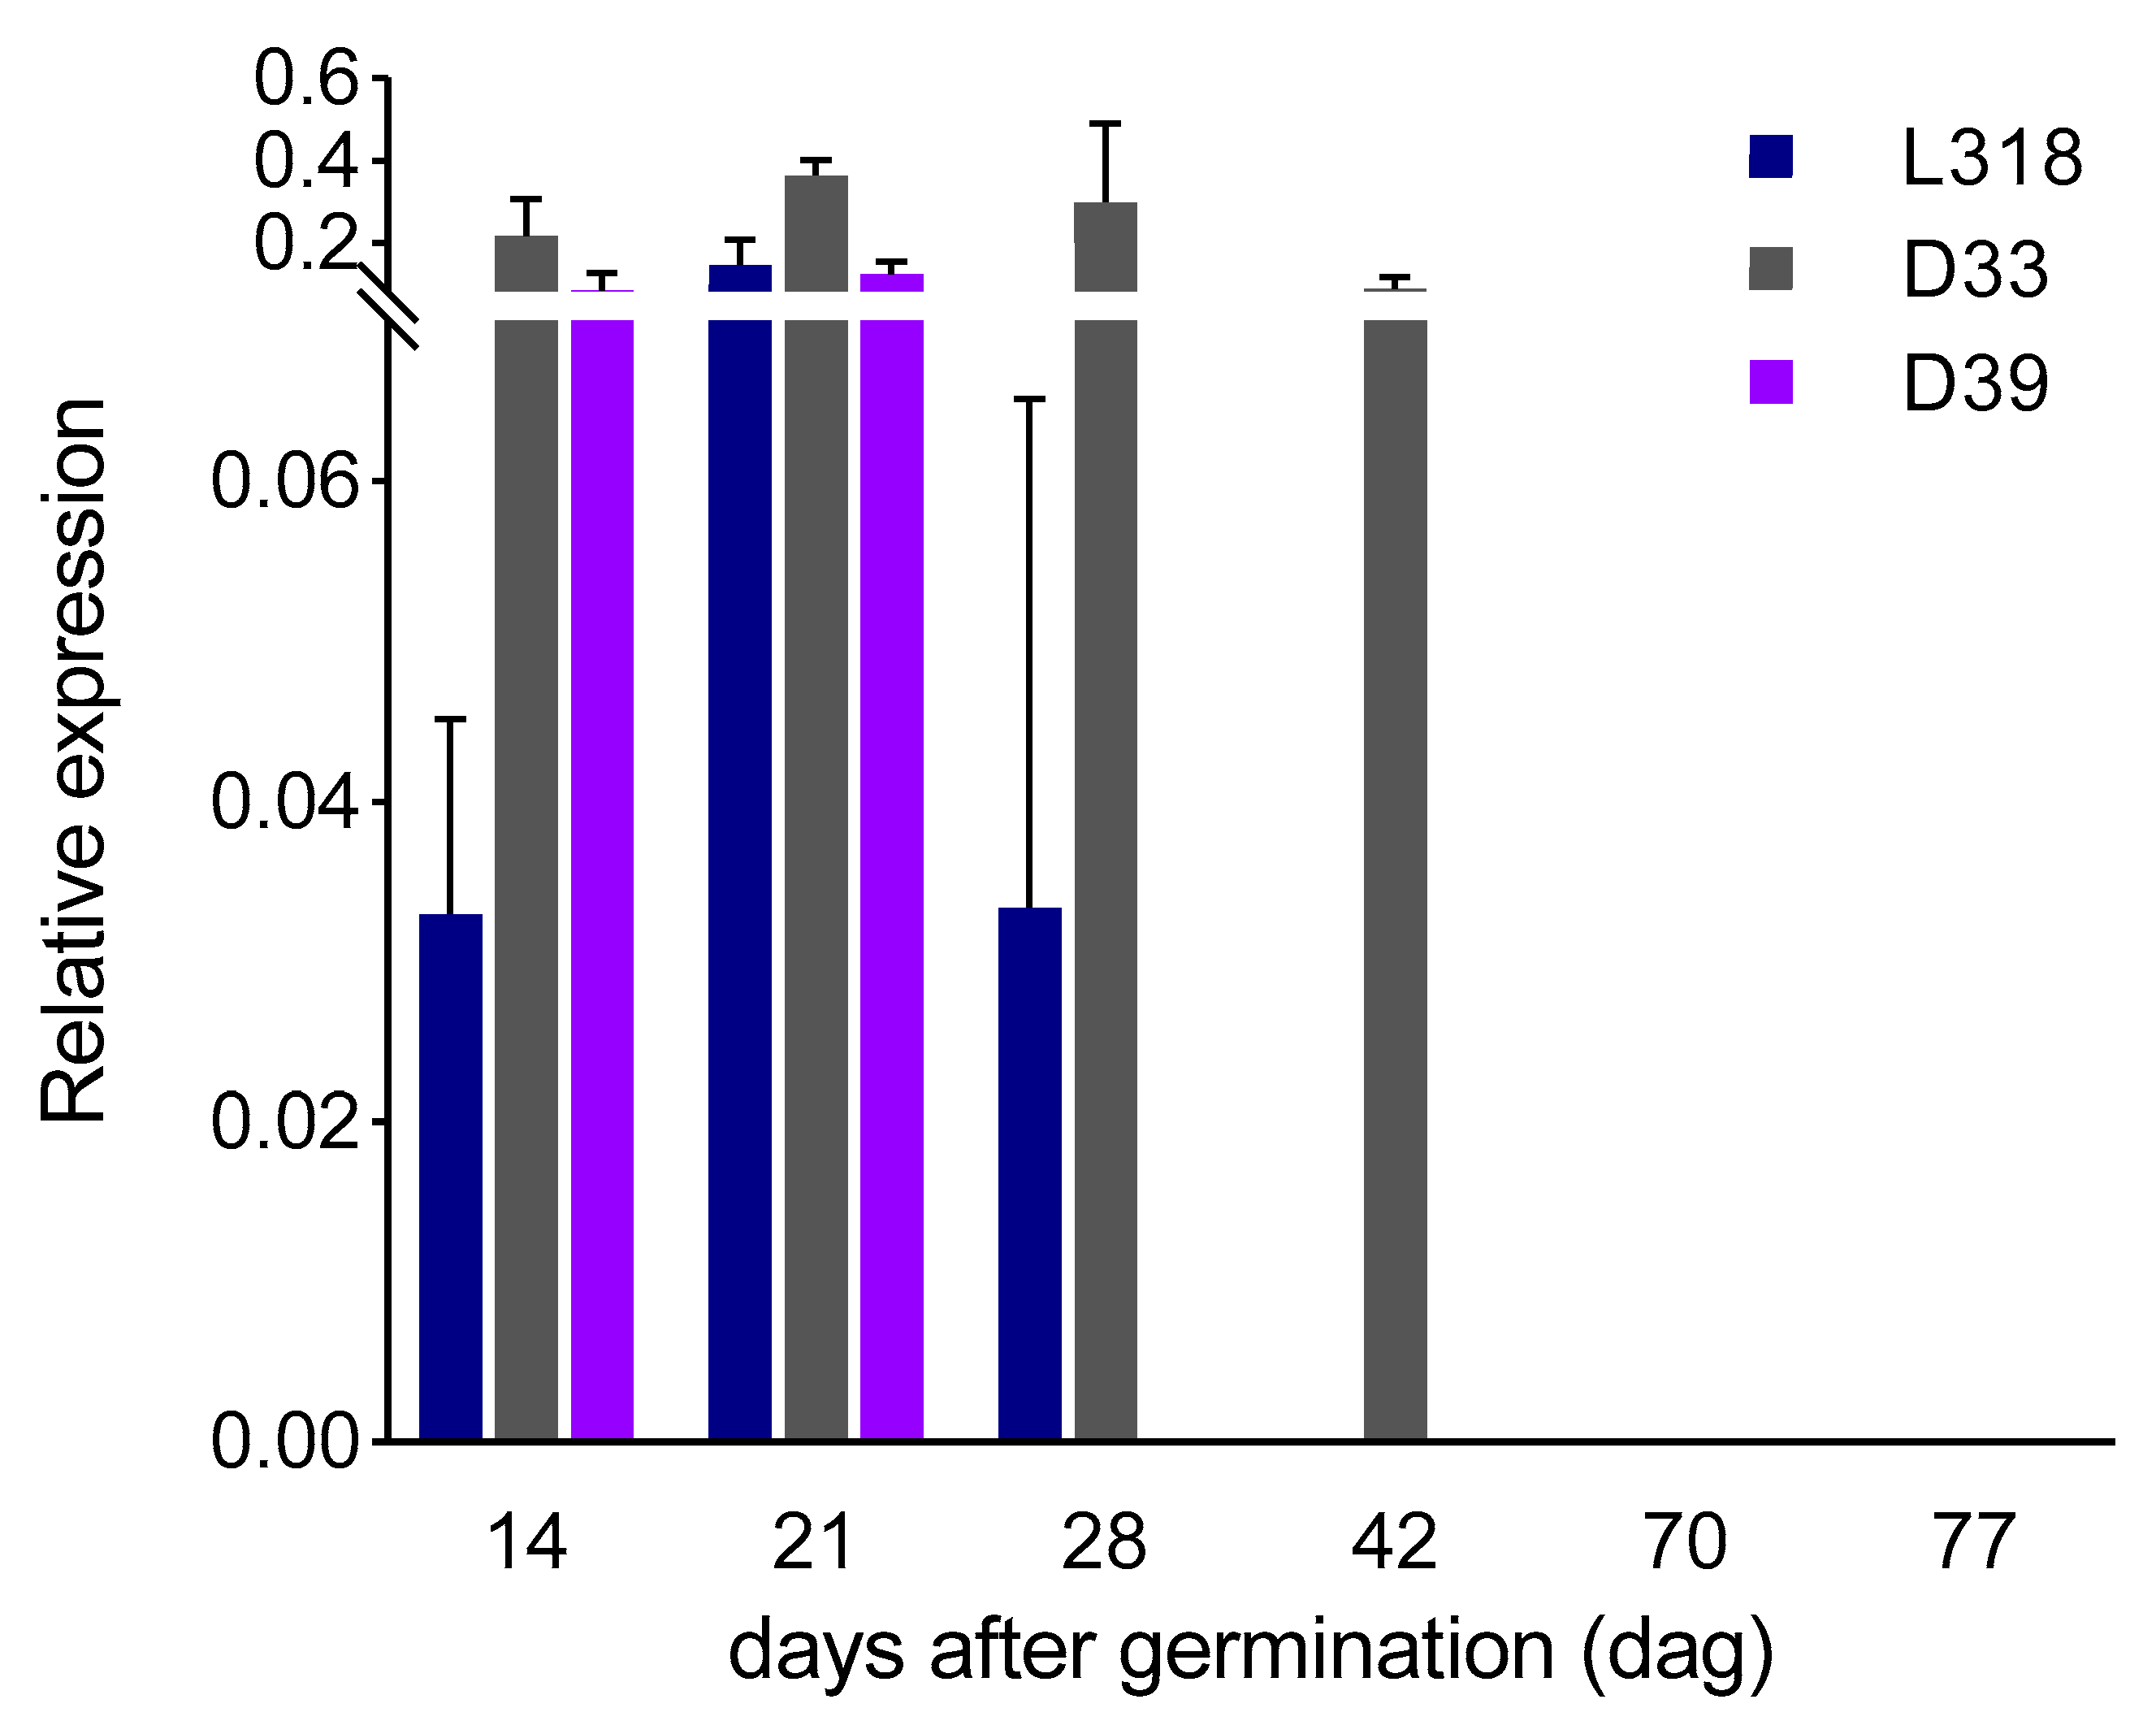
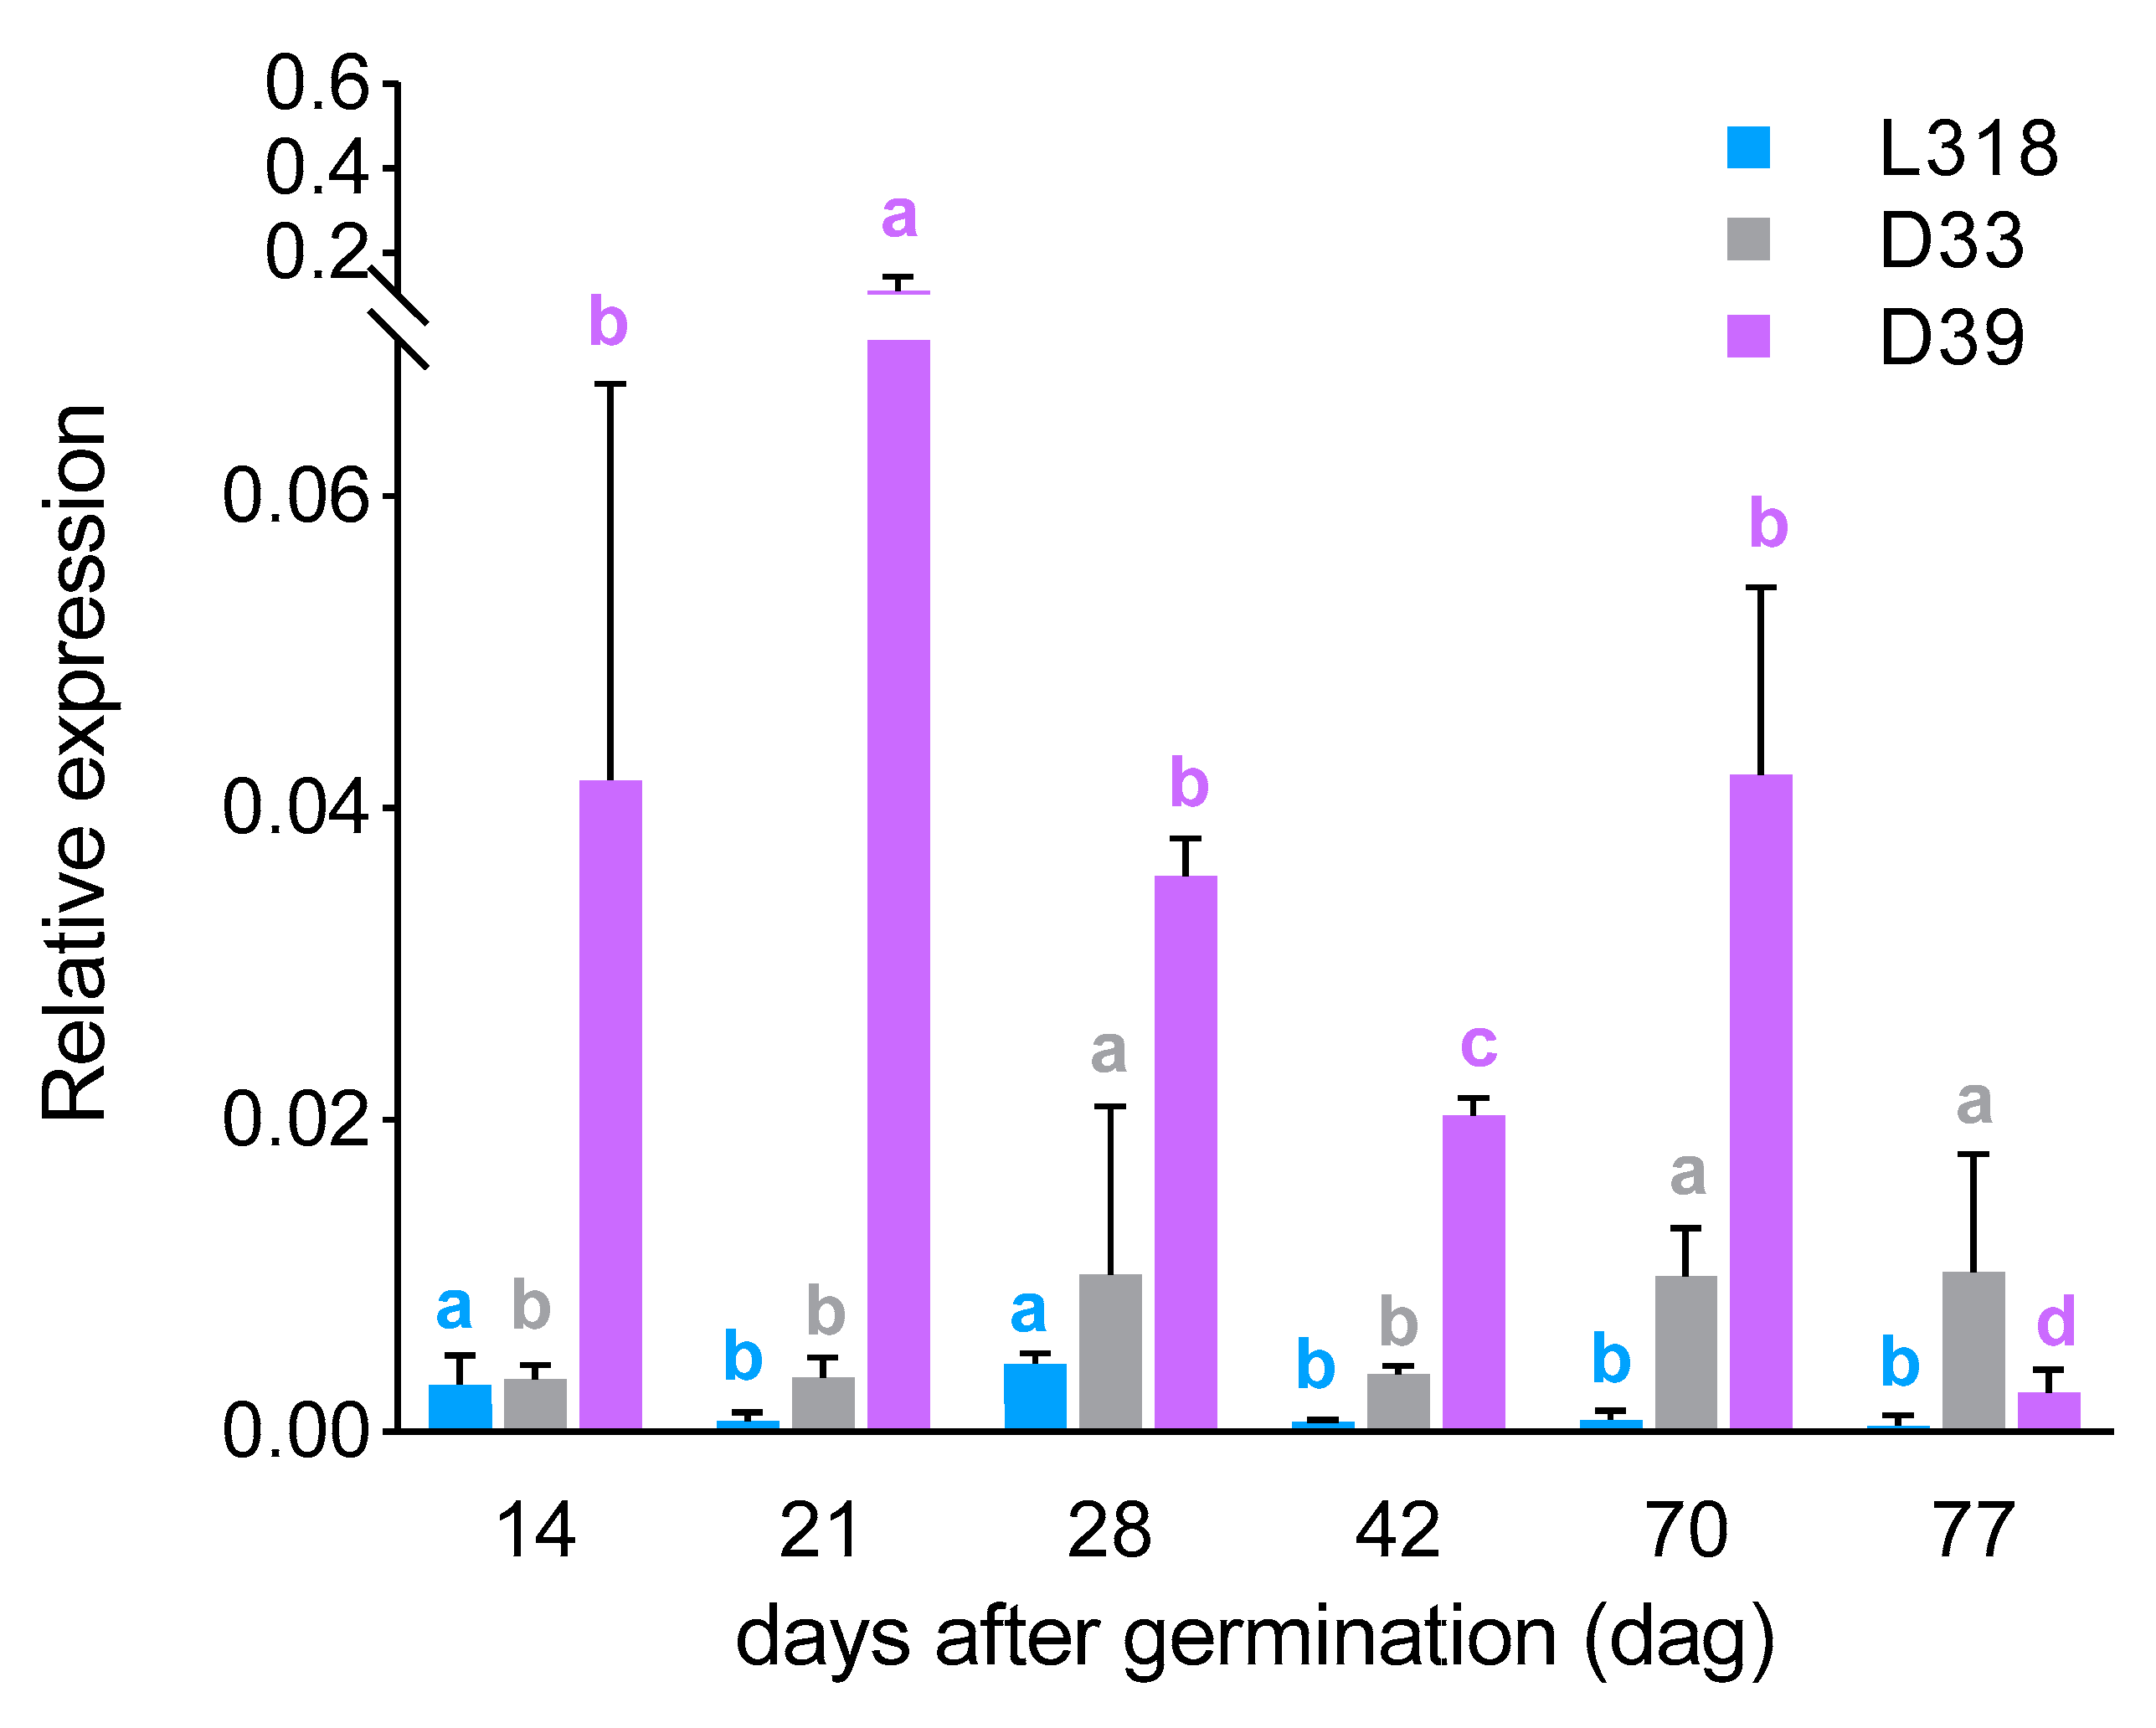
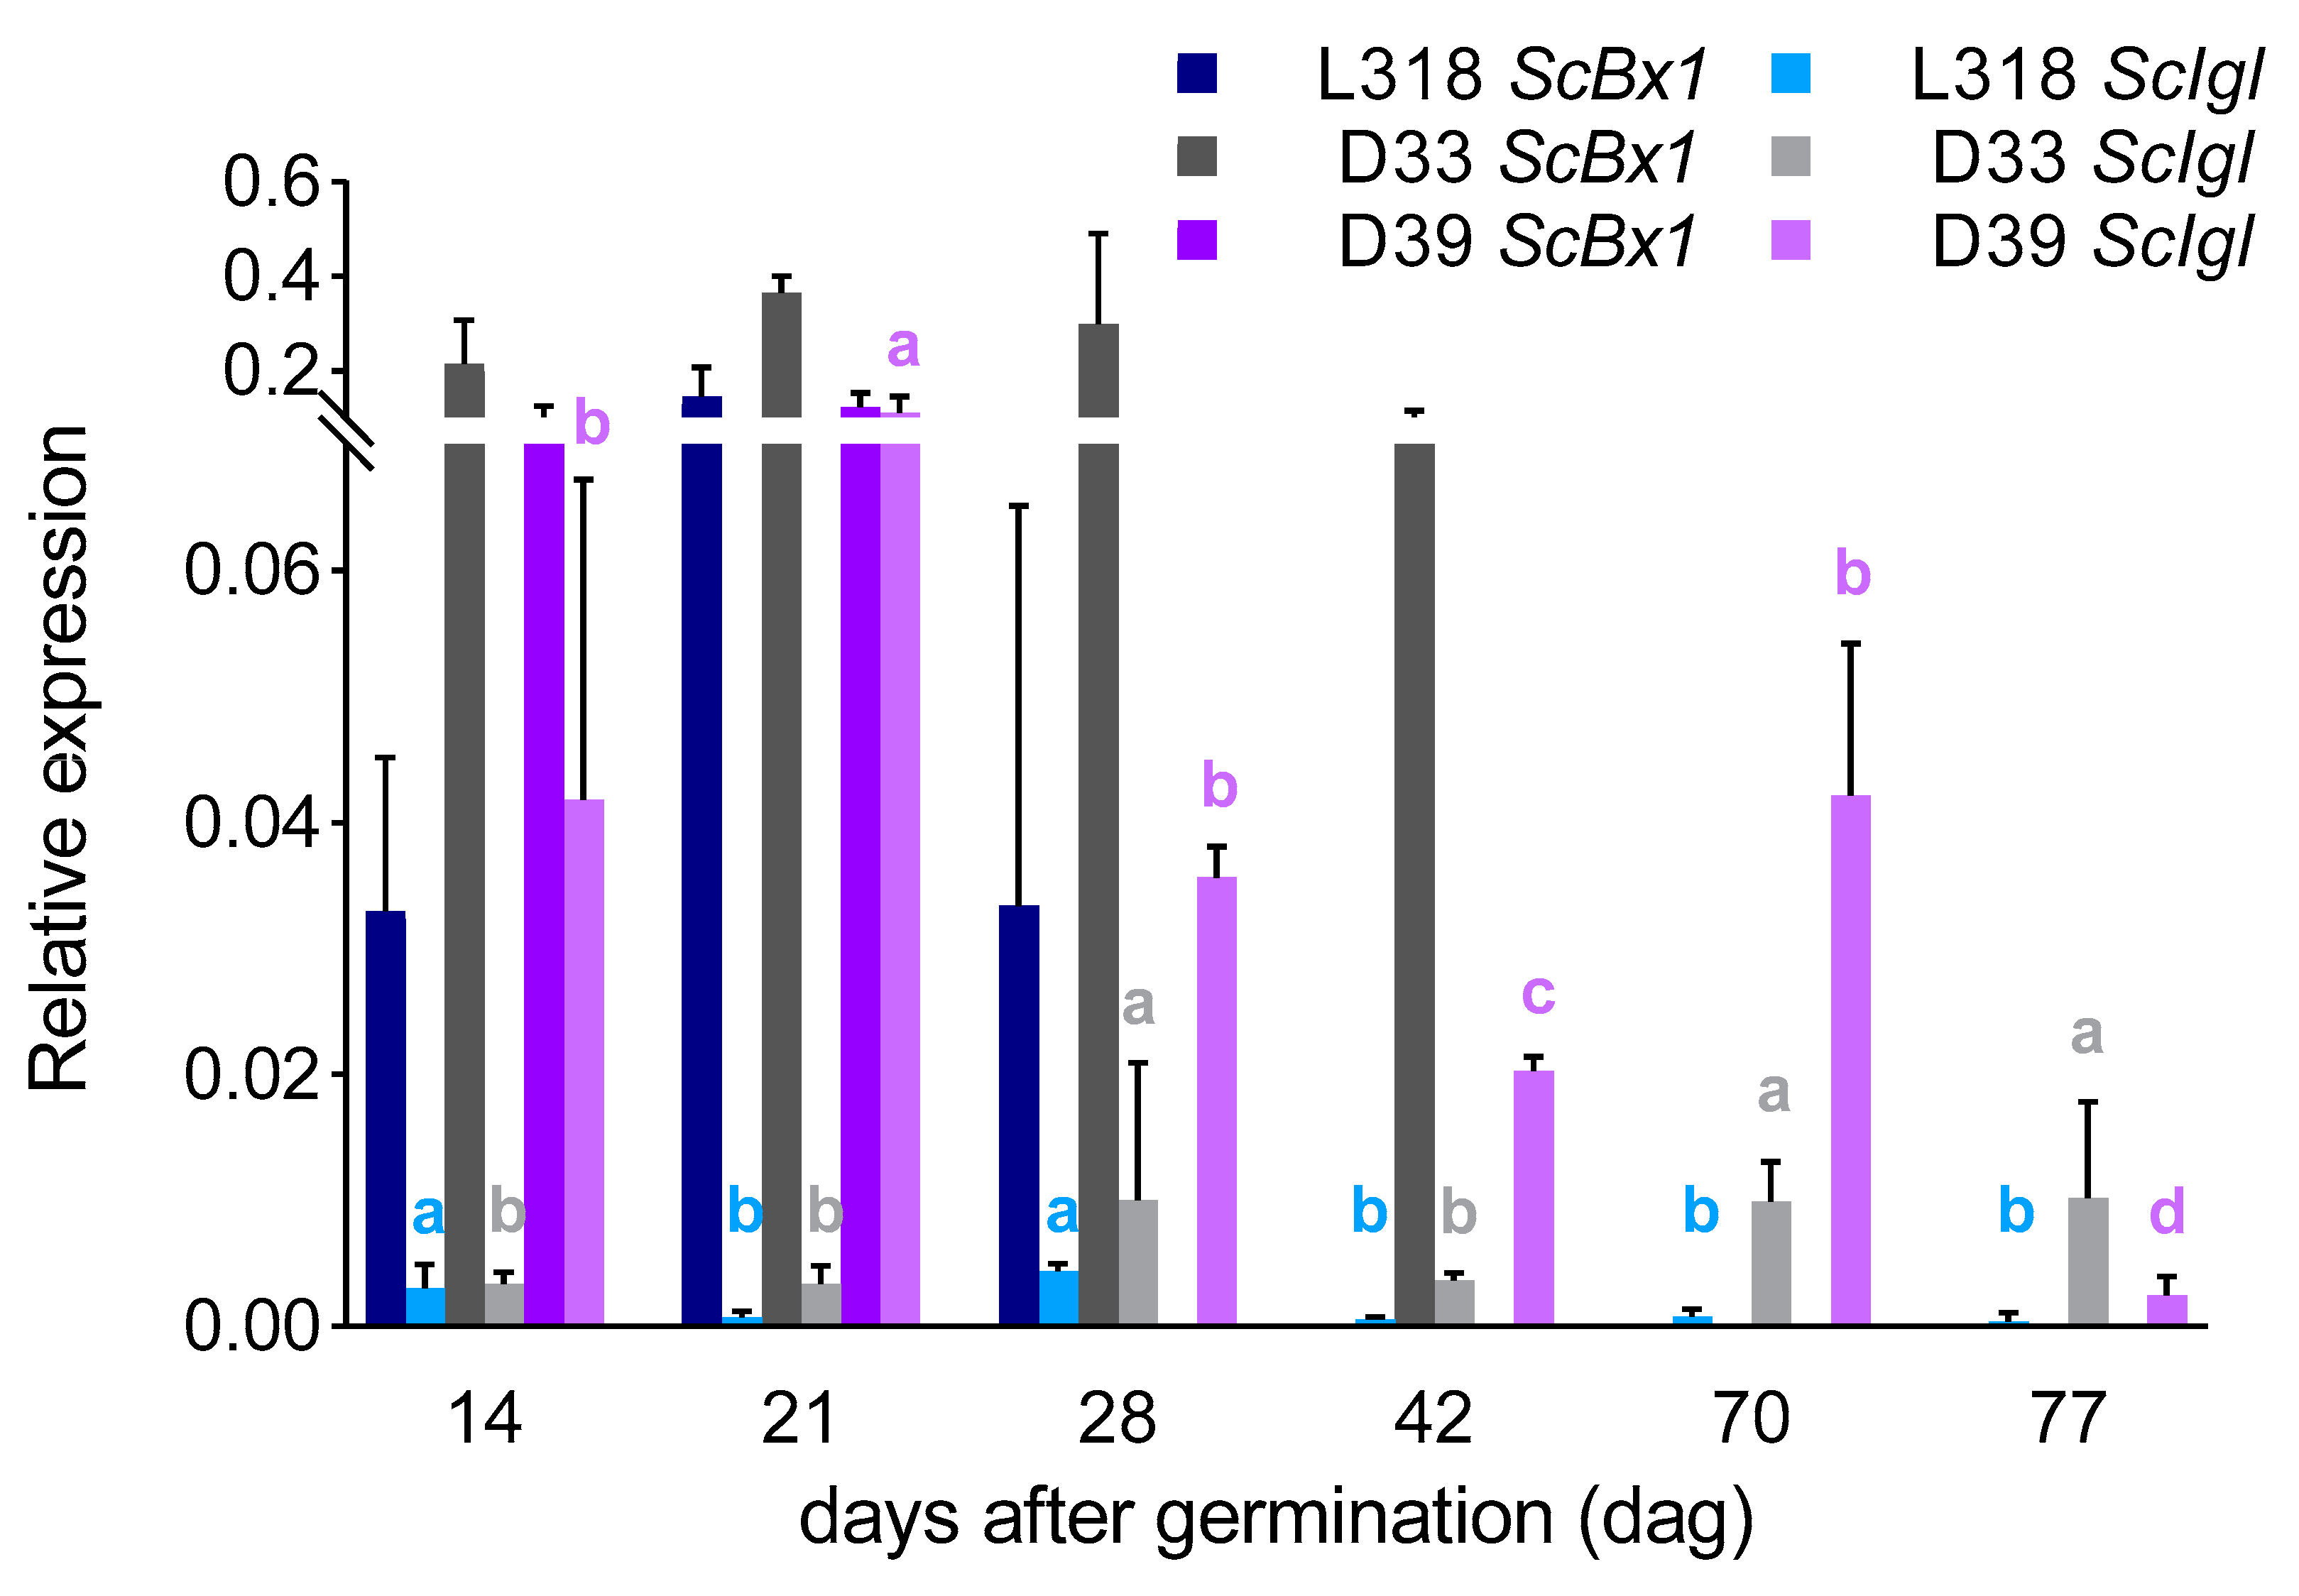
3.1. The Expression Profiles of the ScBx1 and ScIgl Genes
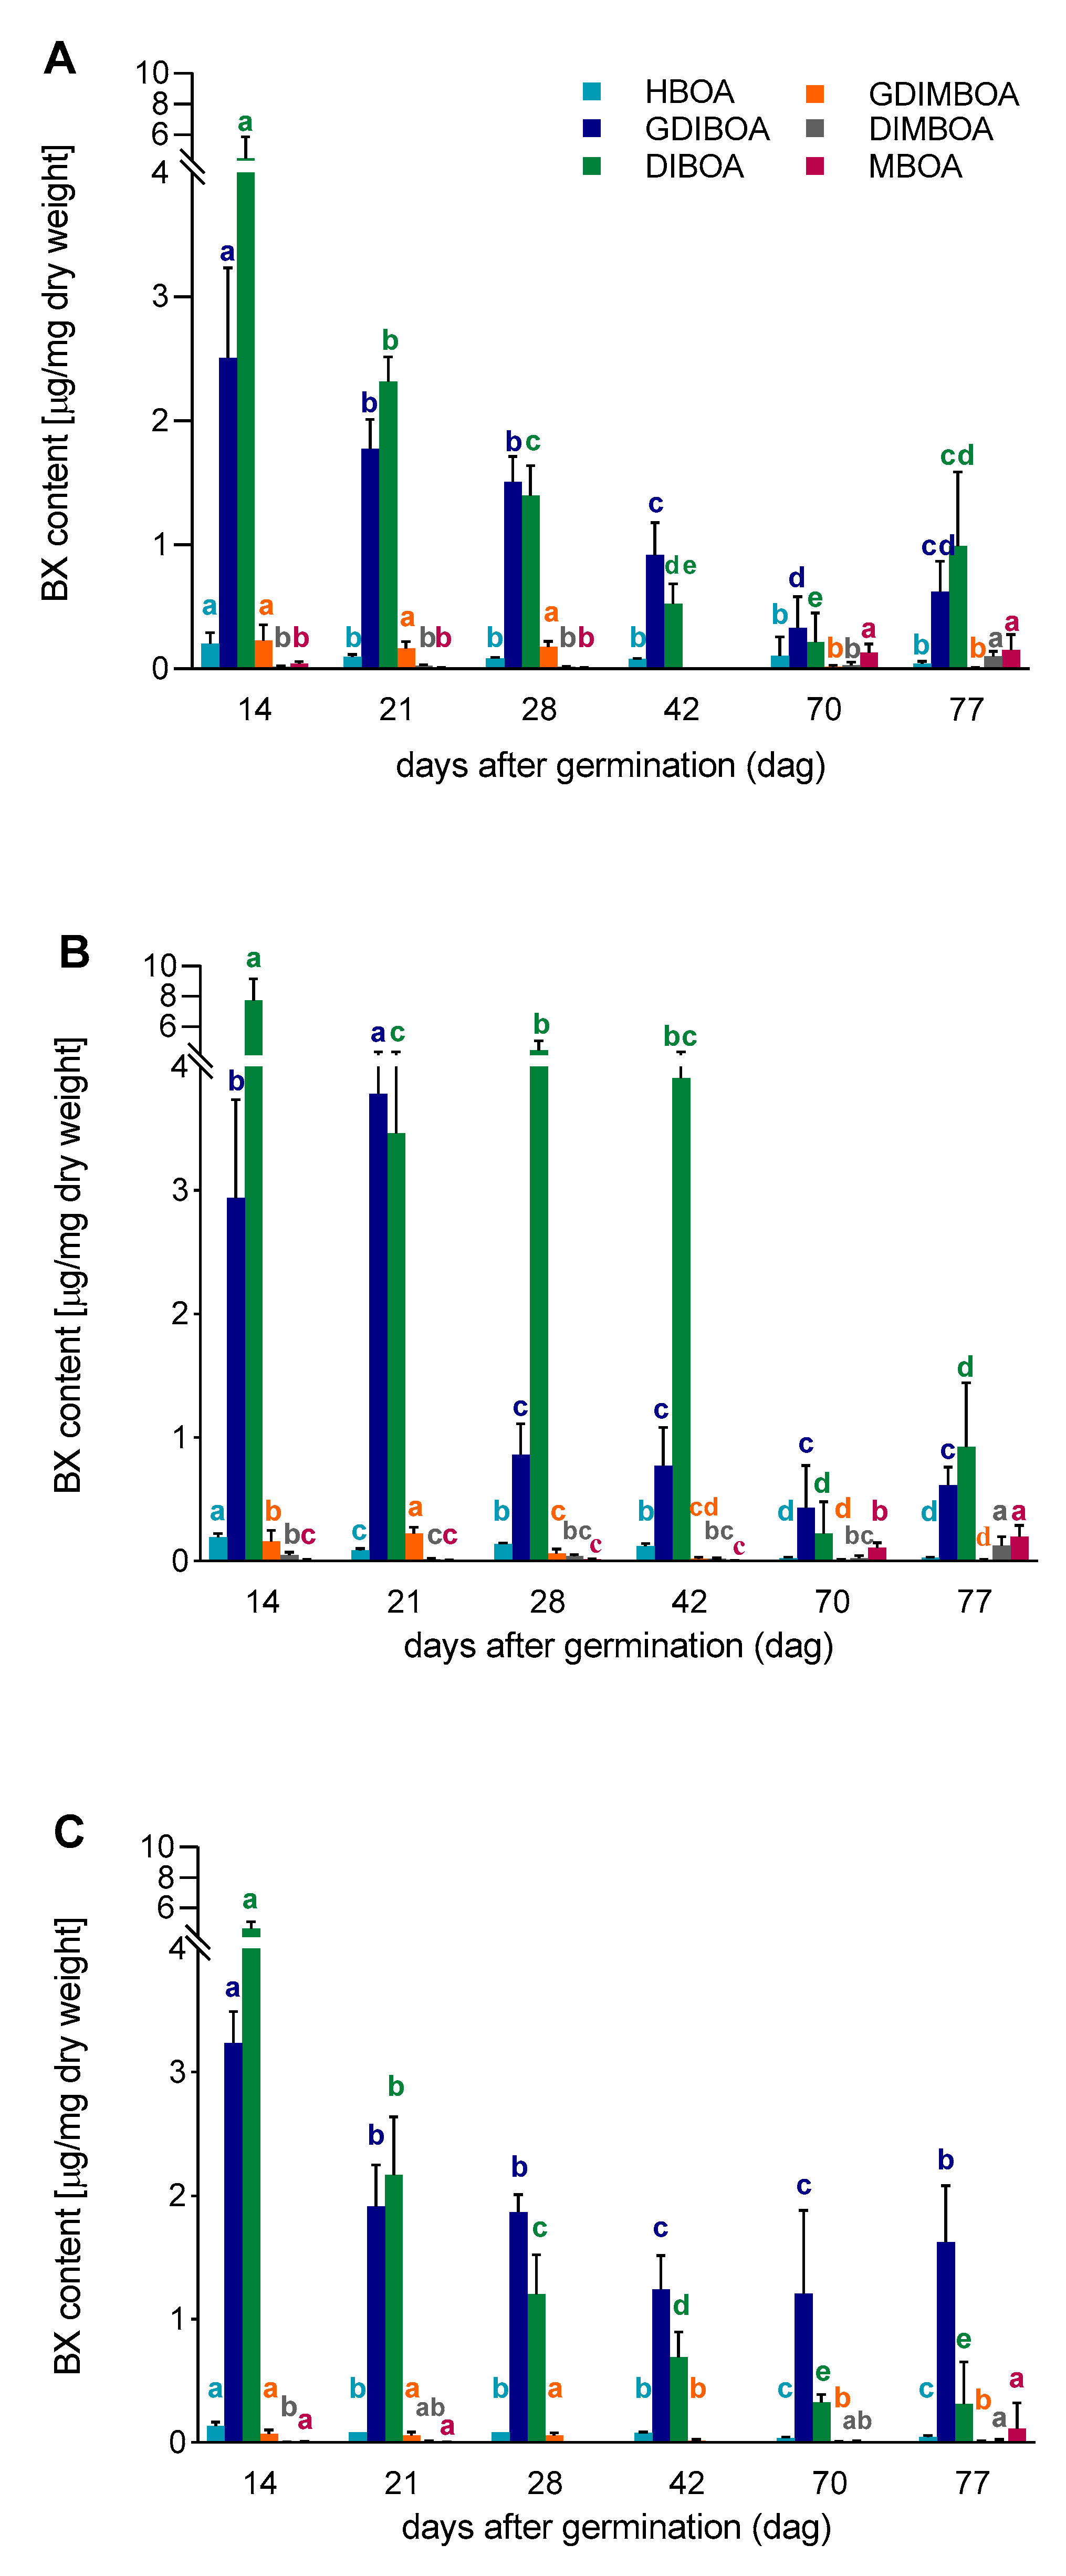
3.2. The Content of BX in Aboveground Parts of Rye Inbred Lines L318, D33, and D39
3.3. Correlations between Gene Expression Level and BX Content
3.4. In Silico and in vivo Characteristics of 1000 nt 5′ Upstream Regulatory Sequences of the Genes ScBx1 and ScIgl
3.4.1. In Silico Promoter Analysis
Stress-Specific Motifs
Growth- and Development-Specific Motifs
3.4.2. In Vivo Promoter Analysis
Stress-Specific (SS) Transcription Factors
Growth- and Development-Specific (GDS) Transcription Factors
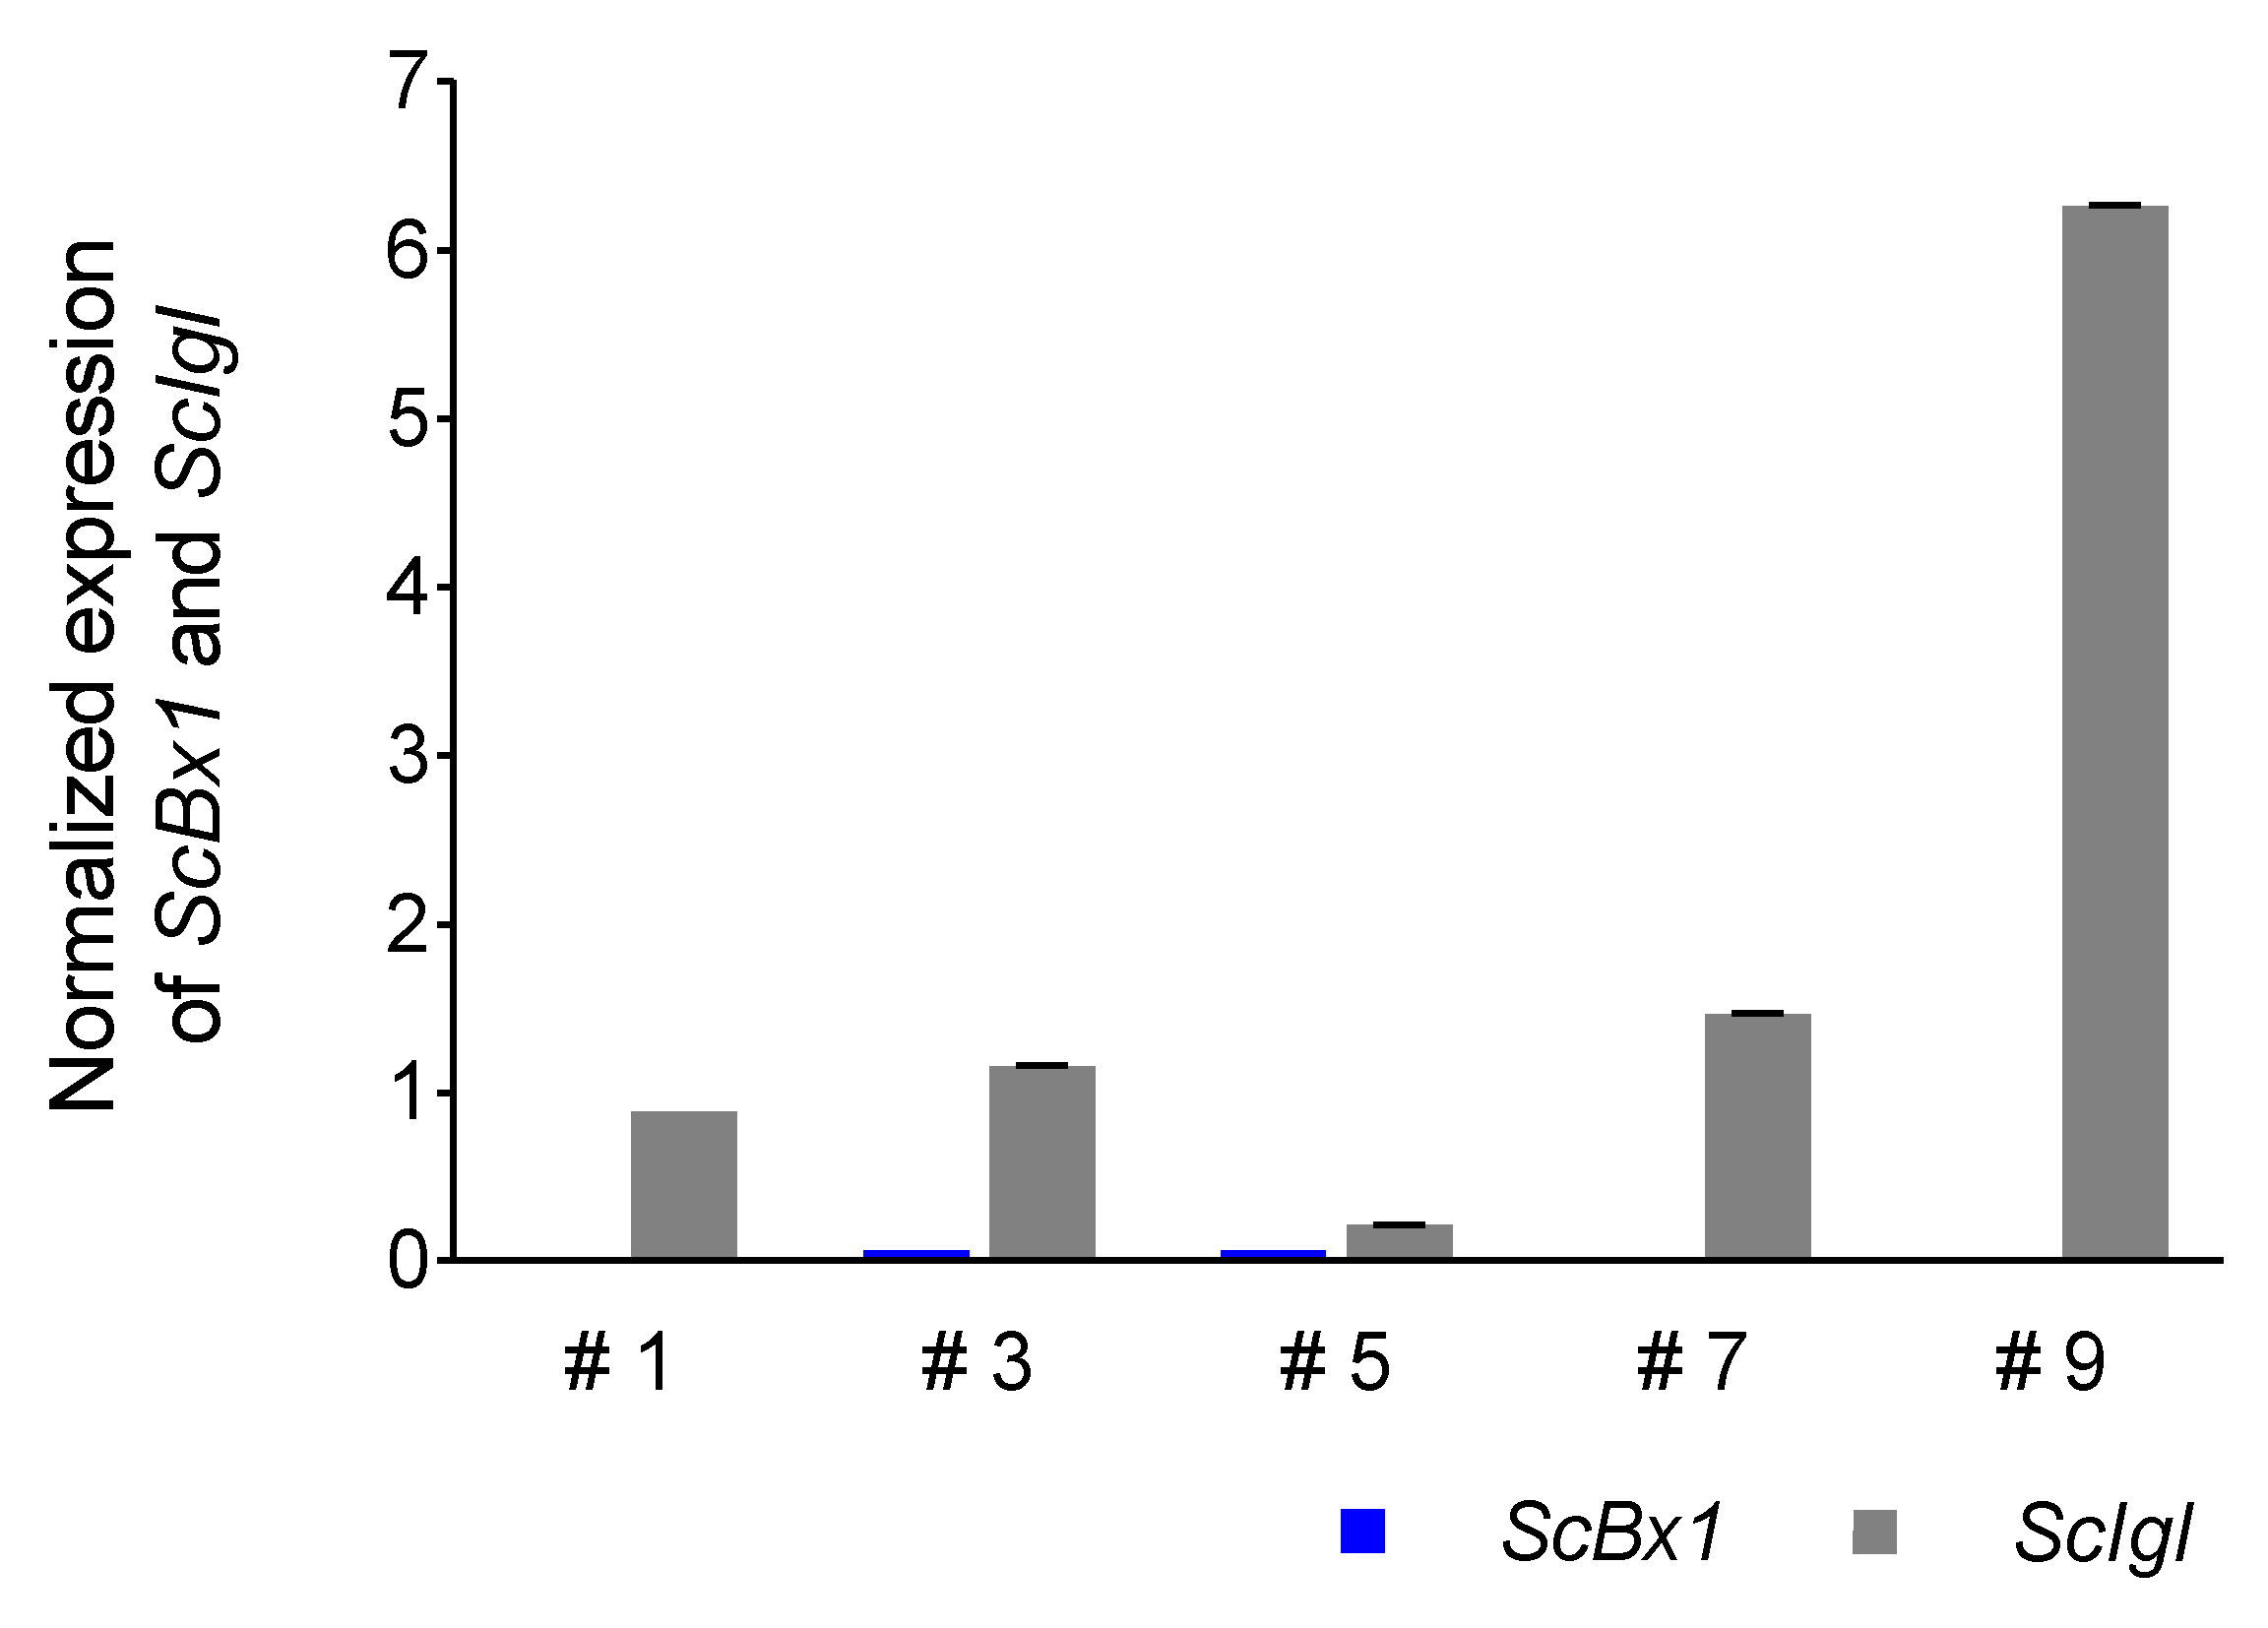
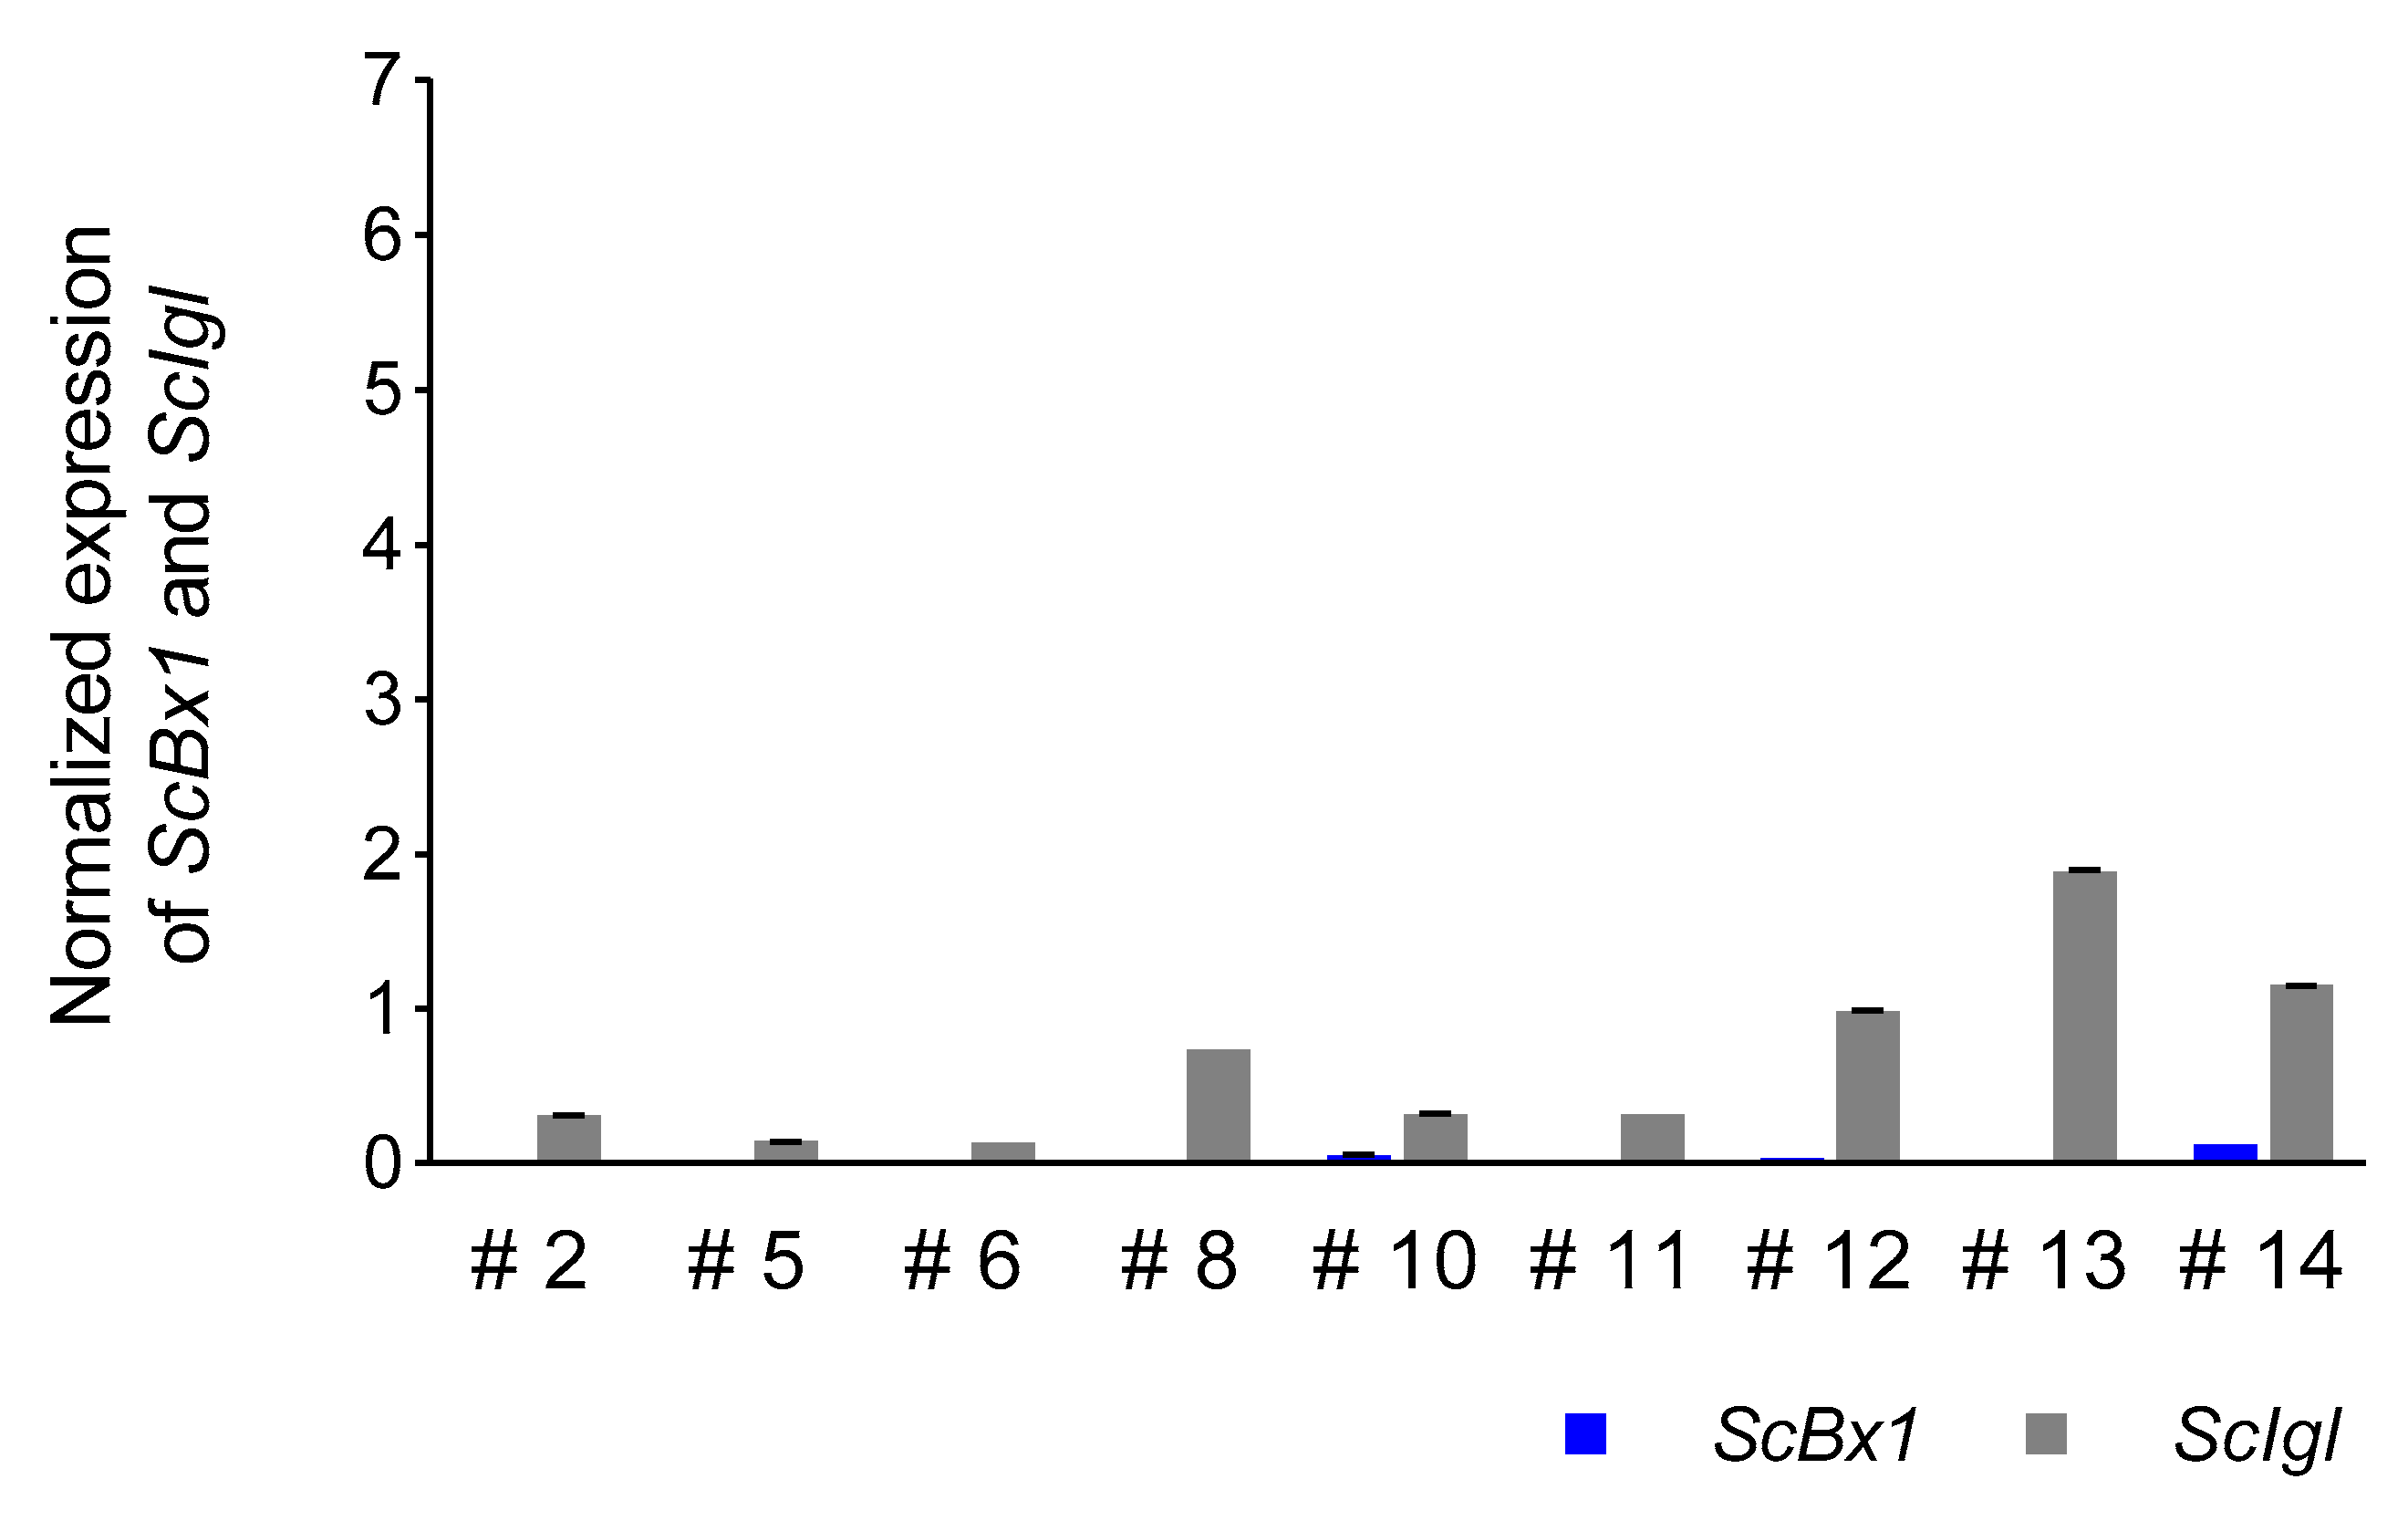
3.5. Expression Profile of the ScIgl Gene in Rye Plants with Virus-Induced Silenced ScBx1 Gene
4. Discussion
4.1. Gene Expression: ScBx1 vs. ScIgl
4.2. Predicted Function of ScBx1 and ScIgl Based on Promoter Analysis
4.3. Whether and How the Expression of ScBx1 and ScIgl Genes Is Related to BX Synthesis
4.4. The Inbred Lines Differed in Respect to Gene Expression Level and Pattern, and BX Content
4.5. ScIgl Is Expressed in Plants with Silenced ScBx1
Supplementary Materials
Author Contributions
Funding
Acknowledgments
Conflicts of Interest
References
- Makowska, B.; Bakera, B.; Rakoczy-Trojanowska, M. The genetic background of benzoxazinoid biosynthesis in cereals. Acta Physiol. Plant. 2015, 37, 176. [Google Scholar] [CrossRef]
- Frey, M.; Schullehner, K.; Dick, R.; Fiesselmann, A.; Gierl, A. Benzoxazinoid biosynthesis, a model for evolution of secondary metabolic pathways in plants. Phytochemistry 2009, 70, 1645–1651. [Google Scholar] [CrossRef] [PubMed]
- Niemeyer, H.M. Hydroxamic acids derived from 2-hydroxy-2H-1,4-benzoxazin-3(4H)-one: Key defense chemicals of cereals. J. Agric. Food Chem. 2009, 57, 1677–1696. [Google Scholar] [CrossRef] [PubMed]
- Meihls, L.N.; Handrick, V.; Glauser, G.; Barbier, H.; Kaur, H.; Haribal, M.M.; Lipka, A.E.; Gershenzon, J.; Buckler, E.S.; Erb, M.; et al. Natural variation in maize aphid resistance is associated with 2, 4-dihydroxy-7-methoxy-1, 4-benzoxazin-3-one glucoside methyltransferase activity. Plant Cell 2013, 25, 2341–2355. [Google Scholar] [CrossRef] [PubMed]
- Handrick, V.; Robert, C.A.M.; Ahern, K.R.; Zhou, S.; Machado, R.A.R.; Maag, D.; Glauser, G.; Fernandez-Penny, F.E.; Chandran, J.N.; Rodgers-Melnik, E.; et al. Biosynthesis of 8-O-methylated benzoxazinoid defence compounds in maize. Plant Cell Online 2016, 28, 1682–1700. [Google Scholar]
- Wouters, F.C.; Blanchett, B.; Gershenzo, J.; Vassão, D.G. Plant defense and herbivore counter-defense: Benzoxazinoids and insect herbivores. Phytochem. Rev. 2016, 15, 1127–1151. [Google Scholar] [CrossRef] [PubMed]
- La Hovary, C. Allelochemicals in Secale Cereale: Biosynthesis and Molecular Biology of Benzoxazinones. 2011. Available online: https://repository.lib.ncsu.edu/bitstream/handle/1840.16/6844/etd.pdf?sequence=2 (accessed on 14 February 2019).
- Rakoczy-Trojanowska, M.; Święcicka, M.; Bakera, B.; Wlazło, A. Genetic and environmental determinants regulating benzoxazinoid biosynthesis in rye (Secale cereale L.)—Facts and myths. In Proceedings of the Integrative Plant Biology Conference, IPG PAS, Poznań, Poland, 7–9 November 2018. [Google Scholar]
- Bakera, B.; Makowska, B.; Groszyk, J.; Niziołek, M.; Orczyk, W.; Bolibok-Brągoszewska, H.; Hromada-Judycka, A.; Rakoczy-Trojanowska, M. Structural characteristics of ScBx genes controlling the biosynthesis of hydroxamic acids in rye (Secale cereale L.). J. Appl. Genet. 2015, 56, 287–298. [Google Scholar] [CrossRef]
- Tanwir, F.; Dionisio, G.; Adhikari, K.B.; Fomsgaard, I.S.; Gregersen, P.L. Biosynthesis and chemical transformation of benzoxazinoids in rye during seed germination and the identification of a rye Bx6-like gene. Phytochemistry 2017, 140, 95–107. [Google Scholar] [CrossRef]
- Sue, M.; Nakamura, C.; Nomura, T. Dispersed benzoxazinone gene cluster: Molecular characterization and chromosomal localization of glucosyltransferase and glucosidase genes in wheat and rye. Plant Physiol. 2011, 157, 985–997. [Google Scholar] [CrossRef]
- Ube, N.; Nishizaka, M.; Ichiyanagi, T.; Ueno, K.; Taketa, S.; Ishihara, A. Evolutionary changes in defensive specialized metabolism in the genus Hordeum. Phytochemistry 2017, 141, 1–10. [Google Scholar] [CrossRef]
- Ahmad, S.; Veyrat, N.; Gordon-Weeks, R. Benzoxazinoid metabolites regulate innate immunity against aphids and fungi in maize. Plant Physiol. 2011, 157, 317–327. [Google Scholar] [CrossRef] [PubMed]
- Groszyk, J.; Kowalczyk, M.; Yanushevska, Y.; Stochmal, A.; Rakoczy-Trojanowska, M.; Orczyk, W. Identification and VIGS-based characterization of Bx1 ortholog in rye (Secale cereale L.). PLoS ONE 2017, 12, e0171506. [Google Scholar] [CrossRef] [PubMed]
- Niculaes, C.; Abramov, A.; Hannemann, L.; Frey, M. Plant protection by benzoxazinoids – recent insights into biosynthesis and function. Agronomy 2018, 8, 143. [Google Scholar] [CrossRef]
- Rakoczy-Trojanowska, M.; Orczyk, W.; Krajewski, P.; Bocianowski, J.; Stochmal, A.; Kowalczyk, M. ScBx gene based association analysis of hydroxamate content in rye (Secale cereale L.). J. Appl. Genet. 2017, 58, 1–9. [Google Scholar] [CrossRef]
- Dmochowska-Boguta, M.; Alaba, S.; Yanushevska, Y.; Piechota, U.; Lasota, E.; Nadolska-Orczyk, A.; Karlowski, W.; Orczyk, W. Pathogen-regulated genes in wheat isogenic lines differing in resistance to brown rust Puccinia triticina. BMC Genom. 2015, 16, 742. [Google Scholar] [CrossRef]
- Lescot, M.; Déhais, P.; Thijs, G.; Marchal, K.; Moreau, Y.; Van de Peer, Y.; Rouzé, P.; Rombauts, S. PlantCARE, a database of plant cis-acting regulatory elements and a portal to tools for in silico analysis of promoter sequences. Nucleic Acids Res. 2002, 30, 325–327. [Google Scholar] [CrossRef]
- Tacheny, A.; Michael, S.; Dieu, M.; Payen, L.; Arnould, T.; Renard, P. Unbiased poteomic analysis of proteins interacting with the HIV-1 5‘LTR sequence: Role of the transcription factor Meis. Nucleic Acids Res. 2012, 40, 168. [Google Scholar] [CrossRef]
- R Core Team. R: A language and environment for statistical computing. Vienna Austria: R Foundation for Statistical Computing. 2019. URL. Available online: https://www.R-project.org/ (accessed on 19 February 2020).
- De Mendiburu, F. Statistical Procedures for Agricultural Research. Version 1.2-8. 2019. Available online: https://CRAN.R-project.org/package=agricolae (accessed on 19 February 2020).
- Frey, M.; Stettner, C.; Pare, P.W.; Schmelz, E.A.; Tumlinson, J.H.; Gierl, A. An herbivore elicitor activates the gene for indole emission in maize. Proc. Natl. Acad. Sci. USA 2000, 19, 14801–14806. [Google Scholar] [CrossRef]
- Kaur, A.; Pati, P.K.; Pati, A.M.; Nagpal, A.K. In-silico analysis of cis-acting regulatory elements of pathogenesis-related proteins of Arabidopsis thaliana and Oryza sativa. PLoS ONE 2017, 12, e0184523. [Google Scholar] [CrossRef]
- Das, A.; Pramanik, K.; Sharma, R.; Gantait, S.; Banerjee, J. In-silico study of biotic and abiotic stress-related transcription factor binding sites in the promoter regions of rice germin-like protein genes. PLoS ONE 2019, 14, e0211887. [Google Scholar] [CrossRef]
- Mahajan, S.; Tuteja, N. Cold, salinity and drought stresses: An overview. Arch. Biochem. Biophys. 2005, 444, 139–158. [Google Scholar] [CrossRef] [PubMed]
- Niyaz, A.D.; Insha, A.; Wasia, W.; Shafiq, A.W.; Asif, B.S.; Shabir, H.W.; Khalid, Z.M. Abscisic acid: A key regulator of abiotic stress tolerance in plants. Plant Gene 2017, 11, 106–111. [Google Scholar]
- Uno, Y.; Furihata, T.; Abe, H.; Yoshida, R.; Shinozaki, K.; Yamaguchi-Shinozaki, K. Arabidopsis basic leucine zipper transcription factor involved in an abscisic acid-dependent signal transduction pathway unde drought and high-salinity conditions. Proc. Natl. Acad. Sci. USA 2000, 97, 11632–11637. [Google Scholar] [CrossRef] [PubMed]
- Choi, H.; Hong, J.; Ha, J.; Kang, J.; Kim, S.Y. ABFs, a family of ABA-responsive element binding factors. JBC 2000, 275, 1723–1730. [Google Scholar] [CrossRef]
- Turner, J.G.; Ellis, C.; Devoto, A. The Jasmonate Signal Pathway. Plant Cell 2002, 14, 153–164. [Google Scholar] [CrossRef]
- De Silva, W.S.I.; Perera, M.M.N.; Perera, K.L.N.S.; Wickramasuriya, A.M.; Jayasekera, G.A.U. In silico analysis of osr40c1 promoter sequence isolated from Indica variety Pokkali. Rice Sci. 2017, 24, 228–234. [Google Scholar] [CrossRef]
- Breen, J.; Bellgard, M. Germin-like proteins (GLPs) in cereal genomes: Gene clustering and dynamic roles in plant defence. Funct. Integr. Genom. 2010, 10, 463. [Google Scholar] [CrossRef]
- Hermann, M.; Maier, F.; Masroor, A.; Hirth, S.; Pfitzner, A.J.; Pfitzner, U.M. The Arabidopsis NIMIN proteins affect NPR1 differentially. Front. Plant Sci. 2013, 12, 88. [Google Scholar]
- Roy, S. Function of MYB domain transcription factors in abiotic stress and epigenetic control of stress response in plant genome. Plant Signal. Behav. 2016, 11, e1117723. [Google Scholar] [CrossRef]
- Dubos, C.; Stracke, R.; Grotewold, E.; Weisshaar, B.; Martin, C.; Lepiniec, L. MYB transcription factors in Arabidopsis. Trends Plant Sci. 2010, 15, 573–581. [Google Scholar] [CrossRef]
- Yin, M.; Wang, Y.; Zhang, L.; Li, J.; Quan, W.; Yang, L.; Wang, Q.; Chan, Z. The Arabidopsis Cys2/His2 zinc finger transcription factor ZAT18 is a positive regulator of plant tolerance to drought stress. J. Exp. Bot. 2017, 68, 2991–3005. [Google Scholar] [PubMed]
- Zeng, D.E.; Hou, P.; Xiao, F.; Liu, Y. Overexpressing a novel RING-H2 finger protein gene, OsRHP1, enhances drought and salt tolerance in rice (Oryza sativa L.). J. Plant Biol. 2014, 57, 357. [Google Scholar] [CrossRef]
- Song, J.; Xing, Y.; Munir, S.; Yu, C.; Song, L.; Li, H.; Wang, T.; Ye, Z. An ATL78-Like RING-H2 Finger Protein Confers Abiotic Stress Tolerance through Interacting with RAV2 and CSN5B in Tomato. Front. Plant Sci. 2016, 29, 1305. [Google Scholar] [CrossRef] [PubMed]
- Shore, P.; Sharrocks, A.D. The MADS-box family of transcription factors. Eur. J. Biochem. 1995, 229, 1–13. [Google Scholar] [CrossRef]
- Farrar, K.; Evans, I.M.; Topping, J.F.; Souter, M.A.; Nielsen, J.E.; Lindsey, K. EXORDIUM—A gene expressed in proliferating cells and with a role in meristem function, identified by promoter tapping in Arabidopsis. Plant. J. 2003, 33, 61–73. [Google Scholar] [CrossRef]
- Coll-Garciaa, D.; Mazuch, J.; Altmann, T.; Müssig, C. EXORDIUM regulates brassinosteroid-responsive genes. FEBS Lett. 2004, 563, 82–86. [Google Scholar] [CrossRef]
- Schröder, F.; Lisso, J.; Müssig, C. Expression pattern and putative function of EXL1 and homologous genes in Arabidopsis. Plant. Signal. Behav. 2012, 7, 22–27. [Google Scholar] [CrossRef]
- Yamaguchi, M.; Ohtani, M.; Mitsuda, N.; Kubo, M.; Ohme-Takagi, M.; Fukuda, H.; Demura, T. VND-INTERACTING2, a NAC domain transcription factor, negatively regulates xylem vessel formation in Arabidopsis. Plant Cell 2010, 22, 1249–1263. [Google Scholar] [CrossRef]
- Rakoczy-Trojanowska, M.; Krajewski, P.; Bocianowski, J.; Schollenberger, M.; Wakuliński, W.; Milczarski, P.; Masojć, P.; Targońska-Karasek, M.; Banaszak, Z.; Banaszak, K.; et al. Identification of single nucleotide polymorphisms associated with brown rust resistance, α-amylase activity and pre-harvest sprouting in rye (Secale cereale L.). Plan Mol. Biol. Rep. 2017, 35, 366–378. [Google Scholar] [CrossRef]


| Gene | Sequences (5′–3′) |
|---|---|
| ScBx1 | F: TCAAAACCTGAACACGTGAAGC |
| R: GCCTCTAGCCTTTTCAATCCTTC | |
| ScIgl | F: AACACCAGCTACACCATCAGAG |
| R: GTGGGTTTACAGTCGCCCTA | |
| HvAct | F: CCCCTTTGAACCCAAAAGCC |
| R: GAAAGCACGGCCTGAATAGC | |
| ScGADPH | F: GAGTCTGCCCACCCATTCGTAA |
| R: GACATGCCATAGGTTTCAGCGAC | |
| Ta54227 | F: CAAATACGCCATCAGGGAGAACATC |
| R: CGCTGCCGAAACCACGAGAC |
| Gene | Sequences (5′–3′) |
|---|---|
| ScBx1 | F: CCGGAATTCCGGAAATTTGCCCGGTCTACGTG |
| R: CGCATACAACCAAACACCAGC | |
| ScIgl | F: CCGGAATTCCGGGCGTCCATCTTCACGTTGAT |
| R: GCTGTGTTGGCAGGTAGTGT |
| Line | Gene | GDIBOA | DIBOA | ||||||||||
|---|---|---|---|---|---|---|---|---|---|---|---|---|---|
| Time Point [dag] | Time Point [dag] | ||||||||||||
| 14 | 21 | 28 | 42 | 70 | 77 | 14 | 21 | 28 | 42 | 70 | 77 | ||
| L318 | ScBx1 | (-) * | (+) | (-) | nd | nd | nd | (+) | (+)* | (-) ** | nd | nd | nd |
| ScIgl | (+) | (+) | (+) | (+) | (+) | (-) | (-) | (-) ** | (+) | (+) | (+) | (+) | |
| D33 | ScBx1 | (+) | (-) | (-) ** | (-) ** | nd | nd | (+) | (-) ** | (-) | (-) | nd | nd |
| ScIgl | (-) | (-) | (+) | (+) ** | (+) | (-) | (-)* | (-) | (+) | (+) | (+) | (-) | |
| D39 | ScBx1 | (-) | (+) ** | nd | nd | nd | nd | (-) | (-) ** | nd | nd | nd | nd |
| ScIgl | (-) ** | (-) | (+) | (-) ** | (+) | (-) | (-) ** | (+) | (+) | (-) | (+) ** | (+) | |
| Promoter of the Gene: | Motif Type | Motif Sequence/No. of a Given Motif | Probable Function | Frequency [No. of SSMs (or GDSM)/100 nt] |
|---|---|---|---|---|
| ScBx1 | SSM | ACGTG/1 | cis-acting element involved in abscisic acid (ABA) responsiveness | 0.1 |
| CCGTTG/1 | MYBHv1 binding site | 0.1 | ||
| TGACG/1 | cis-acting regulatory element involved in MeJA-responsiveness | 0.1 | ||
| Mean | 0.3 | |||
| ScIgl | CACGT/2 | cis-acting element involved in abscisic acid (ABA) responsiveness | 0.5 | |
| ACGTG/1 | ||||
| TGACG/2 | ||||
| CAACTG/1 | MYB binding site involved in drought-inducibility | 0.1 | ||
| TGACG/2 | cis-acting regulatory element involved in MeJA-responsiveness | 0.4 | ||
| ACGAC/1 | ||||
| CGTCA/1 | ||||
| Mean | 1.0 | |||
| ScBx1 | GDSM | GTCGTT/1 | auxin-responsive element | 0.1 |
| Mean | 0.1 | |||
| ScIgl | TATCCA/1 | cis-acting element involved in gibberellin responsiveness | 0.1 | |
| GTCGTT/1 | auxin-responsive element | 0.5 | ||
| AACGAC/2 | ||||
| CGACGA/1 | ||||
| GTCTT/1 | ||||
| Mean | 0.6 | |||
| Promoter of the Gene: | TF Type | Protein Name (Acc. No.) | Function | Frequency [No. of Bound Proteins/100 nt] |
|---|---|---|---|---|
| ScBx1 | ss | germin-like protein (AEN02469.1) | response of plants to biotic (viruses, bacteria, mycorrhizae, fungi, insects, nematodes, and parasitic plants) and abiotic stresses (salt, heat/cold, drought, nutrient, and metal) | |
| NIM1-interacting TFIIH subunit (POO02874.1) | potentiates plant disease resistance and results in enhanced effectiveness of fungicides; key regulator of systemic acquired resistance in plants | |||
| myb-like DNA-binding domain (XP_026398713.1) | regulates various cellular processes, including cell cycle and cell morphogenesis, biotic and abiotic stress responses | |||
| zinc finger protein ZAT1_1 (PWZ38869.1) | plays key roles during plant growth and development, and a number of zinc finger TFs were shown to be involved in plant abiotic and biotic stresses | |||
| 0.82 | ||||
| ScIgl | germin-like protein (AEN02469.1) | response of plants to biotic (viruses, bacteria, mycorrhizae, fungi, insects, nematodes, and parasitic plants) and abiotic stresses (salt, heat/cold, drought, nutrient, and metal) | ||
| 0.15 | ||||
| ScBx1 | gds | RING-H2 finger protein ATL8-like (XP_020242355.1) | an important role in plant adaptation to abiotic stresses | |
| protein EXORDIUM-like 2 (XP_002960721.1) | a component in BR signaling-mediated (BR-promoted) growth; it is hypothesized that EXL1 suppresses brassinosteroid-dependent growth | |||
| agamous-like MADS-box protein (XP_027364274.1) | MADS-box gene family plays an important role in the regulation of plant growth and development and is well known as a key group of transcription factors | |||
| 0.62 | ||||
| ScIgl | RING-H2 finger protein ATL8-like (XP_020242355.1) | an important role in plant adaptation to abiotic stresses | ||
| NAC domain-containing transcription factor (NAC042); ANR02348.1 | acts as a master regulator of xylem vessel differentiation | |||
| zinc finger protein ZAT1_1 (PWZ38869.1) | plays key roles during plant growth and development, and a number of zinc finger TFs were shown to be involved in plant abiotic and biotic stresses | |||
| 0.45 | ||||
| Plant | Dpi | Ratio |
|---|---|---|
| #3 | 14 | 19.3 |
| #5 | 3.5 | |
| #9 | 313 | |
| #6 | 21 | 13 |
| #8 | 37 | |
| #10 | 6.4 | |
| #12 | 32.67 | |
| #14 | 9.58 |
| Time Point [Dag] | IL | ||
|---|---|---|---|
| L318 | D33 | D39 | |
| 14 | ScBx1 | ScBx1 | ScBx1 |
| 21 | ScBx1 | ScBx1 | ScBx1 |
| 28 | ScBx1 | ScBx1 | ScIgl |
| 42 | ScIgl | ScBx1 | ScIgl |
| 70 | ScIgl | ScIgl | ScIgl |
| 77 | ScIgl | ScIgl | ScIgl |
© 2020 by the authors. Licensee MDPI, Basel, Switzerland. This article is an open access article distributed under the terms and conditions of the Creative Commons Attribution (CC BY) license (http://creativecommons.org/licenses/by/4.0/).
Share and Cite
Wlazło, A.; Święcicka, M.; Koter, M.D.; Krępski, T.; Bolibok, L.; Stochmal, A.; Kowalczyk, M.; Rakoczy-Trojanowska, M. Genes ScBx1 and ScIgl—Competitors or Cooperators? Genes 2020, 11, 223. https://doi.org/10.3390/genes11020223
Wlazło A, Święcicka M, Koter MD, Krępski T, Bolibok L, Stochmal A, Kowalczyk M, Rakoczy-Trojanowska M. Genes ScBx1 and ScIgl—Competitors or Cooperators? Genes. 2020; 11(2):223. https://doi.org/10.3390/genes11020223
Chicago/Turabian StyleWlazło, Anna, Magdalena Święcicka, Marek D. Koter, Tomasz Krępski, Leszek Bolibok, Anna Stochmal, Mariusz Kowalczyk, and Monika Rakoczy-Trojanowska. 2020. "Genes ScBx1 and ScIgl—Competitors or Cooperators?" Genes 11, no. 2: 223. https://doi.org/10.3390/genes11020223
APA StyleWlazło, A., Święcicka, M., Koter, M. D., Krępski, T., Bolibok, L., Stochmal, A., Kowalczyk, M., & Rakoczy-Trojanowska, M. (2020). Genes ScBx1 and ScIgl—Competitors or Cooperators? Genes, 11(2), 223. https://doi.org/10.3390/genes11020223