Article

Drosophila Interspecific Hybridization Causes a Deregulation of the piRNA Pathway Genes

by
Víctor Gámez-Visairas
1,†,
Valèria Romero-Soriano
1,2,†,
Joan Martí-Carreras
1,3,
Eila Segarra-Carrillo
1 and
Maria Pilar García Guerreiro
1,*
1
Grup de Genòmica, Bioinformàtica i Biologia Evolutiva, Departament de Genètica i Microbiologia (Edifici C), Universitat Autònoma de Barcelona, 08193 Bellaterra, Spain
2
Institute of Integrative Biology, University of Liverpool, Liverpool L69 7ZB, UK
3
Laboratory of Clinical Virology, Department of Microbiology, Immunology and Transplantation, Rega Institute, KU Leuven, B3000 Leuven, Belgium
*
Author to whom correspondence should be addressed.
Co-first author, these authors contributed equally to this work.
Genes 2020, 11(2), 215; https://doi.org/10.3390/genes11020215
Submission received: 14 January 2020 / Revised: 11 February 2020 / Accepted: 14 February 2020 / Published: 19 February 2020
(This article belongs to the Section Population and Evolutionary Genetics and Genomics)

Abstract

:
Almost all eukaryotes have transposable elements (TEs) against which they have developed defense mechanisms. In the Drosophila germline, the main transposable element (TE) regulation pathway is mediated by specific Piwi-interacting small RNAs (piRNAs). Nonetheless, for unknown reasons, TEs sometimes escape cellular control during interspecific hybridization processes. Because the piRNA pathway genes are involved in piRNA biogenesis and TE control, we sequenced and characterized nine key genes from this pathway in Drosophila buzzatii and Drosophila koepferae species and studied their expression pattern in ovaries of both species and their F1 hybrids. We found that gene structure is, in general, maintained between both species and that two genes—armitage and aubergine—are under positive selection. Three genes—krimper, methyltransferase 2, and zucchini—displayed higher expression values in hybrids than both parental species, while others had RNA levels similar to the parental species with the highest expression. This suggests that the overexpression of some piRNA pathway genes can be a primary response to hybrid stress. Therefore, these results reinforce the hypothesis that TE deregulation may be due to the protein incompatibility caused by the rapid evolution of these genes, leading to a TE silencing failure, rather than to an underexpression of piRNA pathway genes.

1. Introduction

Transposable elements (TEs) are mobile genetic units that are interspersed throughout the genomes of almost all eukaryotes, often occupying significant fractions of the genome of their hosts. Their presence is an important threat to their host’s integrity, as their mobilising ability and repetitive nature makes them powerful endogenous mutators. To diminish their harmful effects, organisms have developed several TE repression strategies, especially in the germline, where new mutations can be transmitted to the next generations [1,2]. In the animal germline, the Piwi-interacting small RNA (piRNA) pathway acts by silencing TEs transcriptionally and post-transcriptionally through sequence homology between piRNAs and TEs [3,4,5]. piRNA biogenesis starts when long piRNA precursors are transcribed from specific genomic piRNA clusters and cleaved to produce primary piRNAs [4]. Those primary piRNAs can then be loaded into an amplification loop called the ping-pong cycle to give rise to secondary piRNAs [4,6]. Finally, transcript remnants of piRNA clusters used during secondary piRNA biogenesis are cleaved to yield new primary RNAs loaded by Piwi, which provide diversification of piRNA production [7,8]. In somatic tissues, another small-RNA mediated silencing strategy is involved in TE post-transcriptional silencing: The endogenous small interference RNA (endo-siRNA) pathway [9].
Although TEs are subject to a tight multiple-layer regulation, these strong TE repression mechanisms are sometimes overtaken under different stress conditions [10,11]. For instance, the genomic stress caused by the merge of two different genomes during interspecific hybridization can lead to the activation of endogenous TEs. TE proliferation in hybrids between species has been reported both in animals [12,13,14,15] and plants [16,17], and has been associated with a deregulation of TE expression.
The causes of TE bursts in Drosophila interspecific hybrids are still a controversial issue where different factors such as differences between maternal piRNA pools and genetic divergence between the two parental piRNA pathways come into play. Indeed, piRNA pathway genes are known to carry adaptive evolution marks [18,19] leading to cross-species incompatibilities, as observed for the piRNA pathway protein Rhino in hybrids between Drosophila melanogaster and Drosophila simulans [20]. This rapid evolution of the piRNA pathway genes was also suggested to explain their strong differences in expression between different populations of D. simulans [21].
Previous work in our laboratory showed that new TE insertions occur in hybrids between the species Drosophila buzzatii and Drosophila koepferae (buzzatii complex, repleta group) [15,22,23], which is likely at the origin of a genome expansion in hybrid females [24]. These TE bursts have been associated with abnormal TE expression patterns, first of the retrotransposons Osvaldo and Helena [25,26] and then in a global transcriptomic study including the whole-genome TEs [27]. Importantly, these studies proved that (i) more TE families are misregulated in F1 ovaries than in the subsequent generations of backcrossed hybrids [27], (ii) TE expression is heterogeneous between hybrid samples from different interspecific crosses [25], and (iii) there are differences in transposition rates even between hybrids of the same cross [22].
The above results could be explained by a decrease of piRNA amounts in hybrids, but our recent results showed that piRNA amounts in hybrids resemble those of the parental species with higher production [27]. This trend towards high piRNA production in hybrids suggests that the piRNA pathway might be more efficient in hybrids, which could be explained by an increase in piRNA pathway genes expression. To validate this hypothesis, we focused our study on nine piRNA pathway genes that had not been previously described in our model species. Their characterization showed that two of them, armitage and aubergine, are under positive selection. We then studied their expression in ovarian samples from individual flies, which allowed us to avoid the masking effects resulting from pooling females with different expression rates. We used qRT-PCR to evaluate the expression levels of these nine genes in F1 hybrid ovaries and localized their transcripts at a cellular level using fluorescent in situ hybridization (FISH). Our results revealed that some of the piRNA pathway genes were deregulated in the gonads of our Drosophila hybrids. This expression deregulation together with protein incompatibility—due to the rapid evolution of these genes—is likely to be related to the TE silencing failure in cross-species hybrids observed in previous studies [22,23].

2. Materials and Methods

2.1. Drosophila Stocks and Crosses

A total of four interspecific crosses (biological replicates A1, A2, B1, and B2) were performed by mating 50 D. buzzatii males with 50 D. koepferae virgin females of the same age (3 days-old) in order to obtain F1 individuals (the reciprocal cross is unsuccessful [28]). Two biological replicates, corresponding to two crosses, were analyzed for each gene: Crosses A1 and B1 were used for qRT-PCR analyses of genes armi, aub, krimper, piwi, and zuc; and crosses A2 and B2 for genes ago3, mt2, rhino, and spnE. For simplicity, they are listed as crosses A and B in the manuscript. The parental stocks used were the D. buzzatii Bu28 strain—an inbred line originated by the union of different populations collected in 1982 in Los Negros, Bolivia—and the D. koepferae Ko2 strain—an inbred line originated from a population collected in 1979 in San Luis, Argentina. Both stocks were maintained by brother–sister mating for more than a decade and are now kept by mass culturing. All stocks and crosses were reared at 25 °C in a standard Drosophila medium supplemented with yeast.

2.2. Sequencing of piRNA Pathway Genes in D. buzzatii and D. koepferae

Protein sequences from D. mojavensis, D. virilis, and/or D. melanogaster associated with the nine targeted genes (Table 1) were downloaded from the Flybase database [29] and aligned to the D. buzzatii genome [30] using BLAST’s tblastn. We retrieved the best alignment hit for each gene and its D. buzzatii genome location was used for primer design (see Supplementary file 1A). Because no reference genome was available for D. koepferae, some primers did not amplify, therefore some of the genes—aub, krimper, piwi, and rhino—lack small fragments at their 5′ and/or 3′ ends. All nucleotide sequences were deposited in GenBank under the accession numbers from MN901612 to MN901629.
We carried out all PCR reactions in an MJ Research Inc. thermal cycler using the following program: 5 min at 94 °C; 30 cycles of 45 s at 94 °C, 45 s at specific annealing temperature (see Supplementary file 1A for primer sequences), 90 s at 72 °C; and 10 min at 72 °C. A final volume of 50 μL was used, with 1× High Yield Reaction Buffer with Mg2+ (Kapa Biosystems), 0.2 mM of each dNTP (Roche), 0.4 μM of each primer (Sigma-Aldrich), template DNA (10–20 ng) and 0.04 U/μL of Taq polymerase (KapaTaq from Kapa Biosystems). SpnE and aub genes were amplified using Roche’s Expand Long Template PCR system (for both parental species). Amplicons were purified with the Nucleospin Gel and PCR Clean-Up kit (Macherey-Nagel), and cloned with the pGEM-T Easy Vector System I (Promega).

2.3. Sequence Analysis

Sequencing of PCR cloned products was performed by Macrogen Inc. (Seoul, Korea) service. Multiple sequence alignment was carried out with MAFFT [31]. For transcript prediction and consensus protein domain motifs finding, ORF Finder (https://www.ncbi.nlm.nih.gov/orffinder/) and Conserved Domain Search [32] tools were used respectively. The Augustus sofware [33] was used for gene structure prediction in silico. Those predicted genes were compared to existing annotations in D. mojavensis and D. melanogaster species (data obtained from FlyBase database: http.//www.flybase.org, January 2019). TE intron insertions were detected using Repeat Masker software [34] in the species under study and D. mojavensis (see Supplementary file 3C). To test signatures of selection we performed McDonald and Kreitman test (MK) using DnaSP v6 software [35]. The intraspecific polymorphism was computed by aligning the piRNA pathway genes from the D. buzzatii line considered in this study, to those of the previous sequenced D. buzzatii genome [30] and then compared to D. koepferae sequences.

2.4. Quantification of Gene Transcripts by qRT-PCR

Ovaries of 5- or 6-day-old flies (from parental species or F1 hybrids) were dissected in PBT (1× phosphate-buffered saline [PBS], 0.2% Tween 20). Total RNA was purified individually for each fly’s pair of ovaries with the Nucleospin RNA purification kit (Macherey-Nagel). cDNA synthesis was carried out with anchored-oligo(dT)18 primers using Roche’s Transcriptor First Strand cDNA Synthesis Kit. Transcript abundance was estimated by fluorescence intensity using Biorad’s iQ SYBR Green Supermix on a CFX96 BioRad Real-Time lightcycler. We performed relative quantification using the ribosomal rp49 housekeeping gene as endogenous control, with at least two technical replicates per sample. This control gene showed to be equally expressed in D.buzzatii and D. koepferae ovaries in a previous work using the same primers and stocks [25].
For each gene we used the same primer set in both species (Supplementary file 1B), designed in a conserved region and tested to have similar efficiencies in D. buzzatii and D. koepferae (Supplementary file 2A). Thus, expression rates were calculated using the comparative Ct method [36] as in [25] (supplementary file 2B). For each gene, we analyzed five sample groups: 2 maternal D. koepferae groups (crosses A and B), 2 F1 hybrid groups (female offspring from crosses A or B) and one D. buzzatii group (females of the stock, not involved in the cross).

2.5. Fluorescent In Situ Hybridization in Ovaries

Ovaries of 3-days old flies (which is the ideal age for optimal visualization of the different cells from ovaries) were dissected in PBT, following the protocol described in [37]. Antisense RNA probes for the 9 genes (see Supplementary file 4 for probes details) of the piRNA pathway, including T7 and SP6 promoter sites, were labeled by in vitro transcription of SP6/T7 using the DIG RNA Labeling Kit (Roche) and used to detect gene expression in ovaries. Hybridization signal was detected using the anti-DIG POD antibody (Roche) and fluorescence amplification (TSA PLUS Cyanine3 kit, PerkinElmer), and visualized with an Olympus Fluoview 1000 confocal scanning laser microscope.

2.6. Statistical Methods

We used IBM SPSS 22 software for statistical analyses. As the assumptions of Gaussian distribution and equal variances are not valid in qRT-PCR experiments with small sample sizes, we used the non-parametric Wilcoxon rank sum test (or Mann–Whitney test [38]) to compare expression rates between hybrids and parental species. Kruskal–Wallis test [39] was used to determine whether differences between all groups were significant. All multiple test corrections were achieved using a False Discovery Rate (FDR) threshold of 5% based on the method of Benjamini-Hochberg [40]. Additionally, Levene’s test for equality of variances, was used to assess changes in variance between groups.

3. Results

3.1. piRNA Pathway Gene Characterization in D. buzzatii and D. koepferae

In order to perform gene characterization and expression analyses we sequenced nine piRNA pathway genes in our parental species, D. buzzatii and D. koepferae. These genes have never been characterized in these species before—they are not annotated in the available D. buzzatii genome sequence [30], and no genome sequence has been released to date for D. koepferae. Our multiple sequence alignments (MSA) show that ago3 is the most conserved gene between both species with 95.6% of nucleotide identity in the coding sequence and rhino is the most divergent with 78% of identity (Table 1). We observe that although amino acid similarities between parental species highly differ between genes (ranging from 69% for rhino to 95.6% for piwi), gene structure is generally conserved. Indeed, the number of exons is exactly the same between D. buzzatii and D. koepferae, and does not change when compared to their closest sequenced relative, D. mojavensis (Supplementary file 3A), or even to the more distant species D. melanogaster (Supplementary file 3B).
In the case of ago3, the first intron is seven times larger in D. koepferae (2275 bp) than in D. buzzatii (321bp), likely due to transposition events. In fact, fragmented TE sequences represent 42% of the D. koepferae first intron length (including both retrotransposons and DNA transposons, see Supplementary file 3C). Even though the same intron in D. buzzatii does not carry any TE sequence, these are also present in the orthologous sequence of D. mojavensis, the closest species with a sequenced genome. Interestingly, this gene sequence is the most conserved between our parental species (Table 1).
We performed the McDonald and Kreitman (MK) test [41] to test for putative selection marks in the nine studied genes (Table 2). The proportion of adaptive substitutions (α) is higher than 0 for all genes, indicating that they are likely under selective pressure, although only armi and the region corresponding to the PAZ domain of aub yield significant results.

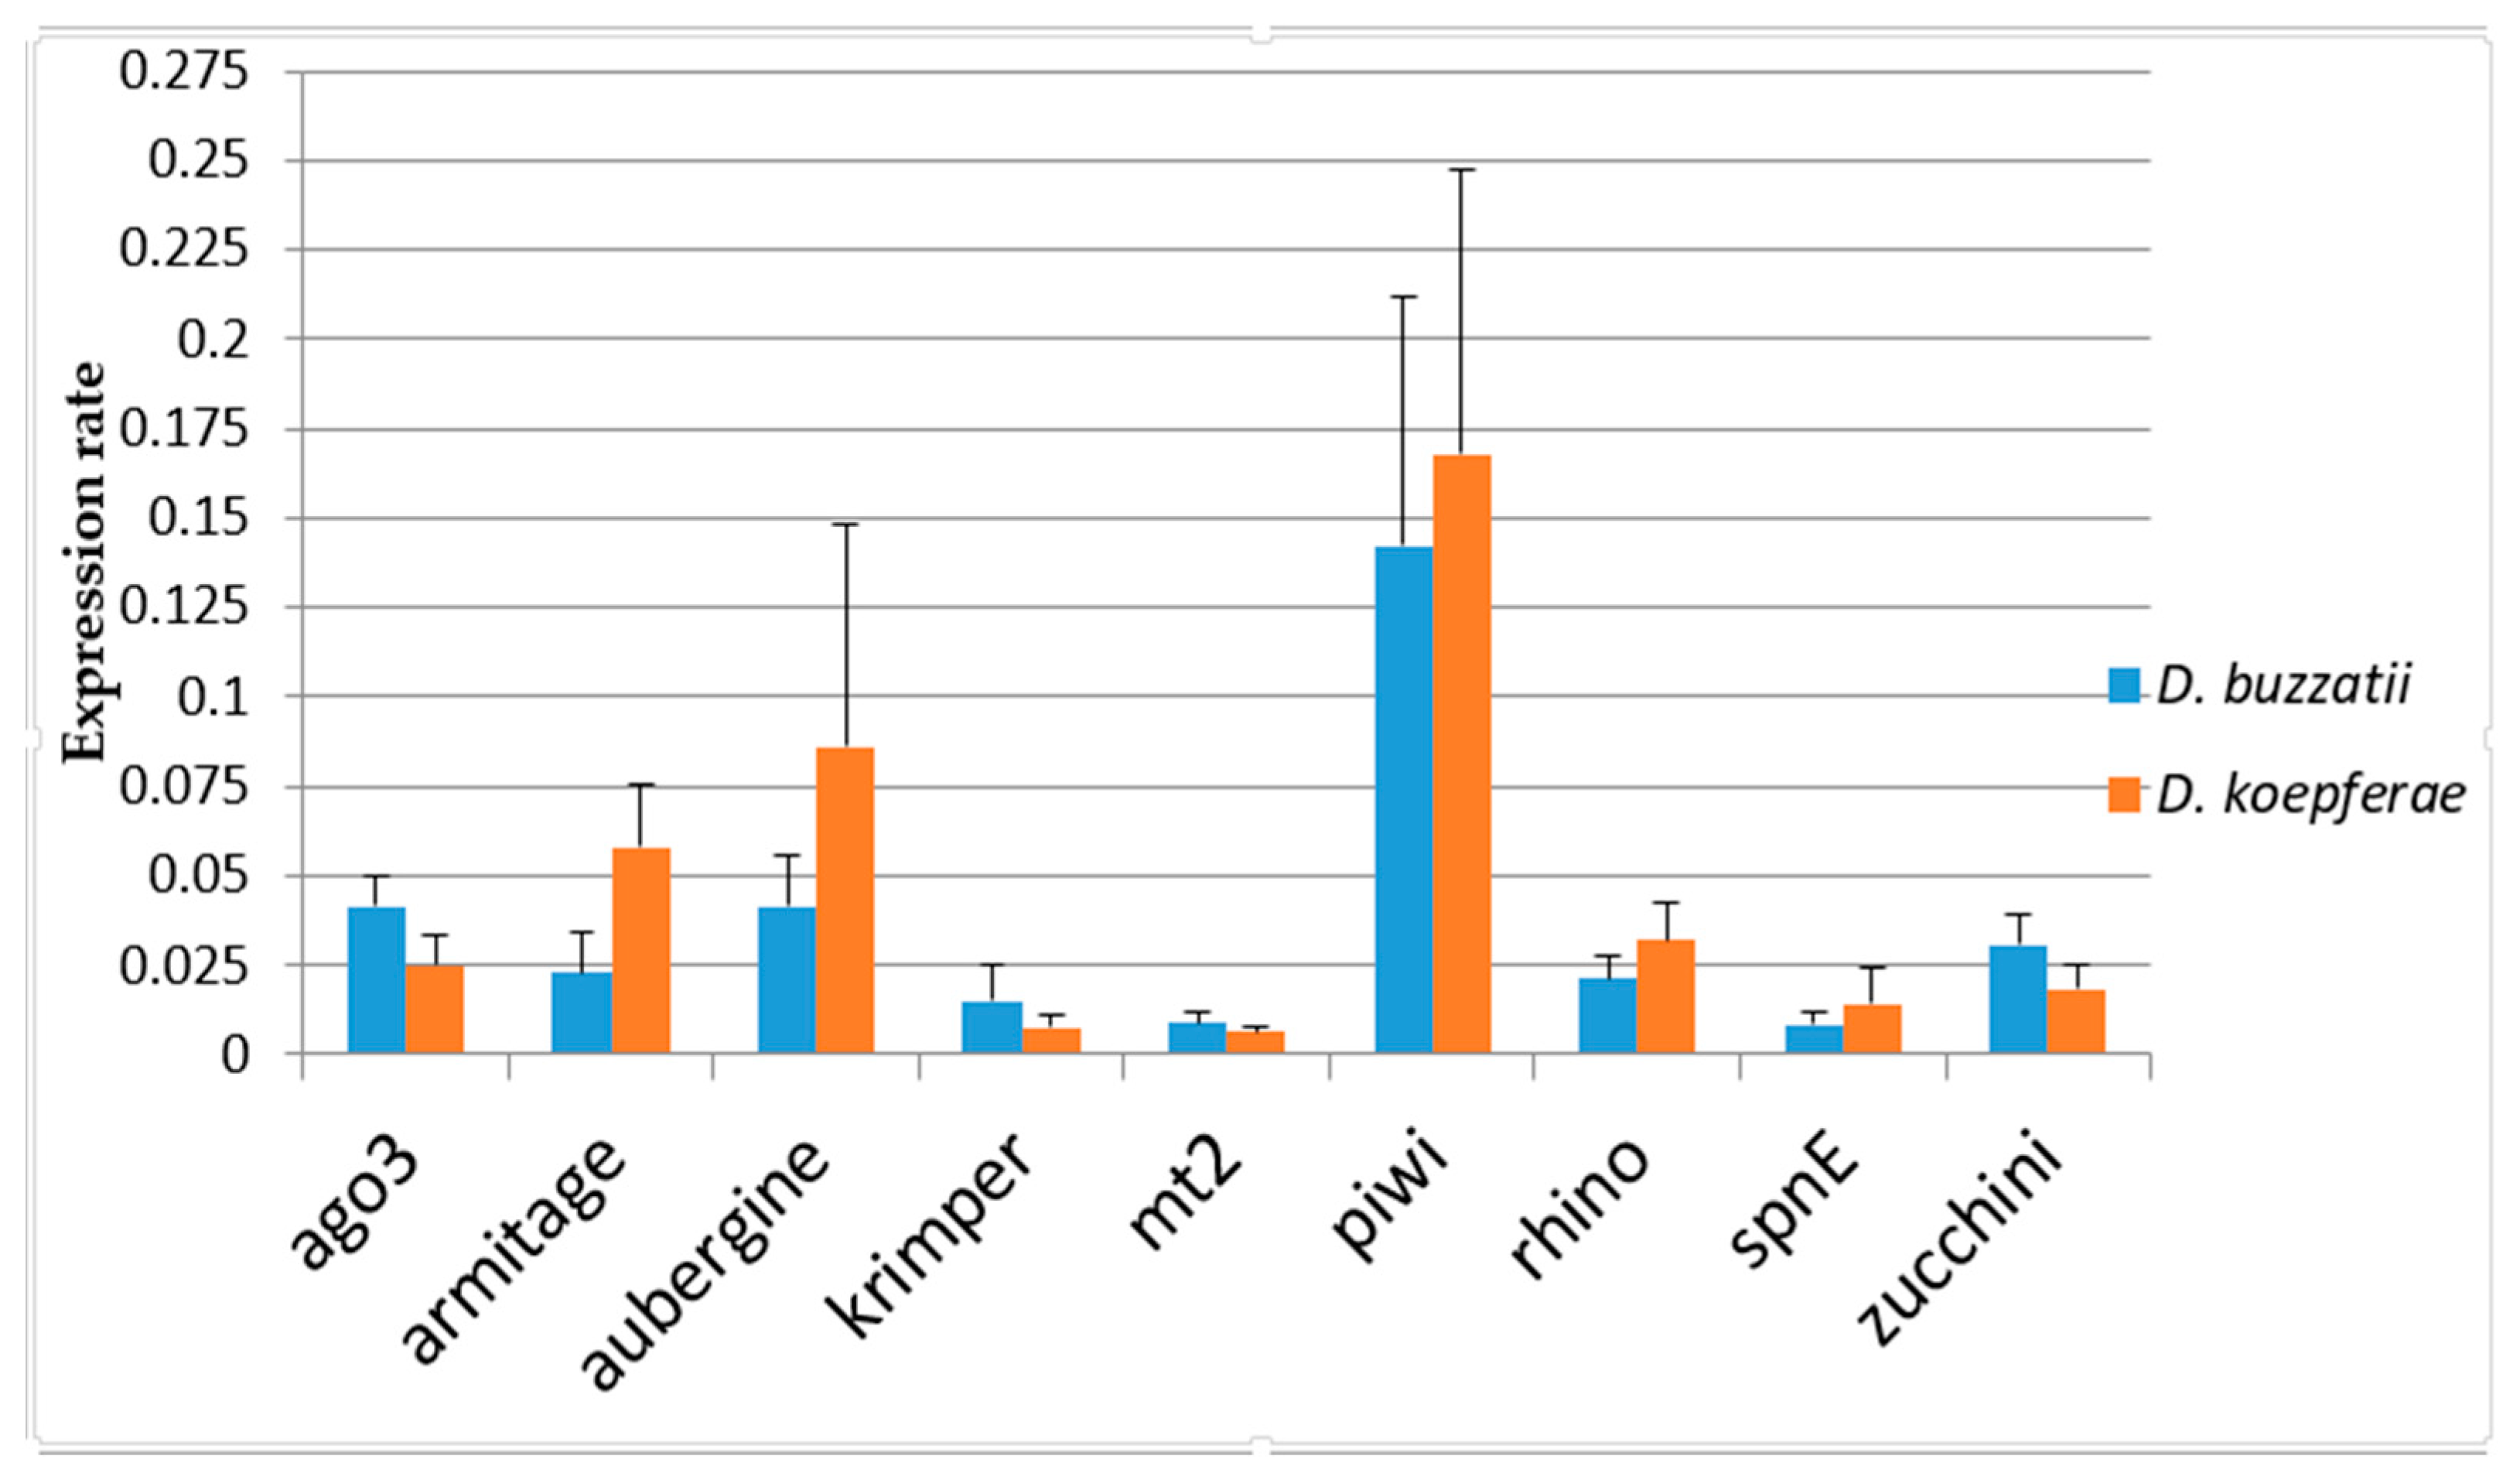
3.2. Gene Expression in Parental Species

Gene expression in parental species ovaries was studied in individual flies using a single pair of ovaries per sample. mRNAs were quantified by quantitative real time PCR (qRT-PCR) using the comparative CT method [36]. In order to achieve higher statistical power, five groups were used for measuring and comparing gene expression: One parental D. buzzatii group (Dbu, not involved in the cross), two D. koepferae maternal groups (DkoA and DkoB), used subsequently to obtain the two respective hybrid offspring groups (HybA and HybB).
Expression differences between parental species (Figure 1 and Table 3) are statistically significant for all the studied genes except for piwi (p = 0.428). Aub shows the largest ER difference between parental species (2.24-fold difference, ERDbu = 4.12 × 10⁻², ERDko = 8.62 × 10⁻²). However, these differences do not follow a single trend, since some genes are more expressed in D. koepferae (armi, aub, piwi, and snpE) while others are more expressed in D. buzzatii (ago3, krimp, and zuc).

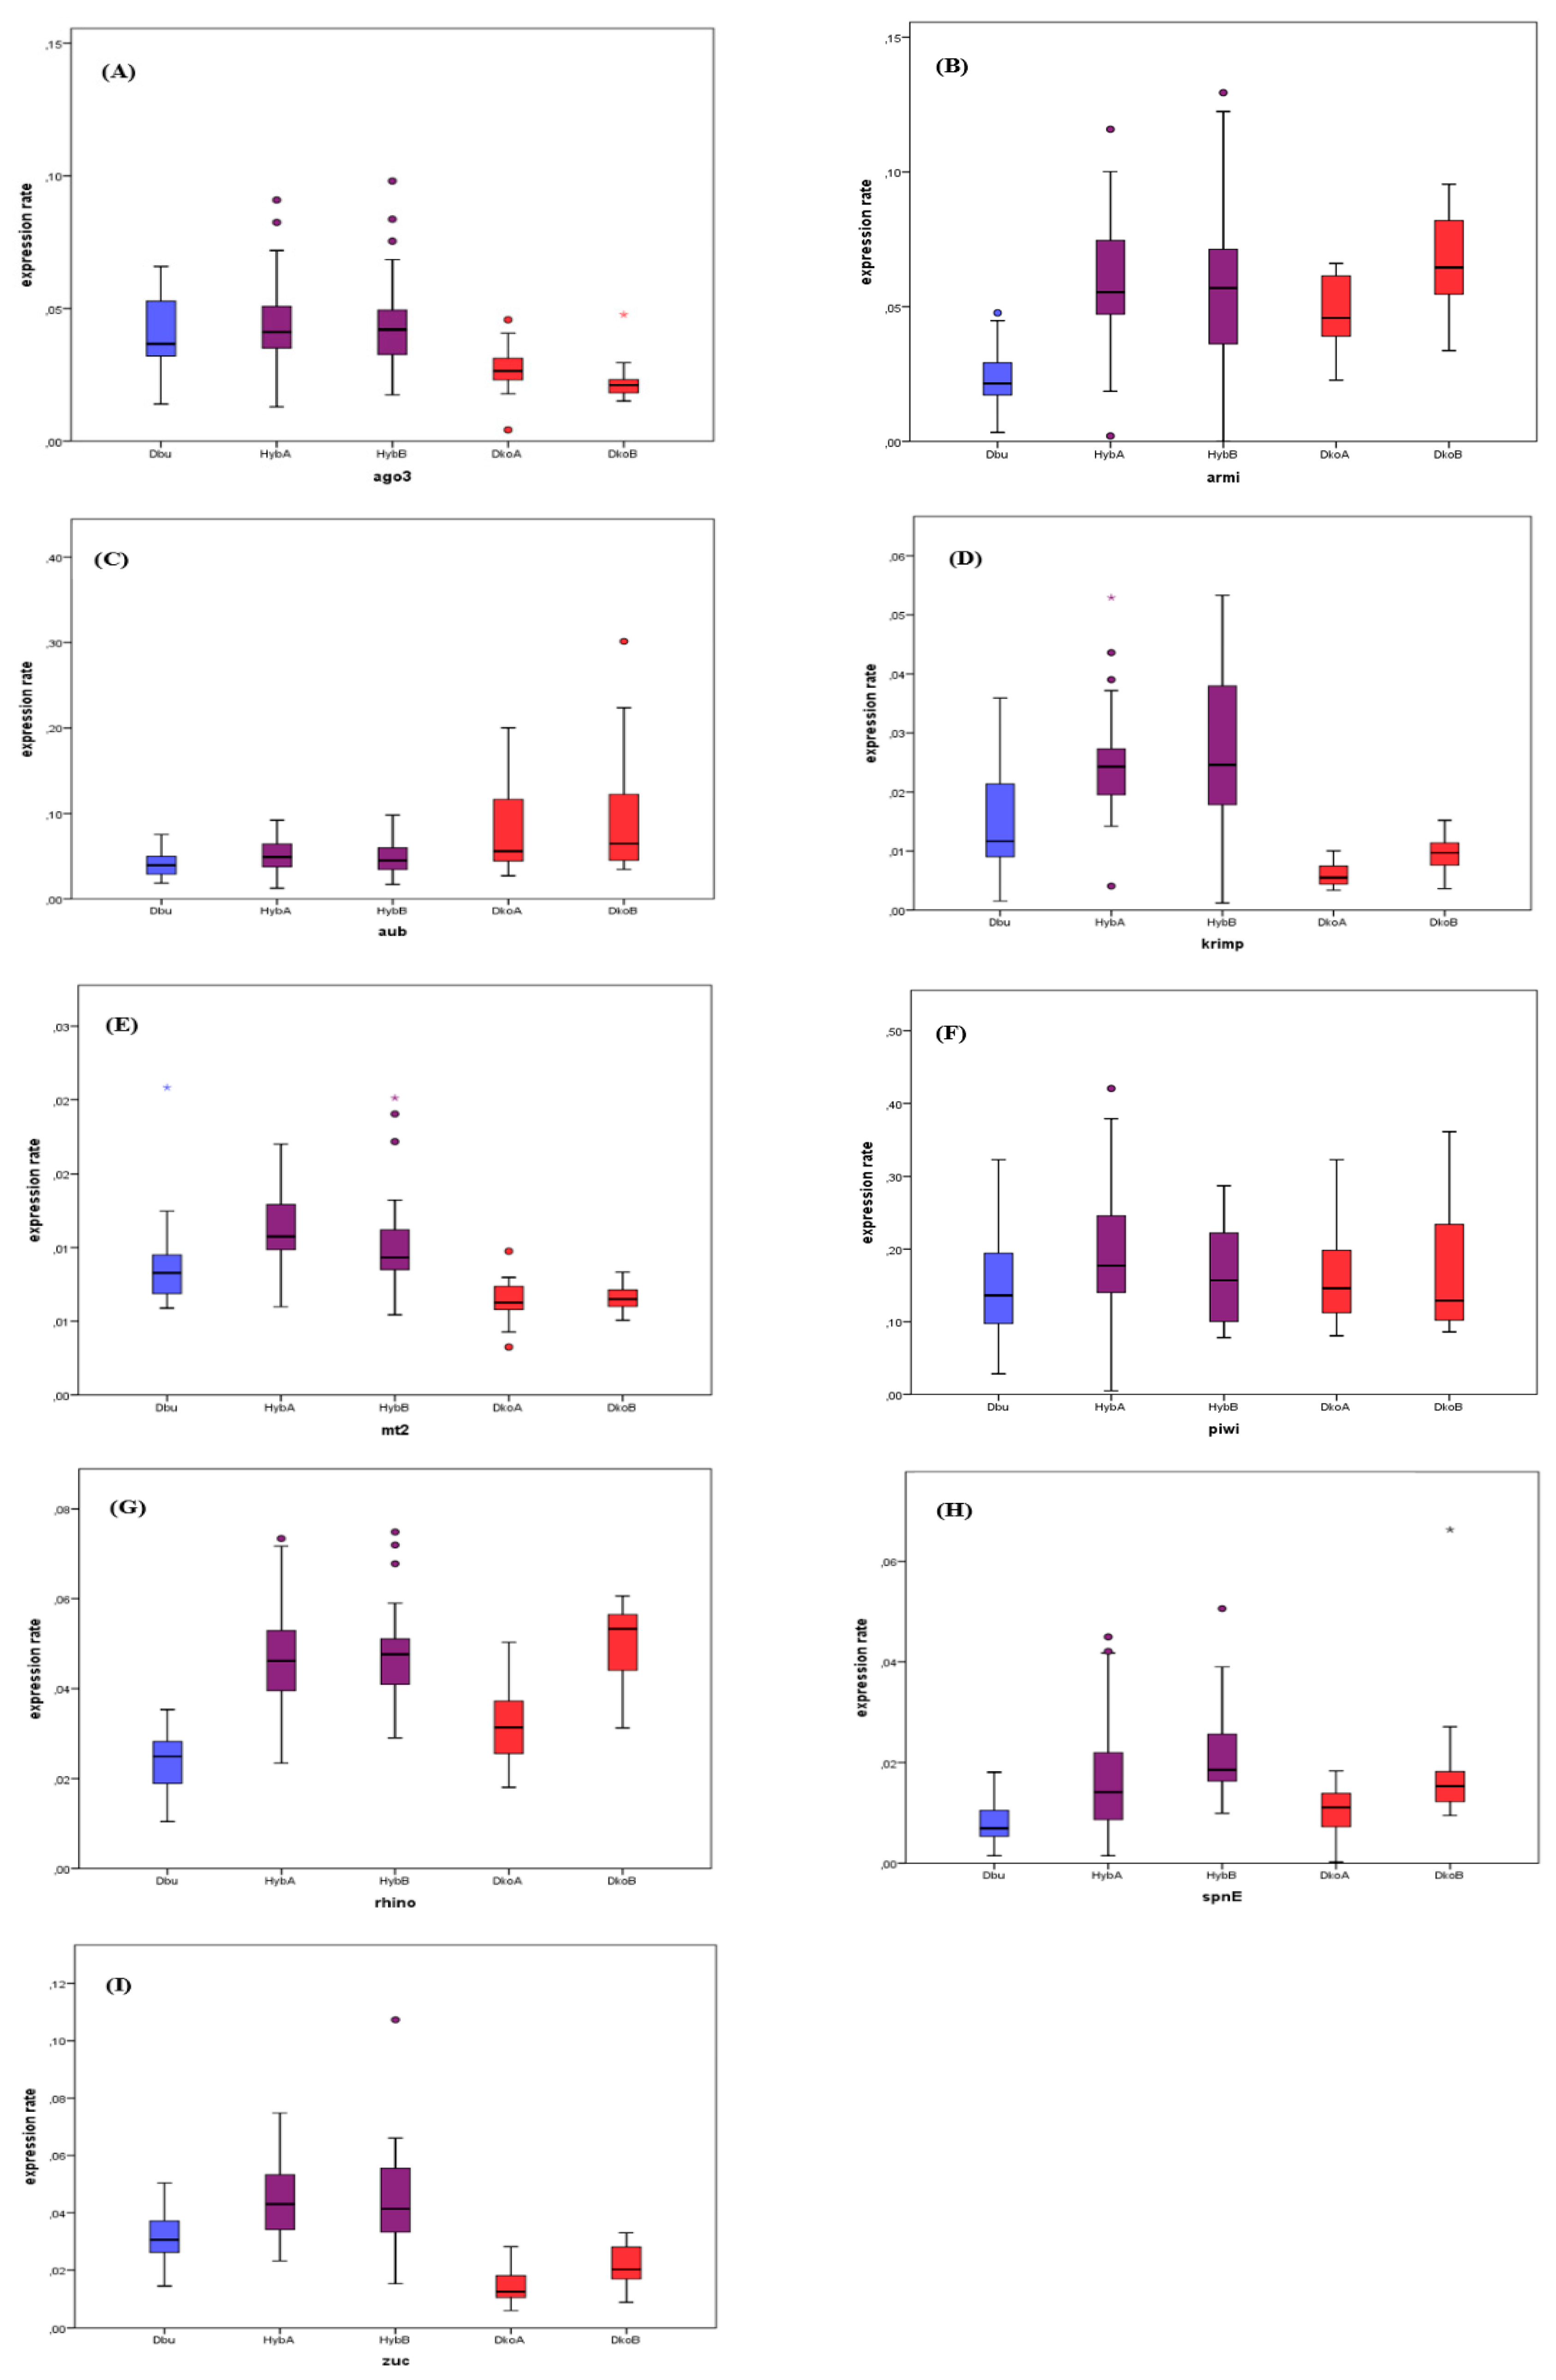
3.3. Gene Expression in Hybrids

We quantified the expression of the same nine piRNA pathway genes in ovaries of hybrid females as previously described for parental species (Figure 2). The ERs values were calculated in hybrids obtained in two different crosses (HybA and HybB, see Methods) and compared to their respective maternal group (DkoA or DkoB) as well as to D. buzzatii (Dbu, females were not involved in the cross). We tested for differences in ER within groups (Dbu, DkoA, DkoB, HybA, and HybB) for the nine studied piRNA pathway genes using the Kruskal-Wallis test, and found significant results for all of them, except for piwi (see Supplementary file 5).
We then performed one-to-one comparisons between groups using the Wilcoxon sum rank test (Table 4). The analyses revealed three possible scenarios: (a) ERs were not significantly different between hybrids and parental species—no difference scenario, (b) ERs were significantly higher in hybrids than in one of the parental species—Dbu or Dko-biased expression scenario, or (c) ERs were higher in hybrids than in both parental species—hybrid overexpression scenario (see Table 4 and Figure 2). A single gene, piwi, did not show any significant difference between hybrids and parents (Table 4 and Figure 2F). Ago3 had a Dbu-biased expression (higher than D. koepferae, Figure 2A and Table 4), while rhino, spnE, and armi presented Dko-biased expression (higher than D. buzzatii, Figure 2B,G,H and Table 4). A total of three genes—krimp, mt2, and zuc—fell in the hybrid overexpression scenario (Figure 2D,E,I and Table 4). In the case of aub, cross A displayed no significant differences between hybrids and parental species, whereas in cross B the hybrid expression is significantly different to the most expressed parental species, Dko (Figure 2A and Table 4). Moreover, this significance in cross B is still maintained after removing the outlier point (Figure 2A) W = 177 and p = 0.013 * (data not shown).
Studying individual fly samples allowed us to test for differences in variability between groups. Using Levene’s test for equality of variances, we showed that all genes had significant differences in variance within groups except piwi and rhino (see Supplementary file 6A). Only zuc and spnE genes showed higher variance values in hybrids than in both parental species (Supplementary file 6B). Indeed, they presented high ER individual variability in hybrids: they were overexpressed in some individuals and underexpressed in others, when compared to the parental median value (Figure 2).

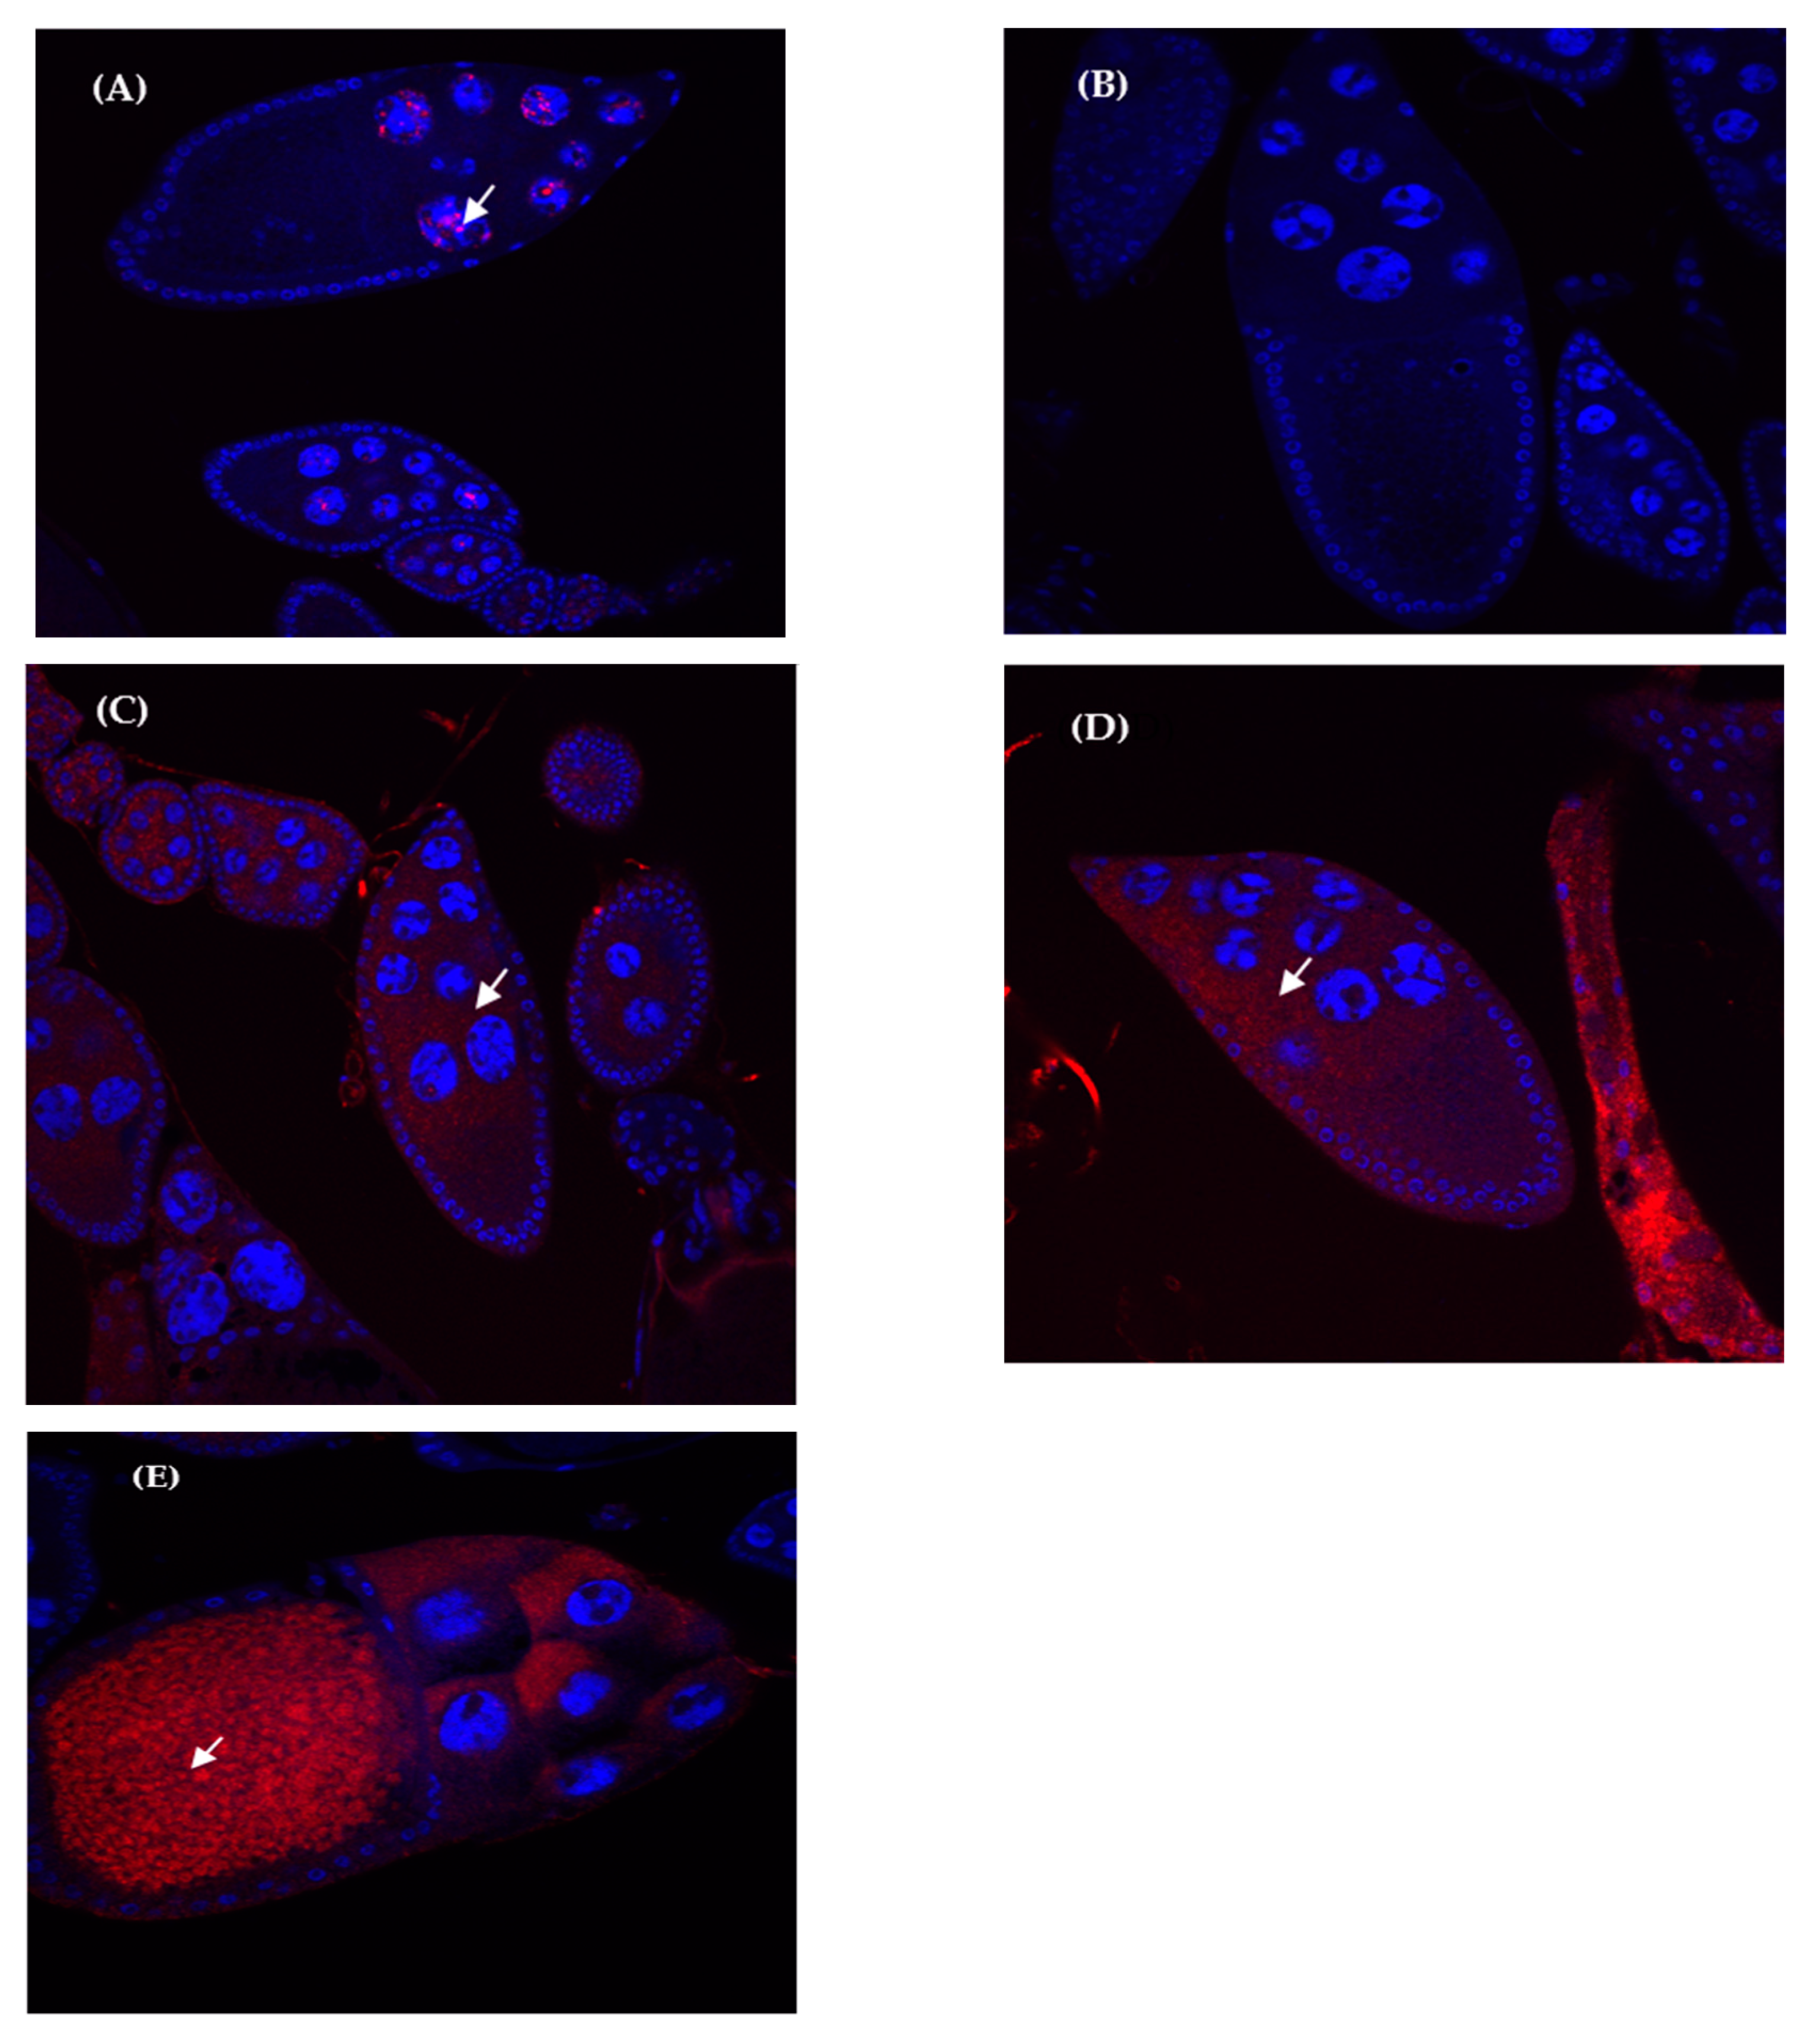
3.4. Expression Localization Patterns in Hybrid and Parental Species Ovaries

To assess whether the observed quantitative differences in gene expression between hybrids and parents involved changes in the localization of the transcripts, we performed fluorescent in situ hybridization (FISH) in ovarian tissue in order to detect the mRNA location of the genes under study.
All genes showed expression mainly in the cytoplasm of nurse cells (see Supplementary file 7), both in parental species and hybrid ovaries. A faint expression signal can also be detected inside the nucleus of nurse cells in some cases, likely corresponding to recently transcribed mRNAs. Interestingly, transcript location for ago3 showed a different pattern between hybrids (Figure 3E) and parents (Figure 3C,D): a clear and strong hybridization signal was detected in the hybrid oocytes, whereas only faint signals were detected in parental species. Additionally, we found some cases in which signal intensity seems to follow the same trend as in qRT-PCR—for instance, for mt2 the expression is higher in hybrids than in parental species. However, this can only be used as a validation since FISH is not a quantitative technique.

4. Discussion

4.1. piRNA Pathway Gene Structure is Conserved between D. buzzatii and D. koepferae

Nine piRNA pathway genes were sequenced for the first time in the parental species D. buzzatii and D. koepferae. Four of them have an exon number higher than the average in D. buzzatii genome (3.8 exons, [30]). All genes but ago3 have an identical number of exons/introns in both parental species as well as in D. melanogaster and D. mojavensis, which was expected given that 80% of intron positions are conserved across distant eukaryotes [42]. Armi and aub bear marks of positive selection (Table 2), in concordance with a previous study of RNA interference genes across the Drosophila phylogeny [43].
Although the general gene structure of the studied piRNA pathway genes is conserved among Drosophila species, ago3 caught our attention because of its low exon/intron number in our species compared to D. melanogaster (2 vs. 6 exons respectively). Ago3 has a highly variable exon number within the Drosophila genus, from a single exon in D. suzukii and D. pseudoobscura to eight exons in D. virilis [43]. This variability cannot be explained phylogenetically, as ago3 extreme exon numbers (high and low) occur in species of both the Drosophila and the Sophophora subgenus. Hence, we cannot be sure whether this variability is due to intron gain or intron loss processes. Although intron loss is predominant over intron gain in Drosophila [44], the presence of TE sequences in the species with intron-rich ago3 indicates that transposition-driven intron gain might have occurred [45]. Indeed, the predominance of intron gain has been attributed to selective pressures due to large effective population sizes [44], which would not explain a lower intron number in our species, whose population sizes are lower than in D. melanogaster [46,47].

4.2. Armitage and Aubergine Bear Marks of Positive Selection

The nine piRNA pathway sequenced genes in this study showed identity values between D. buzzatii and D. koepferae ranging between 78–95.6% for DNA and 69–95.6% for protein sequences, a rather low degree of conservation for a couple of species that diverged approximately 5 Mya [48]. This suggests that piRNA pathway genes tend to evolve quickly compared to other genes, as observed in multiple invertebrates [49] and in a previous work [27] where these genes showed protein identity values lower than the median of the proteome between our parental species. Despite the low number of sequences analyzed, we found that at least two of these genes (armi and aub) are under positive selection in our model species (Table 2), which is in concordance with previous studies showing that piRNA pathway display high rates of adaptive evolution [19,20,42]. It is important to note that in aub these selection marks were only detected in the PAZ protein domain, whereas the whole gene is affected in armi. Because some domains are shared by different piRNA pathway genes (e.g., the PAZ domain), and positive selection marks were not observed in all of them, we deduced that adaptation could be gene-specific rather than domain-specific. Several studies have suggested that the degree of gene adaptive evolution is correlated with the position of the corresponding protein in the interaction network [42,50]. In the piRNA pathway, the fastest evolving components of piRNA pathway do not usually correspond to effector proteins [51]. In our case this is true for ago3 and piwi (that are effector proteins with no significant positive selection marks) but not for aub, which shows a greater effect of positive selection in its PAZ domain. In concordance with our results, armi has a general trend to show positive selection marks in different and independent tests [52]. Signatures of adaptation are a pervasive effect in genes affecting piRNA synthesis, although this high evolution rate is not only restricted to this pathway: most of the genes related to RNA interference pathways have also been reported to display high rates of adaptative evolution [49]. Besides, as these genes participate in TE silencing, it is important to take into account the evolutionary process of host–pathogen interaction or “Red Queen” host–pathogen arms race [52]. This rapid evolution of the piRNA pathway genes is a key process in species divergence and can easily generate orthologous incompatibility after hybridization barrier [20].

4.3. Misexpression of piRNA Pathway Genes in D. buzzatii–D. koepferae Hybrids

The combination of divergent Drosophila genomes during hybridization results in a genomic shock characterized, inter alia, by a TE deregulation [22,23,25,26] caused by a failure of TE silencing [20,27,53]. There is limited information linking TE deregulation with expression failures in piRNA pathway genes [27], well-known by their important role in germinal TE regulation. Our study has quantified the individual expression, in ovaries, of nine key piRNA pathway genes in D. buzzatii, D. koepferae and their F1 hybrids. We observed that the median expression values in hybrids tend to be higher than at least one parental species in all genes except aub, which codes for an effector protein (Figure 2). However, hybrid expression values were only significantly higher than in both parents for krimp, mt2, and zuc. For the four other genes (ago3, rhino, spnE, and armi), hybrid expression was only significantly higher than the parental species with the lowest expression. Finally, piwi expression was not significantly different between hybrids and parents, while aub presented different results between crosses. These results do not completely match the previous RNA-seq study in the same species, in which most genes had expression levels similar to the parental species with the highest expression [27]. These differences likely lie in the fact that here we analyzed each ovary pair individually whereas the previous study pools the ovaries resulting from different hybrid crosses. It is worth highlighting that different individuals (both within parents and hybrids) also showed a high variability of piRNA pathway gene expression reaching differences of up to 2.5-fold.
zuc and spnE are the only genes that displayed higher inter-individual variability in hybrids compared to both parental species (see Supplementary file 6). However, because hybrids are known by their high genome instability, these differences could be due to stochastic genetic and epigenetic changes that do not involve the meiotic process, as suggested by other authors [54]. These results are in concordance with previous studies in hybrids showing high individual and cross heterogeneity in transposition [22] and expression rates [25] of the retrotransposon Osvaldo. In the same way, expression studies on the retrotransposon Helena showed additive patterns of expression in hybrids compared to parental species when using pooled flies in qRT-PCR experiments, while FISH experiments in individual flies showed a more extensive presence of Helena transcripts in F1 hybrids compared to parental species [26]. In the present study, the transcripts of the studied genes were mainly localized in the ovarian nurse cells’ cytoplasm in both hybrids and parental species. For Ago3, a strong transcript signal was also detected in the oocyte cytoplasm of hybrid ovaries, while only a faint signal was detected in parental ones. It is known that ovarian nurse cells transfer mRNAs and proteins into the oocyte for the production of the egg and early embryo [55]. However, ago3 is the only gene that seems to be more expressed in the oocyte of hybrids than of parental species, which might be due to an activation of the piRNA pathway to counteract TE deregulation in hybrids, or to an abnormal localization of the transcripts due to hybrid incompatibilities. Indeed, abnormal distributions of tissue expression were previously reported in Drosophila hybrids [26].
Several studies showed that interspecific hybrids tend to present TE derepression compared to parental species [53,56,57,58,59]. However, repression cases have also been observed for some TEs, pointing out a more complex alteration of the TE regulation network. Our results show that nine piRNA pathway genes have a non-uniform expression pattern between hybrids, and that three genes—krimp, mt2, and zuc—are overexpressed in hybrids compared to parental species. Intuitively, we could think that hybrid TE derepression might be preceded by the underexpression of regulatory genes. However, the overexpression of some piRNA pathway genes could be a genomic response to the stress caused by TE mobilization during interspecific hybridization events, to counteract harmful effects on the cell. Indeed, although a reduction of the ping-pong cycle efficiency seems to occur in hybrids for Helena-specific piRNAs [26], the general trend for whole-genome TEs [27] is to show additive or higher ping-pong signature levels in hybrids than in parental species. In the same way, non-deficient amounts of total piRNA were observed also observed in our previous studies [27].
All in all, the most plausible hypothesis to explain TE deregulation in D. buzzatii-koepferae hybrids is the functional divergence between parental piRNA pathways, especially in terms of piRNA production efficiency. Indeed, here we show that some piRNA pathway genes evolve under positive selection and show lower conservation than expected in species that diverged 4.5 Mya. These results are in agreement with our previous transcriptomics study, in which we showed that most piRNA pathway proteins (predicted in silico) have identity percentages between D. buzzatii and D. koepferae lower than the median of the whole proteome [27]. The accumulated divergence between piRNA pathway proteins has also been proposed to explain TE deregulation in D. melanogaster-D. simulans hybrids [53] and was recently attributed to the lack of Rhino and Deadlock protein binding in hybrids [20].
Still, further research is needed for a better understanding of TE deregulation in interspecific hybrids, including studying how the amount of effector proteins affects the piRNA pathway breakdown, as well as whether and how epigenetic changes (such as histone methylation) are involved in TE deregulation.

5. Conclusions

Genomic stress caused by interspecific hybridization, induces TEs misregulation in Drosophila where piRNA pathway genes can play an important role. In this study, we characterized and quantified the expression of nine piRNA pathway genes in D. koepferae and D. buzzatii species, together with their interspecific hybrids. We showed that at least two of these genes (armi and aub) are under adaptive selection, despite being closely related species. Hybrid ovaries showed deregulation of some piRNA pathway genes compared to parental species and a trend to the overexpression in krimp, mt2, and zuc. This result, together with the observation of a non-deficient amount of piRNAs in hybrids in previous studies, reinforces the idea that the overexpression is a cellular response to mitigate hybrid stress. Therefore, the TE deregulation in hybrids might be due, at least in part, to protein incompatibility due to the rapid evolution of some of the genes under selective pressure such as armi and aub.

Supplementary Materials

The following are available online at https://www.mdpi.com/2073-4425/11/2/215/s1, Supplementary file 1: A: primers used for each gene sequencing. B: primers used for qRT-PCR; Supplementary file 2: A: Primer efficiencies. B: qRT-PCR raw data; Supplementary file 3: A: piRNA pathway genes features in D. mojavensis, the closest relative to D. buzzatii and D. koepferae with a sequenced genome. B: piRNA pathway genes main feature in the genetic model D. melanogaster; Supplementary file 4: primers used for FISH probes, including probes length and the exon they are in Supplementary file 5: Comparison of the different gene expression levels between parental species (D. koepferae and D. buzzatii) and hybrids using Kruskal–Wallis test. Supplementary file 6: A: Levene test for homogeneity of variances. All p-values are corrected using the False Discovery Rate test. B: Levene test for homogeneity of variances between hybrids and parental species. All p-values are corrected using the False Discovery Rate test Supplementary file 7: FISH pictures showing mRNA localization for analyzed genes in ovaries. Red staining are gene transcripts, blue staining is DAPI (cells nuclei). Arrows mark the presence of gene transcripts.

Author Contributions

Conceptualization: M.P.G.G. and V.R.-S.; Methodology: V.G.-V., V.R.-S., J.M.-C. and E.S.-C.; Software: V.G.-V. and M.P.G.G.; Formal Analysis: V.G.-V. and M.P.G.G.; Resources: M.P.G.G.; Data Curation: V.G.-V. and E.S.-C.; Writing—Original Draft Preparation: V.G.-V., V.R.-S. and M.P.G.G.; Writing—Review & Editing, V.G.-V., V.R.-S. and M.P.G.G.; Supervision: M.P.G.G.; Project Administration: M.P.G.G.; Funding Acquisition: M.P.G.G. All authors have read and agreed to the published version of the manuscript.

Funding

This work was supported by the research grants CGL2013-42432P and CGL2017-89160P from the Spanish Ministerio de Ciencia e Innovación to the Grup de Genòmica, Bioinformàtica i Biologia Evolutiva (Principal Investigator: Mauro Santos) and grants 2014SGR 1346 and 2017SGR 1379 from Generalitat de Catalunya. VGV and VRS were supported by a PIF predoctoral fellowship from the Universitat Autònoma de Barcelona (Spain). JMC was supported by the fellowship “Beca de colaboración de estudiantes en departamentos universitarios” from the Ministerio de Educación y cultura (Spain).

Acknowledgments

We thank Inmaculada Moreno Torres for her technical assistance.

Conflicts of Interest

The authors declare that they have no conflict of interests.

References

  1. Iwasaki, A.; Medzhitov, R. Control of adaptive immunity by the innate immune system. Nat. Immunol. 2015, 16, 343–353. [Google Scholar] [CrossRef] [PubMed]
  2. Czech, B.; Hannon, G.J. One Loop to Rule Them All: The Ping-Pong Cycle and piRNA-Guided Silencing. Trends Biochem. Sci. 2016, 41, 324–337. [Google Scholar] [CrossRef] [PubMed] [Green Version]
  3. Klattenhoff, C.; Theurkauf, W. Biogenesis and germline functions of piRNAs. Development 2007, 135, 3–9. [Google Scholar] [CrossRef] [PubMed] [Green Version]
  4. Brennecke, J.; Aravin, A.A.; Stark, A.; Dus, M.; Kellis, M.; Sachidanandam, R.; Hannon, G.J. Discrete Small RNA-Generating Loci as Master Regulators of Transposon Activity in Drosophila. Cell 2007, 128, 1089–1103. [Google Scholar] [CrossRef] [Green Version]
  5. Rozhkov, N.V.; Hammell, M.; Hannon, G.J. Multiple roles for Piwi in silencing Drosophila transposons. Genes Dev. 2013, 27, 400–412. [Google Scholar] [CrossRef] [Green Version]
  6. Gunawardane, L.S.; Saito, K.; Nishida, K.M.; Miyoshi, K.; Kawamura, Y.; Nagami, T.; Siomi, H.; Siomi, M.C. A Slicer-Mediated Mechanism for Repeat-Associated siRNA 5′ End Formation in Drosophila. Science (80-) 2007, 315, 1587–1590. [Google Scholar] [CrossRef] [Green Version]
  7. Mohn, F.; Handler, D.; Brennecke, J. piRNA-guided slicing specifies transcripts for Zucchini-dependent, phased piRNA biogenesis. Science (80-.) 2015, 348, 812–817. [Google Scholar] [CrossRef] [Green Version]
  8. Han, B.W.; Wang, W.; Li, C.; Weng, Z.; Zamore, P.D. piRNA-guided slicing specifies transcripts for Zucchini-dependent, phased piRNA biogenesis. Science 2015, 348, 817–822. [Google Scholar] [CrossRef] [Green Version]
  9. Ghildiyal, M.; Seitz, H.; Horwich, M.D.; Li, C.; Du, T.; Lee, S.; Xu, J.; Kittler, E.L.W.; Zapp, M.L.; Weng, Z.; et al. Endogenous siRNAs derived from transposons and mRNAs in Drosophila somatic cells. Science (80-) 2008, 320, 1077–1081. [Google Scholar] [CrossRef] [Green Version]
  10. García Guerreiro, M.P. What makes transposable elements move in the Drosophila genome? Heredity (Edinb.) 2012, 108, 461–468. [Google Scholar] [CrossRef] [Green Version]
  11. Horváth, V.; Merenciano, M.; González, J. Revisiting the Relationship between Transposable Elements and the Eukaryotic Stress Response. Trends Genet. 2017, 33, 832–841. [Google Scholar] [CrossRef] [PubMed]
  12. Evgen’ev, M.B.; Yenikolopov, G.N.; Peunova, N.I.; Ilyin, Y.V. Transposition of mobile genetic elements in interspecific hybrids of Drosophila. Chromosoma 1982, 85, 375–386. [Google Scholar] [CrossRef] [PubMed]
  13. O’Neill, R.J.W.; O’Neill, M.J.; Graves, J.A.M. Erratum: Undermethylation associated with retroelement activation and chromosome remodelling in an interspecific mammalian hybrid. Nature 1998, 393, 68–72. [Google Scholar] [CrossRef]
  14. Metcalfe, C.J.; Bulazel, K.V.; Ferreri, G.C.; Schroeder-Reiter, E.; Wanner, G.; Rens, W.; Obergfell, C.; Eldridge, M.D.B.; O’Neill, R.J. Genomic instability within centromeres of interspecific marsupial hybrids. Genetics 2007, 177, 2507–2517. [Google Scholar] [CrossRef] [PubMed] [Green Version]
  15. Vela, D. Estudio de la inestabilidad genómica inducida por transposición en los híbridos interespecíficos de Drosophila buzzatii y Drosophila koepferae; Universitat Autònoma de Barcelona: Barcelona, Spain, 2012. [Google Scholar]
  16. Liu, B.; Wendel, J.F. Retrotransposon activation followed by rapid repression in introgressed rice plants. Genome 2000, 43, 874–880. [Google Scholar] [CrossRef] [PubMed]
  17. Ungerer, M.C.; Strakosh, S.C.; Zhen, Y. Genome expansion in three hybrid sunflower species is associated with retrotransposon proliferation. Curr. Biol. 2006, 16, R872–R873. [Google Scholar] [CrossRef] [Green Version]
  18. Obbard, D.J.; Gordon, K.H.; Buck, A.H.; Jiggins, F.M. The evolution of RNAi as a defence against viruses and transposable elements. Philos. Trans. R. Soc. B Biol. Sci. 2009, 364, 99–115. [Google Scholar] [CrossRef] [Green Version]
  19. Simkin, A.; Wong, A.; Poh, Y.-P.; Theurkauf, W.E.; Jensen, J.D. Recurrent and recent selective sweeps in the piRNA pathway. Evolution (N. Y.) 2013, 67, 1081–1090. [Google Scholar] [CrossRef] [Green Version]
  20. Parhad, S.S.; Tu, S.; Weng, Z.; Theurkauf, W.E. Adaptive Evolution Leads to Cross-Species Incompatibility in the piRNA Transposon Silencing Machinery. Dev. Cell 2017, 43, 60–70.e5. [Google Scholar] [CrossRef] [Green Version]
  21. Fablet, M.; Akkouche, A.; Braman, V.; Vieira, C. Variable expression levels detected in the Drosophila effectors of piRNA biogenesis. Gene 2014, 537, 149–153. [Google Scholar] [CrossRef] [Green Version]
  22. Labrador, M.; Farré, M.; Utzet, F.; Fontdevila, A. Interspecific hybridization increases transposition rates of Osvaldo. Mol. Biol. Evol. 1999, 16, 931–937. [Google Scholar] [CrossRef] [PubMed] [Green Version]
  23. Vela, D.; Fontdevila, A.; Vieira, C.; García Guerreiro, M.P. A genome-wide survey of genetic instability by transposition in Drosophila hybrids. PLoS ONE 2014, 9, e88992. [Google Scholar] [CrossRef] [PubMed] [Green Version]
  24. Romero-Soriano, V.; Burlet, N.; Vela, D.; Fontdevila, A.; Vieira, C.; García Guerreiro, M.P. Drosophila Females Undergo Genome Expansion after Interspecific Hybridization. Genome Biol. Evol. 2016, 8, 556–561. [Google Scholar] [CrossRef] [PubMed] [Green Version]
  25. García Guerreiro, M.P. Changes of Osvaldo expression patterns in germline of male hybrids between the species Drosophila buzzatii and Drosophila koepferae. Mol. Genet. Genom. 2015, 290, 1471–1483. [Google Scholar] [CrossRef] [PubMed]
  26. Romero-Soriano, V.; Garcia Guerreiro, M.P. Expression of the Retrotransposon Helena Reveals a Complex Pattern of TE Deregulation in Drosophila Hybrids. PLoS ONE 2016, 11, e0147903. [Google Scholar] [CrossRef] [PubMed] [Green Version]
  27. Romero-Soriano, V.; Modolo, L.; Lopez-Maestre, H.; Mugat, B.; Pessia, E.; Chambeyron, S.; Vieira, C.; Garcia Guerreiro, M.P. Transposable Element Misregulation Is Linked to the Divergence between Parental piRNA Pathways in Drosophila Hybrids. Genome Biol. Evol. 2017, 9, 1450–1470. [Google Scholar] [CrossRef]
  28. Marin, I.; Ruiz, A.; Pla, C.; Fontdevila, A. Reproductive relationships among ten species of the Drosophila repleta group from South America and the West Indies. Evolution (N. Y.) 1993, 47, 1616–1624. [Google Scholar]
  29. Gramates, L.S.; Marygold, S.J.; dos Santos, G.; Urbano, J.-M.; Antonazzo, G.; Matthews, B.B.; Rey, A.J.; Tabone, C.J.; Crosby, M.A.; Emmert, D.B.; et al. FlyBase at 25: Looking to the future. Nucleic Acids Res. 2017, 45, D663–D671. [Google Scholar] [CrossRef]
  30. Guillén, Y.; Rius, N.; Delprat, A.; Williford, A.; Muyas, F.; Puig, M.; Casillas, S.; Ràmia, M.; Egea, R.; Negre, B.; et al. Genomics of Ecological Adaptation in Cactophilic Drosophila. Genome Biol. Evol. 2015, 7, 349–366. [Google Scholar] [CrossRef] [Green Version]
  31. Katoh, K.; Rozewicki, J.; Yamada, K.D. MAFFT online service: Multiple sequence alignment, interactive sequence choice and visualization. Brief. Bioinform. 2019, 20, 1160–1166. [Google Scholar] [CrossRef] [Green Version]
  32. Marchler-Bauer, A.; Zheng, C.; Chitsaz, F.; Derbyshire, M.K.; Geer, L.Y.; Geer, R.C.; Gonzales, N.R.; Gwadz, M.; Hurwitz, D.I.; Lanczycki, C.J.; et al. CDD: Conserved domains and protein three-dimensional structure. Nucleic Acids Res. 2012, 41, D348–D352. [Google Scholar] [CrossRef] [PubMed] [Green Version]
  33. Stanke, M.; Morgenstern, B. AUGUSTUS: A web server for gene prediction in eukaryotes that allows user-defined constraints. Nucleic Acids Res. 2005, 33, W465–W467. [Google Scholar] [CrossRef] [PubMed] [Green Version]
  34. Smit, A.; Hubley, R.; Green, P. RepeatMasker Open-3.0. Available online: http://www.repeatmasker.org (accessed on 1 July 2010).
  35. Rozas, J.; Ferrer-Mata, A.; Sanchez-DelBarrio, J.C.; Guirao-Rico, S.; Librado, P.; Ramos-Onsins, S.E.; Sanchez-Gracia, A. DnaSP 6: DNA sequence polymorphism analysis of large data sets. Mol. Biol. Evol. 2017, 34, 3299–3302. [Google Scholar] [CrossRef] [PubMed]
  36. Schmittgen, T.D.; Livak, K.J. Analyzing real-time PCR data by the comparative CT method. Nat. Protoc. 2008, 3, 1101–1108. [Google Scholar] [CrossRef]
  37. Akkouche, A.; Rebollo, R.; Burlet, N.; Esnault, C.; Martinez, S.; Viginier, B.; Terzian, C.; Vieira, C.; Fablet, M. tirant, a Newly Discovered Active Endogenous Retrovirus in Drosophila simulans. J. Virol. 2012, 86, 3675–3681. [Google Scholar] [CrossRef] [Green Version]
  38. Mann, H.B.; Whitney, D.R. On a Test of Whether one of Two Random Variables is Stochastically Larger than the other. Ann. Math. Stat. 1947, 18, 50–60. [Google Scholar] [CrossRef]
  39. Kruskal, W.H.; Wallis, W.A. Use of Ranks in One-Criterion Variance Analysis. J. Am. Stat. Assoc. 1952, 47, 583–621. [Google Scholar] [CrossRef]
  40. Benjamini, Y.; Hochberg, Y. Controlling the False Discovery Rate: A Practical and Powerful Approach to Multiple Testing. J. R. Stat. Soc. 1995, 57, 289–300. [Google Scholar] [CrossRef]
  41. McDonald, J.H.; Kreitman, M. Adaptive protein evolution at the Adh locus in Drosophila. Nature 1991, 351, 652–654. [Google Scholar] [CrossRef]
  42. Putnam, N.H.; Srivastava, M.; Hellsten, U.; Dirks, B.; Chapman, J.; Salamov, A.; Terry, A.; Shapiro, H.; Lindquist, E.; Kapitonov, V.V.; et al. Sea anemone genome reveals ancestral eumetazoan gene repertoire and genomic organization. Science 2007, 317, 86–94. [Google Scholar] [CrossRef] [Green Version]
  43. Kolaczkowski, B.; Hupalo, D.N.; Kern, A.D. Recurrent Adaptation in RNA Interference Genes Across the Drosophila Phylogeny. Mol. Biol. Evol. 2011, 28, 1033–1042. [Google Scholar] [CrossRef] [PubMed] [Green Version]
  44. Coulombe-Huntington, J.; Majewski, J. Intron Loss and Gain in Drosophila. Mol. Biol. Evol. 2007, 24, 2842–2850. [Google Scholar] [CrossRef] [PubMed] [Green Version]
  45. Charlesworth, B. Effective population size and patterns of molecular evolution and variation. Nat. Rev. Genet. 2009, 10, 195–205. [Google Scholar] [CrossRef] [PubMed]
  46. Barker, J.S.F. Effective population size of natural populations of Drosophila buzzatii, with a comparative evaluation of nine methods of estimation. Mol. Ecol. 2011, 20, 4452–4471. [Google Scholar] [CrossRef]
  47. Gaffney, D.J.; Keightley, P.D. Genomic Selective Constraints in Murid Noncoding DNA. PLoS Genet. 2006, 2, e204. [Google Scholar] [CrossRef] [Green Version]
  48. Gomez, G.A.; Hasson, E. Transpecific Polymorphisms in an Inversion Linked Esterase Locus in Drosophila buzzatii. Mol. Biol. Evol. 2003, 20, 410–423. [Google Scholar] [CrossRef] [Green Version]
  49. Palmer, W.H.; Hadfield, J.D.; Obbard, D.J. RNA-Interference Pathways Display High Rates of Adaptive Protein Evolution in Multiple Invertebrates. Genetics 2018, 208, 1585–1599. [Google Scholar] [CrossRef] [Green Version]
  50. Alvarez-Ponce, D.; Aguadé, M.; Rozas, J. Network-level molecular evolutionary analysis of the insulin/TOR signal transduction pathway across 12 Drosophila genomes. Genome Res. 2009, 19, 234–242. [Google Scholar] [CrossRef] [Green Version]
  51. Blumenstiel, J.P.; Erwin, A.A.; Hemmer, L.W. What Drives Positive Selection in the Drosophila piRNA Machinery? The Genomic Autoimmunity Hypothesis. Yale J. Biol. Med. 2016, 89, 499–512. [Google Scholar]
  52. Duggal, N.K.; Emerman, M. Evolutionary conflicts between viruses and restriction factors shape immunity. Nat. Rev. Immunol. 2012, 12, 687–695. [Google Scholar] [CrossRef]
  53. Kelleher, E.S.; Edelman, N.B.; Barbash, D.A. Drosophila Interspecific Hybrids Phenocopy piRNA-Pathway Mutants. PLoS Biol. 2012, 10, e1001428. [Google Scholar] [CrossRef] [PubMed] [Green Version]
  54. Wu, Y.; Sun, Y.; Shen, K.; Sun, S.; Wang, J.; Jiang, T.; Cao, S.; Josiah, S.M.; Pang, J.; Lin, X.; et al. Immediate Genetic and Epigenetic Changes in F1 Hybrids Parented by Species with Divergent Genomes in the Rice Genus (Oryza). PLoS ONE 2015, 10, e0132911. [Google Scholar] [CrossRef] [PubMed] [Green Version]
  55. Becalska, A.N.; Gavis, E.R. Lighting up mRNA localization in Drosophila oogenesis. Development 2009, 136, 2493–2503. [Google Scholar] [CrossRef] [Green Version]
  56. Dion-Côté, A.-M.; Renaut, S.; Normandeau, E.; Bernatchez, L. RNA-seq Reveals Transcriptomic Shock Involving Transposable Elements Reactivation in Hybrids of Young Lake Whitefish Species. Mol. Biol. Evol. 2014, 31, 1188–1199. [Google Scholar] [CrossRef] [PubMed] [Green Version]
  57. Renaut, S.; Rowe, H.C.; Ungerer, M.C.; Rieseberg, L.H. Genomics of homoploid hybrid speciation: Diversity and transcriptional activity of long terminal repeat retrotransposons in hybrid sunflowers. Philos. Trans. R. Soc. Lond. B. Biol. Sci. 2014, 369. [Google Scholar] [CrossRef] [PubMed] [Green Version]
  58. Carnelossi, E.A.G.; Lerat, E.; Henri, H.; Martinez, S.; Carareto, C.M.A.; Vieira, C. Specific Activation of an I-Like Element in Drosophila Interspecific Hybrids. Genome Biol. Evol. 2014, 6, 1806–1817. [Google Scholar] [CrossRef] [PubMed] [Green Version]
  59. Josefsson, C.; Dilkes, B.; Comai, L. Parent-dependent loss of gene silencing during interspecies hybridization. Curr. Biol. 2006, 16, 1322–1328. [Google Scholar] [CrossRef] [Green Version]
Figure 1. Expression rates in the parental species D. koepferae and D. buzzatii. Note that D. buzzatii females are not involved in the cross. For D. koepferae samples the mean between two families involved in the crosses is shown. Error bars represent standard deviation.
Genes 11 00215 g001
Figure 2. Expression rates relative to rp49 housekeeping gene in parental species (Dko and Dbu) and hybrids. Boxes are determined by the first and third quartile values, with an intermediate deep line corresponding to the median value. Circles correspond to outliers (above or below 1.5-fold the interquartile range) and asterisks correspond to atypical values. Every group is shown in the same order in every plot: Dbu parental species, hybrids groups A and B and Dko maternal species groups A and B. Graphics from (A) to (I) refer to each studied gene.
Genes 11 00215 g002
Figure 3. Fluorescent in situ hybridization (FISH) of ago3 RNA expression in ovaries. Red staining are ago3 transcripts, blue staining is DAPI (cells nuclei). Arrows mark the presence of ago3 transcripts. (A) positive control using Osvaldo retrotransposon probe, (B) negative control, (C) D. buzzatii, (D) D. koepferae, (E) hybrid.
Genes 11 00215 g003
Table 1. Structure of the piRNA pathway genes sequenced region.
D. buzzatii D. koepferae
Genes aLengthCDSProteinExonsLengthCDSProteinExonsNI (%)PS (%)
ago320091688562239611686562295.693.2
armi3701343211415368834241122593.292.5
aub425025628529447424668218b9492.9
krimp19291852617219201843615292.590.9
mt28128102701 b1064100533529494.4
piwi392426258748248420976997b94.595.6
rhino1865174960221944188562827869
spnE60524012133711624541251375119491.1
zuc6516512171654654218186.572.7
This table contains the main features of the nine studied genes, including the length of their sequences, of their transcripts, and of their coding sequence (CDS) in base pairs (bp); the length of the translated protein in amino acids, and the number of exons of each transcript. Identity percentages were calculated using BLAST alignments between D. koepferae and D. buzzatii coding sequences and translated protein sequences. NI: Nucleotide identity; PS: Protein similarity; a: ago3: argonaute 3, armi: armitage, aub: aubergine, krimp: krimper, mt2: methyltransferase 2, spnE: spindle E, zuc: zucchini. b: lower number of exons due to incomplete sequencing.
Table 2. Results of McDonald and Kreitman (MK) test comparing D. buzzatii and D. koepferae sequences.
GenesRegion/DomainPn/PsDn/DsNIαP
ago3CDS-0.911---
armiCDS8.33 × 10−26.35 × 10-11.31 × 10-18.69 × 10-11.00 × 10-3 **
aubCDS5.00 × 10-16.37 × 10-17.84 × 10-13.27 × 10-12.15 × 10-1
krimpCDS0.008.25 × 10-10.001.006.00 × 10-2
mt2CDS1.67 × 10-14.38 × 10-13.80 × 10-16.19 × 10-13.75 × 10-1
piwiCDS3.08 × 10-14.33 × 10-17.11 × 10-12.88 × 10-15.78 × 10-1
rhinoCDS7.50 × 10-14.94 × 10-16.58 × 10-13.41 × 10-15.89 × 10-1
spnECDS5.00 × 10-19.31 × 10-14.65 × 10-15.34 × 10-11.65 × 10-1
zucCDS5.00 × 10-13.34 × 10-16.67 × 10-13.32 × 10-17.44 × 10-1
aubPAZ1.606.30 × 10-19.94 × 10-15.00 × 10-37.5 × 10⁻¹ ***
CDS: coding sequence; Pn/Ps: polymorphic changes and Dn/Ds: divergent changes—s refers to neutral sites and n to non-neutral ones. NI: Neutrality Index ((Pn/Ps)/(Dn/Ds)); α: proportion of adaptive substitutions (1-NI); p: p-value after Jukes–Cantor correction. **: p < 0.01; ***: p < 0.001. MK test was performed for the complete CDS (results for all genes shown) and for each individual domain (only domains with significant results are shown). PAZ: protein binding domain found in Piwi, Argonaute, and Zwille proteins. MK test could not be performed for ago 3 due to the low gene polymorphism.
Table 3. Comparison between D. koepferae and D. buzzatii expression levels using the Wilcoxon Rank sum test.
D. koepferae vs. D. buzzatii
GeneWp-Value
ago37901.46 × 10-6 ***
armi361.24 × 10-7 ***
aub1901.31 × 10-3 **
krimp5824.98 × 10-3 **
mt27739.00 × 10-5 ***
piwi3494.28 × 10-1
rhino1183.00 × 10-6 ***
spnE2329.21 × 10-4 ***
zuc6911.25 × 10-5 ***
W = Wilcoxon Rank sum test statistic. **: p < 0.01; ***: p <0.001. All p-values were corrected using a False Discovery Rate threshold of 5%.
Table 4. Comparison of the different gene expression levels between hybrids and parental species (D. koepferae and D. buzzatii).
GeneCrossNMedianSDvs. D. buzzatiivs. D. koepferae Avs. D. koepferae B
Wp-ValueWp-ValueWp-Value
ago3A454.11 × 10-21.28 × 10-21438.41 × 10-1311.02 × 10-2 *
B264.20 × 10-21.88 × 10-21367.51 × 10-1 00.00 ***
armiA365.53 × 10-22.33 × 10-22070.00 ***1521.05 × 10-1
B345.69 × 10-22.74 × 10-22100.00 *** 1566.20 × 10-2
aubA364.90 × 10-21.87 × 10-2754.67 × 10-1527.20 × 10-2
B344.49 × 10-22.05 × 10-2906.90 × 10-1 329.00 x 10⁻³ **
krimpA362.43 × 10-28.80 × 10-3382.00 × 10-2 *00.00 ***
B342.46 × 10-21.27 × 10-2371.80 × 10-2 * 10.00 ***
mt2A451.07 × 10-22.30 × 10-3581.80 × 10-2 *10.00 ***
B269.32 × 10-34.50 × 10-3861.01 × 10-1 10.00 ***
piwiA361.77 × 10-18.81 × 10-2661.81 × 10-1916.01 × 10-1
B341.57 × 10-16.85 × 10-21029.11 × 10-1 844.33 × 10⁻¹
rhinoA451.31 × 10-21.01 × 10-22461.70 × 10-2 *1491.09 × 10-1
B261.86 × 10-29.00 × 10-32950.00 *** 1566.20 × 10-2
spnEA451.31 × 10-21.01 × 10-2551.70 × 10-2 *611.09 × 10-1
B261.85 × 10-29.00 × 10-350.00 *** 546.20 × 10⁻²
zucA364.30 × 10-21.31 × 10-2484.70 × 10-2 *10.00 ***
B344.14 × 10-21.78 × 10-2591.96 × 10-1 122.00 × 10⁻³ **
N = number of samples analyzed; SD = Standard Deviation; W = Wilcoxon Rank sum test statistic. *: p < 0.05; **: p < 0.01; ***: p < 0.001. All showed p-values were corrected using False Discovery Rate.

