The Association of Multiple Gene Variants with Ageing Skeletal Muscle Phenotypes in Elderly Women

 , , ,
, , ,  ,
,  , ,
, ,  , and
, and 
Abstract
1. Introduction
2. Materials and Methods
2.1. Participants
2.2. Handgrip Strength
2.3. Isometric Knee Extension and Elbow Flexion Maximal Voluntary Contraction
2.4. Biceps Brachii Thickness
2.5. Vastus Lateralis Muscle Area
2.6. SNP Selection
2.7. Sample Collection, DNA Extraction and Genotyping
2.8. Statistical Analysis
3. Results
3.1. General Characteristics of Participants
3.2. Genotyping and SNP Associations with Skeletal Muscle Phenotypes
4. Discussion
4.1. Structural Proteins
4.2. Transcriptional Regulators
4.3. Antagonists of Muscle Growth
4.4. Body Composition Regulators
4.5. Myotrophic Factors
4.6. Implications and Limitations
5. Conclusions
Supplementary Materials
Author Contributions
Funding
Acknowledgments
Conflicts of Interest
Declaration
References
- Cruz-Jentoft, A.J.; Baeyens, J.P.; Bauer, J.M.; Boirie, Y.; Cederholm, T.; Landi, F.; Martin, F.C.; Michel, J.-P.; Rolland, Y.; Schneider, S.M. Sarcopenia: European consensus on definition and diagnosisReport of the European Working Group on Sarcopenia in Older People. Age Ageing 2010, 39, 412–423. [Google Scholar] [CrossRef] [PubMed]
- Clark, D.J.; Patten, C.; Reid, K.F.; Carabello, R.J.; Phillips, E.M.; Fielding, R.A. Impaired voluntary neuromuscular activation limits muscle power in mobility-limited older adults. J. Gerontol. Ser. A Biomed. Sci. Med. Sci. 2010, 65, 495–502. [Google Scholar] [CrossRef] [PubMed]
- Reid, K.F.; Fielding, R.A. Skeletal muscle power: A critical determinant of physical functioning in older adults. Exerc. Sport Sci. Rev. 2012, 40, 4. [Google Scholar] [CrossRef] [PubMed]
- Abney, M.; McPeek, M.S.; Ober, C. Broad and narrow heritabilities of quantitative traits in a founder population. Am. J. Hum. Genet. 2001, 68, 1302–1307. [Google Scholar] [CrossRef] [PubMed]
- Silventoinen, K.; Magnusson, P.K.E.; Tynelius, P.; Kaprio, J.; Rasmussen, F. Heritability of body size and muscle strength in young adulthood: A study of one million Swedish men. Genet. Epidemiol. 2008, 32, 341–349. [Google Scholar] [CrossRef] [PubMed]
- Thomis, M.A.I.; Beunen, G.P.; Leemputte, M.V.; Maes, H.H.; Blimkie, C.J.; Claessens, A.L.; Marchal, G.; Willems, E.; Vlietinck, R.F. Inheritance of static and dynamic arm strength and some of its determinants. Acta Physiol. Scand. 1998, 163, 59–71. [Google Scholar] [CrossRef]
- Gao, Y. The multiple actions of NO. Pflügers Arch. Eur. J. Physiol. 2010, 459, 829–839. [Google Scholar] [CrossRef]
- Lee, J.-W.; Bae, S.-H.; Jeong, J.-W.; Kim, S.-H.; Kim, K.-W. Hypoxia-inducible factor (HIF-1) α: Its protein stability and biological functions. Exp. Mol. Med. 2004, 36, 1. [Google Scholar] [CrossRef]
- Wiener, P.; Woolliams, J.; Frank-Lawale, A.; Ryan, M.; Richardson, R.; Nute, G.; Wood, J.; Homer, D.; Williams, J. The effects of a mutation in the myostatin gene on meat and carcass quality. Meat Sci. 2009, 83, 127–134. [Google Scholar] [CrossRef]
- Charbonneau, D.E.; Hanson, E.D.; Ludlow, A.T.; Delmonico, M.J.; Hurley, B.F.; Roth, S.M. ACE genotype and the muscle hypertrophic and strength responses to strength training. Med. Sci. Sports Exerc. 2008, 40, 677. [Google Scholar] [CrossRef]
- Clarkson, P.M.; Devaney, J.M.; Gordish-Dressman, H.; Thompson, P.D.; Hubal, M.J.; Urso, M.; Price, T.B.; Angelopoulos, T.J.; Gordon, P.M.; Moyna, N.M. ACTN3 genotype is associated with increases in muscle strength in response to resistance training in women. J. Appl. Physiol. 2005, 99, 154–163. [Google Scholar] [CrossRef] [PubMed]
- Wakahara, T.; Takeshita, K.; Kato, E.; Miyatani, M.; Tanaka, N.I.; Kanehisa, H.; Kawakami, Y.; Fukunaga, T. Variability of limb muscle size in young men. Am. J. Hum. Biol. 2010, 22, 55–59. [Google Scholar] [CrossRef] [PubMed]
- Stebbings, G.K.; Morse, C.I.; Williams, A.G.; Day, S.H. Variability and distribution of muscle strength and its determinants in humans. Muscle Nerve 2014, 49, 879–886. [Google Scholar] [CrossRef] [PubMed]
- Erskine, R.M.; Jones, D.A.; Maganaris, C.N.; Degens, H. In vivo specific tension of the human quadriceps femoris muscle. Eur. J. Appl. Physiol. 2009, 106, 827. [Google Scholar] [CrossRef]
- Garatachea, N.; Lucía, A. Genes and the ageing muscle: A review on genetic association studies. Age 2013, 35, 207–233. [Google Scholar] [CrossRef]
- Tan, L.-J.; Liu, S.-L.; Lei, S.-F.; Papasian, C.J.; Deng, H.-W. Molecular genetic studies of gene identification for sarcopenia. Hum. Genet. 2012, 131, 1–31. [Google Scholar] [CrossRef]
- McCauley, T.; Mastana, S.S.; Folland, J.P. ACE I/D and ACTN3 R/X polymorphisms and muscle function and muscularity of older Caucasian men. Eur. J. Appl. Physiol. 2010, 109, 269–277. [Google Scholar] [CrossRef]
- Lexell, J.; Taylor, C.C.; Sjöström, M. What is the cause of the ageing atrophy?: Total number, size and proportion of different fiber types studied in whole vastus lateralis muscle from 15- to 83-year-old men. J. Neurol. Sci. 1988, 84, 275–294. [Google Scholar] [CrossRef]
- Janssen, I.; Heymsfield, S.B.; Ross, R. Low relative skeletal muscle mass (sarcopenia) in older persons is associated with functional impairment and physical disability. J. Am. Geriatr. Soc. 2002, 50, 889–896. [Google Scholar] [CrossRef]
- Martien, S.; Delecluse, C.; Boen, F.; Seghers, J.; Pelssers, J.; Van Hoecke, A.-S.; Van Roie, E. Is knee extension strength a better predictor of functional performance than handgrip strength among older adults in three different settings? Arch. Gerontol. Geriatr. 2015, 60, 252–258. [Google Scholar] [CrossRef]
- Keller, K.; Engelhardt, M. Strength and muscle mass loss with aging process. Age and strength loss. MusclesLigaments Tendons J. 2013, 3, 346. [Google Scholar] [CrossRef]
- Janssen, I.; Heymsfield, S.B.; Wang, Z.; Ross, R. Skeletal muscle mass and distribution in 468 men and women aged 18–88 yr. J. Appl. Physiol. 2000, 89, 81–88. [Google Scholar] [CrossRef] [PubMed]
- McGrath, R.P.; Kraemer, W.J.; Al Snih, S.; Peterson, M.D. Handgrip Strength and Health in Aging Adults. Sports Med. 2018, 48, 1993–2000. [Google Scholar] [CrossRef] [PubMed]
- Bohannon, R.W. Muscle strength: Clinical and prognostic value of hand-grip dynamometry. Curr. Opin. Clin. Nutr. Metab. Care 2015, 18, 465–470. [Google Scholar] [CrossRef]
- Stessman, J.; Rottenberg, Y.; Fischer, M.; Hammerman-Rozenberg, A.; Jacobs, J.M. Handgrip strength in old and very old adults: Mood, cognition, function, and mortality. J. Am. Geriatr. Soc. 2017, 65, 526–532. [Google Scholar] [CrossRef]
- Cho, J.; Lee, I.; Kang, H. ACTN3 gene and susceptibility to sarcopenia and osteoporotic status in older Korean adults. Biomed. Res. Int. 2017, 2017, 1–8. [Google Scholar] [CrossRef]
- Romero-Blanco, C.; Artiga González, M.; Gómez-Cabello, A.; Vila-Maldonado, S.; Casajús, J.; Ara, I.; Aznar, S. ACTN3 R577X polymorphism related to sarcopenia and physical fitness in active older women. Climacteric 2020, 1–6. [Google Scholar] [CrossRef]
- He, L.; Khanal, P.; Morse, C.I.; Williams, A.; Thomis, M. Associations of combined genetic and epigenetic scores with muscle size and muscle strength: A pilot study in older women. J. Cachexia Sarcopenia Muscle 2020. [Google Scholar] [CrossRef]
- Roberts, H.C.; Denison, H.J.; Martin, H.J.; Patel, H.P.; Syddall, H.; Cooper, C.; Sayer, A.A. A review of the measurement of grip strength in clinical and epidemiological studies: Towards a standardised approach. Age Ageing 2011, 40, 423–429. [Google Scholar] [CrossRef]
- Villafañe, J.H.; Valdes, K.; Buraschi, R.; Martinelli, M.; Bissolotti, L.; Negrini, S. Reliability of the handgrip strength test in elderly subjects with Parkinson Disease. Hand 2016, 11, 54–58. [Google Scholar] [CrossRef]
- Armatas, V.; Bassa, E.; Patikas, D.; Kitsas, I.; Zangelidis, G.; Kotzamanidis, C. Neuromuscular differences between men and prepubescent boys during a peak isometric knee extension intermittent fatigue test. Pediatr. Exerc. Sci. 2010, 22, 205–217. [Google Scholar] [CrossRef] [PubMed]
- Miyatani, M.; Kanehisa, H.; Ito, M.; Kawakami, Y.; Fukunaga, T. The accuracy of volume estimates using ultrasound muscle thickness measurements in different muscle groups. Eur. J. Appl. Physiol. 2004, 91, 264–272. [Google Scholar] [PubMed]
- Ogasawara, R.; Thiebaud, R.S.; Loenneke, J.P.; Loftin, M.; Abe, T. Time course for arm and chest muscle thickness changes following bench press training. Interv. Med. Appl. Sci. 2012, 4, 217–220. [Google Scholar] [CrossRef] [PubMed]
- Morse, C.I.; Degens, H.; Jones, D.A. The validity of estimating quadriceps volume from single MRI cross-sections in young men. Eur. J. Appl. Physiol. 2007, 100, 267–274. [Google Scholar] [CrossRef] [PubMed]
- Reeves, N.D.; Maganaris, C.N.; Narici, M.V. Ultrasonographic assessment of human skeletal muscle size. Eur. J. Appl. Physiol. 2004, 91, 116–118. [Google Scholar] [CrossRef]
- Khanal, P.; He, L.; Stebbings, G.; Onambele-Pearson, G.L.; Degens, H.; Williams, A.; Thomis, M.; Morse, C.I. Prevalence and association of single nucleotide polymorphisms with sarcopenia in older women depends on definition. Sci. Rep. 2020, 10, 1–9. [Google Scholar] [CrossRef] [PubMed]
- He, L.; Khanal, P.; Morse, C.I.; Williams, A.; Thomis, M. Differentially methylated gene patterns between age-matched sarcopenic and non-sarcopenic women. J. Cachexia Sarcopenia Muscle 2019, 10, 1295–1306. [Google Scholar] [CrossRef]
- Tintle, N.; Gordon, D.; Van Bruggen, D.; Finch, S. The cost effectiveness of duplicate genotyping for testing genetic association. Ann. Hum. Genet. 2009, 73, 370–378. [Google Scholar] [CrossRef]
- Fischer, C.P.; Plomgaard, P.; Hansen, A.K.; Pilegaard, H.; Saltin, B.; Pedersen, B.K. Endurance training reduces the contraction-induced interleukin-6 mRNA expression in human skeletal muscle. Am. J. Physiol. Endocrinol. Metab. 2004, 287, E1189–E1194. [Google Scholar] [CrossRef]
- Benjamini, Y.; Hochberg, Y. Controlling the false discovery rate: A practical and powerful approach to multiple testing. J. R. Stat. Soc. Ser. B 1995, 57, 289–300. [Google Scholar] [CrossRef]
- McDonald, J. Handbook of Biological Statistics, 3rd ed.; Sparky House Publishing: Baltimore, MD, USA, 2014. [Google Scholar]
- Erskine, R.M.; Williams, A.G.; Jones, D.A.; Stewart, C.E.; Degens, H. Do PTK2 gene polymorphisms contribute to the interindividual variability in muscle strength and the response to resistance training? A preliminary report. J. Appl. Physiol. 2012, 112, 1329–1334. [Google Scholar] [CrossRef] [PubMed][Green Version]
- Stebbings, G.K.; Williams, A.; Morse, C.; Day, S. Polymorphisms in PTK2 are associated with skeletal muscle specific force: An independent replication study. Eur. J. Appl. Physiol. 2017, 117, 713–720. [Google Scholar] [CrossRef] [PubMed][Green Version]
- Garatachea, N.; Fuku, N.; He, Z.-H.; Tian, Y.; Arai, Y.; Abe, Y.; Murakami, H.; Miyachi, M.; Yvert, T.; Venturini, L. PTK2 rs7460 and rs7843014 polymorphisms and exceptional longevity: A functional replication study. Rejuvenation Res. 2014, 17, 430–438. [Google Scholar] [CrossRef] [PubMed]
- Mann, V.; Hobson, E.E.; Li, B.; Stewart, T.L.; Grant, S.F.A.; Robins, S.P.; Aspden, R.M.; Ralston, S.H. A COL1A1 Sp1 binding site polymorphism predisposes to osteoporotic fracture by affecting bone density and quality. J. Clin. Investig. 2001, 107, 899–907. [Google Scholar] [CrossRef]
- Garcia-Giralt, N.; Nogués, X.; Enjuanes, A.; Puig, J.; Mellibovsky, L.; Bay-Jensen, A.; Carreras, R.; Balcells, S.; Díez-Pérez, A.; Grinberg, D. Two new single-nucleotide polymorphisms in the COL1A1 upstream regulatory region and their relationship to bone mineral density. J. Bone Miner. Res. 2002, 17, 384–393. [Google Scholar] [CrossRef] [PubMed]
- Kostik, M.M.; Smirnov, A.M.; Demin, G.S.; Mnuskina, M.M.; Scheplyagina, L.A.; Larionova, V.I. Genetic polymorphisms of collagen type I α1 chain (COL1A1) gene increase the frequency of low bone mineral density in the subgroup of children with juvenile idiopathic arthritis. EPMA J. 2013, 4, 15. [Google Scholar] [CrossRef] [PubMed][Green Version]
- Berg, J.P.; Lehmann, E.H.; Stakkestad, J.A.; Haug, E.; Halse, J. The Sp1 binding site polymorphism in the collagen type I α 1 (COLIA1) gene is not associated with bone mineral density in healthy children, adolescents, and young adults. Eur. J. Endocrinol. 2000, 143, 261–265. [Google Scholar] [CrossRef] [PubMed][Green Version]
- Heegaard, A.-M.; Jørgensen, H.; Vestergaard, A.; Hassager, C.; Ralston, S. Lack of influence of collagen type Iα1 Sp1 binding site polymorphism on the rate of bone loss in a cohort of postmenopausal Danish women followed for 18 years. Calcif. Tissue Int. 2000, 66, 409–413. [Google Scholar] [CrossRef]
- Efstathiadou, Z.; Kranas, V.; Ioannidis, J.; Georgiou, I.; Tsatsoulis, A. The Sp1 COLIA1 gene polymorphism, and not vitamin D receptor or estrogen receptor gene polymorphisms, determines bone mineral density in postmenopausal Greek women. Osteoporos. Int. 2001, 12, 326–331. [Google Scholar] [CrossRef]
- Grant, S.F.; Reid, D.M.; Blake, G.; Herd, R.; Fogelman, I.; Ralston, S.H. Reduced bone density and osteoporosis associated with a polymorphic Sp1 binding site in the collagen type I α 1 gene. Nat. Genet. 1996, 14, 203. [Google Scholar] [CrossRef]
- Ji, G.; Yao, M.; Sun, C.; Zhang, L.; Han, Z. Association of collagen type I α1 (COLIA1) Sp1 polymorphism with osteoporotic fracture in Caucasian post-menopausal women: A meta-analysis. J. Int. Med. Res. 2009, 37, 1725–1732. [Google Scholar] [CrossRef] [PubMed]
- Lakatos, P.L.; Bajnok, E.; Tornai, I.; Folhoffer, A.; Horvath, A.; Lakatos, P.; Habior, A.; Szalay, F. Insulin-like growth factor I gene microsatellite repeat, collagen type Iα1 gene Sp1 polymorphism, and bone disease in primary biliary cirrhosis. Eur. J. Gastroenterol. Hepatol. 2004, 16, 753–759. [Google Scholar] [CrossRef] [PubMed]
- Rojano-Mejía, D.; Coral-Vázquez, R.M.; Espinosa, L.C.; López-Medina, G.; Aguirre-García, M.C.; Coronel, A.; Canto, P. JAG1 and COL1A1 polymorphisms and haplotypes in relation to bone mineral density variations in postmenopausal Mexican-Mestizo Women. Age 2013, 35, 471–478. [Google Scholar] [CrossRef] [PubMed][Green Version]
- Wang, C.; Li, H.; Chen, K.; Wu, B.; Liu, H. Association of polymorphisms rs1800012 in COL1A1 with sports-related tendon and ligament injuries: A meta-analysis. Oncotarget 2017, 8, 27627. [Google Scholar] [CrossRef] [PubMed]
- Franchi, M.; Trirè, A.; Quaranta, M.; Orsini, E.; Ottani, V. Collagen structure of tendon relates to function. Sci. World J. 2007, 7, 404–420. [Google Scholar] [CrossRef] [PubMed]
- Starkey, C.P.; Geesink, G.H.; Oddy, V.H.; Hopkins, D.L. Explaining the variation in lamb longissimus shear force across and within ageing periods using protein degradation, sarcomere length and collagen characteristics. Meat Sci. 2015, 105, 32–37. [Google Scholar] [CrossRef]
- Hashimoto, T.; Shibasaki, F. Hypoxia-inducible factor as an angiogenic master switch. Front. Pediatr. 2015, 3, 33. [Google Scholar] [CrossRef] [PubMed]
- Tanimoto, K.; Yoshiga, K.; Eguchi, H.; Kaneyasu, M.; Ukon, K.; Kumazaki, T.; Oue, N.; Yasui, W.; Imai, K.; Nakachi, K. Hypoxia-inducible factor-1α polymorphisms associated with enhanced transactivation capacity, implying clinical significance. Carcinogenesis 2003, 24, 1779–1783. [Google Scholar] [CrossRef]
- Lunde, I.G.; Anton, S.L.; Bruusgaard, J.C.; Rana, Z.A.; Ellefsen, S.; Gundersen, K. Hypoxia inducible factor 1α links fast-patterned muscle activity and fast muscle phenotype in rats. J. Physiol. 2011, 589, 1443–1454. [Google Scholar] [CrossRef]
- Ahmetov, I.; Hakimullina, A.; Lyubaeva, E.; Vinogradova, O.; Rogozkin, V. Effect of HIF1A gene polymorphism on human muscle performance. Bull. Exp. Biol. 2008, 146, 351–353. [Google Scholar] [CrossRef]
- Gabbasov, R.T.; Arkhipova, A.A.; Borisova, A.V.; Hakimullina, A.M.; Kuznetsova, A.V.; Williams, A.G.; Day, S.H.; Ahmetov, I.I. The HIF1A gene Pro582Ser polymorphism in Russian strength athletes. J. Strength Cond. Res. 2013, 27, 2055–2058. [Google Scholar] [CrossRef] [PubMed]
- Cięszczyk, P.; Eider, J.; Arczewska, A.; Ostanek, M.; Leońska-Duniec, A.; Sawczyn, S.; Ficek, K.; Jascaniene, N.; Kotarska, K.; Sygit, K. The HIF1A gene Pro582Ser polymorphism in polish power-orientated athletes. Biol. Sport 2011, 28, 111–114. [Google Scholar] [CrossRef]
- Drozdovska, S.B.; Dosenko, V.E.; Ahmetov, I.I.; Ilyin, V.N. The association of gene polymorphisms with athlete status in Ukrainians. Biol. Sport 2013, 30, 163. [Google Scholar] [CrossRef] [PubMed]
- Prior, S.J.; Hagberg, J.M.; Phares, D.A.; Brown, M.D.; Fairfull, L.; Ferrell, R.E.; Roth, S.M. Sequence variation in hypoxia-inducible factor 1α (HIF1A): Association with maximal oxygen consumption. Physiol. Genom. 2003, 15, 20–26. [Google Scholar] [CrossRef]
- McPhee, J.S.; Perez-Schindler, J.; Degens, H.; Tomlinson, D.; Hennis, P.; Baar, K.; Williams, A.G.E. HIF1A P582S gene association with endurance training responses in young women. Eur. J. Appl. Physiol. 2011, 111, 2339–2347. [Google Scholar] [CrossRef]
- Martins, K.J.B.; St-Louis, M.; Murdoch, G.K.; MacLean, I.M.; McDonald, P.; Dixon, W.T.; Putman, C.T.; Michel, R.N. Nitric oxide synthase inhibition prevents activity-induced calcineurin–NFATc1 signalling and fast-to-slow skeletal muscle fibre type conversions. J. Physiol. 2012, 590, 1427–1442. [Google Scholar] [CrossRef]
- Brown, G.C. Mechanisms of Inflammatory Neurodegeneration: iNOS and NADPH Oxidase; Portland Press Limited: London, UK, 2007. [Google Scholar]
- Smith, L.W.; Smith, J.D.; Criswell, D.S. Involvement of nitric oxide synthase in skeletal muscle adaptation to chronic overload. J. Appl. Physiol. 2002, 92, 2005–2011. [Google Scholar] [CrossRef]
- Eu, J.P.; Hare, J.M.; Hess, D.T.; Skaf, M.; Sun, J.; Cardenas-Navina, I.; Sun, Q.-A.; Dewhirst, M.; Meissner, G.; Stamler, J.S. Concerted regulation of skeletal muscle contractility by oxygen tension and endogenous nitric oxide. Proc. Natl. Acad. Sci. USA 2003, 100, 15229–15234. [Google Scholar] [CrossRef]
- McConell, G.K.; Rattigan, S.; Lee-Young, R.S.; Wadley, G.D.; Merry, T.L. Skeletal muscle nitric oxide signaling and exercise: A focus on glucose metabolism. Am. J. Physiol. Endocrinol. Metab. 2012, 303, E301–E307. [Google Scholar] [CrossRef]
- De Palma, C.; Morisi, F.; Pambianco, S.; Assi, E.; Touvier, T.; Russo, S.; Perrotta, C.; Romanello, V.; Carnio, S.; Cappello, V. Deficient nitric oxide signalling impairs skeletal muscle growth and performance: Involvement of mitochondrial dysregulation. Skelet. Muscle 2014, 4, 22. [Google Scholar] [CrossRef]
- Sandri, M.; Coletto, L.; Grumati, P.; Bonaldo, P. Misregulation of autophagy and protein degradation systems in myopathies and muscular dystrophies. J. Cell Sci. 2013, 126, 5325–5333. [Google Scholar] [CrossRef] [PubMed]
- Sandri, M. Autophagy in skeletal muscle. FEBS Lett. 2010, 584, 1411–1416. [Google Scholar] [CrossRef] [PubMed]
- Persu, A.; Stoenoiu, M.S.; Messiaen, T.; Davila, S.; Robino, C.; El-Khattabi, O.; Mourad, M.; Horie, S.; Feron, O.; Balligand, J.L. Modifier effect of ENOS in autosomal dominant polycystic kidney disease. Hum. Mol. Genet. 2002, 11, 229–241. [Google Scholar] [CrossRef] [PubMed]
- Tesauro, M.; Thompson, W.C.; Rogliani, P.; Qi, L.; Chaudhary, P.P.; Moss, J. Intracellular processing of endothelial nitric oxide synthase isoforms associated with differences in severity of cardiopulmonary diseases: Cleavage of proteins with aspartate vs. glutamate at position 298. Proc. Natl. Acad. Sci. USA 2000, 97, 2832–2835. [Google Scholar] [CrossRef]
- Zmijewski, P.; Cieszczyk, P.; Ahmetov, I.I. The NOS3 G894T (rs1799983) and-786T/C (rs2070744) polymorphisms are associated with elite swimmer status. Biol. Sport 2018, 35, 313–319. [Google Scholar] [CrossRef]
- Weyerstraß, J.; Stewart, K.; Wesselius, A.; Zeegers, M. Nine genetic polymorphisms associated with power athlete status–a meta-analysis. J. Sci. Med. Sport 2018, 21, 213–220. [Google Scholar] [CrossRef]
- Guidry, M.A.; Kostek, M.A.; Angelopoulos, T.J.; Clarkson, P.M.; Gordon, P.M.; Moyna, N.M.; Visich, P.S.; Zoeller, R.F.; Thompson, P.D.; Devaney, J.M. Endothelial Nitric Oxide Synthase (NOS3) +894 G>T associates with physical activity and muscle performance among young adults. ISRN Vasc. Med. 2012. [Google Scholar] [CrossRef]
- McPherron, A.C.; Lawler, A.M.; Lee, S.-J. Regulation of skeletal muscle mass in mice by a new TGF-p superfamily member. Nature 1997, 387, 83. [Google Scholar] [CrossRef]
- Thomas, M.; Langley, B.; Berry, C.; Sharma, M.; Kirk, S.; Bass, J.; Kambadur, R. Myostatin, a negative regulator of muscle growth, functions by inhibiting myoblast proliferation. J. Biol. Chem. 2000, 275, 40235–40243. [Google Scholar] [CrossRef]
- Windelinckx, A.; De Mars, G.; Huygens, W.; Peeters, M.W.; Vincent, B.; Wijmenga, C.; Lambrechts, D.; Delecluse, C.; Roth, S.M.; Metter, E.J. Comprehensive fine mapping of chr12q12-14 and follow-up replication identify activin receptor 1B (ACVR1B) as a muscle strength gene. Eur. J. Hum. Genet. 2011, 19, 208. [Google Scholar] [CrossRef]
- Thomaes, T.; Thomis, M.; Onkelinx, S.; Goetschalckx, K.; Fagard, R.; Lambrechts, D.; Vanhees, L. Genetic predisposition scores associate with muscular strength, size, and trainability. Med. Sci. Sports Exerc. 2013, 45, 1451–1459. [Google Scholar] [CrossRef] [PubMed]
- Chen, J.L.; Walton, K.L.; Al-Musawi, S.L.; Kelly, E.K.; Qian, H.; La, M.; Lu, L.; Lovrecz, G.; Ziemann, M.; Lazarus, R. Development of novel activin-targeted therapeutics. Mol. Ther. 2015, 23, 434–444. [Google Scholar] [CrossRef] [PubMed]
- Seibert, M.J.; Xue, Q.L.; Fried, L.P.; Walston, J.D. Polymorphic variation in the human myostatin (GDF-8) gene and association with strength measures in the Women’s Health and Aging Study II cohort. J. Am. Geriatr. Soc. 2001, 49, 1093–1096. [Google Scholar] [CrossRef] [PubMed]
- González-Freire, M.; Rodríguez-Romo, G.; Santiago, C.; Bustamante-Ara, N.; Yvert, T.; Gómez-Gallego, F.; Rexach, J.A.S.; Ruiz, J.R.; Lucia, A. The K153R variant in the myostatin gene and sarcopenia at the end of the human lifespan. Age 2010, 32, 405–409. [Google Scholar] [CrossRef][Green Version]
- Santiago, C.; Ruiz, J.R.; Rodríguez-Romo, G.; Fiuza-Luces, C.; Yvert, T.; Gonzalez-Freire, M.; Gómez-Gallego, F.; Morán, M.; Lucia, A. The K153R polymorphism in the myostatin gene and muscle power phenotypes in young, non-athletic men. PLoS ONE 2011, 6, e16323. [Google Scholar] [CrossRef]
- Ivey, F.M.; Roth, S.M.; Ferrell, R.E.; Tracy, B.L.; Lemmer, J.T.; Hurlbut, D.E.; Martel, G.F.; Siegel, E.L.; Fozard, J.L.; Metter, E.J. Effects of age, gender, and myostatin genotype on the hypertrophic response to heavy resistance strength training. J. Gerontol. Ser. A Biol. Sci. Med. Sci. 2000, 55, M641–M648. [Google Scholar] [CrossRef]
- Li, X.; Wang, S.-J.; Tan, S.C.; Chew, P.L.; Liu, L.; Wang, L.; Wen, L.; Ma, L. The A55T and K153R polymorphisms of MSTN gene are associated with the strength training-induced muscle hypertrophy among Han Chinese men. J. Sports Sci. 2014, 32, 883–891. [Google Scholar] [CrossRef]
- Szláma, G.; Trexler, M.; Buday, L.; Patthy, L. K153R polymorphism in myostatin gene increases the rate of promyostatin activation by furin. FEBS Lett. 2015, 589, 295–301. [Google Scholar] [CrossRef]
- Sonestedt, E.; Gullberg, B.; Ericson, U.; Wirfält, E.; Hedblad, B.; Orho-Melander, M. Association between fat intake, physical activity and mortality depending on genetic variation in FTO. Int. J. Obes. 2011, 35, 1041. [Google Scholar] [CrossRef]
- Livshits, G.; Malkin, I.; Moayyeri, A.; Spector, T.D.; Hammond, C.J. Association of FTO gene variants with body composition in UK twins. Ann. Hum. Genet. 2012, 76, 333–341. [Google Scholar] [CrossRef]
- Frayling, T.M.; Timpson, N.J.; Weedon, M.N.; Zeggini, E.; Freathy, R.M.; Lindgren, C.M.; Perry, J.R.B.; Elliott, K.S.; Lango, H.; Rayner, N.W. A common variant in the FTO gene is associated with body mass index and predisposes to childhood and adult obesity. Science 2007, 316, 889–894. [Google Scholar] [CrossRef] [PubMed]
- Wang, X.; Huang, N.; Yang, M.; Wei, D.; Tai, H.; Han, X.; Gong, H.; Zhou, J.; Qin, J.; Wei, X. FTO is required for myogenesis by positively regulating mTOR-PGC-1α pathway-mediated mitochondria biogenesis. Cell Death Dis. 2017, 8, e2702. [Google Scholar] [CrossRef] [PubMed]
- Cordero, A.I.H.; Gregory, J.S.; Douglas, A.; Lionikas, A. Genome-wide analysis in UK Biobank identifies over 100 QTLs associated with muscle mass variability in middle age individuals. bioRxiv 2018. [Google Scholar] [CrossRef]
- Zillikens, M.C.; Demissie, S.; Hsu, Y.-H.; Yerges-Armstrong, L.M.; Chou, W.-C.; Stolk, L.; Livshits, G.; Broer, L.; Johnson, T.; Koller, D.L. Large meta-analysis of genome-wide association studies identifies five loci for lean body mass. Nat. Commun. 2017, 8, 80. [Google Scholar] [CrossRef]
- Jacobsson, J.A.; Schiöth, H.B.; Fredriksson, R. The impact of intronic single nucleotide polymorphisms and ethnic diversity for studies on the obesity gene FTO. Obes. Rev. 2012, 13, 1096–1109. [Google Scholar] [CrossRef]
- Al-Serri, A.; Al-Bustan, S.A.; Kamkar, M.; Thomas, D.; Alsmadi, O.; Al-Temaimi, R.; Mojiminiyi, O.A.; Abdella, N.A. Association of FTO rs9939609 with Obesity in the Kuwaiti Population: A Public Health Concern? Med. Princ. Pract. 2018, 27, 145–151. [Google Scholar] [CrossRef]
- Heffernan, S.M.; Stebbings, G.; Kilduff, L.P.; Erskine, R.; Day, S.H.; Morse, C.; McPhee, J.; Cook, C.; Vance, B.; Ribbans, W.J. Fat mass and obesity associated (FTO) gene influences skeletal muscle phenotypes in non-resistance trained males and elite rugby playing position. BMC Genet. 2017, 18, 4. [Google Scholar] [CrossRef]
- Borkan, G.A.; Hults, D.E.; Gerzof, S.G.; Robbins, A.H.; Silbert, C.K. Age changes in body composition revealed by computed tomography. J. Gerontol. 1983, 38, 673–677. [Google Scholar] [CrossRef]
- Visser, M.; Goodpaster, B.H.; Kritchevsky, S.B.; Newman, A.B.; Nevitt, M.; Rubin, S.M.; Simonsick, E.M.; Harris, T.B. Muscle mass, muscle strength, and muscle fat infiltration as predictors of incident mobility limitations in well-functioning older persons. J. Gerontol. Ser. A Biol. Sci. Med. Sci. 2005, 60, 324–333. [Google Scholar] [CrossRef]
- Delmonico, M.J.; Harris, T.B.; Visser, M.; Park, S.W.; Conroy, M.B.; Velasquez-Mieyer, P.; Boudreau, R.; Manini, T.M.; Nevitt, M.; Newman, A.B.; et al. Longitudinal study of muscle strength, quality, and adipose tissue infiltration. Am. J. Clin. Nutr. 2009, 90, 1579–1585. [Google Scholar]
- Tomlinson, D.J.; Erskine, R.; Winwood, K.; Morse, C.; Onambélé, G. The impact of obesity on skeletal muscle architecture in untrained young vs. old women. J. Anat. 2014, 225, 675–684. [Google Scholar] [CrossRef] [PubMed]
- Forger, N.G.; Roberts, S.L.; Wong, V.; Breedlove, S.M. Ciliary neurotrophic factor maintains motoneurons and their target muscles in developing rats. J. Neurosci. 1993, 13, 4720–4726. [Google Scholar] [CrossRef] [PubMed]
- Ip, N.Y.; McClain, J.; Barrezueta, N.X.; Aldrich, T.H.; Pan, L.; Li, Y.; Wiegand, S.J.; Friedman, B.; Davis, S.; Yancopoulos, G.D. The α component of the CNTF receptor is required for signaling and defines potential CNTF targets in the adult and during development. Neuron 1993, 10, 89–102. [Google Scholar] [CrossRef]
- Tsompanidis, A.; Vafiadaki, E.; Blüher, S.; Kalozoumi, G.; Sanoudou, D.; Mantzoros, C.S. Ciliary neurotrophic factor upregulates follistatin and Pak1, causes overexpression of muscle differentiation related genes and downregulation of established atrophy mediators in skeletal muscle. Metabolism 2016, 65, 915–925. [Google Scholar] [CrossRef] [PubMed]
- Guillet, C.; Auguste, P.; Mayo, W.; Kreher, P.; Gascan, H. Ciliary neurotrophic factor is a regulator of muscular strength in aging. J. Neurosci. 1999, 19, 1257–1262. [Google Scholar] [CrossRef]
- Takahashi, R.; Yokoji, H.; Misawa, H.; Hayashi, M.; Hu, J.; Deguchi, T. A null mutation in the human CNTF gene is not causally related to neurological diseases. Nat. Genet. 1994, 7, 79. [Google Scholar] [CrossRef]
- Roth, S.M.; Schrager, M.A.; Ferrell, R.E.; Riechman, S.E.; Metter, E.J.; Lynch, N.A.; Lindle, R.S.; Hurley, B.F. CNTF genotype is associated with muscular strength and quality in humans across the adult age span. J. Appl. Physiol. 2001, 90, 1205–1210. [Google Scholar] [CrossRef]
- Arking, D.E.; Fallin, D.M.; Fried, L.P.; Li, T.; Beamer, B.A.; Xue, Q.L.; Chakravarti, A.; Walston, J. Variation in the ciliary neurotrophic factor gene and muscle strength in older Caucasian women. J. Am. Geriatr. Soc. 2006, 54, 823–826. [Google Scholar] [CrossRef]
- Walsh, S.; Kelsey, B.K.; Angelopoulos, T.J.; Clarkson, P.M.; Gordon, P.M.; Moyna, N.M.; Visich, P.S.; Zoeller, R.F.; Seip, R.L.; Bilbie, S. CNTF 1357 G→ A polymorphism and the muscle strength response to resistance training. J. Appl. Physiol. 2009, 107, 1235–1240. [Google Scholar] [CrossRef]
- Lee, N.; Spearry, R.P.; Rydyznski, C.E.; MacLennan, A.J. Muscle ciliary neurotrophic factor receptor α contributes to motor neuron STAT 3 activation following peripheral nerve lesion. Eur. J. Neurosci. 2019, 49, 1084–1090. [Google Scholar] [CrossRef]
- Zhang, C.; Li, Y.; Wu, Y.; Wang, L.; Wang, X.; Du, J. Interleukin-6/signal transducer and activator of transcription 3 (STAT3) pathway is essential for macrophage infiltration and myoblast proliferation during muscle regeneration. J. Biol. Chem. 2013, 288, 1489–1499. [Google Scholar] [CrossRef] [PubMed]
- Larsson, L.; Li, X.; Teresi, A.; Salviati, G. Effects of thyroid hormone on fast-and slow-twitch skeletal muscles in young and old rats. J. Physiol. 1994, 481, 149–161. [Google Scholar] [CrossRef] [PubMed]
- Salvatore, D.; Simonides, W.S.; Dentice, M.; Zavacki, A.M.; Larsen, P.R. Thyroid hormones and skeletal muscle—New insights and potential implications. Nat. Rev. Endocrinol. 2014, 10, 206. [Google Scholar] [CrossRef] [PubMed]
- Liu, X.-G.; Tan, L.-J.; Lei, S.-F.; Liu, Y.-J.; Shen, H.; Wang, L.; Yan, H.; Guo, Y.-F.; Xiong, D.-H.; Chen, X.-D. Genome-wide association and replication studies identified TRHR as an important gene for lean body mass. Am. J. Hum. Genet. 2009, 84, 418–423. [Google Scholar] [CrossRef] [PubMed]
- Miyamoto-Mikami, E.; Murakami, H.; Tsuchie, H.; Takahashi, H.; Ohiwa, N.; Miyachi, M.; Kawahara, T.; Fuku, N. Lack of association between genotype score and sprint/power performance in the Japanese population. J. Sci. Med. Sport 2017, 20, 98–103. [Google Scholar] [CrossRef] [PubMed]
- Fuku, N.; He, Z.-H.; Sanchis-Gomar, F.; Pareja-Galeano, H.; Tian, Y.; Arai, Y.; Abe, Y.; Murakami, H.; Miyachi, M.; Zempo, H. Exceptional longevity and muscle and fitness related genotypes: A functional in vitro analysis and case-control association replication study with SNPs THRH rs7832552, IL6 rs1800795, and ACSL1 rs6552828. Front. Aging Neurosci. 2015, 7, 59. [Google Scholar] [CrossRef] [PubMed]
- Cadore, E.L.; Casas-Herrero, A.; Zambom-Ferraresi, F.; Idoate, F.; Millor, N.; Gómez, M.; Rodriguez-Mañas, L.; Izquierdo, M. Multicomponent exercises including muscle power training enhance muscle mass, power output, and functional outcomes in institutionalized frail nonagenarians. Age 2014, 36, 773–785. [Google Scholar] [CrossRef]
- Santos, L.; Ribeiro, A.S.; Schoenfeld, B.J.; Nascimento, M.A.; Tomeleri, C.M.; Souza, M.F.; Pina, F.L.; Cyrino, E.S. The improvement in walking speed induced by resistance training is associated with increased muscular strength but not skeletal muscle mass in older women. Eur. J. Sport Sci. 2017, 17, 488–494. [Google Scholar] [CrossRef]
- Ma, T.; Lu, D.; Zhu, Y.-S.; Chu, X.-F.; Wang, Y.; Shi, G.-P.; Wang, Z.-D.; Yu, L.; Jiang, X.-Y.; Wang, X.-F. ACTN3 genotype and physical function and frailty in an elderly Chinese population: The Rugao Longevity and Ageing Study. Age Ageing 2018, 47, 416–422. [Google Scholar] [CrossRef]
- Kostek, M.C.; Devaney, J.M.; Gordish-Dressman, H.; Harris, T.B.; Thompson, P.D.; Clarkson, P.M.; Angelopoulos, T.J.; Gordon, P.M.; Moyna, N.M.; Pescatello, L.S. A polymorphism near IGF1 is associated with body composition and muscle function in women from the Health, Aging, and Body Composition Study. Eur. J. Appl. Physiol. 2010, 110, 315–324. [Google Scholar] [CrossRef]


| Variables | Mean ± SD (n = 307) |
|---|---|
| Age (years) | 71 ± 6 |
| Mass (kg) | 66.3 ± 11.3 |
| Height (m) | 1.60 ± 0.06 |
| BMI (kg/m2) | 25.9 ± 4.2 |
| HGS (kg) | 29.9 ± 5.0 |
| MVCEF (N·m) | 24.8 ± 6.2 |
| MVCKE (N·m) | 55.1± 18.4 |
| Biceps brachii thickness (cm) | 1.76 ± 0.32 |
| VLACSA (cm2) | 16.3 ± 3.4 |
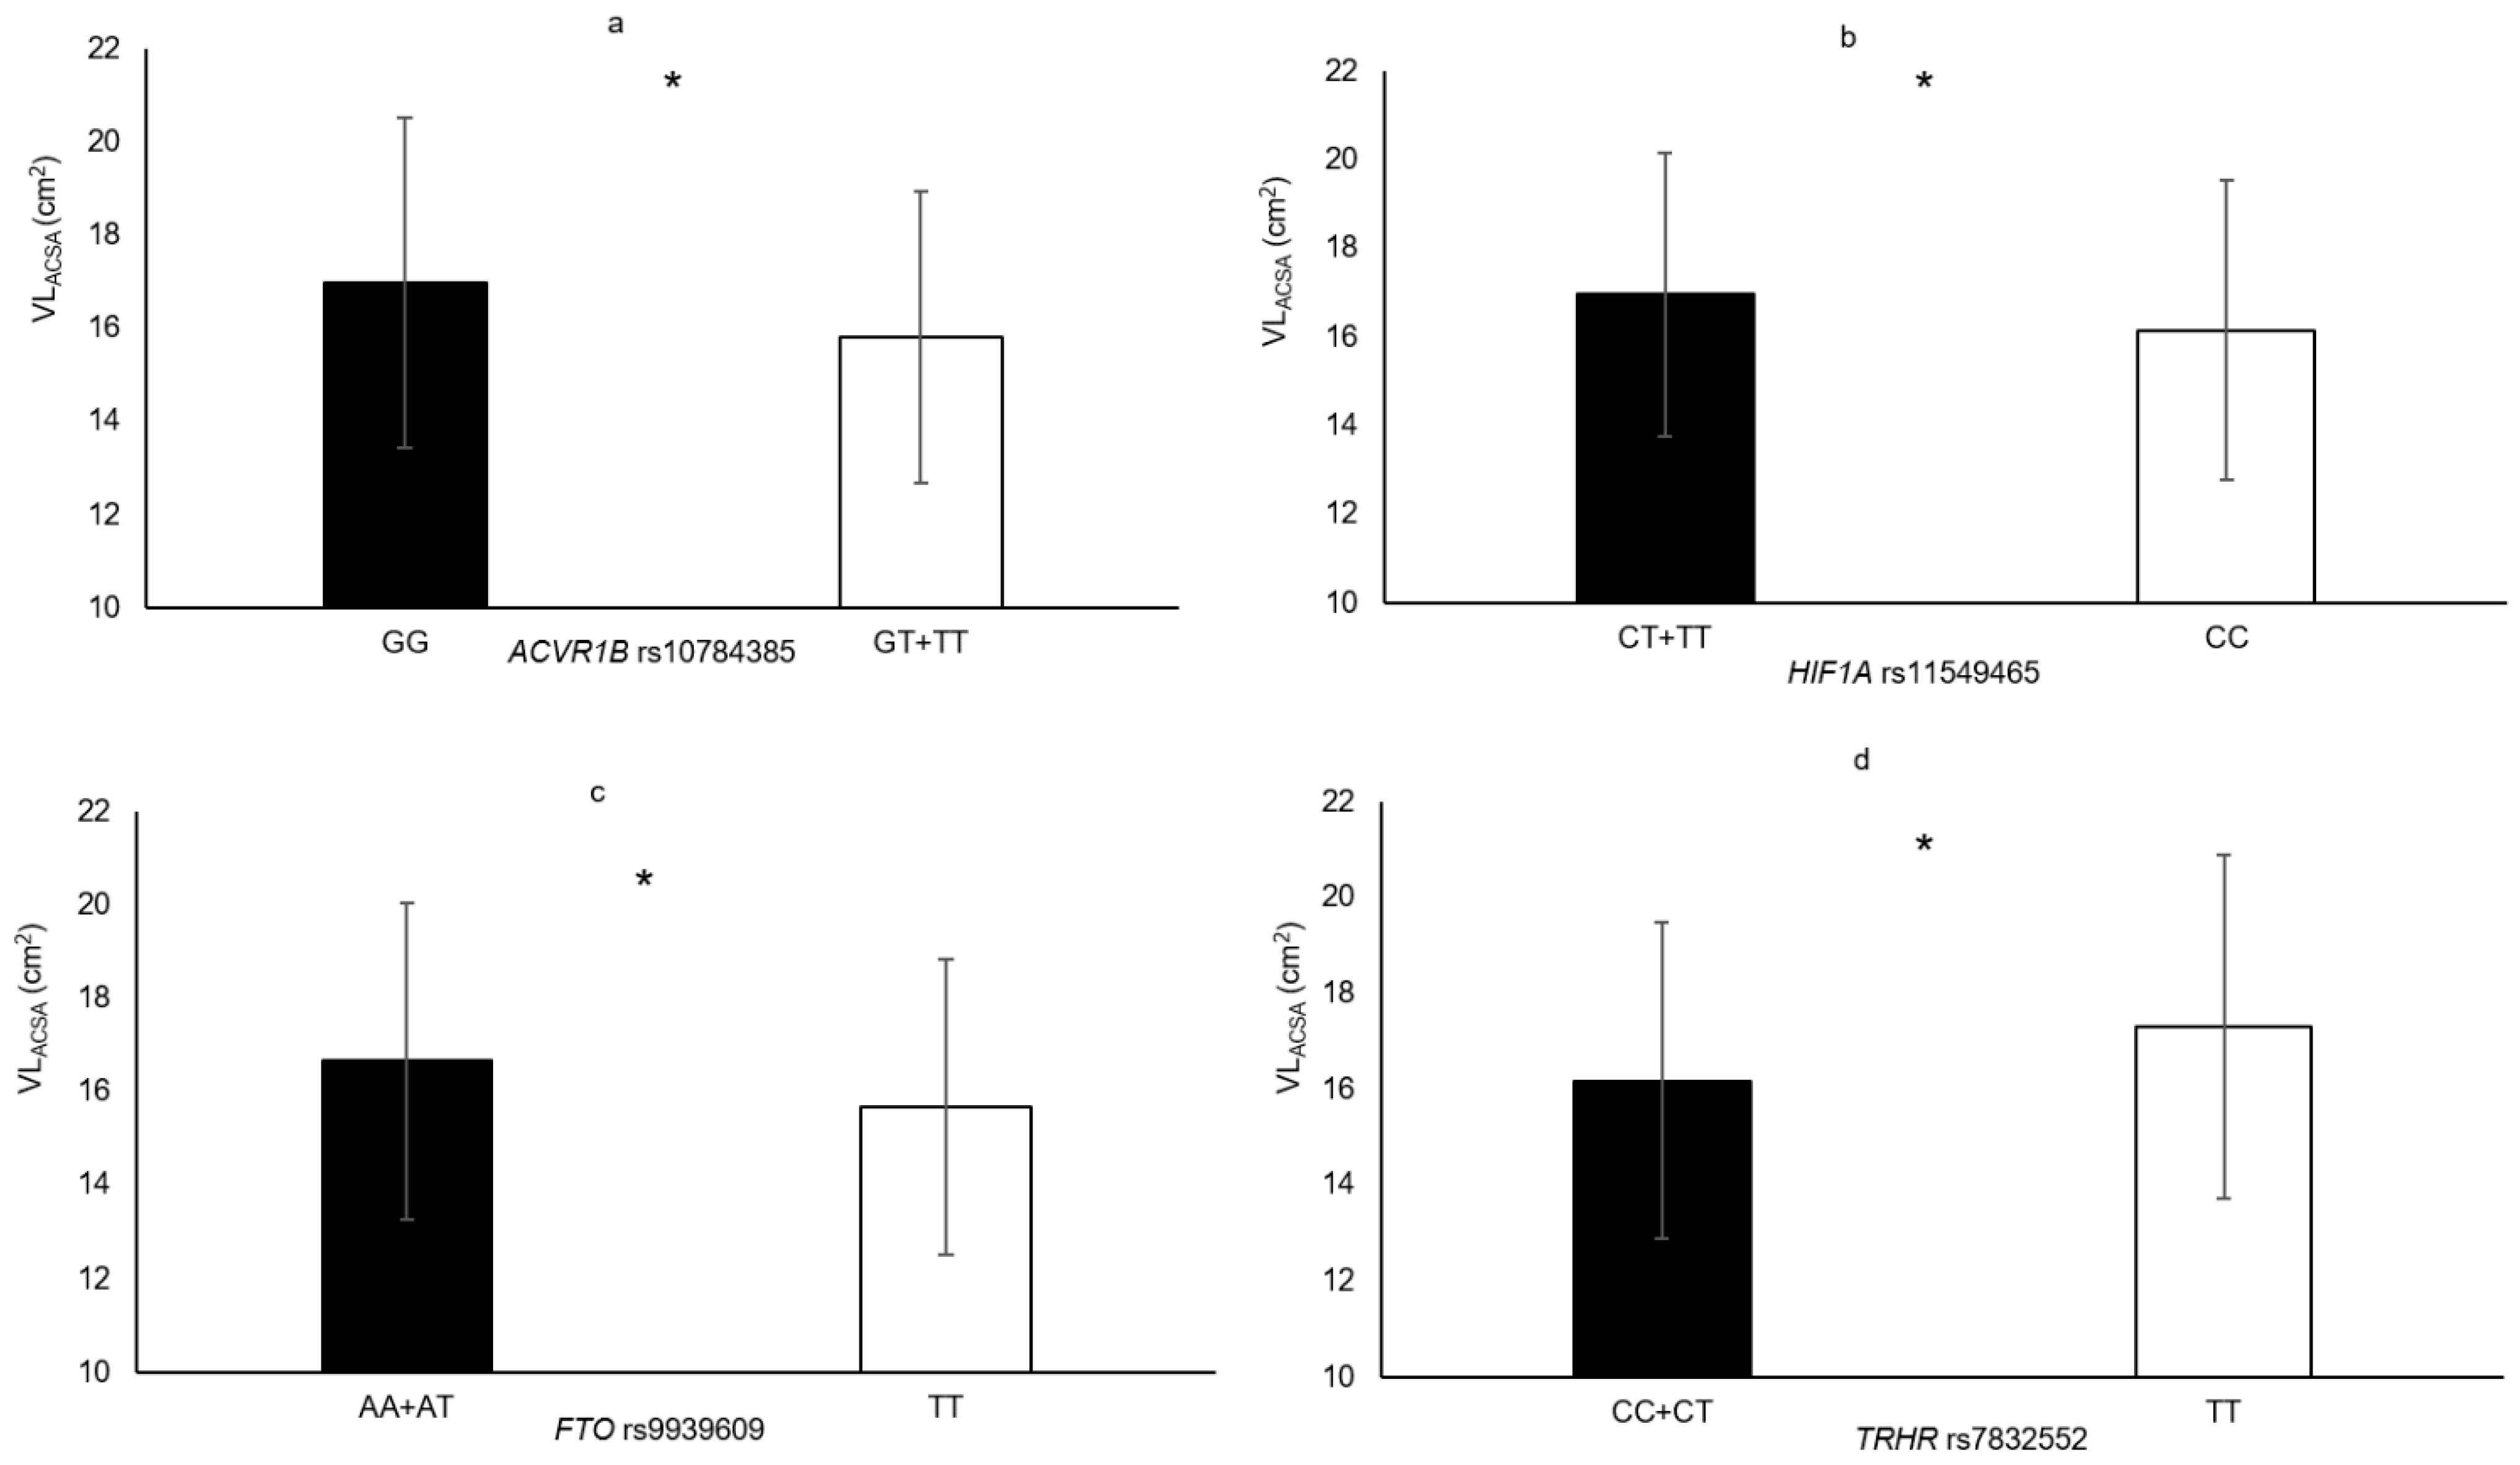
| Polymorphisms | Genotypes | Phenotypes | % Difference | p-Value |
|---|---|---|---|---|
| TRHR rs7832552 | TT vs. CC+CT | VLACSA | 7.0% | 0.036 |
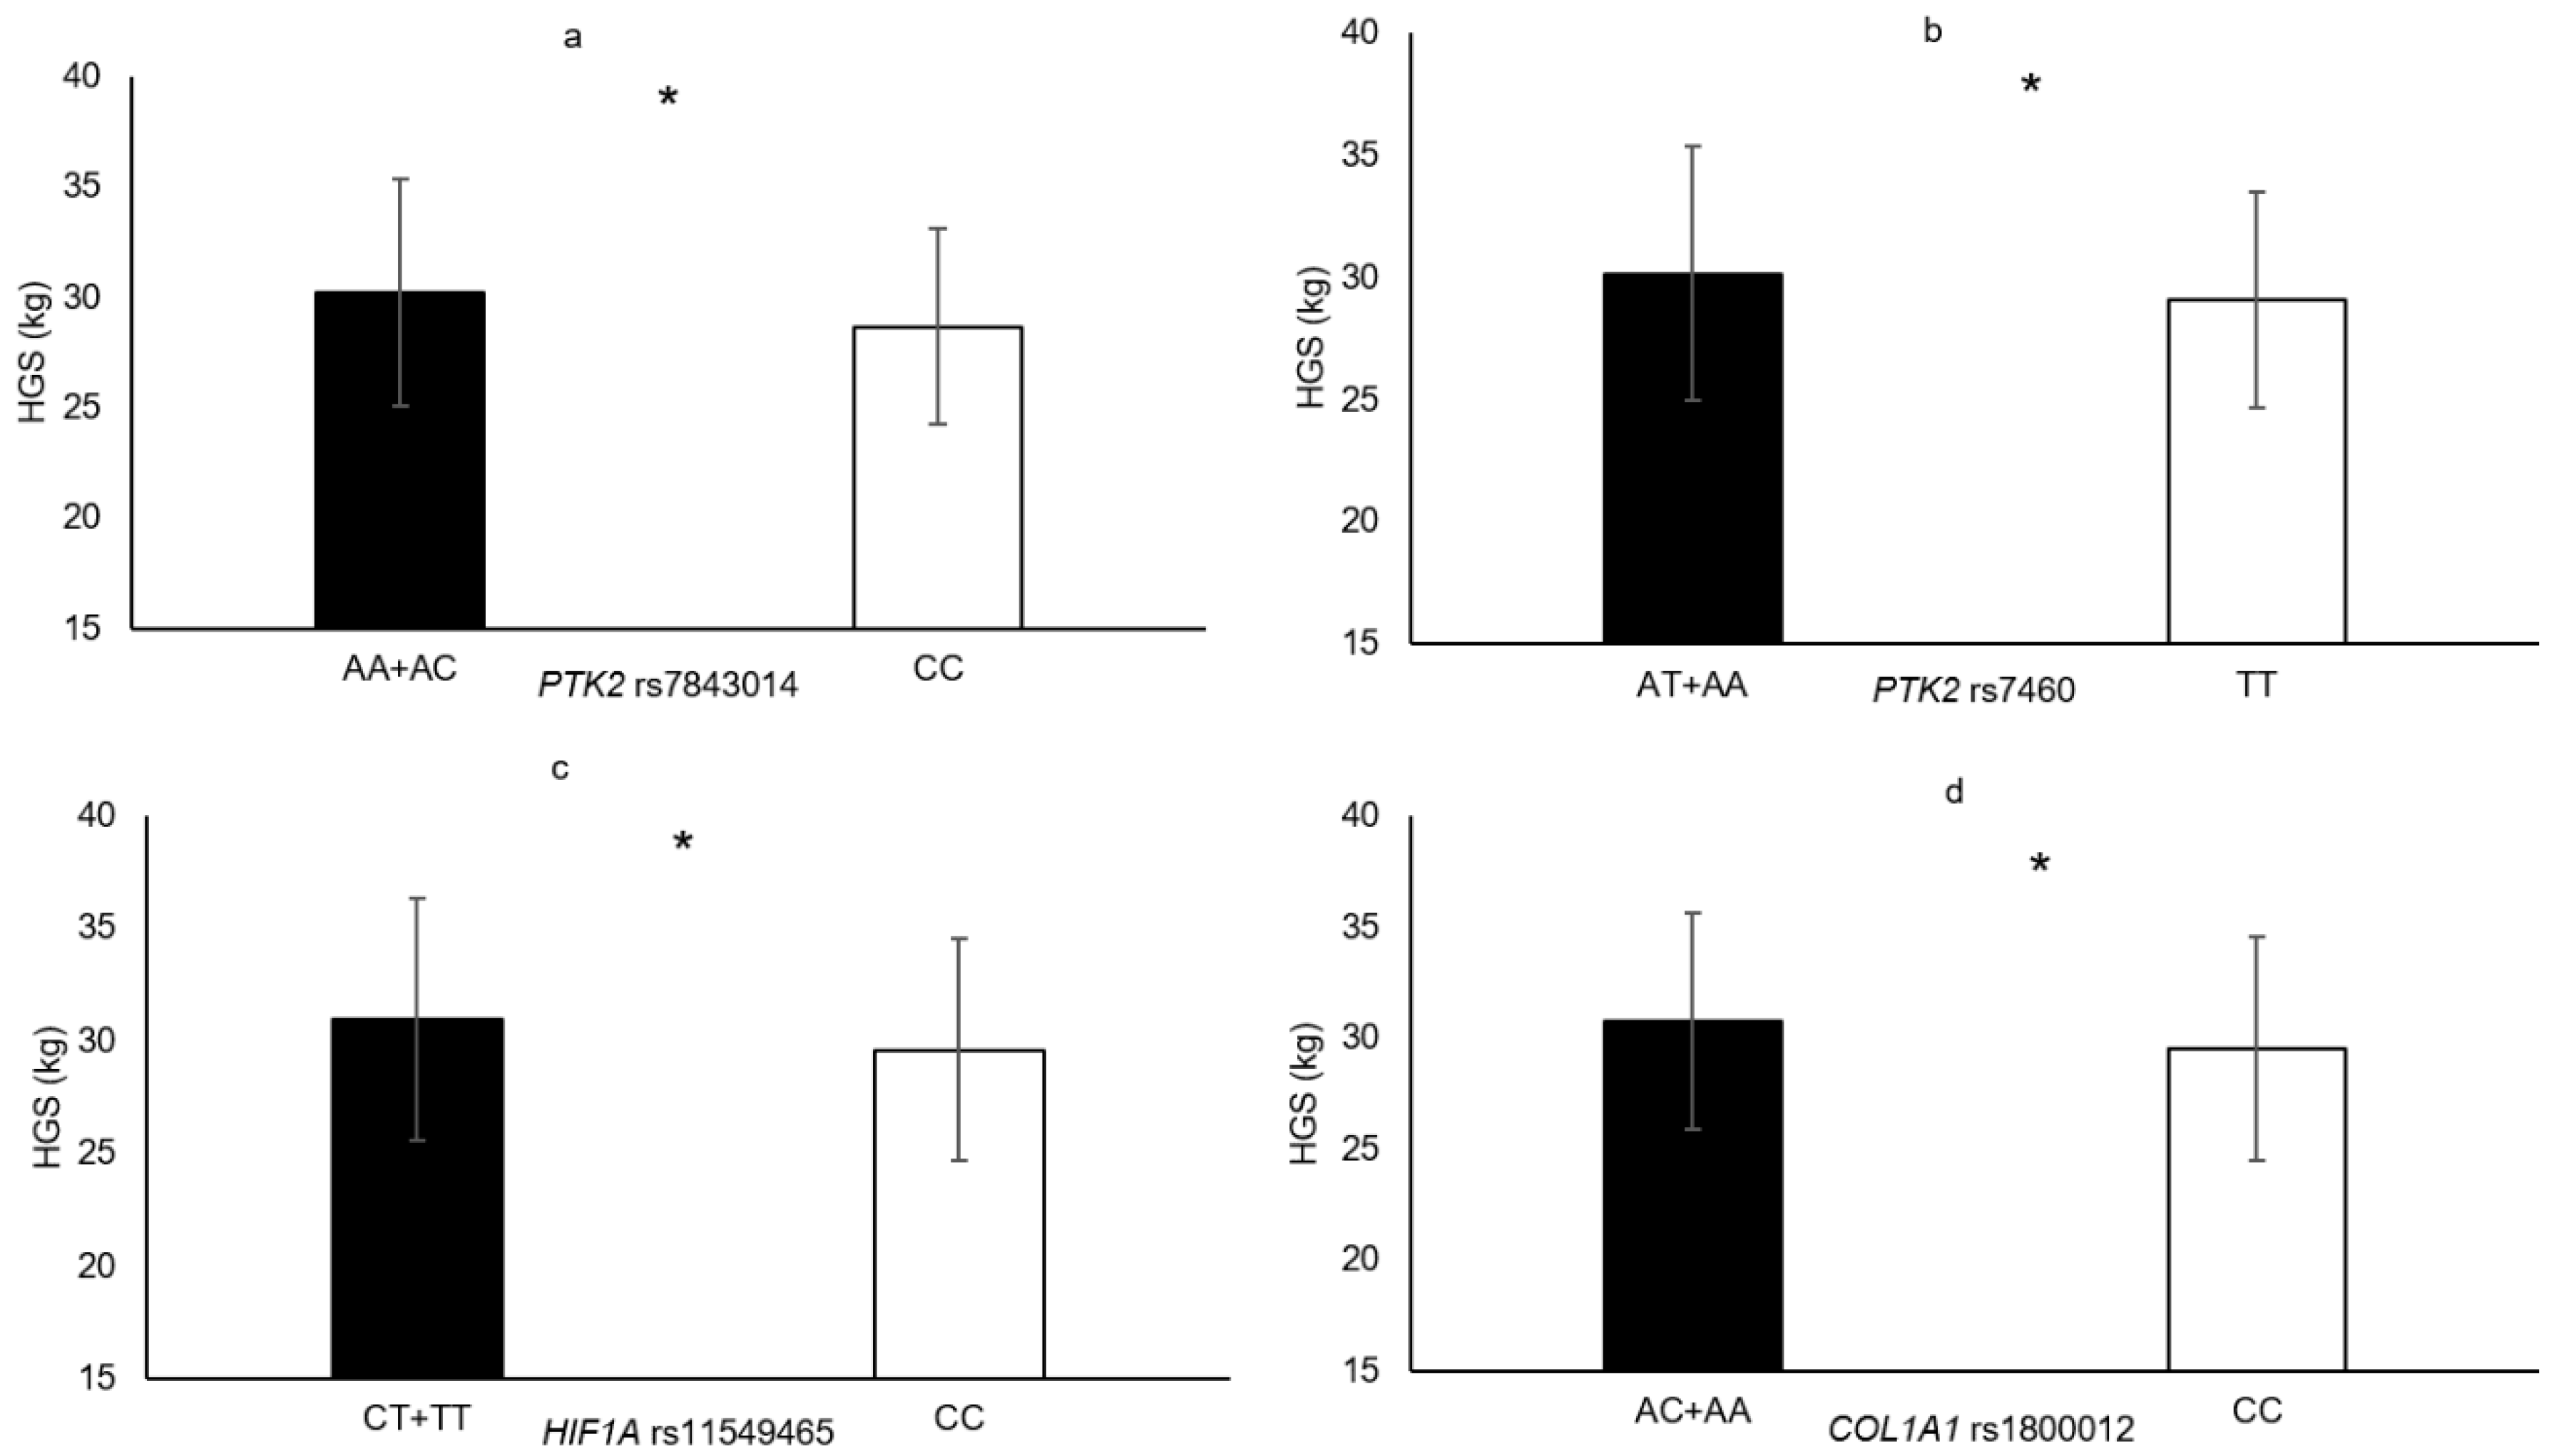
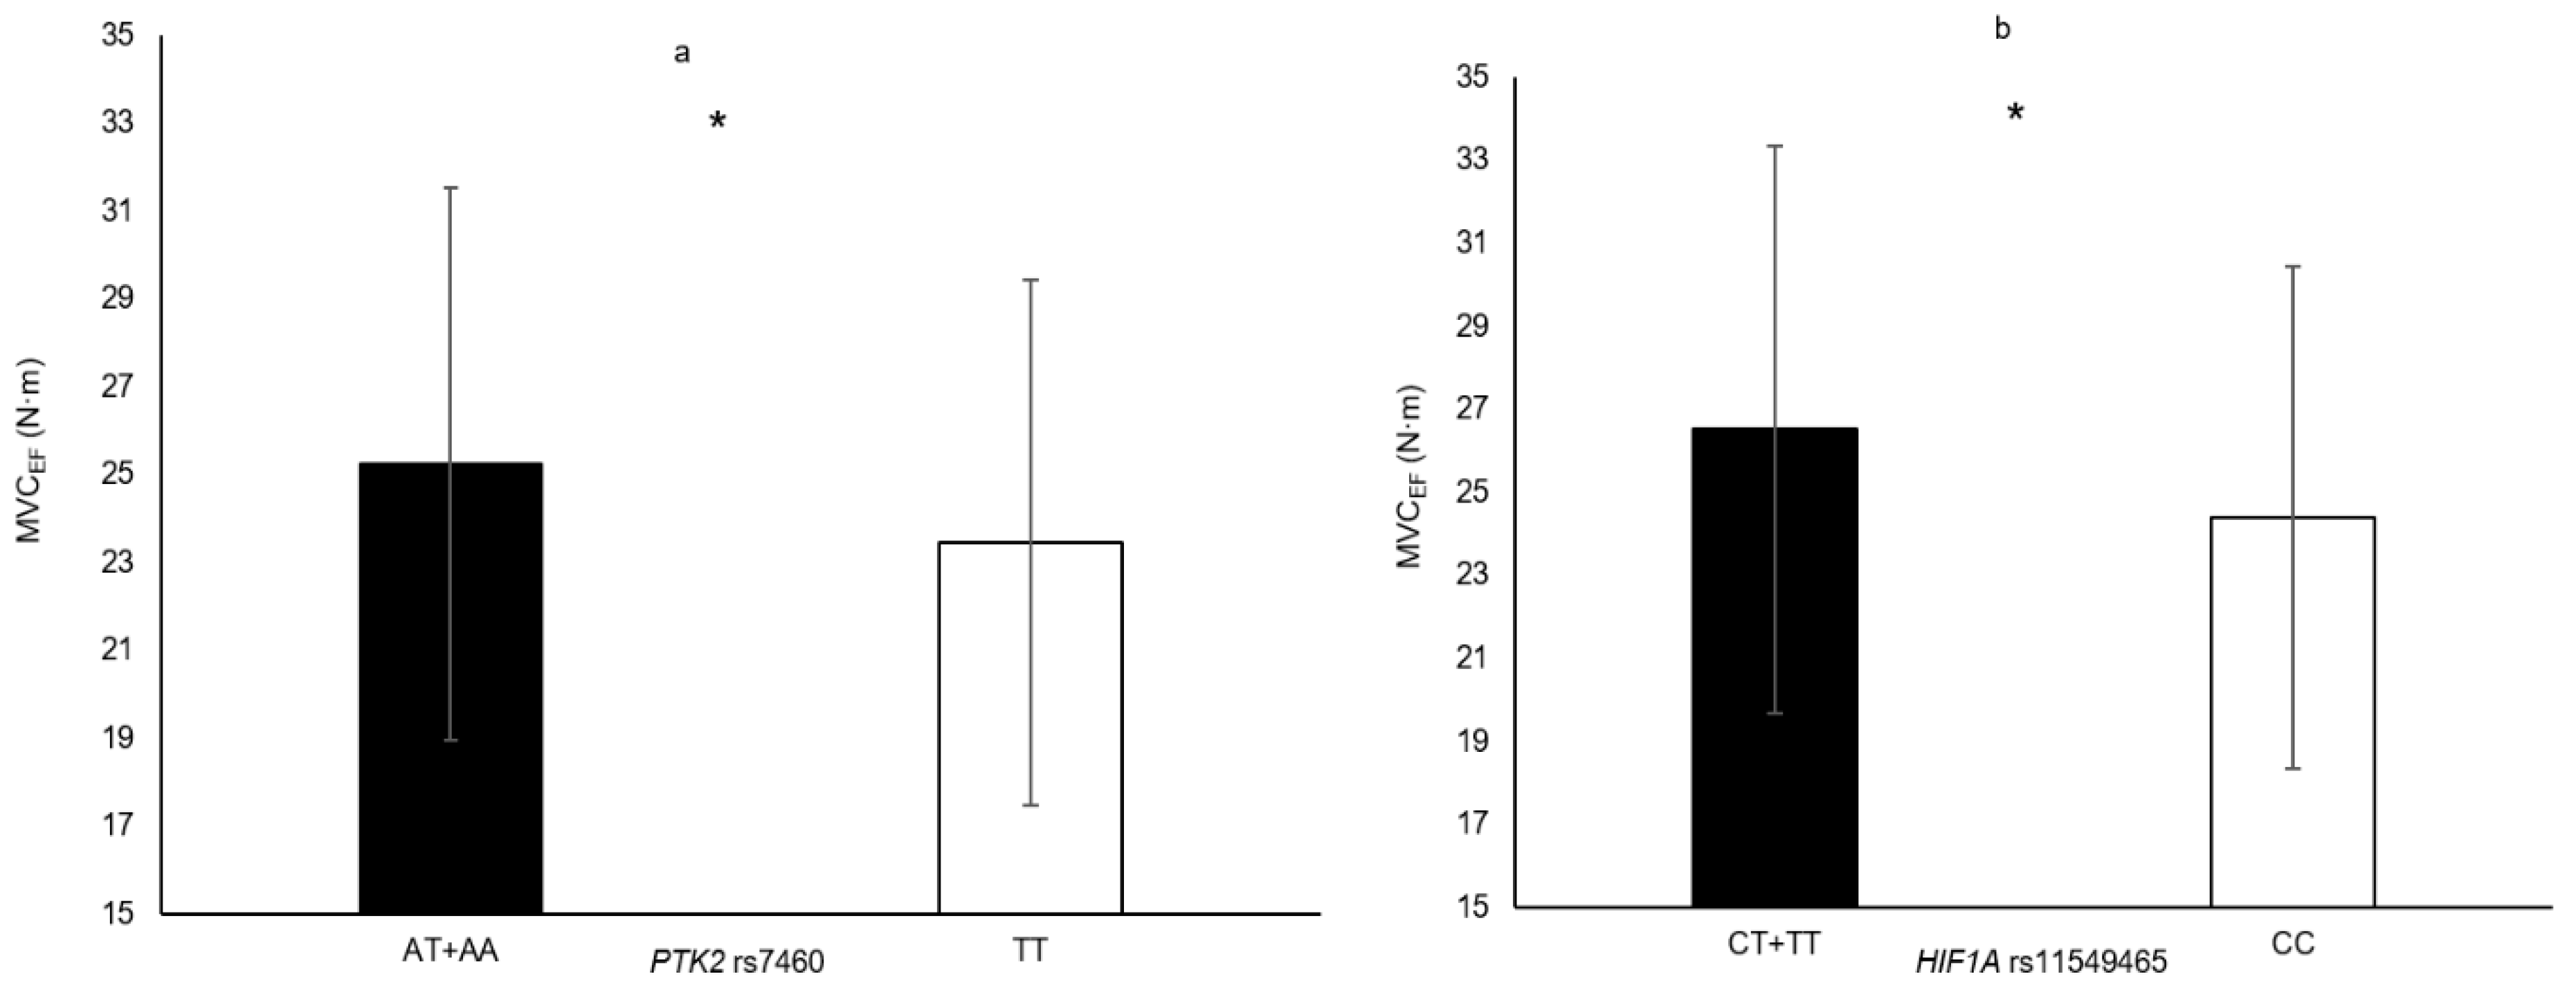
| HIF1A rs11549465 | CT + TT vs. CC | VLACSA HGS MVCEF | 5.0% 4.6% 8.7% | 0.033 0.012 0.007 |
| PTK2 rs7460 | AT + AA vs. TT | MVCEF HGS | 7.7% 3.6% | 0.015 0.042 |
| PTK2 rs7843014 | AC + AA vs. CC | HGS | 5.3% | 0.018 |
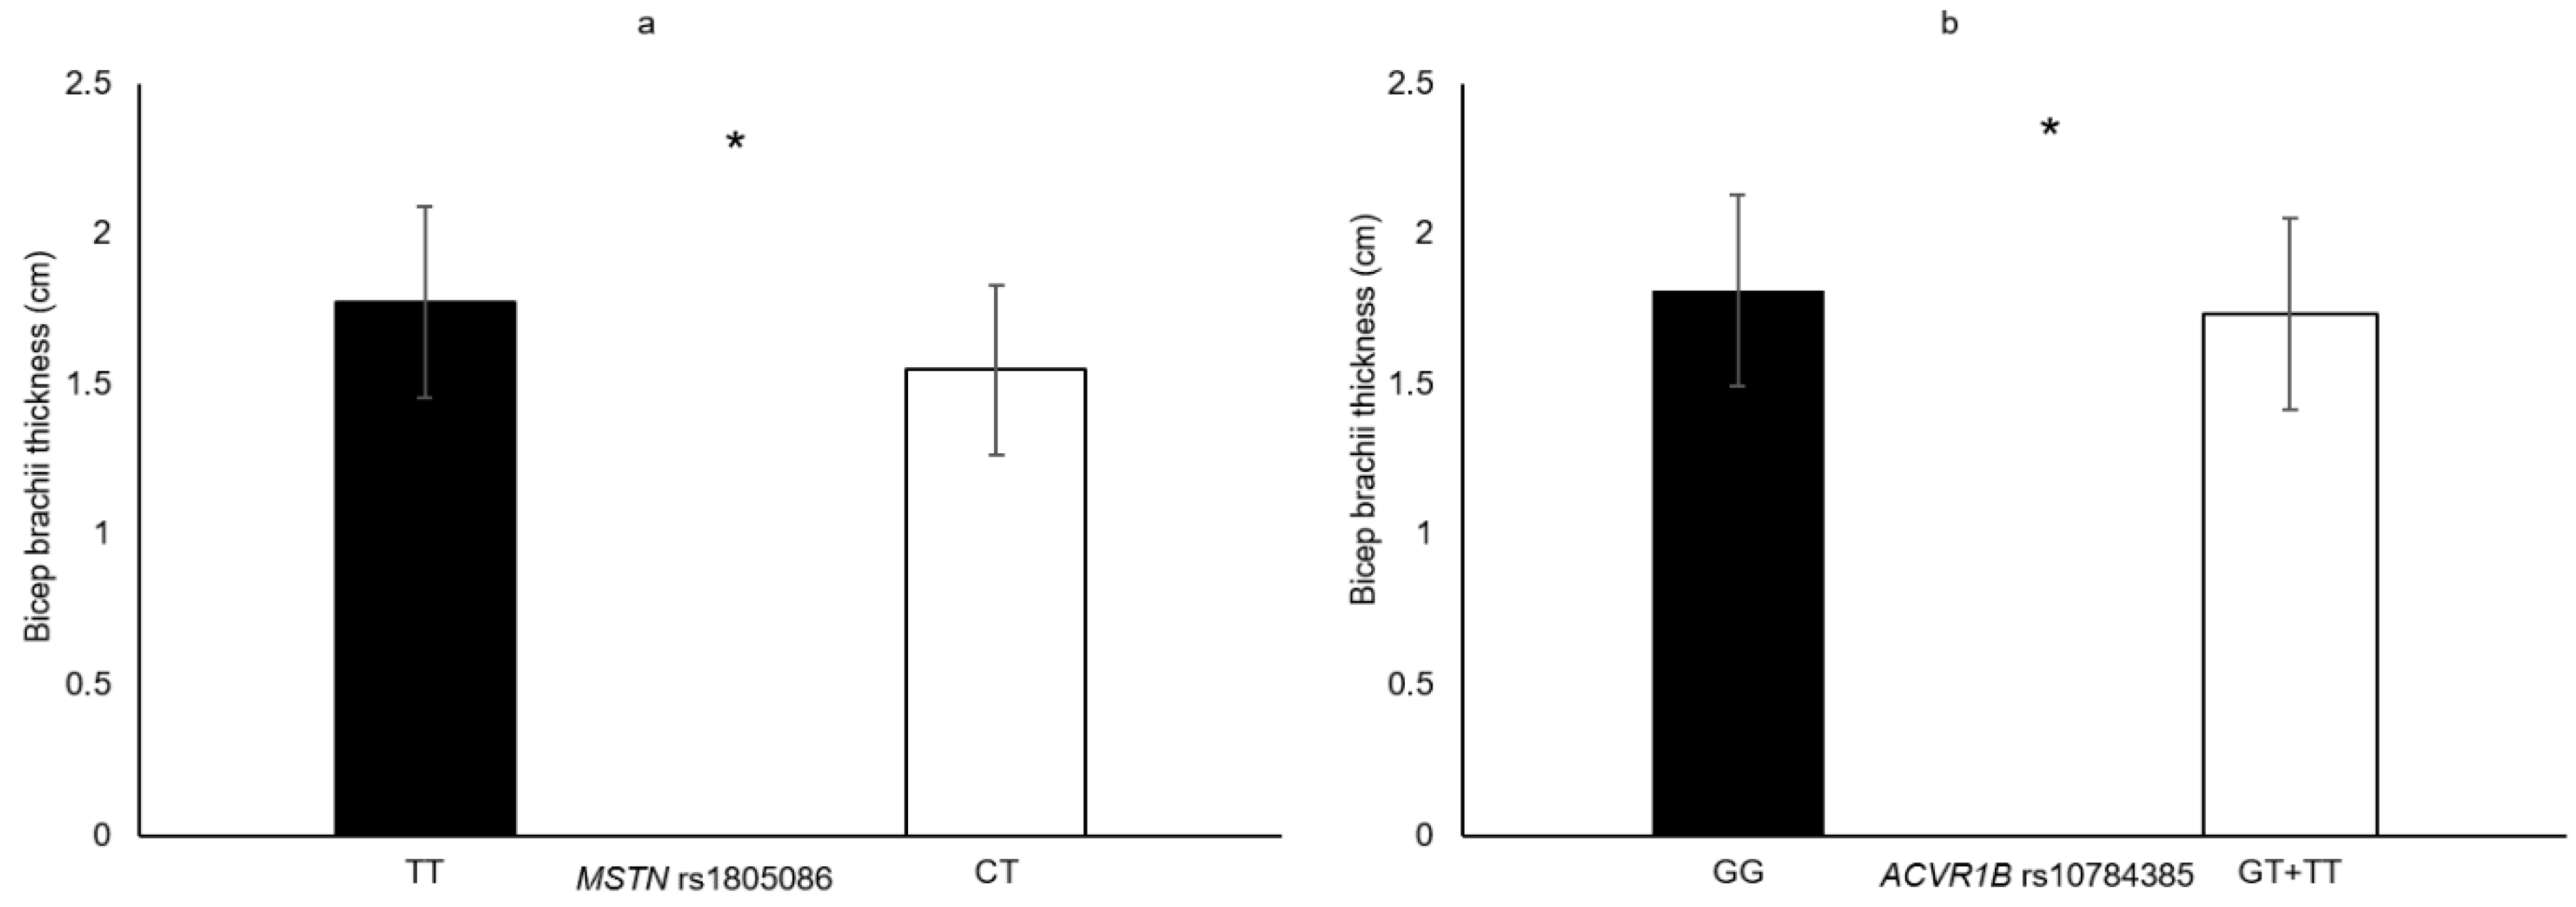
| ACVR1B rs10783485 | GT + TT vs. GG | VLACSA Biceps brachii thickness | 7.3% 4.6% | 0.009 0.045 |
| FTO rs9939609 | TT vs. AA + AT | VLACSA | 6.2% | 0.014 |
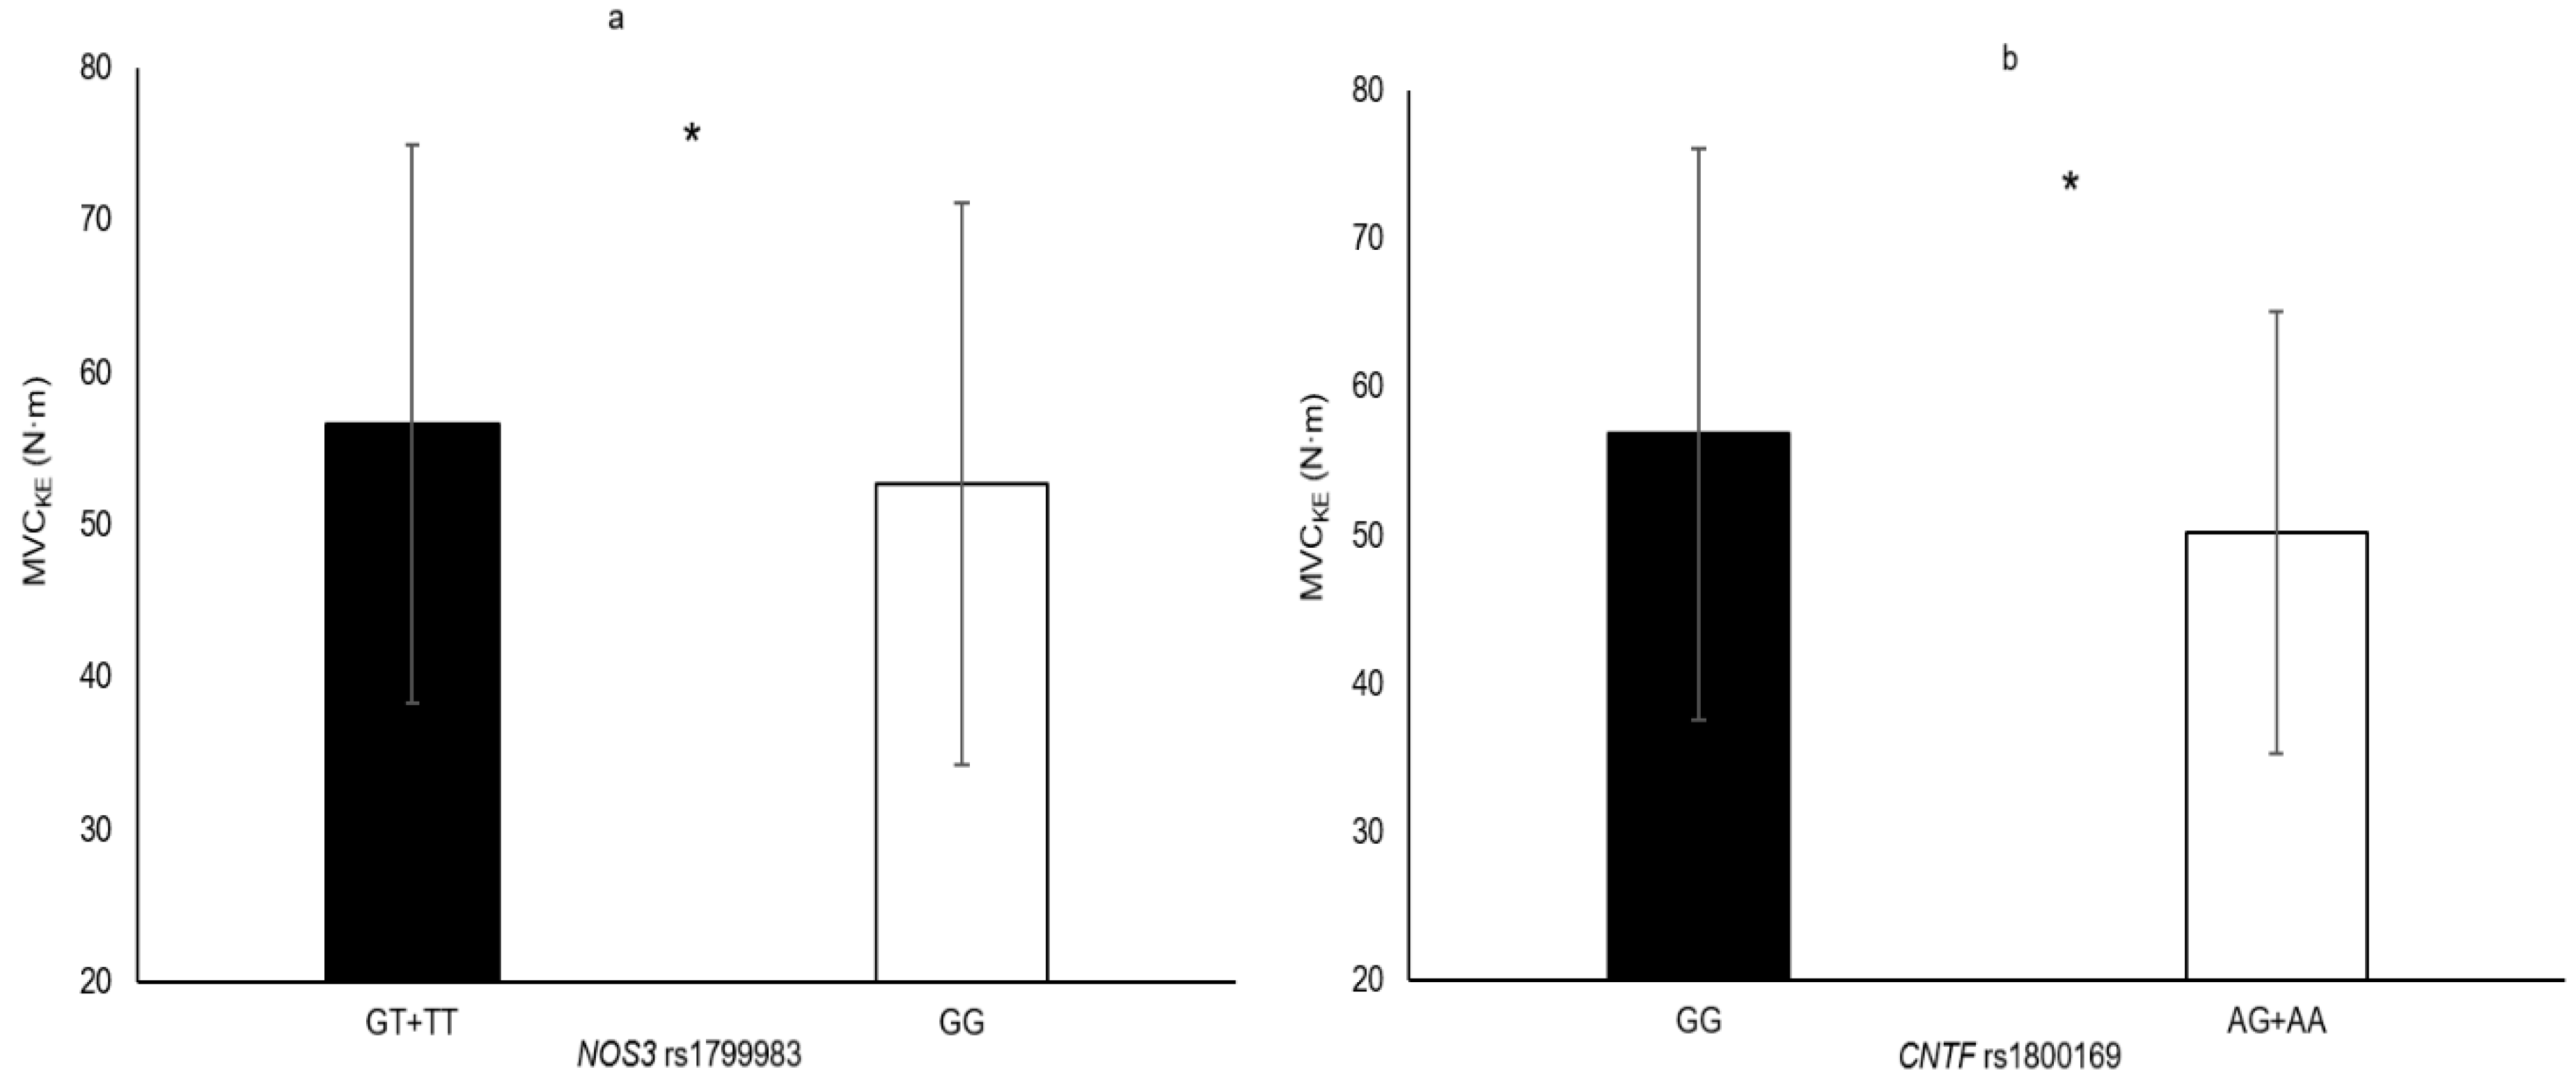
| NOS3 rs1799983 | TT + GT vs. GG | MVCKE | 7.5% | 0.042 |
| CNTF rs1800169 | AA + AG vs. GG | MVCKE | 13.2% | 0.004 |
| MSTN rs1805086 | CT vs. TT | Biceps brachii thickness | 14.7% | 0.035 |
| COL1A1 rs1800012 | AA + AC vs. CC | HGS | 4.1% | 0.013 |
Publisher’s Note: MDPI stays neutral with regard to jurisdictional claims in published maps and institutional affiliations. |
© 2020 by the authors. Licensee MDPI, Basel, Switzerland. This article is an open access article distributed under the terms and conditions of the Creative Commons Attribution (CC BY) license (http://creativecommons.org/licenses/by/4.0/).
Share and Cite
Khanal, P.; He, L.; Herbert, A.J.; Stebbings, G.K.; Onambele-Pearson, G.L.; Degens, H.; Morse, C.I.; Thomis, M.; Williams, A.G. The Association of Multiple Gene Variants with Ageing Skeletal Muscle Phenotypes in Elderly Women. Genes 2020, 11, 1459. https://doi.org/10.3390/genes11121459
Khanal P, He L, Herbert AJ, Stebbings GK, Onambele-Pearson GL, Degens H, Morse CI, Thomis M, Williams AG. The Association of Multiple Gene Variants with Ageing Skeletal Muscle Phenotypes in Elderly Women. Genes. 2020; 11(12):1459. https://doi.org/10.3390/genes11121459
Chicago/Turabian StyleKhanal, Praval, Lingxiao He, Adam J. Herbert, Georgina K. Stebbings, Gladys L. Onambele-Pearson, Hans Degens, Christopher I. Morse, Martine Thomis, and Alun G. Williams. 2020. "The Association of Multiple Gene Variants with Ageing Skeletal Muscle Phenotypes in Elderly Women" Genes 11, no. 12: 1459. https://doi.org/10.3390/genes11121459
APA StyleKhanal, P., He, L., Herbert, A. J., Stebbings, G. K., Onambele-Pearson, G. L., Degens, H., Morse, C. I., Thomis, M., & Williams, A. G. (2020). The Association of Multiple Gene Variants with Ageing Skeletal Muscle Phenotypes in Elderly Women. Genes, 11(12), 1459. https://doi.org/10.3390/genes11121459