Article

bta-miR-23a Regulates the Myogenic Differentiation of Fetal Bovine Skeletal Muscle-Derived Progenitor Cells by Targeting MDFIC Gene

1
Institute of Animal Sciences, Chinese Academy of Agricultural Sciences, Beijing 100193, China
2
Molecular and Cellular Biology, Gembloux Agro-Bio Tech, University of Liège, 5030 Gembloux, Belgium
3
Department of Molecular, Cell and Cancer Biology, University of Massachusetts Medical School, Worcester, MA 01655, USA
4
Washington Center for Muscle Biology and Department of Animal Sciences, Washington State University, Pullman, WA 99164, USA
*
Author to whom correspondence should be addressed.
Genes 2020, 11(10), 1232; https://doi.org/10.3390/genes11101232
Submission received: 24 August 2020 / Revised: 30 September 2020 / Accepted: 17 October 2020 / Published: 20 October 2020

Abstract

:
miR-23a, a member of the miR-23a/24-2/27a cluster, has been demonstrated to play pivotal roles in many cellular activities. However, the mechanisms of how bta-miR-23a controls the myogenic differentiation (MD) of PDGFRα bovine progenitor cells (bPCs) remain poorly understood. In the present work, bta-miR-23a expression was increased during the MD of PDGFRα− bPCs. Moreover, bta-miR-23a overexpression significantly promoted the MD of PDGFRα− bPCs. Luciferase reporter assays showed that the 3’-UTR region of MDFIC (MyoD family inhibitor domain containing) could be a promising target of bta-miR-23a, which resulted in its post-transcriptional down-regulation. Additionally, the knockdown of MDFIC by siRNA facilitated the MD of PDGFRα− bPCs, while the overexpression of MDFIC inhibited the activating effect of bta-miR-23a during MD. Of note, MDFIC might function through the interaction between MyoG transcription factor and MEF2C promoter. This study reveals that bta-miR-23a can promote the MD of PDGFRα− bPCs through post-transcriptional downregulation of MDFIC.

1. Introduction

The development of skeletal muscles can occur as early as the embryonic period [1]. During the embryonic process, the first myogenesis wave involves the formation of primary myofibers, while the second myogenesis wave facilitates the production of secondary myofibers that account for the majority of skeletal muscle fibers. Considering that there is no available information on the increased number of muscle fibers following birth, the embryo-fetal stage can be considered a great determinant of skeletal muscle development [2,3,4]. Differentiation of skeletal muscles involves complex and multilevel processes, and such complex differentiation processes are orchestrated by a variety of myogenic regulatory factors, such as myogenic differentiation (MyoD), myogenin (MyoG), myogenic factor 5 (Myf5), and myogenic factor 6 (Myf6). MyoD and Myf5 are both transcription factors for initiating myogenic commitment [5]. Myf6 is involved in the processes of differentiation and maturation of myotubes during embryogenesis [6]. MyoG is essential for the terminal differentiation of skeletal myoblasts to form myotubes [7]. There are four types of myosin heavy-chain (MyHC) isoforms in skeletal muscles, including type I, IIa, IIx, and IIb. These isoforms are encoded by MyHC 7, MyHC 2, MyHC 1, and MyHC 4 genes, respectively. Extensive research shows that different MyHC isoforms have considerable effects on meat quality. Type I muscle fibers are thinner, and a high type I muscle fibers ratio is beneficial for improving meat tenderness [8]. Furthermore, other research also found that muscle with a higher type I muscle fiber ratio contained more intramuscular fat. The cross-sectional region of type II muscle fibers is also greater, and an elevated type II fiber ratio can lead to increases in muscle mass and animal weight [9].
MicroRNA is an endogenous, small non-coding RNA of ~22 nucleotides, which negatively modulates gene expression levels by repressing translation and degradation of mRNA through binding to 3’-UTR (3’-untranslated region) [10,11]. Emerging evidence has indicated that a number of miRNAs can play vital roles during muscle development. For instance, miR-1, -133, and -206 have been recognized as muscle-specific miRNAs that modulate the function of skeletal muscles. miR-1 and -206 modulate the satellite cell MD of bovine skeletal muscles by downregulating histone deacetylase 4 (HDAC4) and paired box 7 (Pax7) expression [12]. According to the findings of miRNA microarray and sequencing analysis, miR-1, −133 and −206 are remarkably upregulated during the MD of bovine satellite cells [13,14]. Moreover, non-muscle-specific miRNAs can also regulate the development of bovine skeletal muscles. In Qinchuan cattle, miR-101-1 is enriched in skeletal muscles, and negatively regulates the differentiation of C2C12 cells [15]. In addition, miR-27b plays prominent roles in the development and hypertrophy of bovine skeletal muscles [16]. In bovine myoblast cells, miR-483 suppresses bovine myoblast cell growth and differentiation by negatively regulating IGF1/PI3K/AKT pathway [17]. Some research showed that miR-23a suppressed the translation of MuRF1 and MAFbx/atrogin-1 in a 3’-UTR-dependent fashion, and its forced expression in myofibers and myotubes could prevent muscle atrophy [18]. In addition to that, miRNA-23a has been reported as a critical regulator in colorectal cancer [19,20], lung cancer [21], pancreatic cancer [22], gastric cancer [23] and hepatocellular carcinoma [24]. Our previous work also found that miR-23a was highly upregulated during MD. Nevertheless, the impact of miR-23a on the MD of fetal bovine skeletal muscles has yet to be determined.
MDFIC (MyoD family inhibitor domain containing) belongs to a small family of proteins encompassing the cysteine-rich C-terminal domain [25,26]. Whilst, MyoD family inhibitor isoform 1 (MDFI, or named as I-mf or I-mfa) is another member of this family. The cysteine-rich C-terminal domain of MDFIC contains 81 amino acids, which is 77% identical to that of MDFI. Approximately 26 and 24 cysteine residues are found in the C-terminal domains of MDFI and MDFIC, respectively. MDFI restricts the transactivation functions of MyoD family members and prevents MD through binding the basic helix-loop-helix (bHLH) domain of MyoD with cysteine-rich domain [27]. MDFI regulates myogenesis by preventing DNA binding and nuclear localization of MyoD and bHLH proteins [28]. Although MDFIC shares relatively high identity with MDFI based on their amino acid sequences, the functional role of MDFIC in myogenesis has not been addressed. A genome-wide association study on pig has identified MDFIC as a candidate gene for determining piglet birth weight [29].
Hence, the current research aimed to identify the roles of bta-miR-23a in the differentiation of fetal bovine myogenic cells, and its relationship with MDFIC. The findings demonstrated that bta-miR-23a could promote myoblast differentiation via targeting MDFIC. Overall, this study provides new evidence supporting the potential application of bta-miR-23a for preventing muscle atrophy.

2. Materials and Methods

2.1. Animal Ethics Statement

The experiment was carried out in strict accordance with the guidelines of the Regulations for the Administration of Affairs Concerning Experimental Animals (Ministry of Science and Technology, China). The ethical approval was obtained from the Institutional Animal Ethics Committee, Chinese Academy of Agricultural Sciences, China (No. IAS2019-48). Pregnant cattle were raised by the Aokesi Agricultural Technology Co., Ltd. (Inner Mongolia, China). Every effort was made to reduce the suffering of pregnant cattle.

2.2. Cell Culture and Treatment

bPCs were enzymatically isolated from the bovine fetus-derived longissimus dorsi tissues at 90–120 days according to previously reported method [30]. Longissimus dorsi was cut into smaller pieces with scissors, and then digested with 0.1% type-IV collagenase (Sigma-Aldrich, St. Louis, MO, USA) at 37 °C. Digestions were terminated by low-glucose DMEM (Gibco, Grand Island, NY, USA) containing 10% fetal bovine serum (FBS; Gibco) after 1 hour. After filtering through a 40-μm nylon mesh, the filtered cells were collected through centrifugation, and then resuspended in ice-cold phosphate-buffered saline (PBS) buffer with 0.5% bovine serum albumin (BSA) and 2 mM EDTA. The cells were then pretreated with anti-platelet-derived growth factor receptor α (PDGFRα) antibody for 30 m at 4 °C. Washing and resuspending with PBS first and incubating with Anti-Rabbit IgG MicroBeads (Miltenyi Biotec, Bergisch Gladbach, Germany) for 15 minutes at 4 °C. After harvesting and resuspending in buffer, the cells were subjected to magnetic separation with the Mini-MACS system (Miltenyi Biotec). The obtained cells were then cultured in DMEM containing 10% FBS, followed by incubation at 37 °C (5% CO2 atmosphere). Upon reaching 70–80% confluency, the cells were detached using trypsin-EDTA (0.25%; Gibco) and subjected to passaging. When achieving 100% confluency [day 0 (D0)], the cells were differentiated to day 2 (D2), day 3(D3), and day 5 (D5) in DMEM containing 5% horse serum (Gibco).
HEK293 (human embryonic kidney 293) cells were cultured in DMEM medium containiing 10% FBS, 100 U/mL penicillin and 100 μg/mL streptomycin, followed by incubation at 37 °C (5% CO2 atmosphere).

2.3. RNA Extration and Real-Time PCR Assay

TRIzol reagent (Invitrogen, Carlsbad, CA, USA) was utilized to isolate total RNA from the culturing cells. The yield and quality of RNA were evaluated by an Implen NanoPhotometer N50 (Munich, Germany) and 1% agarose gel electrophoresis, respectively. The results showed three clear rRNA bands of 28S, 18S, and 5S. The ratio of the optical densities measured at 260 and 280 nm were >1.9 for all RNA samples. The conversion of 500 ng total RNA to cDNA was initiated with PrimeScript RT Master Mix (TaKaRa Bio, Kusatsu, Japan), while the reverse transcription reaction for miRNA was conducted with miRcute miRNA First-Stand cDNA Synthesis Kit (TIANGEN, Beijing, China). The real-time PCR reactions were carried out in triplicate on a QuantStudio™ 7 Flex RT-PCR System using KAPA SYBR® FAST qPCR Kit (KAPABiosystems, Wilmington, MA, USA) and miRcute miRNA qPCR Kit (TIANGEN). PCR primers for amplification of mRNA and miRNA-specific add the poly(A)-tail primers were designed by Primer Premier 5.0 and synthesized by ShengGong. All experiments were conducted as per the manufacturer’s recommended protocols. The primer sequences for mRNA and miRNA detection are listed in Table 1.

2.4. Immunofluorescence Assay

First, the cells in 12-well plate were fixed in 4% paraformaldehyde for 15 minutes and rinsed 3 times for 5 minutes each in PBS. Then, the cells were permeabilized with 0.1% Triton X-100 for 10 minutes, followed by blocking with 1% BSA (Beyotime, Shanghai, China) for 30 minutes. Next, the cells were incubated with anti-MyHC antibody (1:100; Developmental Studies Hybridoma Bank [DSHB], Iowa City, IA, USA) at 4 °C overnight, and then with FITC-labeled Goat Anti-Mouse IgG (H + L; 1:1000; Beyotime) at room temperature for 1 hour. After DAPI (Sigma-Aldrich) staining for 5 minutes, the cell nuclei were examined using a TCS SP8 confocal microscope (Leica, Wetzlar, Germany).

2.5. Western Blotting

Total protein was isolated using the proteinase inhibitor-containing lysis buffer. Equivalent amounts of protein were separated on a 4–12% SurePAGE gel (GenScript, Nanjing, China). After electrophoresis, the separated proteins were placed onto a nitrocellulose membrane (Pall, Mexico), and then inhibited with 5% (w/v) skimmed milk. The blocked membrane was incubated overnight at 4°C with MDFIC (1:500; Biorbyt, Cambridge, UK), MyoG (1:1000; Santa Cruz, CA, USA), MyHC (1:50; DSHB, USA) or β-tubulin (1:2000; Proteintech, Chicago, IL, USA). After rinsing 3 times in Tris-buffered saline/Tween, the membranes were incubated with the corresponding HRP-labeled Goat Anti-Rabbit IgG (1:1000; Beyotime) or HRP-labeled Goat Anti-Mouse IgG (1:1000; Beyotime) for 1 hour at room temperature. The protein blots were visualized using the Enhanced Chemiluminescent Reagent (Beyotime).

2.6. RNA Oligonucleotides, Plasmids Construction and Cell Transfection

The design and synthesis of bta-miR-23a mimic, mimic negative control (NC), small interfering RNAs (siRNAs) for MDFIC knockdown and non-targeting siRNA NC were performed by RiboBio (Guangzhou, China). The sequence of si-MDFIC was GAATCGAAGACTTTCAGCA. The 3’-UTR region of MDFIC encompassing bta-miR-23a binding site was amplified and cloned into the XhoI/NotI restriction sites of psi-CHECK2 vectors (Promega, Madison, WI, USA). Then, site-directed mutagenesis was carried out using the Fast Site-Directed Mutagenesis Kit (TIANGEN).
To obtain the MDFIC overexpression plasmid, MDFIC open reading frame sequence was amplified and cloned into pBI-CMV3 vector (Clontech, Mountain View, CA, USA) using ClonExpress MultiS One Step Cloning Kit (Vazyme, Nanjing, China). MEF2C promoter sequence was taken out and cloned into pGL3-basic vector by using ClonExpress MultiS One Step Cloning Kit (Vazyme). The primer sequences used for plasmid construction and mutagenesis are listed in Table 2.
Cell transfection was conducted with Lipofectamine RNAiMAX reagent (Invitrogen), along with bta-miR-23a mimic, NC, si-MDFIC and si-NC. Plasmid transfection was carried out with Lipofectamine 3000 (Invitrogen). All assays were conducted as per the manufacturer’s protocols.

2.7. Bioinformatic Analyses

TargetScanHuman 7.2 (http://www.targetscan.org/vert_72/) was employed for the prediction of the target genes of bta-miR-23a. The predicted target genes with a context ++ score lower than −0.3 were selected for Gene Ontology (GO) and Kyoto Encyclopedia of Genes and Genomes (KEGG) pathway enrichment analyses were performed using the web-based DAVID bioinformatics resources 6.8 (https://david.ncifcrf.gov/home.jsp) and KOBAS 3.0 (http://kobas.cbi.pku.edu.cn/kobas3). All GO terms and KEGG pathways with p-value below 0.05 and a minimum of 5 genes were chosen for subsequent analyses.

2.8. Dual-Luciferase Reporter Assay

For luciferase detection, the HEK293 cell line was co-transfected with bta-miR-23a mimic or NC and the wild-type or mutant plasmid in a 96-well plate using the Lipofectamine 3000 reagent (Invitrogen). PDGFRα− bovine progenitor cells seeded in a 48-well plate and co-transfected with plasmid of MEF2C promoter sequence with OV-MDFIC or si-MDFIC. After transfection for 48 h, the activities of luciferase reporter (LR) were evaluated using a Dual-LR Assay System (Promega).

2.9. Statistical Analysis

The comparative (2-ddCt) method was used to present relative mRNA expression level. The protein level was normalized to β-tubulin. Differentiation index was the percentage of nuclei in MyHC–positive cells. The relative luciferase activity was monitored by renilla/firefly. The results of the qPCR, differentiation index and luciferase reporter assays from the cell culture experiments are presented as independent biological replicates, while the tissue qPCR analyses were analyzed using three individual biological replicates. The data were plotted by GraphPad Prism ver. 6.0 (GraphPad Software Inc., San Diego, CA, USA) and represented as the mean (± standard deviation (SD)). The difference was considered as statistically significant when the p-value < 0.05 (*) or p-value < 0.01 (**)

3. Results

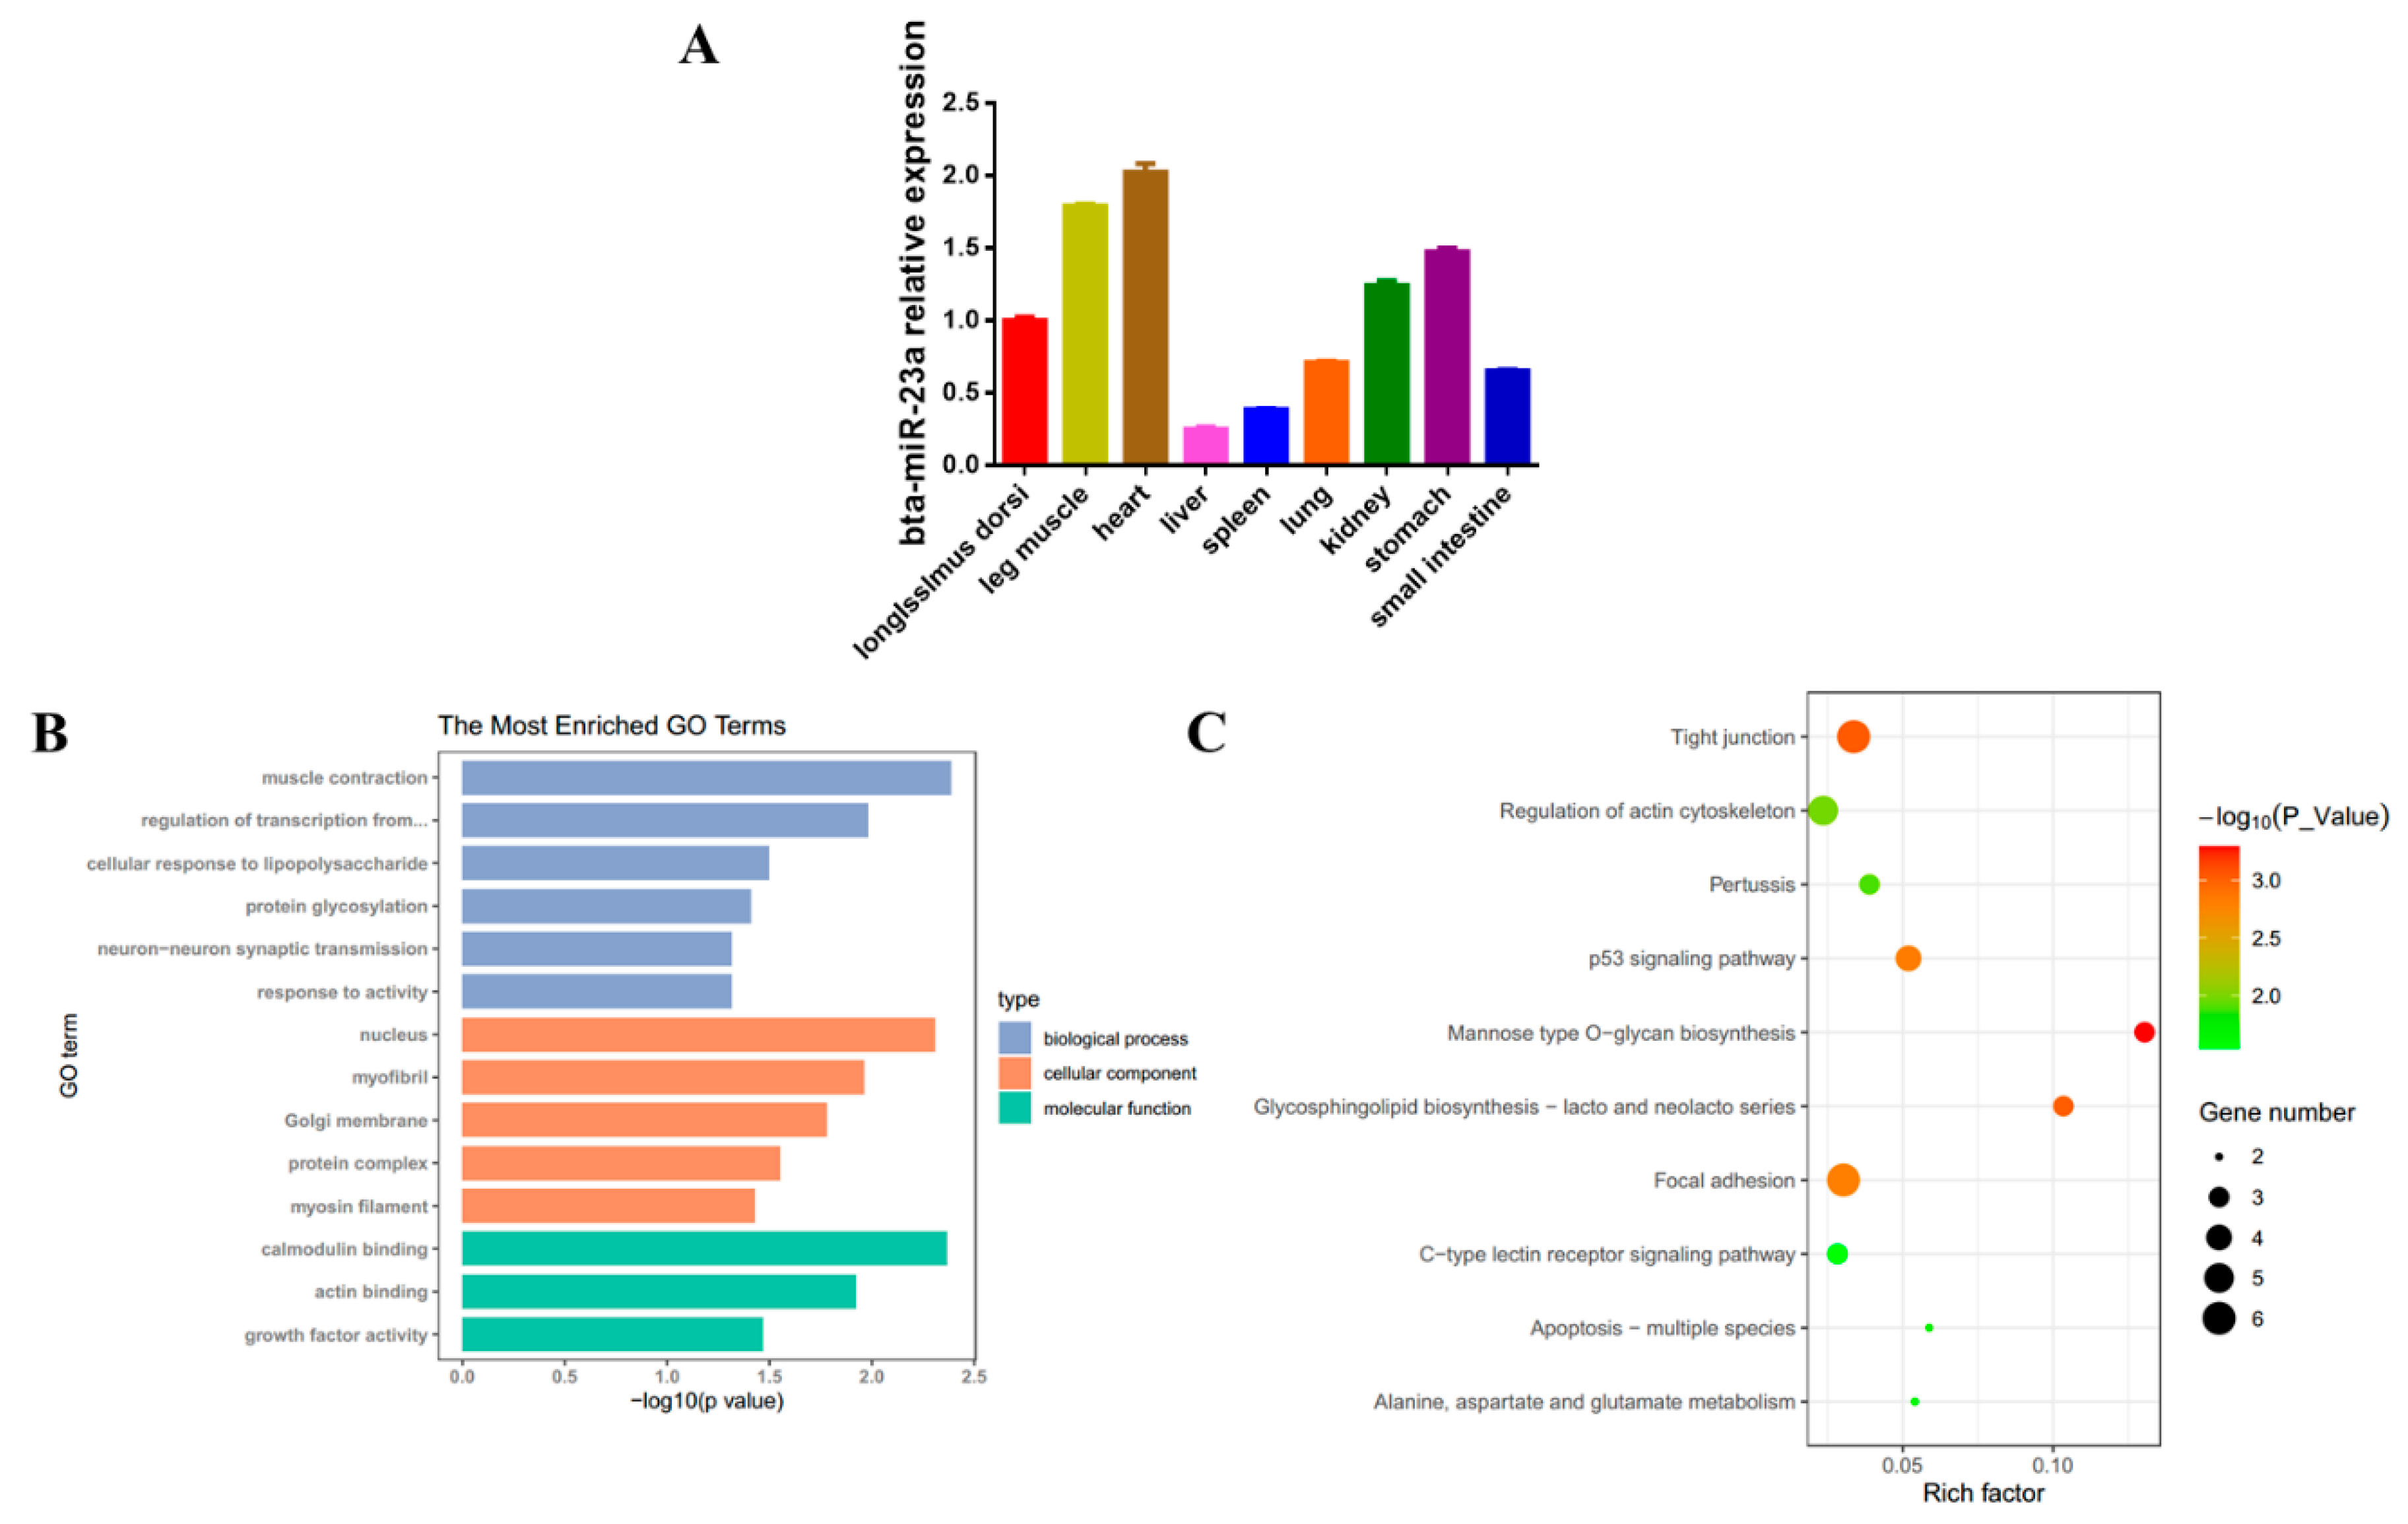
3.1. bta-miR-23a Expression Profile and Its Targets Analysis

In our previous work [31], we observed that bta-miR-23a was highly upregulated during MD. The expression levels of bta-miR-23a were then detected in different tissues, such as heart, kidney, leg muscle, liver, longissimus dorsi, lung, small intestine, spleen and stomach tissues derived from fetal bovine, and it was found that bta-miR-23a had ubiquitous expression patterns in different tissue types (Figure 1A). GO term enrichment was further conducted on bta-miR-23a target genes, and the results demonstrated that bta-miR-23a was involved in muscle contraction, myofibril, myosin filament, growth factor activity and nucleus (Figure 1B). Moreover, KEGG enrichment analysis demonstrated that bta-miR-23a might be related to tight junction, focal adhesion, glycosphingolipid biosynthesis, p53 signaling pathway, and the regulation of actin cytoskeleton (Figure 1C). Altogether, these data imply that bta-miR-23a is a potential regulator in myogenesis.

3.2. bta-miR-23a Is Upregulated During MD of PDGFRα− bPCs

To explore the potential role of bta-miR-23a, PDGFRα− bPCs were isolated from fetal bovine skeletal muscles. It was observed that PDGFRα− bPCs could form myotubes after 2 days of myogenic induction (Figure 2A,B). During MD, MyoG expression was downregulated, while MyHC expression was increased (Figure 2C). Moreover, the expression of four MyHC genes was evaluated during MD. It was found that the expression levels of MyHC-1, -2, and -4 were upregulated during MD, while MyHC-7 expression level was increased during first two days and then decreased afterwards (Figure 2D). Besides, the expression trend of bta-miR-23a was shown to be increased during MD (Figure 2E). These results suggest that our in vitro MD model is reliable for studying the differentiation of PDGFRα− bPCs in fetal bovine skeletal muscle.

3.3. bta-miR-23a Promotes the MD of PDGFRα− bPCs

To verify the biological effects of bta-miR-23a on MD, we introduced bta-miR-23a mimic and NC into PDGFRα− bPCs on Day 0. The activities of bta-miR-23a in mimic group were 85 and 27 times higher compared to NC group (p < 0.01) on Day 2 and 5 after transfection, respectively (Figure 3A). Further, transfection of bta-miR-23a mimic or NC into the cells was carried out at Day 0 after MD. The mRNA levels of MyHC1, MyHC2, MyHC4, and MyHC7 were noticeably upregulated on Day 2 and 5 (Figure 3B). Similarly, bta-miR-23a overexpression increased the protein levels of MyoG and MyHC at Day 5 after MD (Figure 3C). Based on the immunofluorescence staining of myosin heavy chain, a high number of cells underwent differentiation and formed myotubes in mimic group compared to NC group on Day 2 and 5 (Figure 3D,E). Taken together, bta-miR-23a is shown to promote the MD of PDGFRα− bPCs.

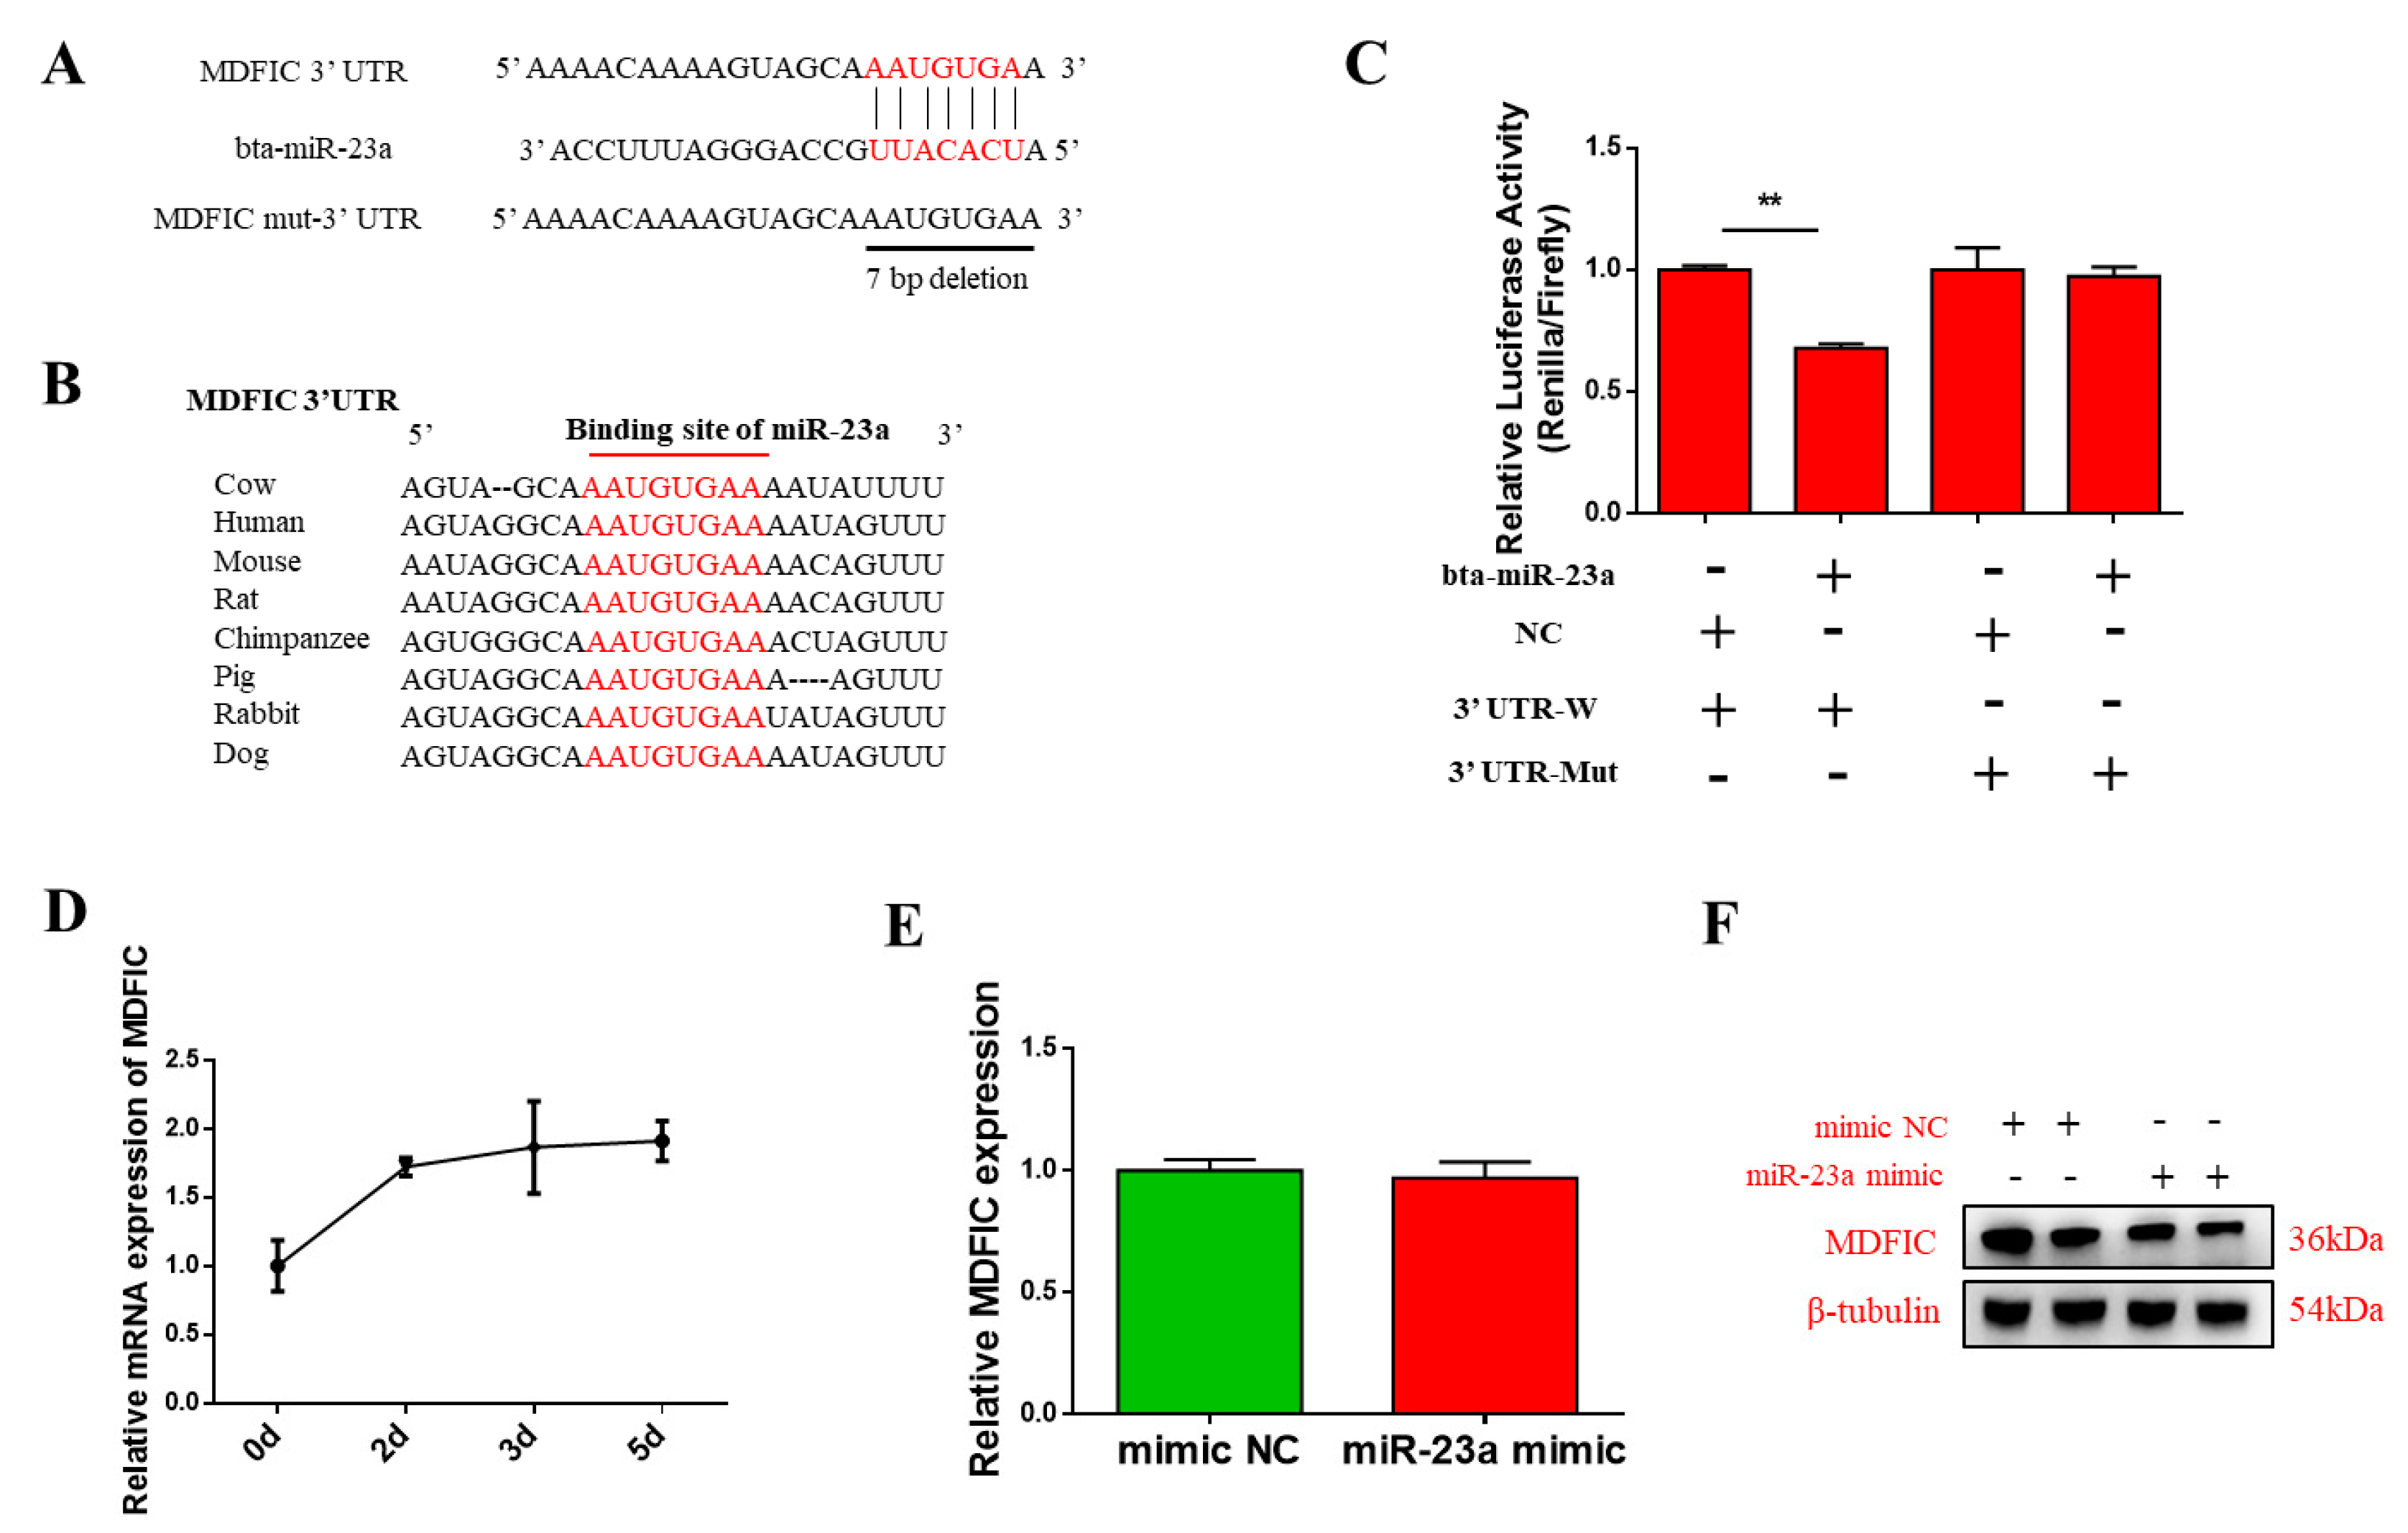
3.4. MDFIC Is A Promising Target Gene of bta-miR-23a

To elucidate the underlying mechanisms of bta-miR-23a-regulated gene expression, its target genes were predicated using the TargetScan databases. The findings indicated that MDFIC could be a promising target of bta-miR-23a (Figure 4A,B). To verify whether MDFIC is the direct target gene of bta-miR-23a, 2 LR plasmids consisting of either the wild-type or mutant 3′ -UTR of MDFIC gene were constructed (Figure 4A). Co-transfection of bta-miR-23a mimic or NC into HEK293T cells was carried out. Notably, bta-miR-23a markedly decreased the activity of wild-type MDFIC LR in comparison with those of negative control, but no significant changes were noted for the mutant LR (Figure 4C). These findings indicate that bta-miR-23a can indeed directly target the 3′-UTR of MDFIC. Moreover, we detected the expression of MDFIC during MD (Figure 4D). To examine the validity of the putative target, bta-miR-23a mimic or NC was transfected into PDGFRα− bPCs. RT-qPCR data revealed that the transcriptional levels of MDFIC were not obviously different between the mimic and NC groups (Figure 4E). Interestingly, Western blot analysis indicated that the translational levels of MDFIC were remarkably downregulated by bta-miR-23a mimic compared to NC group (Figure 4F). Thus, we concluded that bta-miR-23a can directly target the 3’-UTR of MDFIC to suppress its mRNA translation in PDGFRα− bPCs.

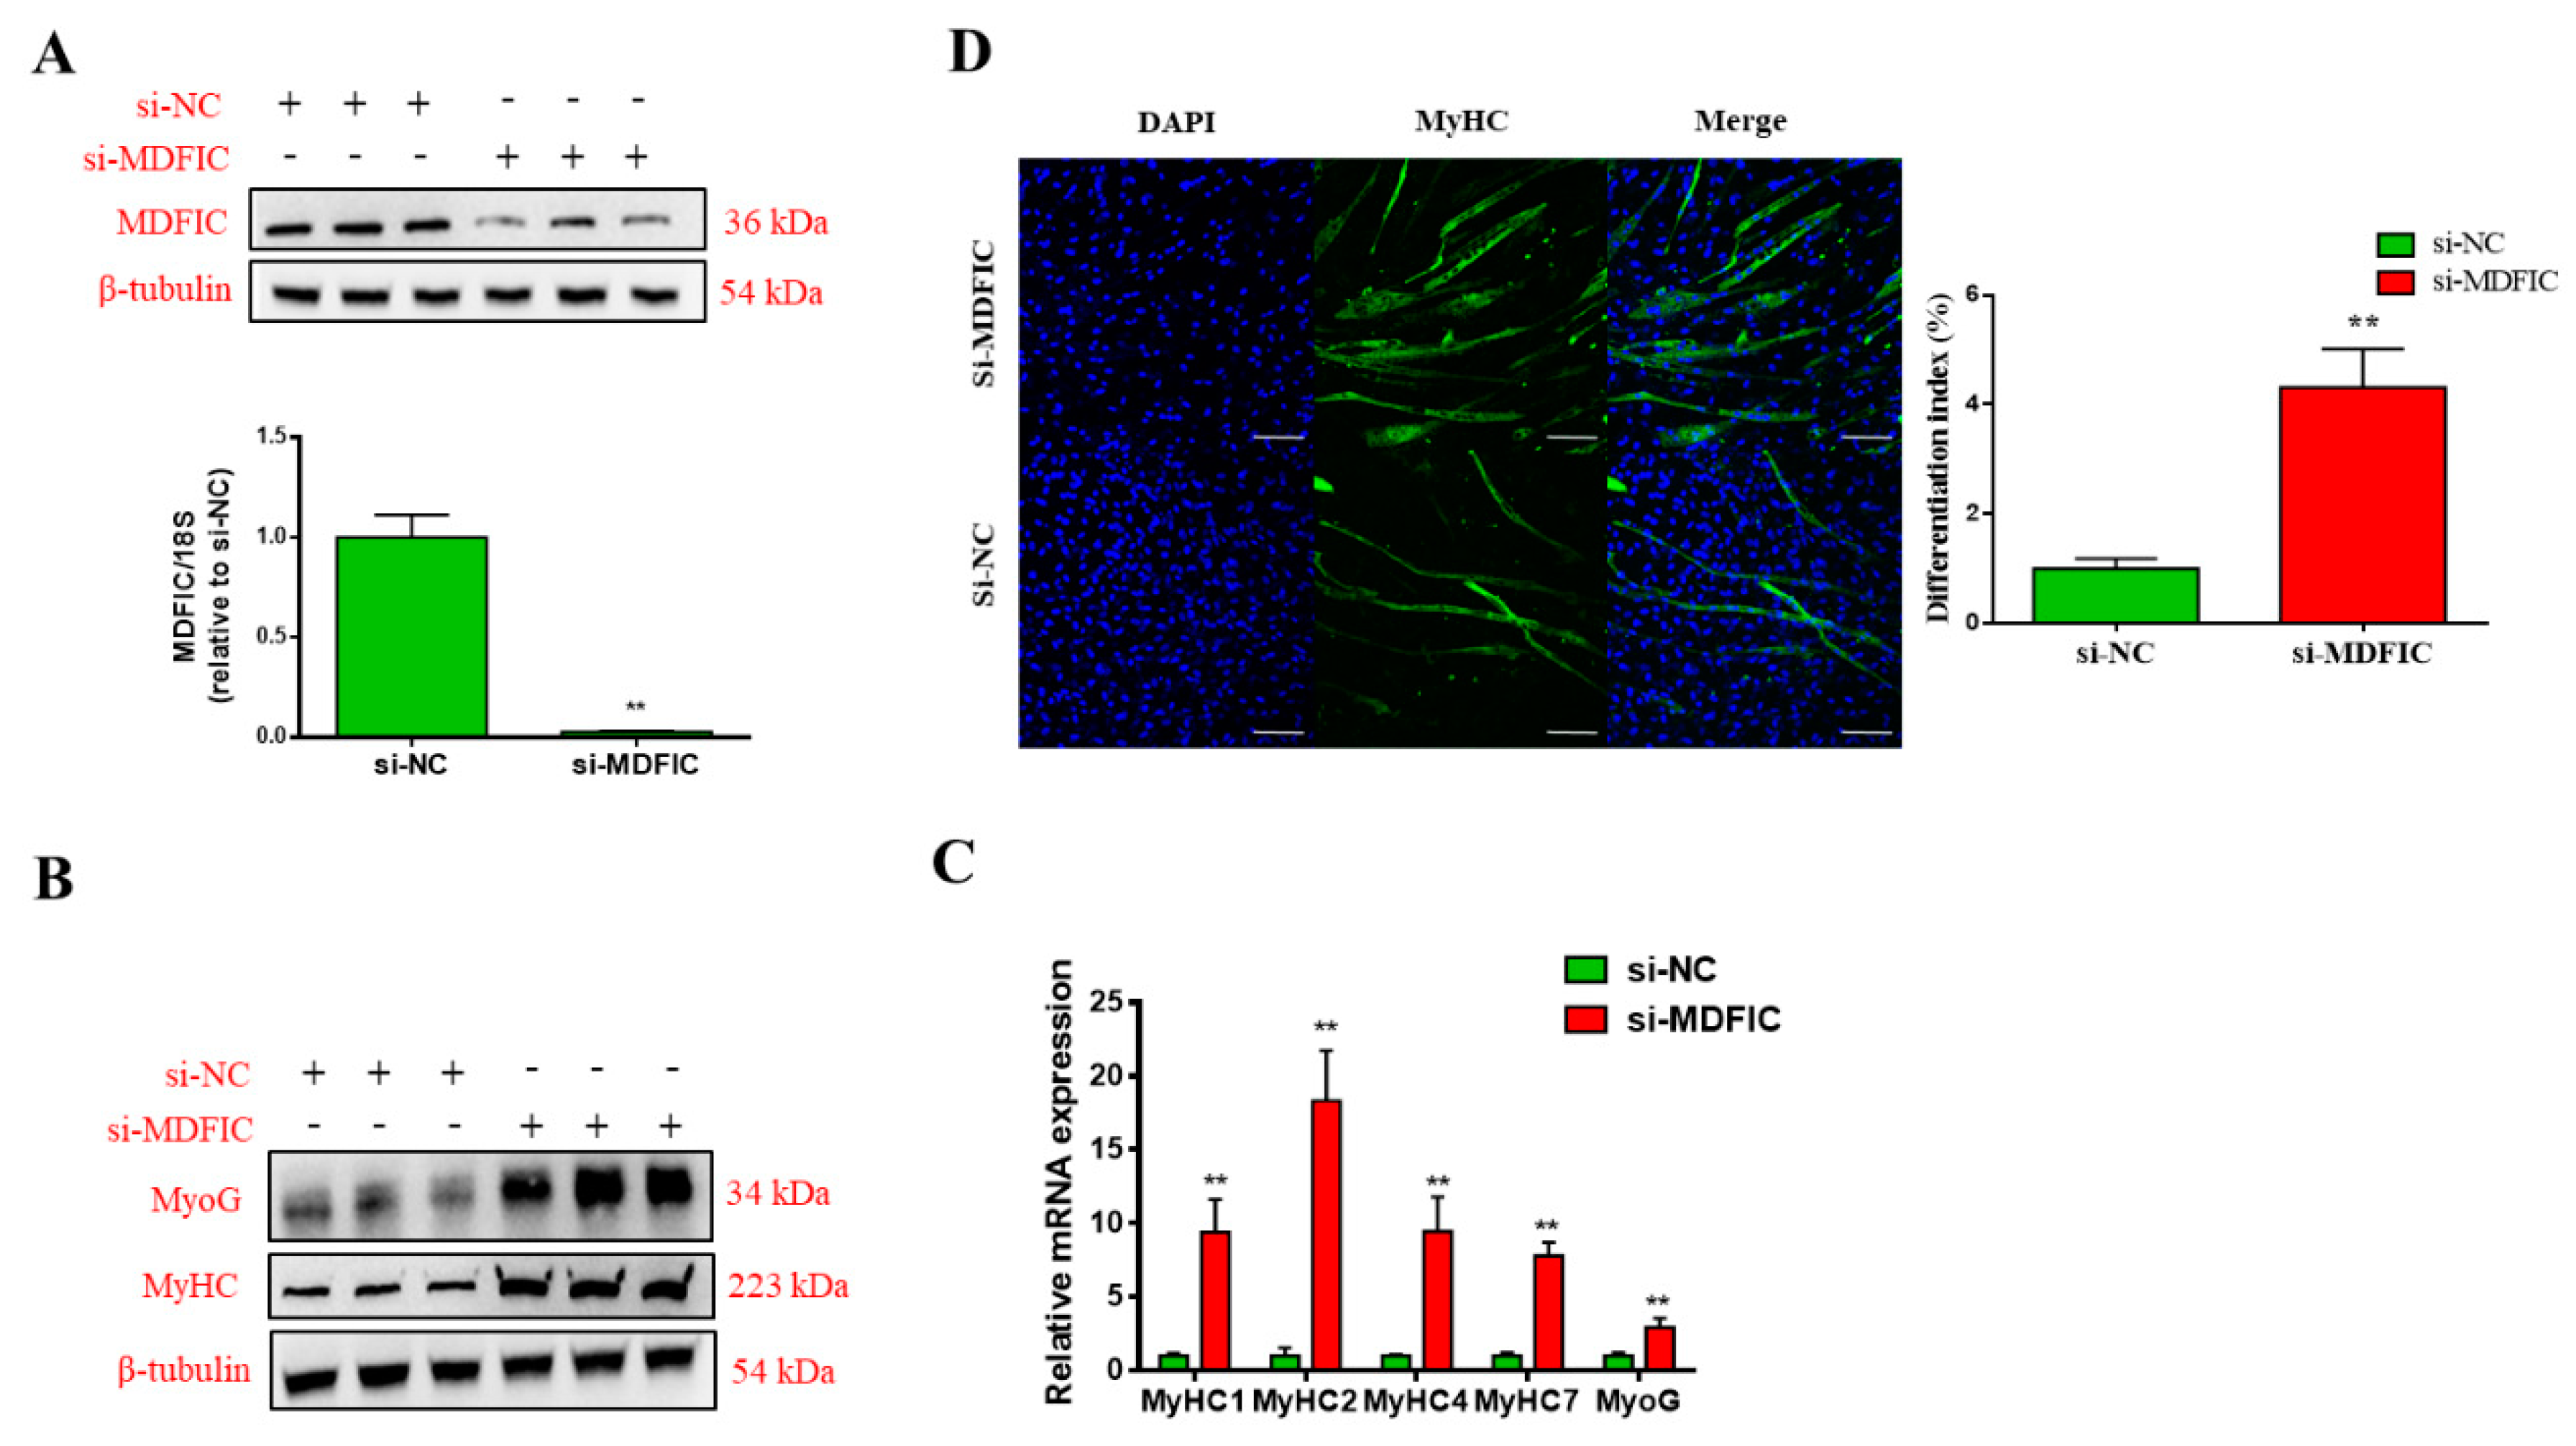
3.5. Knockdown of MDFIC Promotes MD

To explore the roles of MDFIC during MD, PDGFRα− bPCs were transfected with siRNA against MDFIC or NC. siRNA significantly diminished MDFIC mRNA and protein expression compared to NC group (Figure 5A). The transcriptional and translational levels of MyoG and MyHC were obviously higher in siRNA group than those in NC group at Day 5 after MD (Figure 5B,C). Immunofluorescence staining revealed that the knockdown of MDFIC notably enhanced the process of MD (Figure 5D). Taken altogether, our findings indicate that the inhibition of MDFIC can promote MD and myogenesis-specific gene expression.

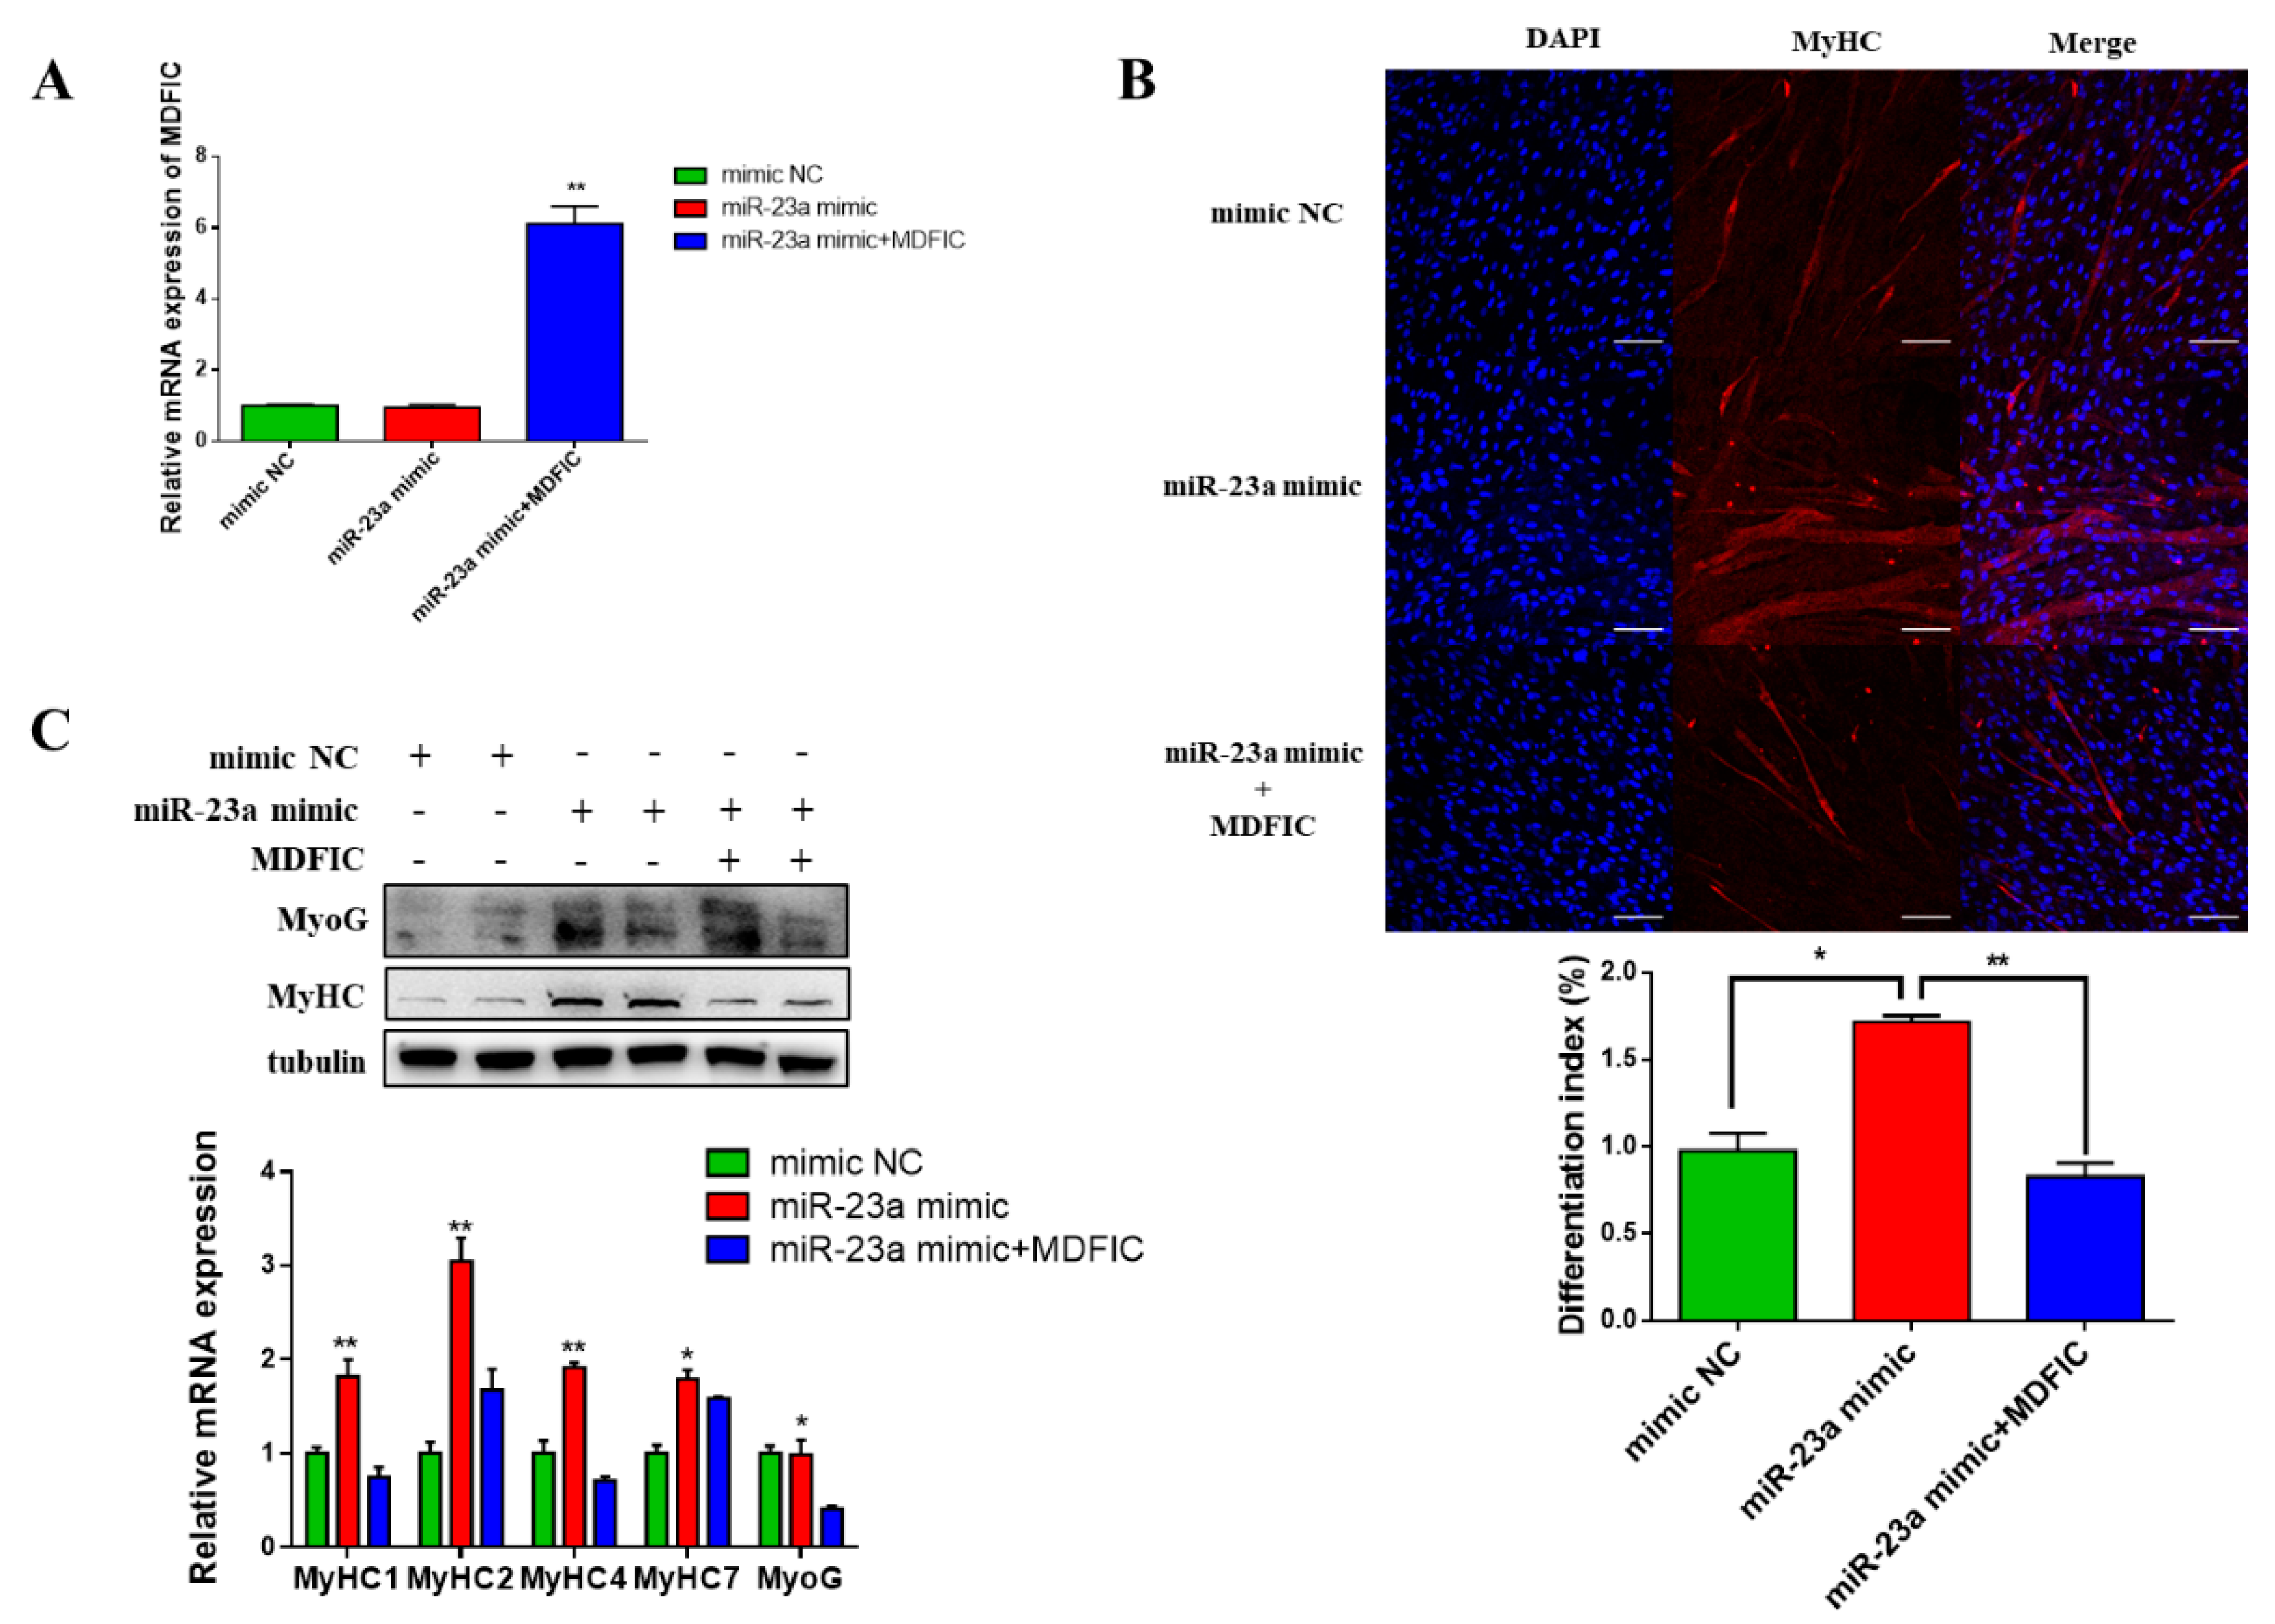
3.6. Overexpression of MDFIC Rescues the bta-miR-23a-Induced Effects

To further determine the regulation effect between bta-miR-23a and MDFIC, we performed rescue experiments in myoblast differentiation. The mRNA level of MDFIC was significantly upregulated after MDFIC overexpression (Figure 6A). Meanwhile, the results showed that overexpression of MDFIC weakened the bta-miR-23a-induced effects, thus reducing the formation of myotubes, mRNA and protein levels of MyHC1, MyHC2, MyHC4, MyHC7 and MyoG (Figure 6B,C). All these results demonstrated that overexpression of MDFIC could attenuate the bta-miR-23a-induced effects during MD.

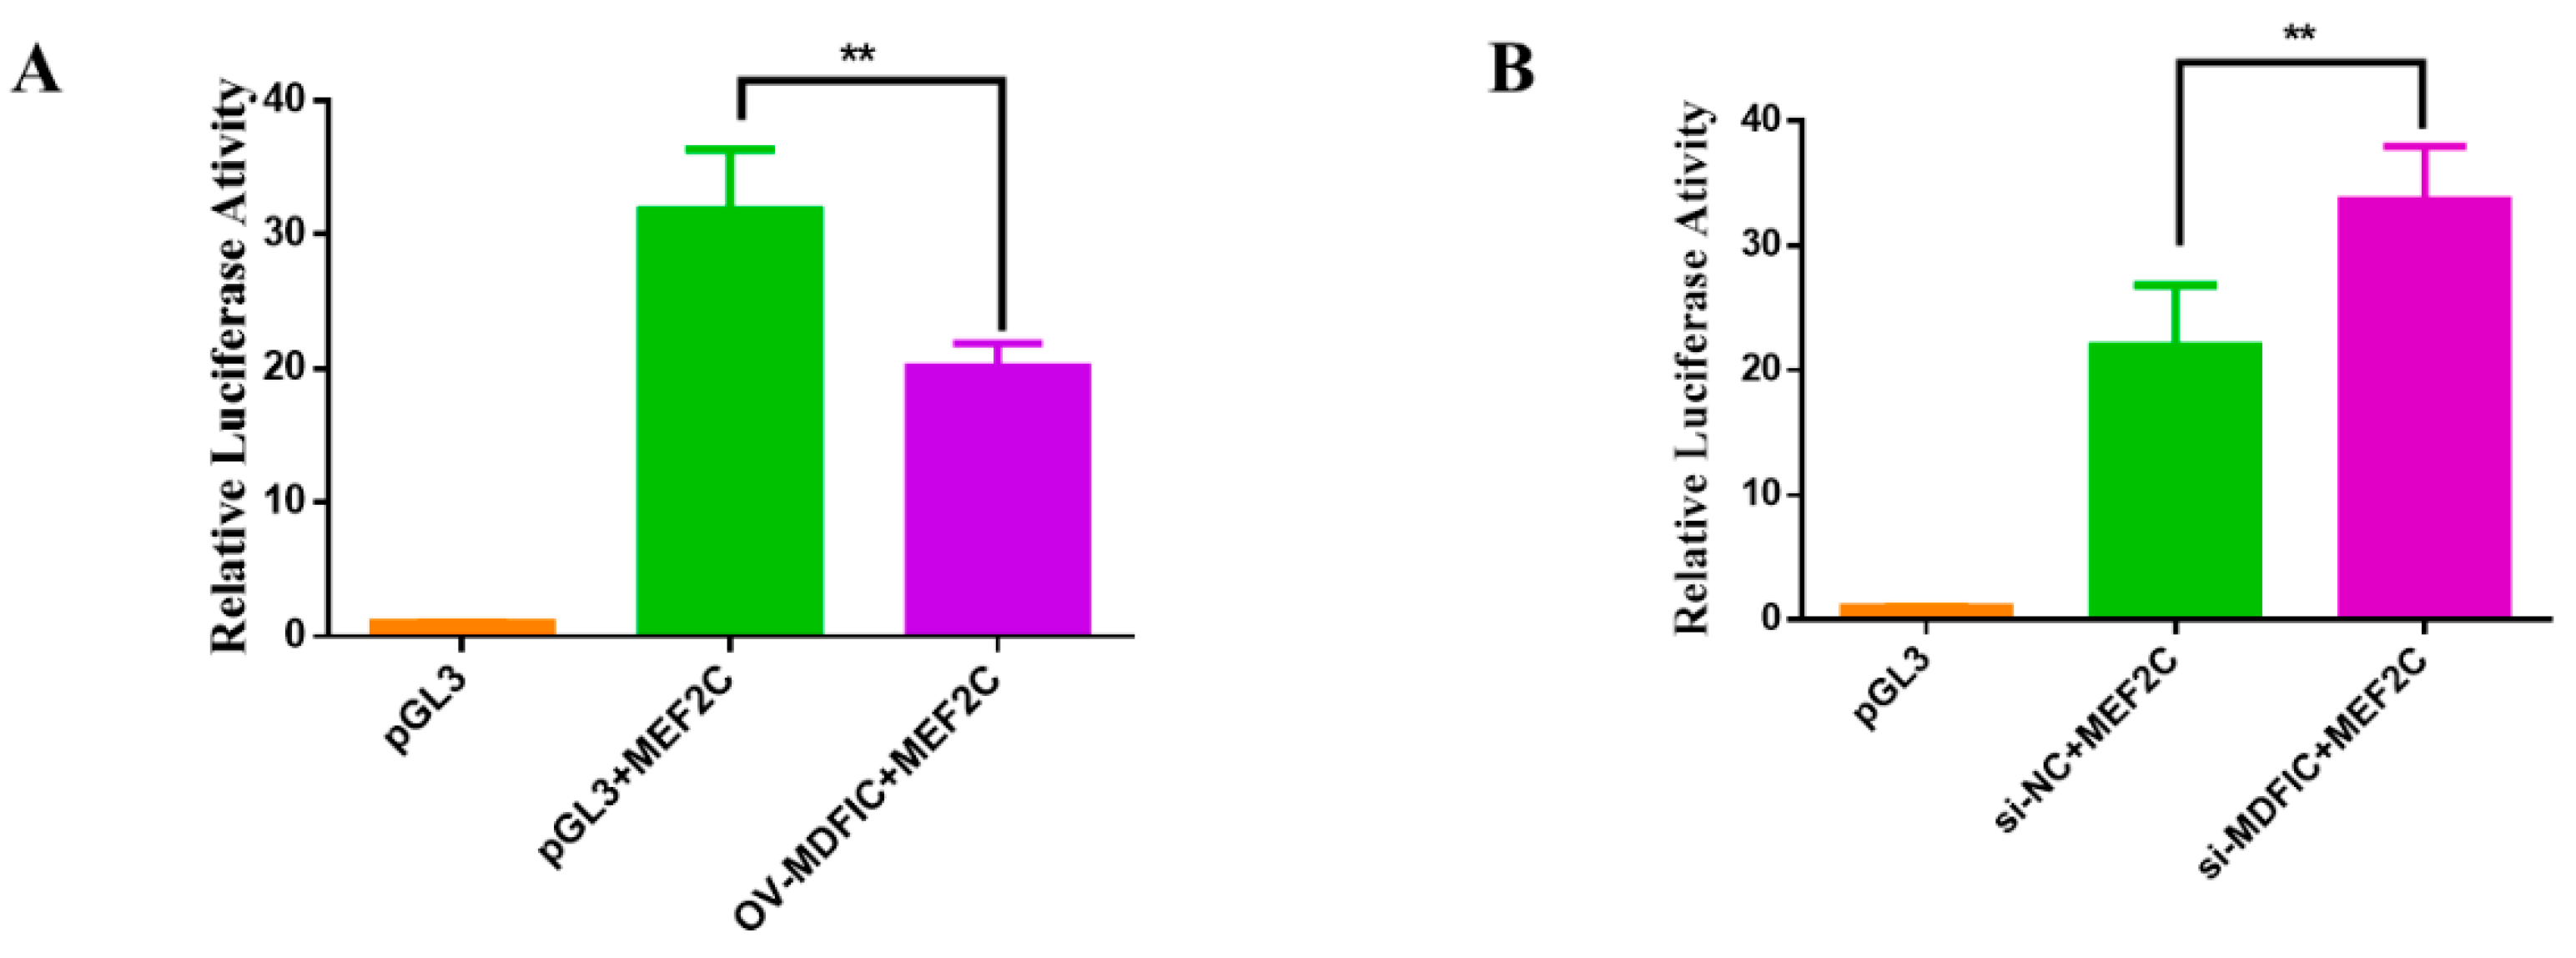
3.7. MDFIC Regulate the Transcription Activity of MEF2C

To understand the relationship between MDFIC and MyoG, we cloned the promoter region of MEF2C, a known target gene of MyoG [32], into pGL3-Basic vector. The MEF2C promoter containing vector was co-transfected with OV-MDFIC or si-MDFIC with TK-Renilla plasmid, and the results showed that OV-MDFIC reduced the LR activity while si-MDFIC increased the LR activity (Figure 7A,B). These findings suggest that MDFIC may function through the interaction between MyoG transcription factor and MEF2C the promoter.

4. Discussion

In the present work, we reveal a role for bta-miR-23a during MD of PDGFRα− bPCs. Our results indicated that bta-miR-23a controlled myoblast differentiation via targeting MDFIC. In addition, MDFIC regulated the transcription activity of MEF2C by modulating MyoG expression (Figure 8).
It has been demonstrated that miR-23a can modulate gene expression at the post-transcriptional level, and is involved in a broad scope of cellular processes, including cell proliferation, apoptosis, differentiation and metabolism [33,34,35]. Notably, miR-23a is responsible for the differentiation of stem cells. miR-23a is highly upregulated in mouse embryonic stem cells (mESC) to suppress differentiation toward the endoderm and ectoderm lineages, and is downregulated during the differentiation state [36]. miR-23a also maintains the balance between adipogenesis and osteogenesis in bone marrow mesenchymal stem cells [37], and plays a key factor in osteogenesis by targeting RUNX2 and TRPS1 [38,39]. In addition, miR-23a contributes to the early phases of neural differentiation by targeting cyclin D1 and Musashi1 [40,41]. Our previous works have demonstrated that bta-miR-23a can regulate the early commitment of intramuscular adipogenic differentiation by targeting ZNF423 [30]. Moreover, previous studies have presented evidence that miR-23a plays crucial roles in muscle development and performance. Delphinidin intake can induce miR-23a expression to attenuate disuse muscle atrophy [42]. Besides, miR-23a is involved in cardiac hypertrophy via activation of muscle-specific ring finger protein 1 [43]. Furthermore, the overexpression of miR-23a and -23b have been found in the initial stages of C2C12 differentiation, and thus promote MD through suppressing TrxR1 expression [44]. However, in one study, MD can be inhibited by miR-23a via downregulation of fast MHC isoforms using mice model and mice derived cells [45]. In this study, our results indicated that bta-miR-23a could promote MD by suppressing MDFIC, which acted as an inhibitor of MD. The reason for this inconsistency may be explained by the different materials or the different differentiation stages focused. Here, the animal material was bovine fetus and its primary PDGFRα− bPCs. Therefore, we proposed a new mechanism for the roles of bta-miR-23a during MD.
The inhibitor of MyoD family (I-mfa) is a transcription factor encoded by MDFI, which suppresses the transactivation activities of MyoD family and inhibits skeletal myogenesis [27]. In this research, interfering MDFIC increased the transcriptional and translational levels of MyoG and MyHCs, thereby promoting the MD of PDGFRα− bPCs. Meanwhile, our rescue experiments further verified that MDFIC overexpression could reverse the inducive effects of miR-23a during MD. Some studies have suggested that I-mfa domain can target a group of bHLH proteins and repress Wnt signal transduction [46]. Moreover, I-mfa has been reported to suppress myogenesis by inhibiting lymphoid enhancer factor-1/T cell factor (LEF-1/TCF), and such inhibition can be alleviated by canonical Wnt signaling through elevating β-catenin levels [47]. Despite this, MDFIC and MDFI are belonging to the same family, and the effects of MDFIC on MD has not yet been experimentally clarified. Here, we provided a new insight to understand that MEF2C might be a key gene for the interaction between MDFIC and MyoG during MD. Taken together, all these experimental results support a conclusion that MDFIC is involved in myogenesis.
In conclusion, our study reveals that bta-miR-23a enhances the MD of PDGFRα− bPCs by directly targeting MDFIC. In addition, MDFIC can regulate MEF2C transcription activity by regulating MyoG. These data expand our mechanistic understanding of myogenesis and muscle development in which miRNAs play an important role.

Author Contributions

Experimental work, X.H., Y.X., L.R., Y.W., Q.L., L.X., and L.W.; data analysis, X.H.; supervision, L.Z.; conceptualization, X.H. and L.Z.; funding acquisition, J.L. and L.Z.; manuscript drafting. X.H.; writing, review and editing, Q.Y. and M.D. All authors have read and agreed to the published version of the manuscript.

Funding

This study was funded by the National Natural Science Foundation of China (No. 31672384), Cattle Breeding Innovative Research Team (ASTIPIAS03), and Project of College Innovation Improvement under Beijing Municipality (PXM2016_014207_000012).

Acknowledgments

We thank the Inner Mongolia Aokesi Agriculture Co., Ltd. (Wulagai, China) for providing animal services.

Conflicts of Interest

The authors declare no conflict of interest.

References

  1. Cossu, G.; Borello, U. Wnt signaling and the activation of myogenesis in mammals. EMBO J. 1999, 18, 6867–6872. [Google Scholar] [CrossRef] [PubMed] [Green Version]
  2. Stickland, N.C. A quantitative study of muscle development in the bovine foetus (Bos indicus). Anat. Histol. Embryol. 1978, 7, 193–205. [Google Scholar] [CrossRef] [PubMed]
  3. Du, M.; Tong, J.; Zhao, J.; Underwood, K.R.; Zhu, M.; Ford, S.P.; Nathanielsz, P.W. Fetal programming of skeletal muscle development in ruminant animals. J. Anim. Sci. 2010, 88, E51–E60. [Google Scholar] [CrossRef] [PubMed] [Green Version]
  4. Du, M.; Yan, X.; Tong, J.F.; Zhao, J.X.; Zhu, M.J. Maternal Obesity, Inflammation, and Fetal Skeletal Muscle Development. Biol. Reprod. 2010, 82, 4–12. [Google Scholar] [CrossRef] [Green Version]
  5. Wang, Y.K.; Schnegelsberg, P.N.J.; Dausman, J.; Jaenisch, R. Functional redundancy of the muscle-specific transcription factors Myf5 and myogenin. Nature 1996, 379, 823–825. [Google Scholar] [CrossRef]
  6. Bober, E.; Lyons, G.E.; Braun, T.; Cossu, G.; Buckingham, M.; Arnold, H.H. The muscle regulatory gene, Myf-6, has a biphasic pattern of expression during early mouse development. J. Cell Biol. 1991, 113, 1255–1265. [Google Scholar] [CrossRef] [Green Version]
  7. Sassoon, D.; Lyons, G.; Wright, W.E.; Lin, V.; Lassar, A.; Weintraub, H.; Buckingham, M. Expression of two myogenic regulatory factors myogenin and MyoDl during mouse embryogenesis. Nature 1989, 341, 303–307. [Google Scholar] [CrossRef]
  8. Ying, F.; Zhang, L.; Bu, G.; Xiong, Y.; Zuo, B. Muscle fiber-type conversion in the transgenic pigs with overexpression of PGC1α gene in muscle. Biochem. Biophys. Res. Commun. 2016, 480, 669–674. [Google Scholar] [CrossRef]
  9. Zhao, R.-Q.; Yang, X.-J.; Xu, Q.-F.; Wei, X.-H.; Xia, D.; Chen, J. Expression of GHR and PGC-lα in association with changes of MyHC isof orm types in longissimus muscle of Erhualian and Large White pigs (Sus scrofa) during postnatal growth. Anim. Sci. 2016, 79, 203–211. [Google Scholar] [CrossRef]
  10. Ambros, V. The functions of animal microRNAs. Nature 2004, 431, 350–355. [Google Scholar] [CrossRef]
  11. Bartel, D.P. MicroRNAs: Genomics, biogenesis, mechanism, and function. Cell 2004, 116, 281–297. [Google Scholar] [CrossRef] [Green Version]
  12. Dai, Y.; Wang, Y.M.; Zhang, W.R.; Liu, X.F.; Li, X.; Ding, X.B.; Guo, H. The role of microRNA-1 and microRNA-206 in the proliferation and differentiation of bovine skeletal muscle satellite cells. Vitr. Cell Dev. Biol. Anim. 2016, 52, 27–34. [Google Scholar] [CrossRef]
  13. Wang, Y.M.; Ding, X.B.; Dai, Y.; Liu, X.F.; Guo, H.; Zhang, Y. Identification and bioinformatics analysis of miRNAs involved in bovine skeletal muscle satellite cell myogenic differentiation. Mol. Cell. Biochem. 2015, 404, 113–122. [Google Scholar] [CrossRef] [PubMed]
  14. Zhang, W.W.; Sun, X.F.; Tong, H.L.; Wang, Y.H.; Li, S.F.; Yan, Y.Q.; Li, G.P. Effect of differentiation on microRNA expression in bovine skeletal muscle satellite cells by deep sequencing. Cell. Mol. Biol. Lett. 2016, 21, 8. [Google Scholar] [CrossRef] [Green Version]
  15. Wu, J.Y.; He, D.D.; Yue, B.L.; Zhang, C.L.; Fang, X.T.; Chen, H. miR-101-1 expression pattern in Qinchuan cattle and its role in the regulation of cell differentiation. Gene 2017, 636, 64–69. [Google Scholar] [CrossRef] [PubMed]
  16. Miretti, S.; Martignani, E.; Accornero, P.; Baratta, M. Functional effect of mir-27b on myostatin expression: A relationship in piedmontese cattle with double-muscled phenotype. BMC Genom. 2013, 14, 194. [Google Scholar] [CrossRef] [PubMed] [Green Version]
  17. Song, C.C.; Yang, Z.X.; Dong, D.; Xu, J.W.; Wang, J.; Li, H.; Huang, Y.Z.; Lan, X.Y.; Lei, C.Z.; Ma, Y.; et al. miR-483 inhibits bovine myoblast cell proliferation and differentiation via IGF1/PI3K/AKT signal pathway. J. Cell. Physiol. 2019, 234, 9839–9848. [Google Scholar] [CrossRef]
  18. Wada, S.; Kato, Y.; Okutsu, M.; Miyaki, S.; Suzuki, K.; Yan, Z.; Schiaffino, S.; Asahara, H.; Ushida, T.; Akimoto, T. Translational suppression of atrophic regulators by microRNA-23a integrates resistance to skeletal muscle atrophy. J. Biol. Chem. 2011, 286, 38456–38465. [Google Scholar] [CrossRef] [Green Version]
  19. Yong, F.L.; Wang, C.W.; Roslani, A.C.; Law, C.W. The involvement of miR-23a/APAF1 regulation axis in colorectal cancer. Int. J. Mol. Sci. 2014, 15, 11713–11729. [Google Scholar] [CrossRef] [Green Version]
  20. Shang, J.; Yang, F.; Wang, Y.; Wang, Y.; Xue, G.; Mei, Q.; Wang, F.; Sun, S. MicroRNA-23a antisense enhances 5-fluorouracil chemosensitivity through APAF-1/caspase-9 apoptotic pathway in colorectal cancer cells. J. Cell. Biochem. 2014, 115, 772–784. [Google Scholar] [CrossRef]
  21. Zhang, Y.; Wang, J.; Hui, B.; Sun, W.; Li, B.; Shi, F.; Che, S.; Chai, L.; Song, L. Pristimerin enhances the effect of cisplatin by inhibiting the miR-23a/Akt/GSK3β signaling pathway and suppressing autophagy in lung cancer cells. Int. J. Mol. Med. 2019, 43, 1382–1394. [Google Scholar] [CrossRef] [PubMed] [Green Version]
  22. Chen, B.; Zhu, A.; Tian, L.; Xin, Y.; Liu, X.; Peng, Y.; Zhang, J.; Miao, Y.; Wei, J. miR-23a suppresses pancreatic cancer cell progression by inhibiting PLK-1 expression. Mol. Med. Rep. 2018, 18, 105–112. [Google Scholar] [CrossRef] [PubMed]
  23. Ma, G.; Dai, W.; Sang, A.; Yang, X.; Gao, C. Upregulation of microRNA-23a/b promotes tumor progression and confers poor prognosis in patients with gastric cancer. Int. J. Clin. Exp. Pathol. 2014, 7, 8833–8840. [Google Scholar] [PubMed]
  24. Wang, N.; Zhu, M.; Tsao, S.W.; Man, K.; Zhang, Z.; Feng, Y. MiR-23a-mediated inhibition of topoisomerase 1 expression potentiates cell response to etoposide in human hepatocellular carcinoma. Mol. Cancer 2013, 12, 119. [Google Scholar] [CrossRef] [PubMed] [Green Version]
  25. Thebault, S.; Gachon, F.; Lemasson, I.; Devaux, C.; Mesnard, J.M. Molecular cloning of a novel human I-mfa domain-containing protein that differently regulates human T-cell leukemia virus type I and HIV-1 expression. J. Biol. Chem. 2000, 275, 4848–4857. [Google Scholar] [CrossRef] [Green Version]
  26. Thebault, S.; Mesnard, J.M. How the sequestration of a protein interferes with its mechanism of action: Example of a new family of proteins characterized by a particular cysteine-rich carboxy-terminal domain involved in gene expression regulation. Curr. Protein Pept. Sci. 2001, 2, 155–167. [Google Scholar] [CrossRef]
  27. Chen, C.M.A.; Kraut, N.; Groudine, M.; Weintraub, H. I-mf, a Novel Myogenic Repressor, Interacts with Members of the MyoD Family. Cell 1996, 86, 731–741. [Google Scholar] [CrossRef] [Green Version]
  28. Kraut, N.; Snider, L.; Chen, C.M.A.; Tapscott, S.J.; Groudine, M. Requirement of the mouse I-mfa gene for placental development and skeletal patterning. Embo J. 1998, 17, 6276–6288. [Google Scholar] [CrossRef] [Green Version]
  29. Zhang, L.; Zhou, X.; Michal, J.J.; Ding, B.; Li, R.; Jiang, Z. Genome wide screening of candidate genes for improving piglet birth weight using high and low estimated breeding value populations. Int. J. Biol. Sci. 2014, 10, 236–244. [Google Scholar] [CrossRef] [Green Version]
  30. Guan, L.; Hu, X.; Liu, L.; Xing, Y.S.; Zhou, Z.K.; Liang, X.W.; Yang, Q.Y.; Jin, S.Y.; Bao, J.S.; Gao, H.J.; et al. bta-miR-23a involves in adipogenesis of progenitor cells derived from fetal bovine skeletal muscle. Sci. Rep.-UK 2017, 7, 43716. [Google Scholar] [CrossRef]
  31. Xing, Y.S.H.X.; Ren, L.; Wang, Y.H.; Xing, L.Y.; Li, J.Y.; Zhang, L.P. Identification of microRNAs Involved in Myogenic Differentiation of Bovine Fetal Skeletal Muscle Derived Myoblasts. Acta Vet. Zootech. Sin. 2018, 49, 1134–1144. [Google Scholar]
  32. Wang, D.Z.; Valdez, M.R.; McAnally, J.; Richardson, J.; Olson, E.N. The Mef2c gene is a direct transcriptional target of myogenic bHLH and MEF2 proteins during skeletal muscle development. Dev. (Camb. Engl.) 2001, 128, 4623–4633. [Google Scholar]
  33. Ma, M.; Dai, J.; Tang, H.; Xu, T.; Yu, S.; Si, L.; Cui, C.; Sheng, X.; Chi, Z.; Mao, L.; et al. MicroRNA-23a-3p Inhibits Mucosal Melanoma Growth and Progression through Targeting Adenylate Cyclase 1 and Attenuating cAMP and MAPK Pathways. Theranostics 2019, 9, 945–960. [Google Scholar] [CrossRef] [PubMed]
  34. Zhuang, R.J.; Bai, X.X.; Liu, W. MicroRNA-23a depletion promotes apoptosis of ovarian cancer stem cell and inhibits cell migration by targeting DLG2. Cancer Biol. Ther. 2019, 1–15. [Google Scholar] [CrossRef]
  35. Gao, P.; Tchernyshyov, I.; Chang, T.C.; Lee, Y.S.; Kita, K.; Ochi, T.; Zeller, K.I.; De Marzo, A.M.; Van Eyk, J.E.; Mendell, J.T.; et al. c-Myc suppression of miR-23a/b enhances mitochondrial glutaminase expression and glutamine metabolism. Nature 2009, 458, 762–765. [Google Scholar] [CrossRef] [Green Version]
  36. Hadjimichael, C.; Nikolaou, C.; Papamatheakis, J.; Kretsovali, A. MicroRNAs for Fine-Tuning of Mouse Embryonic Stem Cell Fate Decision through Regulation of TGF-β Signaling. Stem Cell Rep. 2016, 6, 292–301. [Google Scholar] [CrossRef] [PubMed] [Green Version]
  37. Guo, Q.; Chen, Y.S.; Guo, L.J.; Jiang, T.J.; Lin, Z.Y. miR-23a/b regulates the balance between osteoblast and adipocyte differentiation in bone marrow mesenchymal stem cells. Bone Res. 2016, 4, 16022. [Google Scholar] [CrossRef]
  38. Hassan, M.Q.; Gordon, J.A.; Beloti, M.M.; Croce, C.M.; van Wijnen, A.J.; Stein, J.L.; Stein, G.S.; Lian, J.B. A network connecting Runx2, SATB2, and the miR-23a~27a~24-2 cluster regulates the osteoblast differentiation program. Proc. Natl. Acad. Sci. USA 2010, 107, 19879–19884. [Google Scholar] [CrossRef] [Green Version]
  39. Ying, Z.; Rong-Lin, X.; Jonathan, G.; Kimberly, L.B.; Stein, J.L.; Lian, J.B.; Van Wijnen, A.J.; Stein, G.S. Control of mesenchymal lineage progression by microRNAs targeting skeletal gene regulators Trps1 and Runx2. J. Biol. Chem. 2012, 287, 21926–21935. [Google Scholar]
  40. Tanay, G.; Julieta, A.; Jeannette, N.; Hannes, E.; Christian, S.; Cedric, M.; Thomas, L.; Imane, M.; Leslie, S.; Martina, D. MicroRNAs establish robustness and adaptability of a critical gene network to regulate progenitor fate decisions during cortical neurogenesis. Cell Rep. 2014, 7, 1779–1788. [Google Scholar]
  41. Ubaldo, G.; Valerio, D.C.; Pasquale, C.; Camilla, T.; Antonella, C.; Marcella, M.; Pietro, L.; Stefano, B.; Irene, B.; Emanuele, C. Mir-23a and mir-125b regulate neural stem/progenitor cell proliferation by targeting Musashi1. RNA Biol. 2014, 11, 1105–1112. [Google Scholar]
  42. Murata, M.; Nonaka, H.; Komatsu, S.; Goto, M.; Mai, M.; Yamada, S.; Lin, I.C.; Yamashita, S.; Tachibana, H. Delphinidin Prevents Muscle Atrophy and Upregulates miR-23a Expression. J. Agric. Food Chem. 2016, 65, 45–50. [Google Scholar] [CrossRef] [PubMed]
  43. Zhiqiang, L.; Iram, M.; Kun, W.; Jianqin, J.; Jie, G.; Pei-Feng, L. miR-23a functions downstream of NFATc3 to regulate cardiac hypertrophy. Proc. Natl. Acad. Sci. USA 2009, 106, 12103–12108. [Google Scholar]
  44. Mercatelli, N.; Fittipaldi, S.; Paola, E.D.; Dimauro, I.; Paronetto, M.P.; Jackson, M.J.; Caporossi, D. MiR-23-TrxR1 as a novel molecular axis in skeletal muscle differentiation. Sci. Rep. 2017, 7, 7219. [Google Scholar] [CrossRef] [Green Version]
  45. Wang, L.; Chen, X.; Zheng, Y.; Li, F.; Lu, Z.; Chen, C.; Liu, J.; Wang, Y.; Peng, Y.; Shen, Z.; et al. MiR-23a inhibits myogenic differentiation through down regulation of fast myosin heavy chain isoforms. Exp. Cell Res. 2012, 318, 2324–2334. [Google Scholar] [CrossRef]
  46. Snider, L.; Thirlwell, H.; Miller, J.R.; Moon, R.T.; Groudine, M.; Tapscott, S.J. Inhibition of Tcf3 binding by I-mfa domain proteins. Mol. Cell. Biol. 2001, 21, 1866–1873. [Google Scholar] [CrossRef] [Green Version]
  47. Weijun, P.; Yingying, J.; Tao, H.; Jiyong, W.; Donglei, T.; Xiaoqing, G.; Lin, L. Beta-catenin relieves I-mfa-mediated suppression of LEF-1 in mammalian cells. J. Cell Sci. 2006, 119, 4850. [Google Scholar]
Figure 1. bta-miR-23a expression profile and its targets analysis. (A) Tissue expression of bta-miR-23a examined by qPCR in fetal tissues. The fold change of bta-miR-23a was relative to bta-miR-23a expression of longissimus dorsi. (B) GO term enrichment of target genes for bta-miR-23a. (C) KEGG pathway analysis of target genes for bta-miR-23a. Results are representative of the mean (± SD) of three independent analyses.
Genes 11 01232 g001
Figure 2. bta-miR-23a expression increased during myogenic differentiation (MD) of PDGFRα− bPCs. (A) Morphological features of PDGFRα− bPCs at Day 0 (D0), 2 (D2), 3 (D3) and 5 (D5) after MD. Scale bar represents 100 µm. (B) MyHC positive cells (green) at D0, D2, D3 and D5 after MD were examined by fluorescence microscopy. Scale bar represents 100 µm. The protein (C) and mRNA (D) levels of MyoG and MyHC. β-tubulin was used as the reference gene. (E) Relative expression of bta-miR-23a at D0, D2, D3 and D5 after MD. Results are representative of the mean (± SD) of three independent analyses.
Genes 11 01232 g002
Figure 3. bta-miR-23a promoted MD of PDGFRα− bPCs. (A) The mRNA levels of bta-miR-23a in PDGFRα− bPCs after 48-h transfection with bta-miR-23a mimics or NC mimics. (B) The mRNA expression of MyoG and MyHCs in PDGFRα− bPCs at D2 and D5 after MD. (C) The protein levels of MyoG and MyHC in PDGFRα− bPCs at 96 h after MD. β-tubulin was used as the reference gene. (D) MyHC (green) positive cells at D2 and D5 after MD. Scale bar represents 100 µm. (E) Differentiation index of myoblast after induction for D2 and D5. Results are representative of the mean (± SD) of three independent analyses. ** p < 0.01.
Genes 11 01232 g003
Figure 4. MDFIC gene is directly targeted by bta-miR-23a. (A) The predicated binding sites of bta-miR-23a in the 3′-UTR of MDFIC. Deletion of the seed region (in red) in the mutant 3′-UTR reporter. (B) The conservation of mature bta-miR-23a binding site in eight different species. (C) The relative luciferase activities of HEK293T cells co-transfected with the MDFIC 3′-UTR mutant or wild-type dual-luciferase reporter and bta-miR-23a mimic or the mimic NC at 48 h. (D) Expression pattern of MDFIC during MD. The mRNA (E) and protein (F) levels of MDFIC in PDGFRα− bPCs transfected with bta-miR-23a mimics or negative control at 48 h. β-tubulin was used as the reference gene. Results are representative of the mean (± SD) of three independent analyses. ** p < 0.01.
Genes 11 01232 g004
Figure 5. Knockdown of MDFIC promotes the MD of PDGFRα− bPCs. (A) The mRNA and protein expression level of MDFIC in PDGFRα− bPCs transfected with si-MDFIC or si-NC. β-tubulin was used as the reference gene. The protein (B) and mRNA (C) expression levels of MyoG and MHC in PDGFRα− bPCs transfected with si-MDFIC or si-NC at D5 after MD. β-tubulin was used as the reference gene. (D) MyHC positive cells (green) at D5 of MD after si-MDFIC or si-NC transfection. Scale bar represents 100 µm. Differentiation index of myoblast after induction for D5. Results are representative of the mean (± SD) of three independent analyses. ** p < 0.01.
Genes 11 01232 g005
Figure 6. Overexpression of MDFIC rescues the miR-23a-induced effects. (A) The mRNA levels of MDFIC in PDGFRα− bPCs transfected with mimic NC, miR-23a mimic or miR-23a mimic+MDFIC. (B) MyHC (red) positive cells of MD after transfection with mimic NC, miR-23a mimic or miR-23a mimic + MDFIC. Scale bar represents 100 µm. Differentiation index of myoblast after transfection with mimic NC, miR-23a mimic or miR-23a mimic + MDFIC. (C) The protein and mRNA expression levels of MyHC and MyoG in PDGFRα− bPCs transfected with mimic NC, miR-23a mimic or miR-23a mimic+MDFIC. β-tubulin was used as the reference gene. Results are representative of the mean (± SD) of three independent analyses. * p < 0.05, ** p < 0.01.
Genes 11 01232 g006
Figure 7. MDFIC regulate the transcription activity of MEF2C. (A,B) Luciferase assay was conducted by co-transfecting MEF2C promoter region and OV-MDFIC or si-MDFIC with TK-Renilla plasmid. Results are representative of the mean (± SD) of three independent analyses. ** p < 0.01.
Genes 11 01232 g007
Figure 8. Model of miR-23a-mediated regulatory network during myoblast differentiation.
Genes 11 01232 g008
Table 1. Sequences designed for real-time PCR.
NamePrimer Sequence (5’–3’)Annealing TemperatureAccession Number
Myogenin (MyoG)F: CAAATCCACTCCCTGAAA60 °CNM_001111325.1
R: GCATAGGAAGAGATGAACA
Myosin heavy chain 1 (MyHC1)F: GGGAAACTGGCTTCTGCTGAT60 °CNM_174117.1
R: TGGGTTGGTGGTGATTAGGAG
Myosin heavy chain 2 (MyHC2)F: GTCAAAGGGACTATCCAGAGCAG60 °CNM_001166227.1
R: AGAAGAGGCCCGAGTAGGTGT
Myosin heavy chain 4 (MyHC4)F: CTCCTAATCACCACCAACCCATA60 °CXM_002695806.5
R: TGTCAGCAACTTCAGTGCCATC
Myosin heavy chain 7 (MyHC7)F: AAGACAGTGACCGTGAAGGAGG60 °CNM_174727.1
R: GGTTGATGGTGACGCAGAAGA
MyoD family inhibitor domain containing (MDFIC)F: TGAGGAGGAAATAAGCAAGATAA60 °CNM_001101102.1
R: CAGGATACAGTGGACACAGCAGT
bta-miR-23aF: ATCACATTGCCAGGGATTTCC65 °CNR_031347.1
18sF: GTAACCCGTTGAACCCCATT60 °CNM_001025002.1
R: CCATCCAATCGGTAGTAGCG
U6F: GCTTCGGCAGCACATATACTAAAAT65 °CNM_001075477.2
Table 2. Primer sequences designed for vector construction.
NamePrimer Sequence (5’–3’)Annealing TemperatureAccession Number
Psi-CHECK-MDFIC-WF: ACTCTCGAGACTTTTCCTTTGTTGTCTATTC60 °CNM_001101102.1
R: ATAGCGGCCGCAGAGACCAAATCTGTAACTGTA
Psi-CHECK-MDFIC-MutF: AAAACAAAAGTAGCAAATATTTTCCATATG60 °CNM_001101102.1
R: CATATGGAAAATATTTGCTACTTTTGTTTT
pBI-CMV3F: TCCTTCCTAAATCTCCAGAGGATCATAATCAGCCATAC68 °C
R: GATGATGATGATCGTCGACAAGCTTATCGATGC
MDFICF: TGTCGACGATCATCATCATCATCATCACATGTCCGGCGCGGGCGAAG60 °CNM_001101102.1
R: CTCTGGAGATTTAGGAAGGAAAACAAATCCCGCAGCACTCCATGC
pGL3-basicF: GGGCTCGAGATCTGCGATCTAAGTAAG60 °C
R: GGGCTAGCACGCGTAAGAGC
MEF2CF: TCTTACGCGTGCTAGCCCTCACTTAGTATTAAAAATAGTTTGATTTTAAAAGTA
GAAAGGTCATATATGAAAAACATAATAAAGTCCAGGTAAAGAAATACCTGATAG
68 °CNM_001046113.1
R: AGATCGCAGATCTCGAGCCCTCTATGAAGACCCAGGCTTTCCCCCCTTG
Publisher’s Note: MDPI stays neutral with regard to jurisdictional claims in published maps and institutional affiliations.

