Article

Comparative Transcriptome Analysis in Oilseed Rape (Brassica napus) Reveals Distinct Gene Expression Details between Nitrate and Ammonium Nutrition

1
National Center of Oilseed Crops Improvement, Hunan Branch, Hunan Agricultural University, Changsha 410128, China
2
College of Agronomy and Biotechnology, Yunan Agricultural University, Kunming 650201, China
3
Southern Regional Collaborative Innovation Center for Grain and Oil Crops in China, Hunan Agricultural University, Changsha 410128, China
*
Authors to whom correspondence should be addressed.
Genes 2019, 10(5), 391; https://doi.org/10.3390/genes10050391
Submission received: 28 March 2019 / Revised: 17 May 2019 / Accepted: 17 May 2019 / Published: 22 May 2019
(This article belongs to the Section Plant Genetics and Genomics)

Abstract

:
Nitrate (NO3) and ammonium (NH4+) are the main inorganic nitrogen (N) sources absorbed by oilseed rape, a plant that exhibits genotypic differences in N efficiency. In our previous study, the biomass, N accumulation, and root architecture of two oilseed rape cultivars, Xiangyou 15 (high N efficiency, denoted “15”) and 814 (low N efficiency, denoted “814”), were inhibited under NH4+ nutrition, though both cultivars grew normally under NO3 nutrition. To gain insight into the underlying molecular mechanisms, transcriptomic changes were investigated in the roots of 15 and 814 plants subjected to nitrogen-free (control, CK), NO3 (NT), and NH4+ (AT) treatments at the seedling stage. A total of 14,355 differentially expressed genes (DEGs) were identified. Among the enriched Gene Ontology (GO) terms and Kyoto Encyclopedia of Genes and Genomes (KEGG) pathway categories of these DEGs, carbohydrate metabolism, lipid metabolism, protein metabolism, and cell wall biogenesis were inhibited by AT treatment. Interestingly, DEGs such as N transporters, genes involved in N assimilation and CESA genes related to cellulose synthase were also mostly downregulated in the AT treatment group. This downregulation of genes related to crucial metabolic pathways resulted in inhibition of oilseed rape growth after AT treatment.

Graphical Abstract

1. Introduction

Nitrogen (N) is an indispensable macronutrient for plant growth and development that not only serves as a constituent of many crucial macromolecules, including proteins, enzymes, and nucleic acids, but also acts as a signal to regulate many biological processes from metabolism to resource allocation, growth and development. Nitrate (NO3) and ammonium (NH4+) are the main N forms absorbed and utilized by plants, accounting for 70% of anion and cation absorption [1]. The mechanisms used by plants to absorb and utilize NO3 and NH4+ differ, and NO3 and NH4+ can affect plant growth and physiological processes, such as dry matter accumulation, root morphology, photosynthesis, and N assimilation. Accordingly, researchers have carried out studies on the effects of different N forms on the growth and physiology of plants, but the conclusions of these studies vary due to differences among plant species and genotypes. For example, some plants such as rice, tea, and Vaccinium spp. prefer NH4+ and grow better under NH4+ nutrition [2,3,4], whereas others such as wheat, watermelon, and Arabidopsis thaliana prefer NO3 [5,6,7].
Oilseed rape is a crucial source of plant oil worldwide, with a large demand for N fertilizer, and judicious application of N fertilizer can significantly improve the yield of oilseed rape [8]. Furthermore, a certain amount of N can increase oilseed rape biomass and yield, though excessive N decreases the oil content of oilseed rape [9]. Moreover, different oilseed rape genotypes exhibit distinct differences in their absorption and utilization of N fertilizers [10]. In most dryland soils, NO3 is the primary form of inorganic N; however, in natural environments, the N form may be highly variable, with NH4+ often predominant in acidic and/or water-logged soils [11,12]. Dryland and acidic soils are both suitable for planting oilseed rape. To date, NO3 accumulation and utilization have been a major emphasis of studies on N use in oilseed rape. In contrast, less is known about the growth performance and gene expression of these plants under NH4+ nutrition and whether oilseed rape cultivars with different N efficiencies have the same or different reactions to NO3 and NH4+ nutrition. Hence, we evaluated the effects of NO3 and NH4+ on the growth and physiology of two oilseed rape cultivars with different N efficiencies. The results demonstrated that NH4+ greatly inhibited the growth and root architecture of both cultivars but that they grew and developed normally under NO3 nutrition [13].
Although NO3 and NH4+ clearly have distinct effects on the growth of the two cultivars, studies of oilseed rape under NO3 and NH4+ nutrition at the molecular level are rare. Oilseed rape is closely related to Arabidopsis. Differences in gene expression in Arabidopsis under NO3 and NH4+ nutrition have been explored using microarray analysis, and the results suggest that the underlying bases of nitrate- and ammonium-specific patterns of gene expression differ [14]. In general, comparative high-throughput RNA sequencing (RNA-Seq) analyses of different cultivars and treatments can provide a deep understanding of the actual metabolic pathways involved, and a rice transcriptomic encyclopedia has recently been used to explore a large number of ammonium-responsive genes [2]. Moreover, Yang et al. [15] explored the transcriptomic profiles of tea (Camellia sinensis) treated with different N forms using RNA-Seq. The development of these metabolic databases has greatly facilitated studies focusing on NO3 and NH4+ nutrition. Thus, RNA-Seq appears to be a promising technique for determining the genomic behavior of oilseed rape under NO3 and NH4+ nutrition.
Here, the effects of NO3 and NH4+ application on the physiological responses of two oilseed rape cultivars, namely, Xiangyou 15 (with high N efficiency) and 814 (with low N efficiency), are explored. RNA-Seq of roots was applied to reveal molecular mechanistic differences between NO3 and NH4+ nutrition. Some candidate genes associated with N uptake, transport and assimilation, enriched Gene Ontology (GO) terms and enriched metabolic pathways were identified to provide a valuable resource for further understanding the major transcriptomic regulatory pathways responding to NO3 and NH4+ in the roots of two rape genotypes.

2. Materials and Methods

2.1. Plant Materials and Treatments

The two oilseed rape cultivars used in this study were previously characterized as having high (Xiangyou 15, denoted “15”) or low (814) N efficiency [16]. Seeds of 15 and 814 were provided by the National Center of Oilseed Crops Improvement, Hunan Branch, Hunan, China. Mature seeds were sown in trays with growth medium containing a mixture of peat and vermiculite (1:1, v/v). After producing ~3–4 leaves (35 d after sowing), we transplanted uniform seedlings into different pots for physiological and transcriptomic experiments. To prevent NH4+ from being converted into NO3 by microorganisms, this study used pot culture (diameter: 30 cm; height: 30 cm) with quartz sand containing no nutrients. The nutrient solution used was based on the improved Hoagland nutrient solution [17].
The physiological experiment was conducted in 2016. All pots with different N treatments contained the same levels of N (15 mmol/L) and dicyandiamide (DCD) (10 μmol/L) to prevent NH4+ transformation. There were six treatments, i.e., 2 cultivars × 3 N treatments. Ten seedlings were used for each treatment, with only one seedling per pot, for a total of 60 seedlings. Table 1 shows the macronutrient composition of the hydroponic solution of the three N treatments. The micronutrient composition was as follows: B, 1.0 mg/L; Mn, 0.5 mg/L; Zn, 0.05 mg/L; Cu, 0.02 mg/L; and Mo, 0.01 mg/L. The NT + AT (75% NO3 + 25% NH4+) treatment (Table 1) received a conventional oilseed rape fertilizer and was set as a control in the physiological experiment. The hydroponic solution was refreshed every five days. To prevent reaction between Ca2+ and CO32−/SO42−, CaCl2 was applied separately. The total N input of each treatment was 2.8 g/pot, and all N was added to pots before 60 d after transplanting.
The transcriptome experiment was conducted in 2017. Most of the methods were similar to those used in the physiological experiment. The NT (100% NO3) and AT (100% NH4+) treatments were the same as those in the physiological experiment. We used a nitrogen-free treatment (control, CK) instead of the NT + AT treatment to further distinguish the transcriptomic characteristics of oilseed rape roots in the NT and AT treatments. The 11.25 mmol/L KNO3, 1.875 mmol/L (NH4)2SO4 and 1.875 mmol/L K2CO3 (Table 1, NT + AT) treatments were replaced by 7.5 mmol/L K2CO3 (CK), and the other nutrients were the same. Twenty seedlings were included in each treatment, with only one seedling per pot, for a total of 120 seedlings. At 48 h after exposure to different N treatments, root tissues from five seedlings in each treatment group (three biological replicates) were collected, mixed, washed with double-distilled water, immediately frozen in liquid nitrogen, and stored at −80 °C for use in RNA extraction.

2.2. Measurement of Growth-Related Parameters

For biomass and N concentration determination, five plants at the bud period (70 d after transplanting) from each treatment were individually harvested and separated into shoots and roots. All the plant samples were washed with double-distilled water, heated at 105 °C for 30 min and dried at 80 °C until their weight remained constant; the dry weight (DW) was recorded. The N concentrations of the shoots and roots were determined using a SmartChem Discrete Auto Analyzer 200 (AMS Systea, Roma, Italy) with H2SO4-H2O2 digestion.
Five roots from each treatment were first separately cleaned with double-distilled water to remove the growth medium. Each sample was placed in a glass rectangular sink (300 mm × 200 mm × 20 mm) in batches with a layer of water approximately 6–8 mm deep to allow the roots to extend fully and minimize overlap for capturing images; each sample was scanned at 600 dpi with an automatic scanning apparatus (Perfection V700, Epson, Nagano, Japan). The total root length (sum of path length of the main and lateral roots), root surface area (sum of areas of the main and lateral roots), average root diameter (average diameter of the main and lateral roots), and root volume (sum of volumes of the main and lateral roots) were acquired by analysis of root images using WinRHIZO Pro 2009 software (Regent Instruments, Québec, QC, Canada).

2.3. RNA Quantification and Qualification

Total RNA was extracted manually from five mixed root tissues using a modified CTAB method [18] (three biological replicates) for a total of 15 root tissues per treatment. RNA integrity was assessed at 2.2 ≥ OD260/280 ≥ 1.8 using an RNA Nano 6000 Assay Kit with a Bioanalyzer 2100 system (Agilent Technologies, Palo Alto, CA, USA). RNA purity was checked using a NanoDrop spectrophotometer (Thermo Fisher, Waltham, MA, USA). RNA concentrations were measured using a Qubit RNA Assay Kit and a Qubit 3.0 Fluorometer (Life Technologies, Carlsbad, CA, USA). Equal amounts of total RNA from three biological replicates per condition were pooled to construct the cDNA library; the remaining RNA was carefully preserved for later use (quantitative real-time polymerase chain reaction, qRT-PCR). Sequencing was performed using the Illumina HiSeq X Ten platform and 150-bp paired-end module. The sequence data were deposited in the NCBI database and are accessible via BioProject ID: PRJNA518759.

2.4. Bioinformatic Analysis

The original image data obtained by high-throughput sequencing were converted to sequence data by CASAVA base calling. Each sample generated more than 8 gigabytes of data. For further analysis, the reads were filtered from raw sequencing data by removing adaptors and trimming low-quality (<Q30) reads. The processed reads were then mapped to the reference Brassica napus genome (http://brassicadb.org/brad/datasets/pub/Genomes/Brassica_napus/) [19], and transcript levels of unigenes were identified by HISAT2 (v2.0.5) [20,21]. The mapped reads for each sample were assembled using StringTie (v1.3.3) [20,22] with a reference-based approach. This method employs spliced reads to determine exon connectivity.
Cuffdiff (v1.3.0) [23] was utilized to calculate the fragments per kilobase of exon per million fragments mapped (FPKMs) for coding genes in each sample. Gene FPKMs were computed by summing the FPKMs of the transcripts in each gene group, which were calculated based on the length of the fragments and the read count mapped to each fragment. Cuffdiff (v2.2.1) [23] provides statistical methods for determining differential expression in digital transcript or gene expression data sets using a model based on a negative binomial distribution. Significantly differentially expressed genes (DEGs) were identified with the following criteria: corrected p-value < 0.05 (false discovery rate (FDR) < 0.05) and |log2(fold change)| ≥ 1.
Gene functional annotations were based on B. napus (http://www.genoscope.cns.fr/brassicanapus/) and Arabidopsis (https://www.arabidopsis.org/index.jsp) genome databases and matched to GO terms (http://www.geneontology.org/). GO enrichment analysis was carried out using PerlModule (GO:: TermFinder) [24]. GO terms with a corrected p-value < 0.05 were considered to be significantly enriched among the DEGs. R functions (phyper and qvalue) were applied to test for statistical enrichment of DEGs among Kyoto Encyclopedia of Genes and Genomes (KEGG) pathways. KEGG pathways with a corrected p-value < 0.05 were considered to be significantly enriched among the DEGs.

2.5. Quantitative RT-PCR Analysis

To validate the differential expression patterns of genes obtained by Illumina sequencing, qRT-PCR was conducted for 15 genes using total RNA from three biological replicates per treatment and gene-specific primer pairs designed based on the target gene sequences using Primer Premier 5.0 software (Table S1). First-strand cDNAs were synthesized from 1 µg of total RNA using Revert Aid Premium Reverse Transcriptase (Thermo Scientific™, EP0733). Three independent biological replicates and three technical replicates of each biological replicate were used for real-time PCR analysis. The total reaction volume for each qRT-PCR was 20 µL, which comprised 10 µL of SybrGreen qPCR Master Mix, 0.8 µL of forward and reverse primers, 2 µL of 1:10-diluted cDNA and 7.2 µL of double-distilled water. The PCR conditions were as follows: 95 °C for 3 min followed by 45 cycles of 95 °C and for 3 s 60 °C for 30 s. The reactions were performed using an ABI StepOne Plus Real-Time PCR system. The B. napus ACTIN7 gene-specific primer (Table S1) was employed as a control to normalize expression, and relative expression was calculated using the 2−∆Ct × 1000 method [25].

2.6. Statistical Analysis

All statistical analyses of data from the experiment and qRT-PCR were performed with Microsoft Excel (Microsoft Corporation, Redmond, WA, USA) and SPSS 22.0 (SPSS Inc., Chicago, IL, USA). Differences among treatments were analyzed by one-way analysis of variance (ANOVA) and differences between cultivars by the t-test. Differences were considered significant at p < 0.05.

3. Results

3.1. Effects of Different N Treatments on the Growth of Two Oilseed Rape Cultivars

As shown in Figure 1, the DW of both 15 and 814 shoots and roots decreased dramatically when the plants were supplied with NH4+. Compared with NT + AT, the NT treatment significantly decreased the DW of both 15 and 814 roots and the DW of 814 shoots, with no significant change in the DW of 15 shoots. Compared with the NT treatment, AT decreased the shoot and root DW by 81% and 77% and by 74% and 72% in 15 and 814, respectively. Although N concentrations in shoots and roots in the AT treatment were higher than those in the NT and NT + AT treatments for both cultivars, N accumulation in shoots and roots in the AT treatment was much lower than that in the NT and NT + AT treatments. Therefore, a high concentration of NH4+ as the sole N source was unfavorable to oilseed rape growth, N absorption and accumulation compared to a high concentration of NO3 as the sole N source. In addition, biomass and N accumulation of 15 shoots and roots in the NT treatment were significantly higher than those of 814 in this treatment.
The root morphology of the two cultivars was greatly influenced by the NT and AT treatments (Figure 2). Of the three N treatments, NT + AT most increased the root length, root surface area, and root volume of the two cultivars, and these traits were greater in the NT treatment group than in the AT treatment group for the two cultivars. Compared with NT, AT reduced the root length, root surface area and root volume of 15 and 814 by 10.6%, 12.0%, and 17.3% and by 16.7%, 19.4%, and 31.2%, respectively. In contrast, the diameter in the AT treatment group was thicker than that in the NT and NT + AT treatment groups for both cultivars, though the root length, root surface area and root volume of 15 (with high N efficiency) were higher than those of 814 in the NT and NT + AT treatment groups.

3.2. Summary of High-Throughput RNA Sequencing Data

In the transcriptomic experiment, cDNA from six samples was subjected to Illumina sequencing. The number of clean reads was 76,474,884, 74,236,004, 72,682,964, 69,526,330, 66,139,042, and 90,465,100 in 15-CK, 15-NT, 15-AT, 814-CK, 814-NT, and 814-AT, respectively, after trimming and filtering (Table S2); the total number of mapped reads was 89.72%, 83.44%, 89.10%, 89.20%, 83.44%, and 88.82%, respectively. The frequency of a >30 Phred quality score (Q30) was >92% and the guanine-cytosine (GC) content >46% for the six samples (Table S2). Approximately 83.44%–89.72% of the clean reads were successfully mapped to the B. napus genome (http://brassicadb.org/brad/datasets/pub/Genomes/Brassica_napus/) using TopHat2 software, and 65.05%–70.34% of the clean reads matched unique genomic locations (Table S2). In total, 57,749, 60,261, 56,295, 56,989, 58,473, and 57,842 genes were expressed in 15-CK, 15-NT, 15-AT, 814-CK, 814-NT, and 814-AT, respectively. These results suggested that the RNA-Seq data used in the present study were highly reliable.

3.3. Differentially Expressed Gene Analysis

Using the six samples, we constructed six comparison groups, CKvsNT (15), CKvsAT (15), NTvsAT (15), CKvsNT (814), CKvsAT (814), and NTvsAT (814), and 14,355 unigenes (Table S3) were identified as significant DEGs in the six comparison groups, which contained 6283, 1368, 6620, 5709, 1017, and 6515 DEGs (Figure 3a), respectively. Two comparisons between the CK and NT treatments (15 and 814) revealed 4582 and 4203 upregulated and 1701 and 1506 downregulated DEGs in 15 and 814, respectively; 501 and 271 upregulated and 867 and 746 downregulated DEGs were found between the CK and AT treatments (15 and 814, respectively) (Figure 3b). Furthermore, compared with NT, the AT treatment resulted in many more downregulated DEGs, with 5016 and 4944 in 15 and 814, respectively (Figure 3b). Correlation of gene expression levels among samples is an important index for testing the reliability of experiments and the rationality of sample selection: the closer the correlation coefficient is to 1, the higher is the similarity between samples. Table S3 shows Pearson correlations for gene expression levels between different comparison groups. The Pearson correlation of gene expression levels between 15-CK and 15-NT was only 0.261, whereas that between 15-CK and 15-AT was as high as 0.876 (Table S4). As expected, the Pearson correlation between 814-CK and 814-NT was only 0.275, but that between 814-CK and 814-AT was as high as 0.946 (Table S4). This finding indicated fundamental differences in gene expression levels between the NT and AT treatments and that gene expression levels in oilseed rape roots in the AT treatment group were similar to those in the CK treatment group.

3.4. Gene Ontology Enrichment Analysis of Differentially Expressed Genes

GO enrichment analysis was performed to broadly classify all of the DEGs into corresponding biological process, molecular function, and cellular component categories. GO terms in each category were sorted from lowest to highest by corrected p-values. To understand the distinct response of the two genotypes to the NT and AT treatments, we analyzed the enriched GO terms of the comparison groups CKvsNT (15 and 814) (Figure S1) and CKvsAT (15 and 814) (Figure S2). There were more upregulated than downregulated DEGs in enriched GO terms for CKvsNT (15 and 814); more downregulated than upregulated DEGs were detected among enriched GO terms for CKvsAT (15 and 814). Moreover, the numbers of DEGs for CKvsNT (15 and 814) were much higher than those for CKvsAT (15 and 814). Furthermore, the number of downregulated DEGs among enriched GO terms was also greater than the number of upregulated DEGs for NTvsAT (15 and 814) (Figure 4). In addition, highly enriched GO terms for NTvsAT DEGs according to the biological process category are involved in translation, RNA methylation, and macromolecule methylation; those according to the molecular function category included structural constituent of ribosome, structural molecule activity, and rRNA binding predominated, those and according to the cellular component category included ribosome, cytosolic ribosome and ribosomal subunit. These results indicate distinctive differences in the transcript levels of certain genes between the NT and AT treatments.

3.5. Kyoto Encyclopedia of Genes and Genomes Metabolic Pathway Enrichment Analysis

Pathway enrichment analysis of DEGs using the KEGG database (http://www.genome.jp/kegg/) identified 122, 123, 118, 110, 124, and 124 KEGG pathways for the six comparison groups CKvsNT (15), CKvsNT (814), CKvsAT (15), CKvsAT (814), NTvsAT (15), and NTvsAT (814), respectively. The top 15 enriched pathways for the two genotypes contained more upregulated DEGs than downregulated DEGs for CKvsNT (Figure S3) but more downregulated DEGs than upregulated DEGs for CKvsAT (Figure S4). DEGs involved in ribosome, biosynthesis of secondary metabolites and phenylalanine metabolism were more enriched in CKvsNT, whereas DEGs involved in biosynthesis of secondary metabolites, phenylalanine metabolism and phenylpropanoid biosynthesis were more enriched in CKvsAT. In NTvsAT (Figure 5), there were more downregulated than upregulated DEGs, and DEGs involved in ribosome, phenylalanine metabolism and biosynthesis of secondary metabolites were highly enriched.

3.6. Genes Involved in Starch and Sucrose Metabolism, Fatty Acid Biosynthesis, Ribosome and Cell Wall Biogenesis

Carbohydrates, lipids and proteins are the main organic materials that compose plant cells and provide energy. In the pathway enrichment analysis in this study, we found three metabolic pathways, namely, starch and sucrose metabolism (SSM) (ko00500), fatty acid biosynthesis (FAB) (ko00061) and ribosome (RIB) (ko03010), which are the primary pathways of carbohydrate metabolism, lipid metabolism and translation, respectively, to be enriched in CKvsNT and NTvsAT. DEGs involved in SSM, FAB, and RIB showed the same trend. The numbers of DEGs involved in SSM, FAB, and RIB in CKvsNT (15 and 814) and NTvsAT (15 and 814) were greater than those in CKvsAT (15 and 814) (Table 2). Moreover, there were more upregulated DEGs in SSM, FAB, and RIB and fewer downregulated DEGs in the NT treatment group than in the CK treatment group, despite few differences in response to the AT treatment. There were fewer upregulated DEGs in SSM, FAB, and RIB and more downregulated DEGs in the AT treatment group than in the NT treatment group. Information on the DEGs involved in SSM, FAB, and RIB in the six comparison groups is provided in Table S5. To further determine whether the molecular levels of carbohydrates, lipids and proteins were significantly altered in the different N treatments, we examined the numbers of up- and downregulated DEGs for each pathway in carbohydrate metabolism, lipid metabolism and translation in the six comparison groups (Table S6). The results indicate that carbohydrate metabolism, lipid metabolism and protein metabolism were inhibited in the AT treatment group, which led to decreased growth.
The cell wall is the major component of plant roots. In the GO term analysis performed in this study, we found that the numbers of DEGs involved in primary cell wall biogenesis (CWB) (GO: 0009833) differed between the comparison groups (Table 2). There were 8 and 6 upregulated DEGs in CKvsNT (15 and 814), 9 and 5 downregulated DEGs in NTvsAT (15 and 814) and, interestingly, no DEGs in CKvsAT (15 and 814). Furthermore, DEGs associated with CWB are members of the cellulose synthase (CESA) gene superfamily, including CESA1, CESA2, CESA3, and CESA6 (Table S5). Therefore, NT treatment enhanced the transcriptional levels of genes related to CWB, whereas AT treatment had no effect on primary CWB.

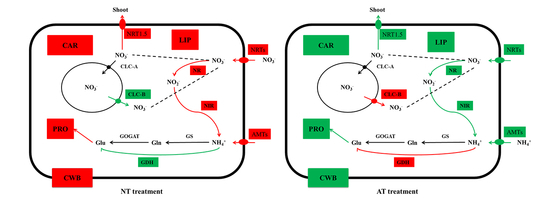
3.7. Genes Related to N Uptake, Transport, and Assimilation

N metabolism in plants mainly involves three processes: N uptake, transport and assimilation. Many genes involved in NO3/NH4+ uptake, transport and assimilation were differentially expressed in the six samples (Tables S2 and S6). In the current study, 27 DEGs encoding NO3 transporters (NRT1, NRT1.5, NRT 1.8, NRT2, NRT3, and CLC-B (chloride channel protein B)) were detected (Figure 6, Table S7). The abundances of the transcripts of these genes, except for 1 DEG (BnaC09g20910D), were increased in CKvsNT; transcript levels of 4 genes decreased in CKvsAT (15). In NTvsAT, the transcript levels of most DEGs were reduced in both 15 and 814, but 2 DEGs (BnaC09g20910D and BnaC02g36720D) were upregulated only in 15. A total of 5 genes encoding NH4+ transporters were identified, of which BnaCnng01740D was responsive only in 15 among the six samples (Table S7). Transcript levels of 3 DEGs were increased in CKvsNT (15). Two DEGs were upregulated in CKvsNT (814), though the other 2 DEGs were downregulated (Figure 6). One DEG (BnaA01g23190D) was upregulated in NTvsAT (814). Two DEGs were downregulated in NTvsAT (15 and 814).
Some of the DEGs encode key enzymes in NO3/NH4+ assimilation, including 4 DEGs encoding nitrate reductase (NR), 10 DEGs encoding cytochrome B5 (CB5) of NR, 2 DEGs encoding nitrite reductase (NIR), 5 DEGs encoding glutamine synthetase (GS), and 5 DEGs encoding glutamate dehydrogenase (GDH) (Figure 6, Table S7). In CKvsNT, there were more upregulated DEGs than downregulated DEGs encoding NR, CB5, NIR, and GS in the two cultivars. In CKvsAT, there were more downregulated DEGs than upregulated DEGs encoding NR, CB5 and GS in the two cultivars. In NTvsAT, 1 DEG encoding NR, 5 DEGs encoding CB5, and 1 DEG encoding NIR were downregulated; 1 upregulated DEG and 1 downregulated DEG encode GS1.3 and GS2, respectively (Table S7). Interestingly, DEGs encoding GDH were always downregulated in CKvsNT and upregulated in NTvsAT.

3.8. Validation of Genes Using Quantitative Real-Time PCR

To confirm the accuracy and reproducibility of the Illumina RNA-Seq results, 15 representative genes were chosen based on the above analysis, and their expression levels in 15 and 814 in the different N treatment groups were validated by quantitative real-time PCR (qRT-PCR) (Figure 7a). The 15 representative genes encoded low- and high-affinity NO3/NH4+ transporters, NR, NIR, GS, GDH, and catalytic subunits of cellulose synthase, which are key proteins or enzymes in N metabolism and root development. Among these DEGs, the qRT-PCR profiles for the 15 representative genes mostly agreed with those obtained from RNA-Seq, with minimal differences in expression (Figure 7a). Pearson correlation (coefficient 0.9576) revealed strong agreement between the qRT-PCR data for these genes and the RNA-Seq results (Figure 7b). Therefore, the RNA-Seq data presented herein are reliable.

4. Discussion

NO3 and NH4+ are the main N sources for oilseed rape, but studies investigating the effects of NO3 and NH4+ on the physiology and transcriptome levels of oilseed rape are scarce. Our primary goal in this work was to differentiate the physiological and molecular effects of the two most common sources of N utilized by oilseed rape: NO3 and NH4+. There were clear, distinct differences in physiology and transcriptome levels between NO3 and NH4+ nutrition.

4.1. Oilseed Rape Seedling Growth Was Inhibited by AT treatment

In the physiological experiment, compared with a high concentration of NO3 as the sole N source, a high concentration of NH4+ significantly reduced oilseed rape biomass, root growth, and N accumulation. These results indicate that a high concentration of NH4+ as the sole N source is a source of stress for oilseed rape but that NO3 or NO3 plus a small amount of NH4+ is a suitable N nutrition environment for growth. Some studies have found that NO3 plus a small amount of NH4+ is beneficial for the growth of crops that prefer NO3 [6] and that NH4+ plus a small amount of NO3 is beneficial for the growth of crops that prefer NH4+ [26]. Additionally, some studies have confirmed that a single application of NH4+ or overapplication of NH4+ is conducive to the growth of most dryland crops [5,6]. As NO3 taken up by plant cells can be stored in large quantities in vacuoles, this form of N is non-toxic for plants. NO3 concentrations in plant cell vacuoles and the cytoplasm range 30–50 mol/m3 and 3–5 mol/m3 [27,28], respectively, whereas NH4+ is rarely found in vacuoles. Indeed, NH4+ taken up by plant cells must be combined with organic acids as soon as possible, leading to the synthesis of amino acids or amides and the acidification of cells. Recent studies have suggested that NH4+ can restrain uptake of K+, Ca2+, Mg2+, and other cations by crops [6]. A high concentration of NH4+ can also suppress the activities of key enzymes in crop N metabolism, such as NR, GS, and GOGAT (Glutamate synthase) [29]. Therefore, a high concentration of NH4+ is likely to result in NH4+ toxicity in dryland crops. In summary, oilseed rape appears to be a nitrate-preferring crop.
The N efficiency of a crop has two meanings. On the one hand, it refers to the amount of N absorbed by crops at the same N supply level; on the other hand, it refers to high use efficiency of the N absorbed and the amount of dry matter produced per unit of N absorbed [30]. In this experiment, compared with the N-inefficient cultivar 814, the N-efficient cultivar 15 displayed better root architecture and higher N use efficiency under the NT treatment. The root system is the main organ for absorbing water and nutrients and is important for organic matter assimilation, transformation, and synthesis [31]. The 15 cultivar showed a better root length, root surface, and root volume than did 814, which led to more N uptake and accumulation in 15 than in 814 under the NT treatment. Our previous work [16] showed that compared with the N-efficient cultivar 15, the N-inefficient cultivar 814 stores more NO3 absorbed by the root system in root vacuoles, resulting in a decrease in NO3 transported from the root system to the aboveground part. However, to meet the growth and developmental needs of the aboveground part, the root system of the 814 cultivar needs to absorb more NO3. In other words, the 814 cultivar must absorb more NO3 to produce the same biomass as 15, which leads to lower N use efficiency in the former.
GO (Figure S6) and KEGG (Figure S7) analyses of DEGs between 15 and 814 at 48 h after NT treatment (15vs814(NT)) revealed some differences in gene expression between the two cultivars, especially DEGs related to the cell wall (Table S8) and N metabolism (Table S9). Overall, 1877 DEGs (734 upregulated and 1143 downregulated) were identified (Figure S5). GO analysis showed high enrichment of DEGs involved in the organonitrogen compound metabolic process, oxidoreductase activity, catalytic activity and the cell wall, which was consistent with a recent report using 15 and 814 as test materials treated with low NO3 (0.30 mm/L) for 0 h, 3 h, and 72 h [32]. The expression levels of both BnaA02g13640D (NRT1) and BnaA01g26960D (NRT1), which are responsible for efficient NO3 uptake, were higher in the roots of 15 than in 814 in our study. In contrast, mRNA levels of BnaA09g47380D (NRT1.1) and BnaC08g43380D (NRT2.1) were much higher in the roots of 15 than in 814 in the recent report [32], particularly under low NO3. Because the N solution concentration, N treatment time and seedling period were different between our study and the previous report, we conclude that the discrepancy may be attributed to gene expression being affected by the growth period and N treatment. In previous hydroponic and sand culture experiments, we found no significant differences in phenotypes (growth and physiology indexes) between 15 and 814 under NT treatment during the early seedling period (0–50 d after seedling emergence). Therefore, to analyze the transcriptomic results between 15 and 814 under NT treatment at different growth periods, it is helpful to comprehensively understand the molecular mechanism of N efficiency differences in oilseed rape.
Although a high concentration of NH4+ as the sole N source is detrimental to oilseed rape growth at the physiological level, the related transcriptomic changes remain largely unknown. In our study, we applied RNA-Seq to evaluate gene expression under different N treatments in the roots of seedlings of the two genotypes and examined many of the genes that were differentially expressed among the CK, NT and AT treatments. These genes are mainly involved in N metabolism, CWB, and carbohydrate, lipid and protein metabolism.

4.2. N Metabolism of Oilseed Rape Was Inhibited by AT treatment

Compared with CK, most genes involved in N metabolism were markedly elevated by the NT treatment, though these genes were not induced by the AT treatment. The latest transcriptomics results for N limitation (0.3 mmol/L NO3) in oilseed rape show that genes related to N uptake and allocation, such as BnaNRT1.1 s (B. napus nitrate transporter 1.1 s), BnaNRT1.4 s, BnaNRT1.5 s, BnaNRT1.9 s, BnaNRT2.1 s, BnaNRT2.4 s, and BnaNRT3.1 s, are induced in roots by N limitation, and N metabolism genes such as BnaGS1s and BnaGS2s are also elevated in roots under N limitation; in contrast, genes such as BnaNRT1.8 s, BnaNIA1s, and BnaNIA2s are downregulated in roots [33]. These results are not consistent with our findings. The majority of genes related to N metabolism were induced in the roots of oilseed rape exposed to N limitation, whereas these genes were mostly strongly repressed in roots by the N-free (CK) treatment. This might be caused by the different adaptive mechanisms of oilseed rape in response to N limitation or N-free conditions. Overall, increased N uptake and transport and enhanced assimilation of inorganic N into amino acids might be helpful for the adaptability of oilseed rape to N limitation [33].
NT treatment enhanced expression of BnNRTs but AT treatment decreased that of BnAMTs in oilseed rape. Four types of transporters, namely, low- and high-affinity NO3 transporters (NRTs)/NH4+ transporters (AMTs), take up and reallocate NO3 and NH4+ in angiosperms, respectively [34]. NO3 induction of GmNRT2 mRNA expression was accompanied by a fourfold increase in net NO3 uptake by soybean roots under 100 μM external NO3 [35]. In addition, correlation coefficients between 13NO3 influx from 100 μM and 5 mM [NO3] suggest that in A. thaliana, high- and low-affinity transport systems are mediated primarily by AtNRT2.1 and AtNRT1.1, respectively [36]. In our physiology experiment, N accumulation in the NT treatment group was significantly higher than that in the AT treatment group. Therefore, upregulated expression of most BnNRTs under NT treatment greatly promoted NO3 uptake by oilseed rape. Recent research has demonstrated that downregulation of AtAMT1 genes, which mediate the majority of NH4+ uptake in Arabidopsis roots, is associated with decreased NH4+ accumulation in the AtNRT1.1 mutants chl1-1 and chl1-5 under conditions of high NH4+ [29]. The adjustment of oilseed rape to excessive NH4+ conditions via downregulation of the transcript levels of BnAMTs might be an adaptive mechanism (Figure 8) for reducing NH4+ uptake. Other research also supports this mechanism. For example, 13NH4+ influx and transcript levels of OsAMT1.3 in roots decreased within 48 h when plants acclimated to 10 µm of external NH4+ for 3 weeks were transferred to 10 mm NH4+ [37].
NT treatment increased expression of BnNRT1.5 while decreasing that of BnCLC-B. Long-distance transport and distribution of NO3 between roots and shoots are regulated by two genes encoding components involved in long-transport mechanisms. NRT1.5 is responsible for NO3 xylem loading, and NRT1.8 is responsible for NO3 xylem unloading [38,39]. BnNRT1.5 expression in the roots of oilseed rape increased significantly with NO3 treatment, driving greater NO3 long-distance transport from roots to shoots [16], which was beneficial for oilseed rape growth because NO3 assimilation efficiency is known to be higher in shoots than in roots due to solar energy utilization by shoots [40]. The NT treatment resulted in overexpression of all three NRT1.5 genes in both genotypes (Tables S3 and S7), indicating that more NO3 was transported to the shoot from the root for assimilation under NT. Thus, the NO3 assimilation efficiency of oilseed rape was promoted by the NT treatment. AtCLC-B, one of seven AtCLC transport proteins in A. thaliana that are responsible for vacuolar NO3 short-distance transport and are the main channels for NO3 movement between vacuoles and the cytosol, conducts strong outwardly rectifying anionic currents that are greatest in the presence of NO3 [16,41,42]. Highly expressed BnaC02g36720D (BnCLC-B) most likely led to increased transport of NO3 from vacuoles into the cytosol to satisfy the demand for NO3 in the AT treatment group (Figure 6 and Figure 8). This result further verified that oilseed rape is a nitrate-preferring crop.
NT treatment led to upregulation of more genes encoding NR, CB5, and NIR than did AT treatment. NO3 reduction involves concerted reactions in which NO3 is reduced to nitrite (NO2) by NR and NO2 is reduced to NH4+ by NIR [43]. Each NR subunit contains 3 prosthetic groups, namely, FAD, heme (CB5) and a molybdenum cofactor (MoCo) [44]. As previously reported for many higher plant species, transcriptional and nitrate-inducible regulation is one of the major mechanisms of NR activity in rapeseed [45]. Previous studies have also demonstrated that nitrate-supplied Arabidopsis roots exhibit large increases in the abundance of NR (At1g77760), NR (At2g15620) and NADH-GOGAT (At5g53460) transcripts and a >10-fold increase in NR enzyme activity [14]. Hence, our results are consistent with the above results.
Furthermore, BnGDH2 was specifically induced by the AT treatment (Figure 6 and Figure 8). GDH may play a major role in maintaining a subtoxic NH4+ level in the cytoplasm [46] and might operate via amination. GDH responds positively to abiotic stress and is important for the detoxification of NH4+ under stress [47,48,49]. In addition, transcriptomic analysis of Arabidopsis roots supplied with NO3 or NH4+ demonstrated that AtGDH2 is specifically induced by NH4+ [14], which is consistent with our results. Hence, we can conclude that oilseed rape roots endured the excessive but subtoxic NH4+ level in the cytoplasm under AT treatment by upregulating the transcript levels of BnGDH2 (Figure 8), which further suggests that a high concentration of NH4+ tends to result in NH4+ toxicity in oilseed rape roots at the transcriptome level.

4.3. Expression Levels of Genes Involved in Cell Wall Biogenesis Decreased with AT treatment

In this work, the root length, root surface area and root volume in the NT treatment group were significantly greater than those in the AT treatment group, which demonstrated that AT inhibited root development. All plant cells are surrounded by an extensible primary cell wall, which contains cellulose, pectin and noncellulosic polysaccharides [50]. Additions and rearrangements of cell wall components are required throughout growth and development, such as for cell elongation and cell proliferation in developing roots [51]. The AtCESA gene superfamily, which encodes the catalytic subunits of cellulose synthase, has been identified in hundreds of seed plant species and well characterized in Arabidopsis [52]. Plants have evolved complex regulatory mechanisms, including expression of CESA genes and modification of CESA proteins, to control cellulose biosynthesis and assembly in cell walls [53]. In this work, genes related to primary CWB (GO: 0009833) (Figure 8) were differentially expressed under the different N treatments, including BnCESA1, BnCESA2, BnCESA3, and BnCESA6, which encode cellulose synthase family proteins (Table S4). In A. thaliana, AtCESA1 (A. thaliana cellulose synthase 1), AtCESA3, and AtCESA6 are preferentially expressed in expanding tissues [54], but AtCESA2 is poorly understood. The NT treatment greatly increased the transcript levels of BnCESA1, BnCESA2, BnCESA3, and BnCESA6, whereas the AT treatment had no distinct effects (Table S5, Figure 8). This difference might constitute one line of evidence explaining why AT treatment inhibited root development in oilseed rape in this study.
In summary, there were significant differences between NO3 and NH4+ nutrition with regard to biomass, N accumulation and root architecture in oilseed rape cultivars. The potential molecular mechanisms may be explained by most of the downregulated genes being related to N metabolism, cell wall biosynthesis, and carbohydrate, lipid, and protein metabolism in oilseed rape exposed to a high concentration of NH4+. To the best of our knowledge, this is the first comprehensive transcriptomic analysis of oilseed rape grown under NO3 and NH4+ conditions, and the findings provide valuable resources for better understanding the responses of oilseed rape to NO3 and NH4+ and subsequent improvement of N utilization efficiency.

5. Conclusions

In the present study, the biomass, N accumulation and root architecture of two oilseed rape cultivars with different N efficiencies were significantly and analogously influenced by NO3 and NH4+ nutrition. To reveal the molecular mechanisms responsible for the differences in the two cultivars in response to CK, NO3, and NH4+ conditions, RNA-Seq of root samples collected at 48 h after exposure to different N treatments was performed to analyze gene expression patterns related to N metabolism and other crucial metabolic pathways in plants. NH4+ directly decreased the biomass, N accumulation, and root architecture of the two oilseed rape cultivars and affected the overall metabolism of shoots and roots; this result was related to downregulated expression of NO3/NH4+ transporters or channels and crucial metabolic pathways (including carbohydrate, lipid, and protein metabolism) in the two oilseed rapes. The root expression levels of CESA genes encoding cellulose synthase decreased under NH4+ nutrition, inhibiting root growth. These results provide insight into the regulatory mechanisms of some candidate genes, which will reveal the molecular mechanisms of decreased oilseed rape growth in response to a high concentration of NH4+ as the sole N source.

Supplementary Materials

The following are available online at https://www.mdpi.com/2073-4425/10/5/391/s1, Figure S1: Enriched Gene Ontology terms in comparison group CKvsNT (15 and 814). Figure S2: Enriched Gene Ontology terms in comparison group CKvsAT (15 and 814). Figure S3: Top fifteen enriched Kyoto Encyclopedia of Genes and Genomes (KEGG) pathways in CKvsNT (15 and 814). Figure S4: Top fifteen enriched Kyoto Encyclopedia of Genes and Genomes (KEGG) pathways in CKvsAT (15 and 814). Figure S5: Numbers of up- and downregulated DEG and fold change were analyzed in 15vs814 (NT). Figure S6: Enriched Gene Ontology (GO) terms in 15vs814 (NT). Figure S7: Top fifteen enriched Kyoto Encyclopedia of Genes and Genomes (KEGG) pathways in 15vs814 (NT). Table S1: List of primer sequences used for qRT-PCR analysis. Table S2: Summary of transcriptomic data. Table S3: Information for the 14,355 significantly differentially expressed genes (DEGs) detected in the six cDNA libraries. Table S4: Pearson correlation of gene expression levels between different comparison groups. Table S5: Information on the differentially expressed genes (DEGs) involved in starch and sucrose metabolism, fatty acid biosynthesis, ribosome and plant-type primary cell wall biogenesis in the six comparison groups. Table S6: Numbers of up- and downregulated genes in each pathway involved in carbohydrate metabolism, lipid metabolism and translation in the six comparison groups. Table S7: Genes encoding NO3/NH4+ protein transporters and assimilation enzymes differing in expression between genotypes in response to different nitrogen treatments. Table S8: Numbers of up- and downregulated DEGs related to cell wall in 15vs814(NT). Table S9: Important DEGs related to N uptake, transport and assimilation in 15vs814(NT).

Author Contributions

W.T., L.L., and C.G. conceived and designed the experiments. W.T., F.W., and C.S. prepared the experimental materials. The bioinformatics analysis was carried out by W.T. and X.H. W.T. wrote the manuscript. L.Q., X.H., and Z.Z. provided intellectual input and revised the manuscript. All authors read and approved the final manuscript.

Funding

This work was supported by the Earmarked Fund for China Agriculture Research System (CARS-13), the National Science and Technology Support Project of China (2014BAD11B03) and the Oil Crop Innovation Team in Yunnan Province, China (2017HC021).

Conflicts of Interest

The authors declare no conflict of interest.

References

  1. Lu, Y.L.; Xu, Y.C.; Shen, Q.R.; Dong, C.X. Effects of different nitrogen forms on the growth and cytokinin content in xylem sap of tomato (Lycopersicon esculentum Mill.) seedlings. Plant Soil 2009, 315, 67–77. [Google Scholar] [CrossRef]
  2. Yang, S.Y.; Hao, D.L.; Song, Z.Z.; Yang, G.Z.; Wang, L.; Su, Y.H. RNA-seq analysis of differentially expressed genes in rice under varied nitrogen supplies. Gene 2015, 555, 305–317. [Google Scholar] [CrossRef] [PubMed]
  3. Ruan, J.; Gerendas, J.; Hardter, R.; Sattelmacher, B. Effect of nitrogen form and root-zone ph on growth and nitrogen uptake of tea (Camellia sinensis) plants. Ann. Bot. 2006, 99, 301–310. [Google Scholar] [CrossRef] [PubMed]
  4. Wu, F.Z.; Wang, H.X.; Chen, Y.M.; Li, G.Z. Blueberry physiological ecology research progress in our country. North. Hortic. 2006, 3, 48–49. [Google Scholar]
  5. Elgharably, A.; Marschner, P.; Rengasamy, P. Wheat growth in a saline sandy loam soil as affected by N form and application rate. Plant Soil 2010, 328, 303–312. [Google Scholar] [CrossRef]
  6. Liu, N.; Zhang, L.; Meng, X.X.; Neelam, A.; Yang, J.H.; Zhang, M.F. Effect of nitrate/ammonium ratios on growth, root morphology and nutrient elements uptake of watermelon (Citrullus lanatus) seedlings. J. Plant Nutr. 2014, 37, 14. [Google Scholar]
  7. Hachiya, T.; Watanabe, C.K.; Fujimoto, M.; Ishikawa, T.; Takahara, K.; Kawaiyamada, M.; Uchimiya, H.; Uesono, Y.; Terashima, I.; Noguchi, K. Nitrate addition alleviates ammonium toxicity without lessening ammonium accumulation, organic acid depletion and inorganic cation depletion in Arabidopsis thaliana shoots. Plant Cell Physiol. 2012, 53, 577–591. [Google Scholar] [CrossRef]
  8. Rathke, G.W.; Behrens, T.; Diepenbrock, W. Integrated nitrogen management strategies to improve seed yield, oil content and nitrogen efficiency of winter oilseed rape (Brassica napus L.). A review. Agric. Ecosyst. Environ. 2006, 117, 80–108. [Google Scholar] [CrossRef]
  9. Zhang, Z.H.; Song, H.X.; Liu, Q.; Rong, X.M.; Peng, J.W.; Xie, G.X.; Zhang, Y.P.; Chen, L.R.; Guan, C.Y.; Gu, J.D. Responses of seed yield and quality to nitrogen application levels in two oilseed rape (Brassica napus L.) varieties differing in nitrogen efficiency. Plant Prod. Sci. 2012, 15, 265–269. [Google Scholar] [CrossRef]
  10. Kessel, B.; Schierholt, A.; Becker, H.C. Nitrogen use efficiency in a genetically diverse set of winter oilseed rape (Brassica napus L.). Crop Sci. 2012, 52, 2546–2554. [Google Scholar] [CrossRef]
  11. Falkengrengrerup, U. Interspecies differences in the preference of ammonium and nitrate in vascular plants. Oecologia 1995, 102, 305–311. [Google Scholar] [CrossRef]
  12. Correa, E.F.; Germon, J.C. Dissimilative nitrate reduction to ammonium in different soils in waterlogged conditions. Develop. Geochem. 1991, 6, 295–308. [Google Scholar]
  13. Tang, W.J.; Guan, C.Y.; Lin, L.B.; Li, L.P.; Zhang, Z.H.; Wan, F.; Xiao, G.; Li, B.; Liu, Y.X. Effects of nitrate and ammonium supply ratios on growth, physiology and yield of oilseed rape (Brassica napus L.). J. Plant Nutr. Fert. 2018, 24, 1338–1348. [Google Scholar]
  14. Patterson, K.; Cakmak, T.; Cooper, A.; Lager, I.; Rasmusson, A.G.; Escobar, M.A. Distinct signalling pathways and transcriptome response signatures differentiate ammonium- and nitrate-supplied plants. Plant Cell Environ. 2010, 33, 1486–1501. [Google Scholar] [CrossRef] [Green Version]
  15. Yang, Y.Y.; Wang, F.; Wan, Q.; Ruan, J.Y. Transcriptome analysis using RNA-seq revealed the effects of nitrogen form on major secondary metabolite biosynthesis in tea (Camellia sinensis) plants. Acta Physiol. Plant. 2018, 40, 127. [Google Scholar] [CrossRef]
  16. Han, Y.L.; Song, H.X.; Liao, Q.; Yu, Y.; Jian, S.F.; Lepo, J.E.; Liu, Q.; Rong, X.M.; Tian, C.; Zeng, J.; et al. Nitrogen use efficiency is mediated by vacuolar nitrate sequestration capacity in roots of Brassica napus. Plant Physiol. 2016, 170, 1684. [Google Scholar] [CrossRef]
  17. Zhang, Z.H.; Song, H.X.; Liu, Q.; Rong, X.M.; Xie, G.X.; Peng, J.W.; Zhang, Y.P.; Guan, C.Y.; Chen, S.Y. Nitrogen redistribution characteristics of oilseed rape varieties with different nitrogen use efficiencies during later growth period. Commun. Soil Sci. Plant Anal. 2010, 41, 1693–1706. [Google Scholar] [CrossRef]
  18. Zhang, H.P.; Wu, J.Y.; Tao, S.T.; Wu, T.; Qi, K.J.; Zhang, S.J.; Wang, J.Z.; Huang, W.J.; Wu, J.; Zhang, S.L. Evidence for apoplasmic phloem unloading in pear fruit. Plant Mol. Biol. Rep. 2014, 32, 931–939. [Google Scholar] [CrossRef]
  19. Chalhoub, B.; Denoeud, F.; Liu, S.Y.; Parkin, I.A.P.; Tang, H.B.; Wang, X.Y.; Chiquet, J.; Belcram, H.; Tong, C.B.; Samans, B.; et al. Early allopolyploid evolution in the post-Neolithic Brassica napus oilseed genome. Science 2014, 345, 950–953. [Google Scholar] [CrossRef]
  20. Pertea, M.; Kim, D.; Pertea, G.M.; Leek, J.T.; Salzberg, S.L. Transcript level expression analysis of RNA-seq experiments with hisat, stringtie and ballgown. Nat. Protoc. 2016, 11, 1650–1667. [Google Scholar] [CrossRef]
  21. Kim, D.; Langmead, B.; Salzberg, S.L. HISAT: A fast spliced aligner with low memory requirements. Nat. Methods 2015, 12, 357–360. [Google Scholar] [CrossRef]
  22. Pertea, M.; Pertea, G.M.; Antonescu, C.M.; Chang, T.C.; Mendell, J.T.; Salzberg, S.L. Stringtie enables improved reconstruction of a transcriptome from RNA-seq reads. Nat. Biotechnol. 2015, 33, 290–295. [Google Scholar] [CrossRef]
  23. Trapnell, C.; Roberts, A.; Goff, L.; Pertea, G.; Kim, D.; Kelley, D.R.; Pimentel, H.; Salzberg, S.L.; Rinn, J.L.; Pachter, L. Differential gene and transcript expression analysis of RNA-seq experiments with TopHat and Cufflinks. Nat. Protoc. 2012, 7, 562–578. [Google Scholar] [CrossRef] [Green Version]
  24. Boyle, E.I.; Weng, S.; Gollub, J.; Jin, H.; Botstein, D.; Cherry, J.M.; Sherlock, G. Go:: Termfinder-open source software for accessing gene ontology information and finding significantly enriched gene ontology terms associated with a list of genes. Bioinformatics 2004, 20, 3710–3715. [Google Scholar] [CrossRef]
  25. An, X.; Chen, J.; Zhang, J.Y.; Liao, Y.W.; Dai, L.J.; Wang, B.; Liu, L.J.; Peng, D.X. Transcriptome profiling and identification of transcription factors in ramie (Boehmeria nivea L. gaud) in response to peg treatment, using illumina paired-end sequencing technology. Int. J. Mol. Sci. 2015, 16, 3493–3511. [Google Scholar] [CrossRef]
  26. Gao, Y.X.; Li, Y.; Yang, X.X.; Li, H.J.; Shen, Q.R.; Guo, S.W. Ammonium nutrition increases water absorption in rice seedlings (Oryza sativa L.) under water stress. Plant Soil 2010, 331, 193–201. [Google Scholar] [CrossRef]
  27. Martinoia, E.; Heck, U.; Wiemken, A. Vacuoles as storage compartments for nitrate in barley leaves. Nature 1981, 289, 292–294. [Google Scholar] [CrossRef]
  28. Martinoia, E.; Massonneau, A.; Frangne, N. Transport processes of solutes across the vacuolar membrane of higher plants. Plant Cell Physiol. 2000, 41, 1175–1186. [Google Scholar] [CrossRef]
  29. Jian, S.F.; Liao, Q.; Song, H.X.; Liu, Q.; Lepo, J.E.; Guan, C.Y.; Zhang, J.H.; Ismail, A.M.; Zhang, Z.H. NRT1.1-related NH4+ toxicity is associated with a disturbed balance between NH4+ uptake and assimilation. Plant Physiol. 2018. [Google Scholar] [CrossRef]
  30. Moll, R.H.; Kamprath, E.J.; Jackson, W.A. Analysis and interpretation of factors which contribute to efficiency of nitrogen utilization. Agron. J. 1982, 74, 562–568. [Google Scholar] [CrossRef]
  31. Sinha, S.K.; Sevanthi, V.A.M.; Chaudhary, S.; Tyagi, P.; Venkadesan, S.; Rani, M.; Mandal, P.K. Transcriptome Analysis of two rice varieties contrasting for nitrogen use efficiency under chronic N starvation reveals differences in chloroplast and starch metabolism-related genes. Genes 2018, 9, 206. [Google Scholar] [CrossRef]
  32. Hua, Y.P.; Zhou, T.; Liao, Q.; Song, H.X.; Guan, C.Y.; Zhang, Z.H. Genomics-assisted identification and characterization of the genetic variants underlying differential nitrogen use efficiencies in allotetraploid rapeseed genotypes. G3 2018, 8, 2757–2771. [Google Scholar] [CrossRef]
  33. Zhang, Z.H.; Zhou, T.; Liao, Q.; Yao, J.Y.; Liang, G.H.; Song, H.X.; Guan, C.Y.; Hua, Y.P. Integrated physiologic, genomic and transcriptomic strategies involving the adaptation of allotetraploid rapeseed to nitrogen limitation. BMC Plant Biol. 2018, 18, 322. [Google Scholar] [CrossRef]
  34. Wittgenstein, N.J.V.; Le, C.H.; Hawkins, B.J.; Ehlting, J. Evolutionary classification of ammonium, nitrate, and peptide transporters in land plants. BMC Evol. Biol. 2014, 14, 11. [Google Scholar] [CrossRef]
  35. Amarasinghe, B.H.R.R.; Bruxelles, G.L.D.; Braddon, M.; Onyeocha, I.; Forde, B.G.; Udvardi, M.K. Regulation of GmNRT2 expression and nitrate transport activity in roots of soybean (Glycine max). Planta 1998, 206, 44–52. [Google Scholar] [CrossRef]
  36. Okamoto, M. Regulation of NRT1 and NRT2 gene families of Arabidopsis thaliana: Responses to nitrate provision. Plant Cell Physiol. 2003, 44, 304–317. [Google Scholar] [CrossRef]
  37. Kumar, A.; Silim, S.S.; Okamoto, M.; Siddiqi, M.Y.; Glass, A.D.M. Differential expression of three members of the AMT1 gene family encoding putative high-affinity NH4+ transporters in roots of Oryza sativa subspecies indica. Plant Cell Environ. 2010, 26, 907–914. [Google Scholar] [CrossRef]
  38. Lin, S.H.; Kuo, H.F.; Canivenc, G.; Lin, C.S.; Lepetit, M.; Hsu, P.K.; Tillard, P.; Lin, H.L.; Wang, Y.Y.; Tsai, C.B.; et al. Mutation of the Arabidopsis NRT1.5 nitrate transporter causes defective root-to-shoot nitrate transport. Plant Cell 2008, 20, 2514–2528. [Google Scholar] [CrossRef]
  39. Li, J.Y.; Fu, Y.L.; Pike, S.M.; Bao, J.; Tian, W.; Zhang, Y.; Chen, C.Z.; Zhang, Y.; Li, H.M.; Huang, J.; et al. The Arabidopsis nitrate transporter NRT1.8 functions in nitrate removal from the xylem sap and mediates cadmium tolerance. Plant Cell 2010, 22, 1633–1646. [Google Scholar] [CrossRef]
  40. Tang, Y.F.; Sun, X.C.; Hu, C.X.; Tan, Q.L.; Zhao, X.H. Genotypic differences in nitrate uptake, translocation and assimilation of two Chinese cabbage cultivars [Brassica campestris L. ssp. Chinensis (L.)]. Plant Physiol. Bioch. 2013, 70, 14–20. [Google Scholar] [CrossRef]
  41. Angeli, A.D.; Monachello, D.; Ephritikhine, G.; Frachisse, J.M.; Thomine, S.; Gambale, F.; Barbier-Brygoo, H. The nitrate/proton antiporer AtCLC a mediates nitrate accumulation in plant vacuoles. Nature 2006, 442, 939–942. [Google Scholar] [CrossRef]
  42. Fechtbartenbach, J.V.D.; Bogner, M.; Dynowski, M.; Ludewig, U. CLC-b mediated NO3/H+ exchange across the tonoplast of Arabidopsis vacuoles. Plant Cell Physiol. 2010, 51, 960–968. [Google Scholar] [CrossRef] [PubMed]
  43. Wilkinson, J.Q.; Crawford, N.M. Identification and characterization of a chlorate-resistant mutant of Arabidopsis thaliana with mutations in both nitrate reductase structural genes NIA1 and NIA2. Mol. Gen. Genet. MGG 1993, 239, 289–297. [Google Scholar] [PubMed]
  44. Hoff, T.; Stummann, B.M.; Henningsen, K.W. Structure, function and regulation of nitrate reductase in higher plants. Physilol. Plantarum 1992, 84, 616–624. [Google Scholar] [CrossRef]
  45. Fukuoka, H.; Ogawa, T.; Minami, H.; Yano, H.; Ohkawa, Y. Development stage-specific and nitrate-independent regulation of nitrate reductase gene expression in rapeseed. Plant Physiol. 1996, 111, 39–47. [Google Scholar] [CrossRef]
  46. Tercé-Laforgue, T.; Dubois, F.; Ferrario-Méry, S.; Crecenzo, M.P.D.; Sangwan, R.; Hirel, B. Glutamatedehydrogenase of tobacco (Nicotiana tabacum L.) is mainly induced in the cytosol of phloem companion cells whenammonia is provided either externally or released during photorespiration. Plant Physiol. 2004, 136, 4308–4317. [Google Scholar] [CrossRef]
  47. Boussama, N.; Ouariti, O.; Suzuki, A.; Ghorbel, M.H. Cd-stress on nitrogen assimilation. J. Plant Physiol. 1994, 155, 310–317. [Google Scholar] [CrossRef]
  48. Bittsánszkya, A.; Pilinszkya, K.; Gyulaib, G.; Komivesa, T. Overcoming ammonium toxicity. Plant Sci. 2015, 231, 184–190. [Google Scholar] [CrossRef]
  49. Zhong, C.; Cao, X.C.; Hu, J.J.; Zhu, L.F.; Zhang, J.H.; Huang, J.L.; Jin, Q.Y. Nitrogen metabolism in adaptation of photosynthesis to water stress in rice grown under different nitrogen levels. Front. Plant Sci. 2017, 8, 1709. [Google Scholar] [CrossRef]
  50. Byrt, C.S.; Munns, R.; Burton, R.A.; Gilliham, M.; Wege, S. Root cell wall solutions for crop plants in saline soils. Plant Sci. 2018, 269, 47–55. [Google Scholar] [CrossRef]
  51. Irshad, M.; Canut, H.; Borderies, G.; Pont-Lezica, R.; Jamet, E. A new picture of cell wall protein dynamics in elongating cells of Arabidopsis thaliana: Confirmed actors and newcomers. BMC Plant Biol. 2008, 8, 94. [Google Scholar] [CrossRef] [PubMed]
  52. Richmond, T.A.; Somerville, C.R. The cellulose synthase superfamily. Plant Physiol. 2000, 124, 495–498. [Google Scholar] [CrossRef] [PubMed]
  53. Hématy, K.; Höfte, H. Cellulose and cell elongation. Plant Cell Monogr. 2006, 5, 33–56. [Google Scholar]
  54. Doblin, M.S.; Kurek, I.D.; Delmer, D.P. Cellulose biosynthesis in plants: From genes to rosettes. A review. Plant Cell Physiol. 2002, 43, 1407. [Google Scholar] [CrossRef]
Figure 1. Growth performances of two cultivars, namely, 15 (high N efficiency) and 814 (low N efficiency), after 70 d in different N treatments. The three treatments contained the same amount of N (15 mmol/L). Different letters at the top of the histogram bars denote significant differences among treatments for the same cultivar (p < 0.05); asterisks (*) at the top of the histogram bars denote significant differences between cultivars in the same treatment (p < 0.05); vertical bars indicate the standard deviation (SD) (n = 5).
Genes 10 00391 g001
Figure 2. Root architecture of the two cultivars under different N treatments. The three treatments contained the same amount of N (15 mmol/L). Different letters at the top of the histogram bars denote significant differences among treatments for the same cultivar (p < 0.05); asterisks (*) at the top of the histogram bars denote significant differences between cultivars in the same treatment (p < 0.05); vertical bars indicate the SD (n = 5).
Genes 10 00391 g002
Figure 3. (a) A Venn diagram illustrating overlaps among differentially expressed genes (DEGs) in different comparison groups, i.e., CKvsNT, CKvsAT, and NTvsAT, in 15 and 814; (b) a bar chart showing up- and downregulated DEGs in the six comparison groups. The red column shows upregulated DEGs, and the green column shows downregulated DEGs. CK: control.
Genes 10 00391 g003
Figure 4. Enriched Gene Ontology (GO) terms for NTvsAT (15 and 814). The results are summarized under three top-level ontologies: biological process, molecular function, and cellular component. The x-axis represents the functional category of the DEGs. The y-axis indicates the number of annotated genes expressed in a given subcategory. The downregulated DEGs are represented by green, and the upregulated DEGs are represented by red.
Genes 10 00391 g004
Figure 5. Top fifteen enriched Kyoto Encyclopedia of Genes and Genomes (KEGG) pathways for NTvsAT (15 and 814). The x-axis represents the number of DEGs involved in each pathway; the y-axis depicts pathways arranged from bottom to top based on the degree of enrichment.
Genes 10 00391 g005
Figure 6. Heatmap showing the relative expression patterns of genes related to N metabolism between different comparison groups in 15 and 814. From left to right: 15-log2(NT/CK), 814-log2(NT/CK), 15-log2(AT/CK), 814-log2(AT/CK), 15-log2(NT/AT), and 814-log2(NT/AT). Colors indicate the relative differential gene expression: green, downregulated; red, upregulated; and blue, not differentially expressed.
Genes 10 00391 g006
Figure 7. Quantitative real-time PCR (qRT-PCR) validation of 15 differentially expressed genes (DEGs). (a) Transcript levels of 15 DEGs. Vertical bars indicate SDs (n = 3). The columns represent relative expression obtained by qRT-PCR. (b) Comparison of relative expression obtained from RNA-Seq data and qRT-PCR. RNA-Seq relative expression (x-axis) is plotted against qRT-PCR relative expression (y-axis). The correlation coefficient (R2) is indicated in the figure. FPKM: fragments per kilobase of exon per million fragments mapped.
Genes 10 00391 g007
Figure 8. A proposed model for N metabolism and other primary metabolism in oilseed rape roots in NT and AT treatment groups. The colored rectangles indicate the following: red, N transporters, enzymes or physiological processes that increased; and green, N transporters, enzymes or physiological processes that decreased. Red or green solid arrows represent the strengthening or weakening of physiological processes, and black solid arrows represent physiological processes that did not significantly change. Compared with AT treatment, NT treatment led to upregulation of the NRT/AMT genes in roots and facilitated NO3 uptake. Simultaneously, NR and NIR activities increased, and BnNRT1.5 gene expression was upregulated, which facilitated more NO3 transport into shoots from roots for assimilation under NT treatment. This enhanced transport was beneficial for oilseed rape growth because NO3 assimilation efficiency is known to be higher in shoots than in roots due to the utilization of solar energy by oilseed rape shoots. Furthermore, carbohydrate metabolism (CAR), lipid metabolism (LIP), protein metabolism (PRO), and CWB were promoted by NT treatment, which facilitated oilseed rape root growth and development. Thus, NT treatment was more beneficial to oilseed rape growth than was AT treatment.
Genes 10 00391 g008
Table 1. Macronutrient composition of the hydroponic solution.
TreatmentNutrient Concentration (mmol/L)
KNO3(NH4)2SO4K2CO3CaCl2MgSO4KH2PO4Fe-EDTA
NT15002210.2
NT + AT11.251.8751.8752210.2
AT07.57.52210.2
NT, 100% NO3 treatment; NT + AT, 75% NO3 + 25% NH4+ treatment; AT, 100% NH4+ treatment.
Table 2. Numbers of up- and downregulated genes in starch and sucrose metabolism (SSM), fatty acid biosynthesis (FAB), ribosome (RIB), and cell wall biogenesis (CWB) in the six comparison groups.
Comparison GroupsSSMFABRIBCWB
UpDownUpDownUpDownUpDown
CKvsNT(15)15820281481180
CKvsNT(814)14213211566160
CKvsAT(15)18203162900
CKvsAT(814)48020900
NTvsAT(15)19161032261309
NTvsAT(814)16162022463105

