Azathioprine Biotransformation in Young Patients with Inflammatory Bowel Disease: Contribution of Glutathione-S Transferase M1 and A1 Variants

 , , ,
, , ,  , ,
, ,
Abstract
:1. Introduction
2. Materials and Methods
2.1. Patient Characteristics
2.2. Measurement of Azathioprine Metabolites
2.3. Genotypes
2.4. Statistical Analysis
3. Results
3.1. Patients Enrolled and Samples Collected
3.2. Measurement of Azathioprine Metabolites: Association with Demographic and Clinical Covariates
3.3. Genotyping
4. Discussion
Supplementary Materials
Author Contributions
Funding
Conflicts of Interest
References
- Ponder, A.; Long, M.D. A clinical review of recent findings in the epidemiology of inflammatory bowel disease. Clin. Epidemiol. 2013, 5, 237–247. [Google Scholar] [CrossRef]
- Louis, E.; Irving, P.; Beaugerie, L. Use of azathioprine in IBD: Modern aspects of an old drug. Gut 2014, 63, 1695–1699. [Google Scholar] [CrossRef] [PubMed]
- Barabino, A.; Torrente, F.; Ventura, A.; Cucchiara, S.; Castro, M.; Barbera, C. Azathioprine in paediatric inflammatory bowel disease: An Italian multicentre survey. Aliment. Pharmacol. Ther. 2002, 16, 1125–1130. [Google Scholar] [CrossRef] [PubMed]
- Prefontaine, E.; Macdonald, J.K.; Sutherland, L.R. Azathioprine or 6-mercaptopurine for induction of remission in Crohn’s disease. Cochrane Database Syst Rev. 2010, 6, CD000545. [Google Scholar] [CrossRef]
- Colombel, J.F.; Sandborn, W.J.; Reinisch, W.; Mantzaris, G.J.; Kornbluth, A.; Rachmilewitz, D.; Lichtiger, S.; D’Haens, G.; Diamond, R.H.; Broussard, D.L.; et al. Infliximab, azathioprine, or combination therapy for Crohn’s disease. N. Engl. J. Med. 2010, 362, 1383–1395. [Google Scholar] [CrossRef]
- Chouchana, L.; Narjoz, C.; Beaune, P.; Loriot, M.A.; Roblin, X. Review article: The benefits of pharmacogenetics for improving thiopurine therapy in inflammatory bowel disease. Aliment. Pharmacol. Ther. 2012, 35, 15–36. [Google Scholar] [CrossRef] [PubMed]
- Lucafò, M.; Franca, R.; Selvestrel, D.; Curci, D.; Pugnetti, L.; Decorti, G.; Stocco, G. Pharmacogenetics of treatments for inflammatory bowel disease. Expert Opin. Drug Metab. Toxicol. 2018, 14, 1209–1223. [Google Scholar] [CrossRef]
- Stocco, G.; De Iudicibus, S.; Franca, R.; Addobbati, R.; Decorti, G. Personalized therapies in pediatric inflammatory and autoimmune diseases. Curr. Pharm. Des. 2012, 18, 5766–5775. [Google Scholar] [CrossRef] [PubMed]
- Modén, O.; Mannervik, B. Glutathione transferases in the bioactivation of azathioprine. Adv. Cancer Res. 2014, 122, 199–244. [Google Scholar] [CrossRef]
- Zaza, G.; Cheok, M.; Krynetskaia, N.; Thorn, C.; Stocco, G.; Hebert, J.M.; McLeod, H.; Weinshilboum, R.M.; Relling, M.V.; Evans, W.E.; et al. Thiopurine pathway. Pharm. Genom. 2010, 20, 573–574. [Google Scholar] [CrossRef] [PubMed]
- Turner, D.; Otley, A.R.; Mack, D.; Hyams, J.; de Bruijne, J.; Uusoue, K.; Walters, T.D.; Zachos, M.; Mamula, P.; Beaton, D.E.; et al. Development, validation, and evaluation of a pediatric ulcerative colitis activity index: A prospective multicenter study. Gastroenterology 2007, 133, 423–432. [Google Scholar] [CrossRef] [PubMed]
- Dervieux, T.; Boulieu, R. Simultaneous determination of 6-thioguanine and methyl 6-mercaptopurine nucleotides of azathioprine in red blood cells by HPLC. Clin Chem. 1998, 44, 551–555. [Google Scholar] [PubMed]
- Stocco, G.; Martelossi, S.; Barabino, A.; Decorti, G.; Bartoli, F.; Montico, M.; Gotti, A.; Ventura, A. Glutathione-S-transferase genotypes and the adverse effects of azathioprine in young patients with inflammatory bowel disease. Inflamm. Bowel Dis. 2007, 13, 57–64. [Google Scholar] [CrossRef] [PubMed]
- Whirl-Carrillo, M.; McDonagh, E.M.; Hebert, J.M.; Gong, L.; Sangkuhl, K.; Thorn, C.F.; Altman, R.B.; Klein, T.E. Pharmacogenomics knowledge for personalized medicine. Clin. Pharmacol. Ther. 2012, 92, 414–417. [Google Scholar] [CrossRef] [PubMed]
- De Mattia, E.; Cecchin, E.; Polesel, J.; Bignucolo, A.; Roncato, R.; Lupo, F.; Crovatto, M.; Buonadonna, A.; Tiribelli, C.; Toffoli, G. Genetic biomarkers for hepatocellular cancer risk in a caucasian population. World J. Gastroenterol. 2017, 23, 6674–6684. [Google Scholar] [CrossRef] [PubMed]
- Eklund, B.I.; Moberg, M.; Bergquist, J.; Mannervik, B. Divergent activities of human glutathione transferases in the bioactivation of azathioprine. Mol. Pharmacol. 2006, 70, 747–754. [Google Scholar] [CrossRef]
- Kaplowitz, N.; Kuhlenkamp, J. Inhibition of hepatic metabolism of azathioprine in vivo. Gastroenterology 1978, 74, 90–92. [Google Scholar]
- Ahokas, J.T.; Davies, C.; Ravenscroft, P.J.; Emmerson, B.T. Inhibition of soluble glutathione S-transferase by diuretic drugs. Biochem. Pharmacol. 1984, 33, 1929–1932. [Google Scholar] [CrossRef]
- Von Bahr, C.; Glaumann, H.; Gudas, J.; Kaplowitz, N. Inhibition of hepatic metabolism of azathioprine by furosemide in human liver in vitro. Biochem. Pharmacol. 1980, 29, 1439–1441. [Google Scholar] [CrossRef]
- Singh, S.V.; Leal, T.; Awasthi, Y.C. Inhibition of human glutathione S-transferases by bile acids. Toxicol. Appl. Pharmacol. 1988, 95, 248–254. [Google Scholar] [CrossRef]
- Stocco, G.; Cuzzoni, E.; De Iudicibus, S.; Franca, R.; Favretto, D.; Malusà, N.; Londero, M.; Cont, G.; Bartoli, F.; Martelossi, S.; et al. Deletion of glutathione-s-transferase m1 reduces azathioprine metabolite concentrations in young patients with inflammatory bowel disease. J. Clin. Gastroenterol. 2014, 48, 43–51. [Google Scholar] [CrossRef] [PubMed]
- Relling, M.V.; Gardner, E.E.; Sandborn, W.J.; Schmiegelow, K.; Pui, C.H.; Yee, S.W.; Stein, C.M.; Carrillo, M.; Evans, W.E.; Hicks, J.K.; et al. Clinical pharmacogenetics implementation consortium guidelines for thiopurine methyltransferase genotype and thiopurine dosing: 2013 update. Clin. Pharmacol. Ther. 2013, 93, 324–325. [Google Scholar] [CrossRef] [PubMed]
- Stocco, G.; Cuzzoni, E.; De Iudicibus, S.; Favretto, D.; Malusà, N.; Martelossi, S.; Pozzi, E.; Lionetti, P.; Ventura, A.; Decorti, G. Thiopurine metabolites variations during co-treatment with aminosalicylates for inflammatory bowel disease: Effect of N-acetyl transferase polymorphisms. World J. Gastroenterol. 2015, 21, 3571–3578. [Google Scholar] [CrossRef] [PubMed]
- Stocco, G.; Pelin, M.; Franca, R.; De Iudicibus, S.; Cuzzoni, E.; Favretto, D.; Martelossi, S.; Ventura, A.; Decorti, G. Pharmacogenetics of azathioprine in inflammatory bowel disease: A role for glutathione-S-transferase? World J. Gastroenterol. 2014, 20, 3534–3541. [Google Scholar] [CrossRef] [PubMed]
- Stocco, G.; Martelossi, S.; Arrigo, S.; Barabino, A.; Aloi, M.; Martinelli, M.; Miele, E.; Knafelz, D.; Romano, C.; Naviglio, S.; et al. Multicentric Case-Control Study on Azathioprine Dose and Pharmacokinetics in Early-onset Pediatric Inflammatory Bowel Disease. Inflamm. Bowel Dis. 2017, 23, 628–634. [Google Scholar] [CrossRef] [PubMed]
- Serpe, L.; Calvo, P.L.; Muntoni, E.; D’Antico, S.; Giaccone, M.; Avagnina, A.; Baldi, M.; Barbera, C.; Curti, F.; Pera, A.; et al. Thiopurine S-methyltransferase pharmacogenetics in a large-scale healthy Italian-Caucasian population: Differences in enzyme activity. Pharmacogenomics 2009, 10, 1753–1765. [Google Scholar] [CrossRef] [PubMed]
- De Iudicibus, S.; Lucafò, M.; Vitulo, N.; Martelossi, S.; Zimbello, R.; De Pascale, F.; Forcato, C.; Naviglio, S.; Di Silvestre, A.; Gerdol, M.; et al. High-Throughput Sequencing of microRNAs in Glucocorticoid Sensitive Paediatric Inflammatory Bowel Disease Patients. Int. J. Mol. Sci. 2018, 19, 1399. [Google Scholar] [CrossRef]
- Al-Judaibi, B.; Schwarz, U.I.; Huda, N.; Dresser, G.K.; Gregor, J.C.; Ponich, T.; Chande, N.; Mosli, M.; Kim, R.B. Genetic Predictors of Azathioprine Toxicity and Clinical Response in Patients with Inflammatory Bowel Disease. J. Popul. Ther. Clin. Pharmacol. 2016, 23, e26–e36. [Google Scholar]
- Broekman, M.M.T.J.; Wong, D.R.; Wanten, G.J.A.; Roelofs, H.M.; van Marrewijk, C.J.; Klungel, O.H.; Verbeek, A.L.M.; Hooymans, P.M.; Guchelaar, H.J.; Scheffer, H.; et al. The glutathione transferase Mu null genotype leads to lower 6-MMPR levels in patients treated with azathioprine but not with mercaptopurine. Pharm. J. 2018, 18, 160–166. [Google Scholar] [CrossRef]
- Mazor, Y.; Koifman, E.; Elkin, H.; Chowers, Y.; Krivoy, N.; Karban, A.; Efrati, E. Risk factors for serious adverse effects of thiopurines in patients with Crohn’s disease. Curr. Drug Saf. 2013, 8, 181–185. [Google Scholar] [CrossRef]
- Liu, H.; Ding, L.; Zhang, F.; Zhang, Y.; Gao, X.; Hu, P.; Bi, H.; Huang, M. The impact of glutathione S-transferase genotype and phenotype on the adverse drug reactions to azathioprine in patients with inflammatory bowel diseases. J. Pharmacol. Sci. 2015, 129, 95–100. [Google Scholar] [CrossRef] [PubMed]
- Moriyama, T.; Nishii, R.; Perez-Andreu, V.; Yang, W.; Klussmann, F.A.; Zhao, X.; Lin, T.N.; Hoshitsuki, K.; Nersting, J.; Kihira, K.; et al. NUDT15 polymorphisms alter thiopurine metabolism and hematopoietic toxicity. Nat. Genet. 2016, 48, 367–373. [Google Scholar] [CrossRef] [PubMed]
- Ban, H.; Andoh, A.; Imaeda, H.; Kobori, A.; Bamba, S.; Tsujikawa, T.; Sasaki, M.; Saito, Y.; Fujiyama, Y. The multidrug-resistance protein 4 polymorphism is a new factor accounting for thiopurine sensitivity in Japanese patients with inflammatory bowel disease. J. Gastroenterol. 2010, 45, 1014–1021. [Google Scholar] [CrossRef] [PubMed]
- Hofmann, U.; Heinkele, G.; Angelberger, S.; Schaeffeler, E.; Lichtenberger, C.; Jaeger, S.; Reinisch, W.; Schwab, M. Simultaneous quantification of eleven thiopurine nucleotides by liquid chromatography-tandem mass spectrometry. Anal. Chem. 2012, 84, 1294–1301. [Google Scholar] [CrossRef] [PubMed]
- Pelin, M.; Genova, E.; Fusco, L.; Marisat, M.; Hofmann, U.; Favretto, D.; Lucafò, M.; Taddio, A.; Martelossi, S.; Ventura, A.; et al. Pharmacokinetics and pharmacodynamics of thiopurines in an in vitro model of human hepatocytes: Insights from an innovative mass spectrometry assay. Chem. Biol. Interact. 2017, 275, 189–195. [Google Scholar] [CrossRef] [PubMed]


| Gene | Polymorphism | ||
|---|---|---|---|
| rs Number | Primary Locus Alleles [14] | Genotyping Method | |
| TPMT | rs1800462 | C > G missense | PCR-ASO [13] |
| rs1800460 | C > T missense | PCR-RFLP [13] | |
| rs1142345 | T > C missense | PCR-RFLP [13] | |
| GSTM1 | No rs number | Deletion | MULTIPLEX-PCR-ASO [13] |
| GSTT1 | No rs number | Deletion | MULTIPLEX-PCR-ASO [13] |
| GSTA1 | rs3957357 | A > G (5′-UTR) | Pyrosequencing [15] |
| All Patients (n = 111) | ||
|---|---|---|
| Age (Years) at Time of Sample Collection | 15.1, 12.3–16.8 | |
| Gender | Female (%) | 52 (46.8%) |
| Male (%) | 59 (53.2%) | |
| Type of IBD | Crohn’s disease (%) | 61 (55.0%) |
| Ulcerative colitis (%) | 50 (45.0%) | |
| Length (days) of treatment with azathioprine | 533, 245–917 | |
| TGN (pmol/8 × 10^8 Erythrocytes) | MMPN (pmol/8 × 10^8 Erythrocytes) | Dose (mg/kg) | TGN/Dose ((pmol/8 × 10^8 Erythrocytes)/(mg/kg)) | |
|---|---|---|---|---|
| Mean | 361.6 | 1698.1 | 2.0 | 192.8 |
| Median | 345.0 | 1044.0 | 2.1 | 179.4 |
| Interquartile range | 240.1–465.1 | 431.2–2079.7 | 1.7–2.3 | 120.1–227.9 |
| Gene | Polymorphism | Genotyping Result | ||||
| rs Number | Wild-Type | Hetero-zygous | Homozygous Variant | Not Available | p-value Hardy Weinberg | |
| TPMT | rs1800462 | 105 (100%) | 0 | 0 | 6 | NA |
| TPMT | rs1800460 | 101 (97.1%) | 3 (2.9%) | 0 | 7 | 0.88 |
| TPMT | rs1142345 | 100 (95.2%) | 5 (4.8%) | 0 | 6 | 0.81 |
| GSTA1 | rs3957357 | 38 (44.2%) | 37 (43.0%) | 11 (12.8%) | 25 | 0.77 |
| Gene | Polymorphism | Genotyping Result | ||||
| Not Deleted | Deleted | Not Available | ||||
| GSTM1 | Deletion | 42 (41.9%) | 61 (58.1%) | 8 | ||
| GSTT1 | Deletion | 78 (75.7%) | 25 (24.3%) | 8 | ||
| Azathioprine Related Pharmacological Phenotype (Dependent Variable) | Independent Variable in Multivariate Generalized Linear Model | Comparison | Effect | p-Value |
|---|---|---|---|---|
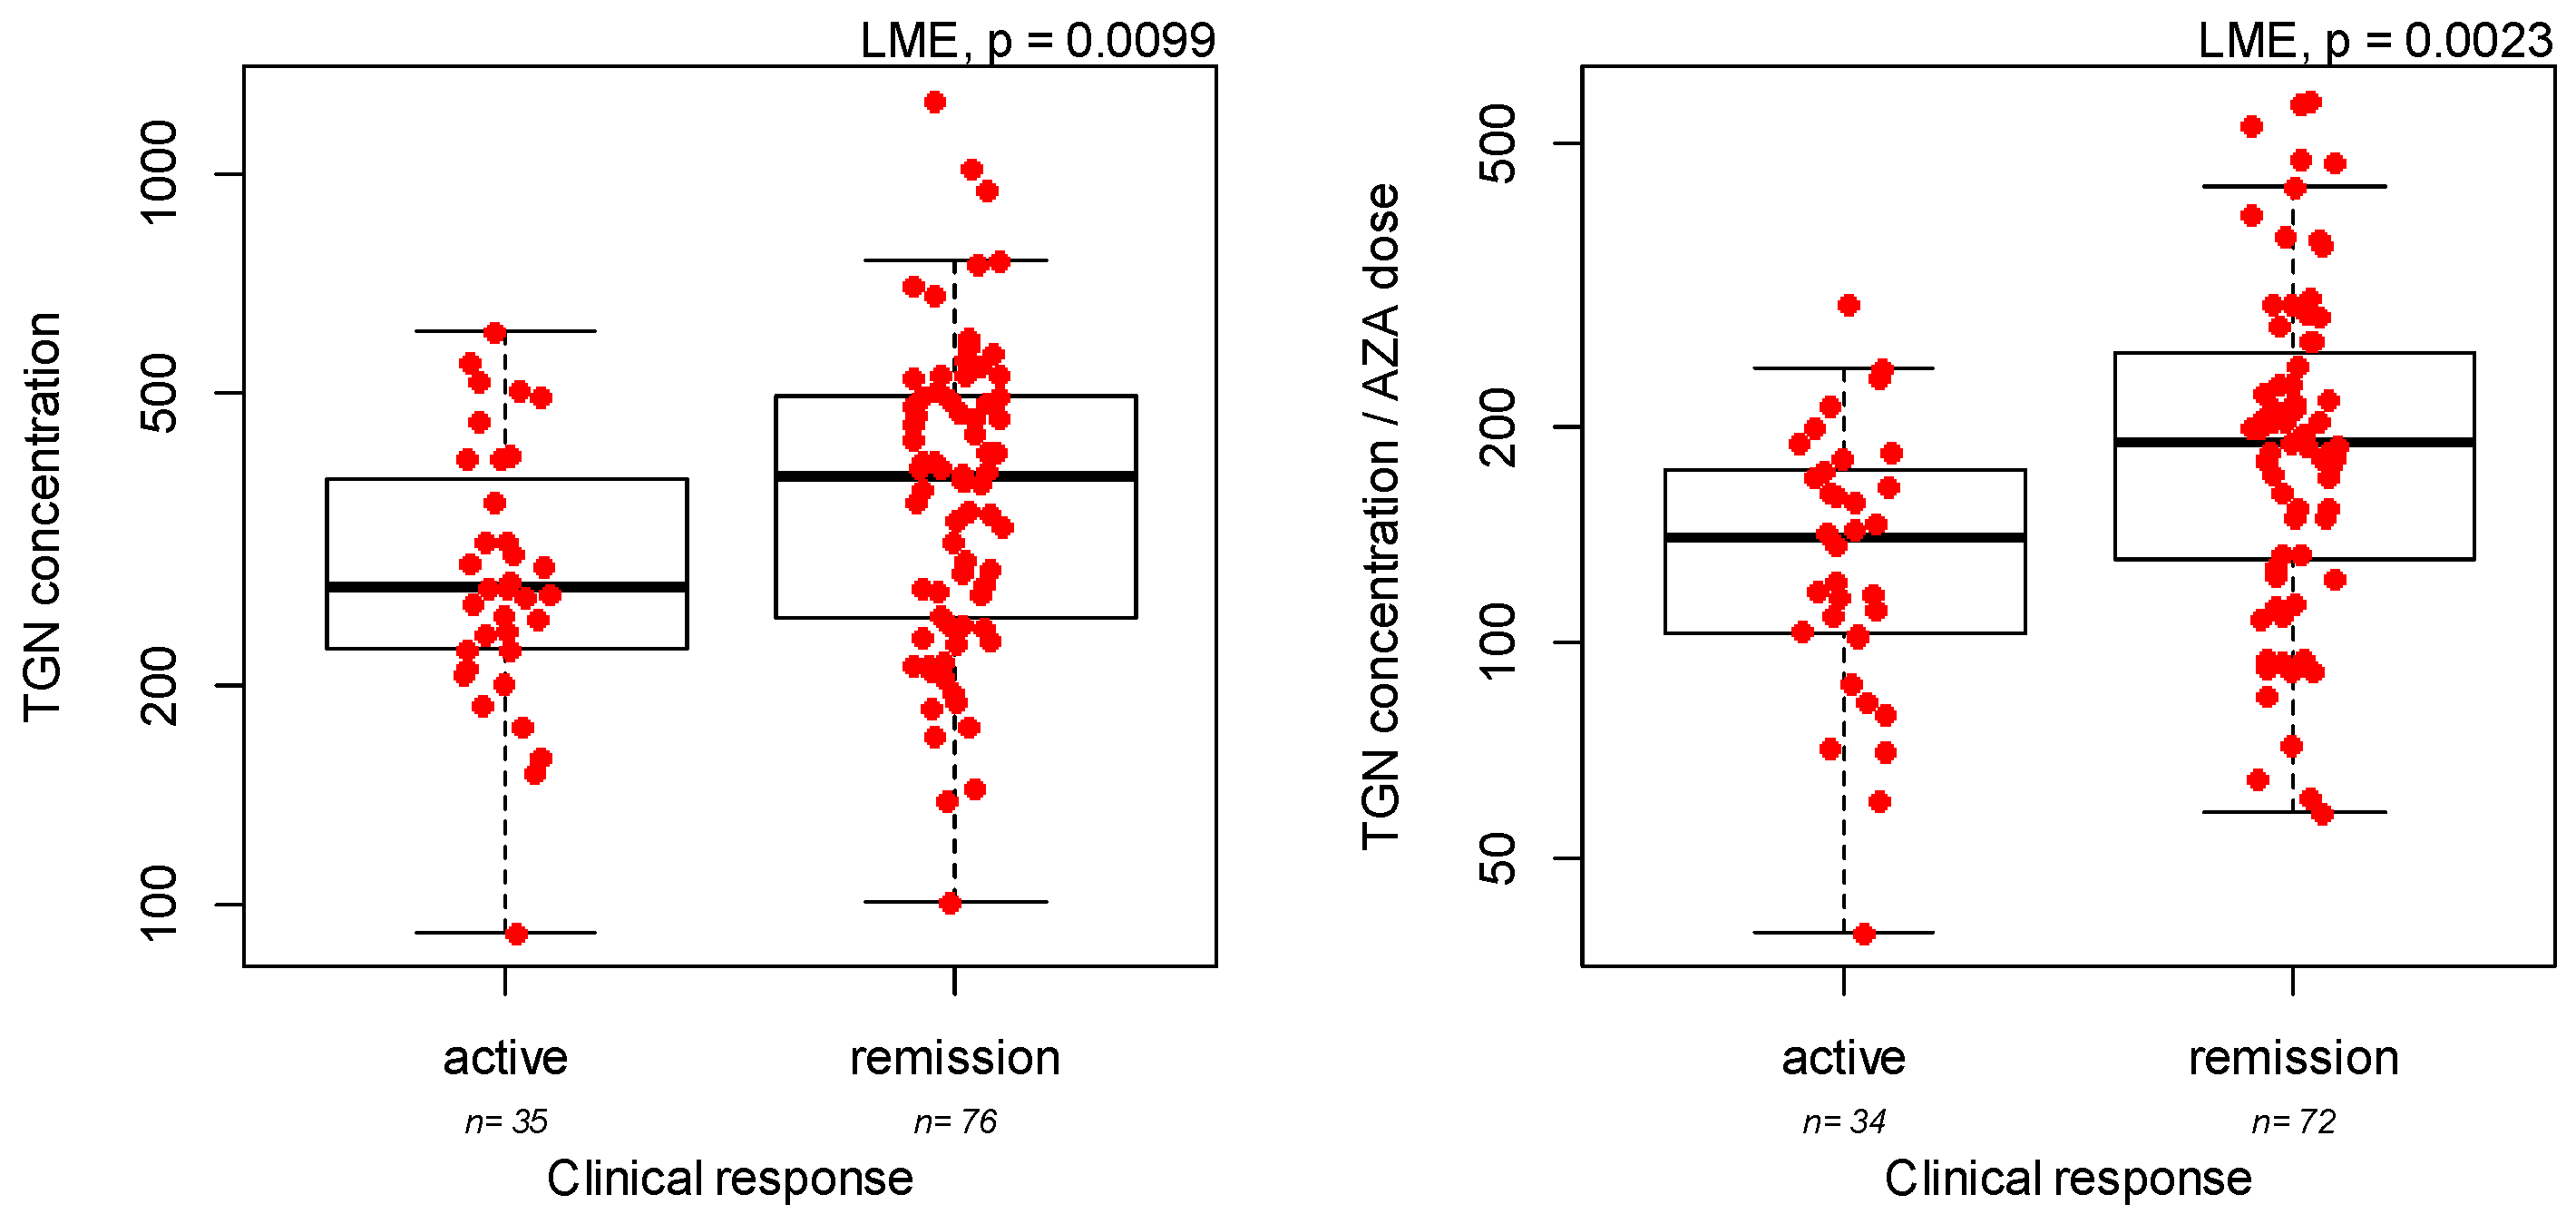
| Efficacy of azathioprine at the first metabolite measurement | IBD type | UC versus CD | 1.96 | 0.0019 |
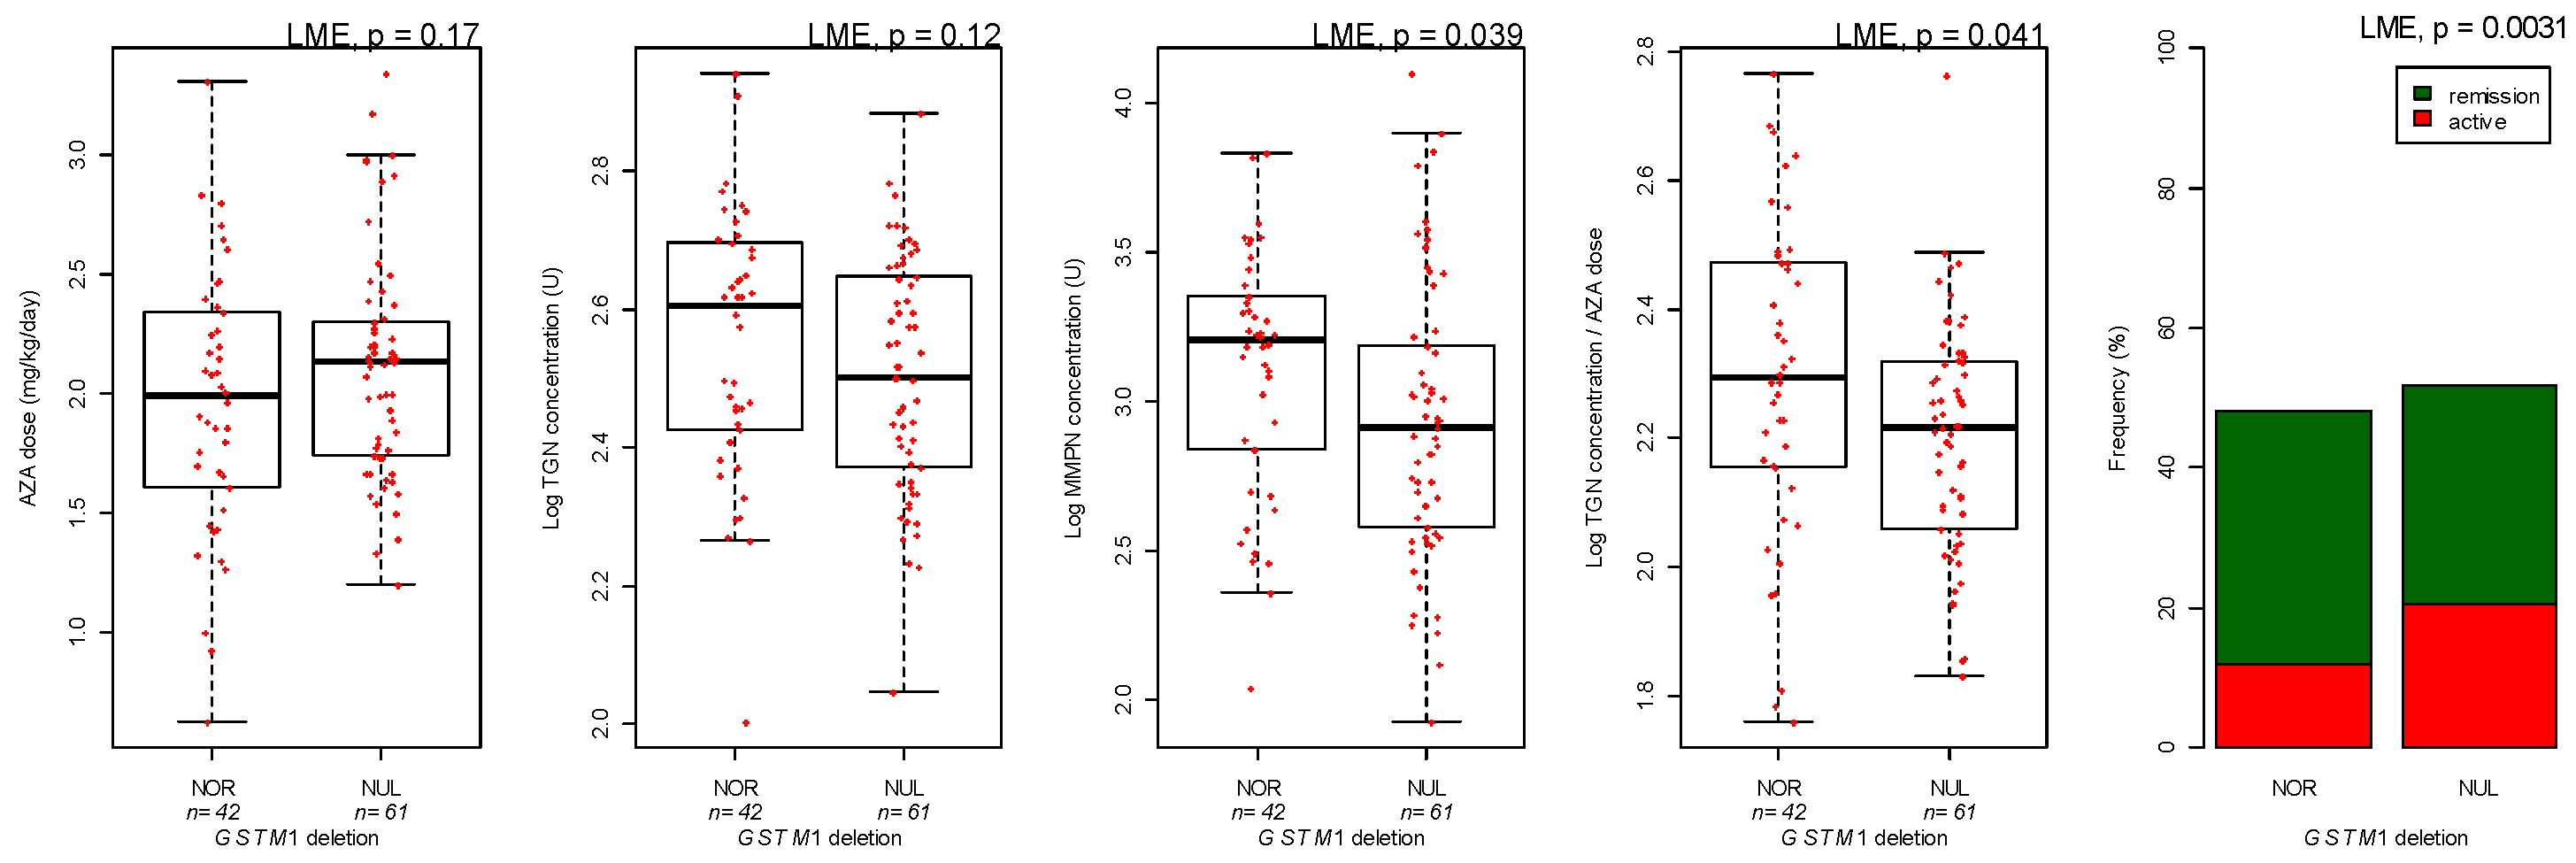
| GSTM1 genotype | Deletion versus Normal | −1.49 | 0.019 | |
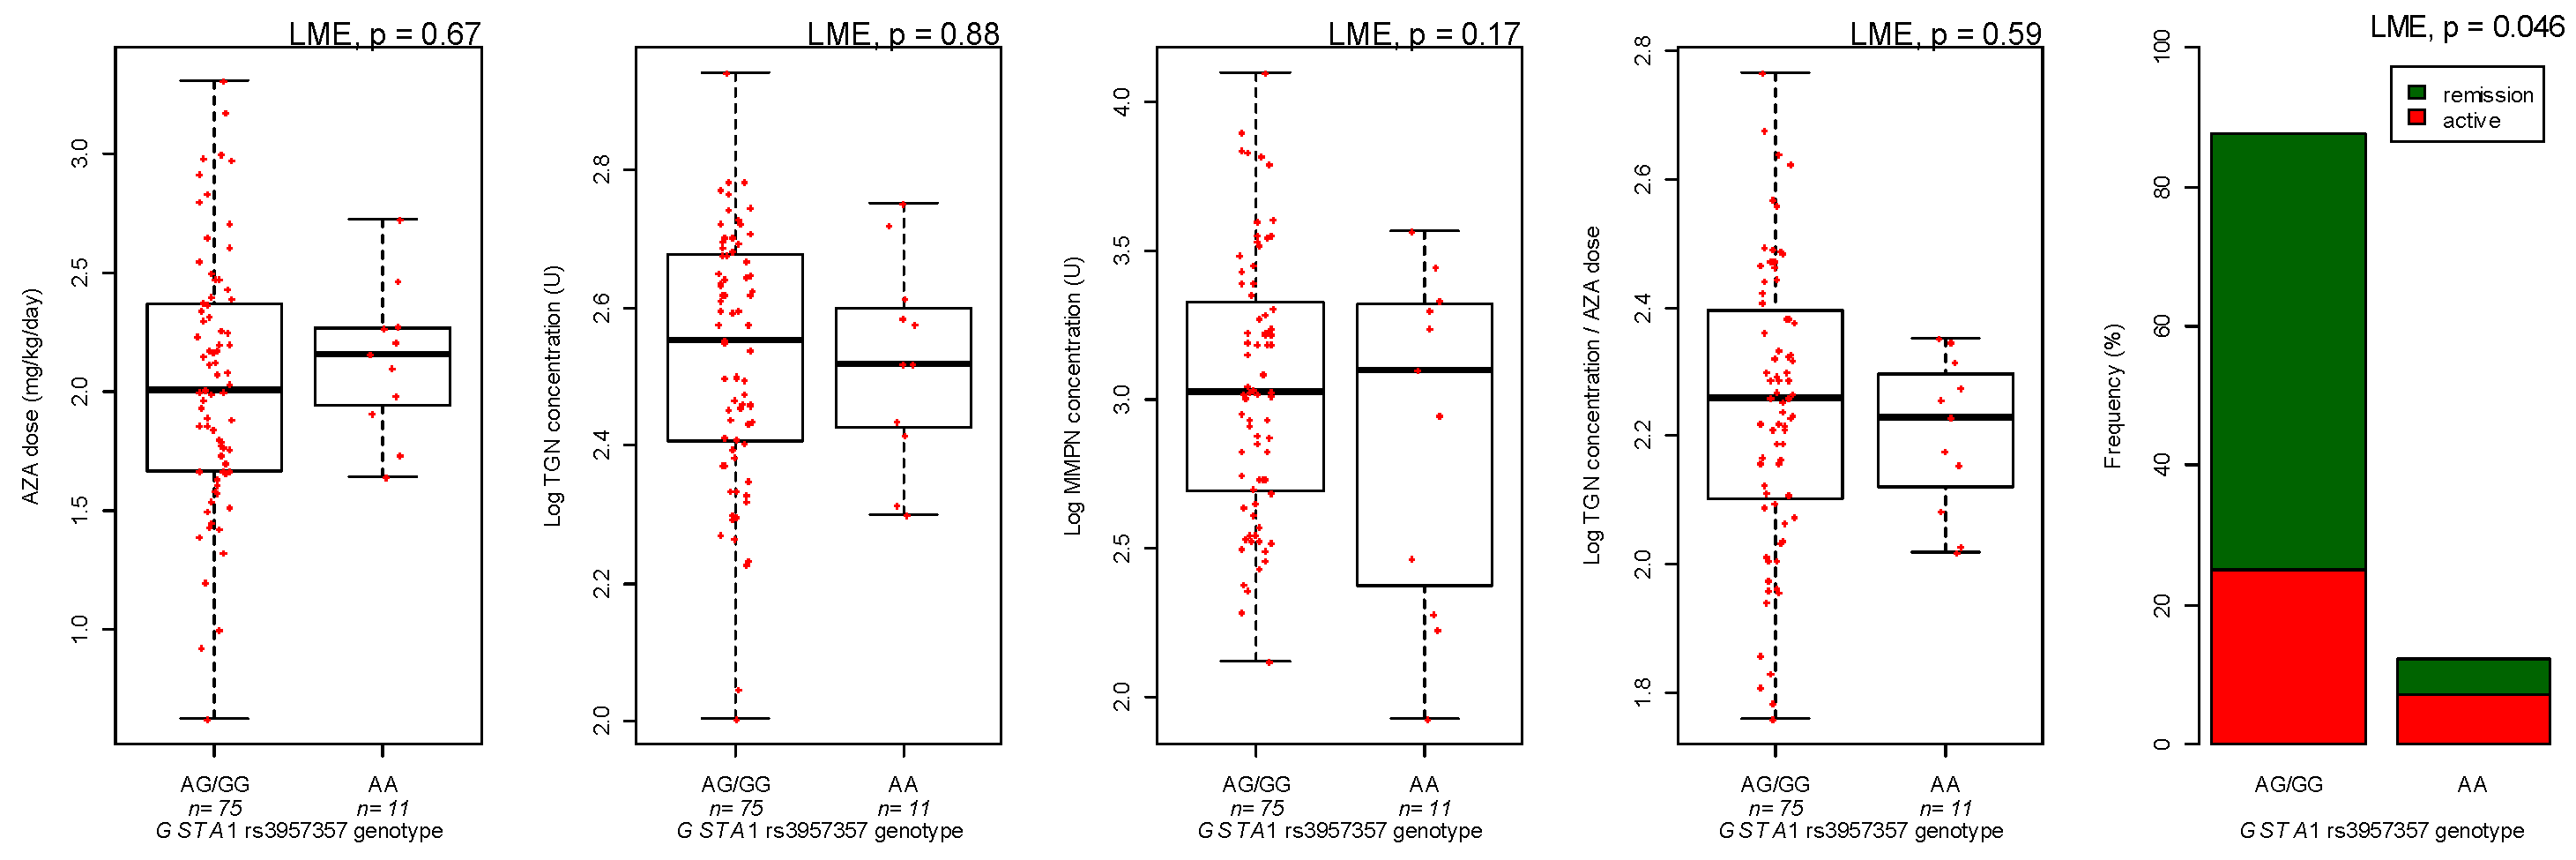
| GSTA1 genotype | AA versus GG/GA | −1.30 | 0.095 | |
| TPMT genotype | AG versus GG | 24.7 | 0.43 | |
| TGN metabolites concentrations | IBD type | UC versus CD | 0.061 | 0.074 |
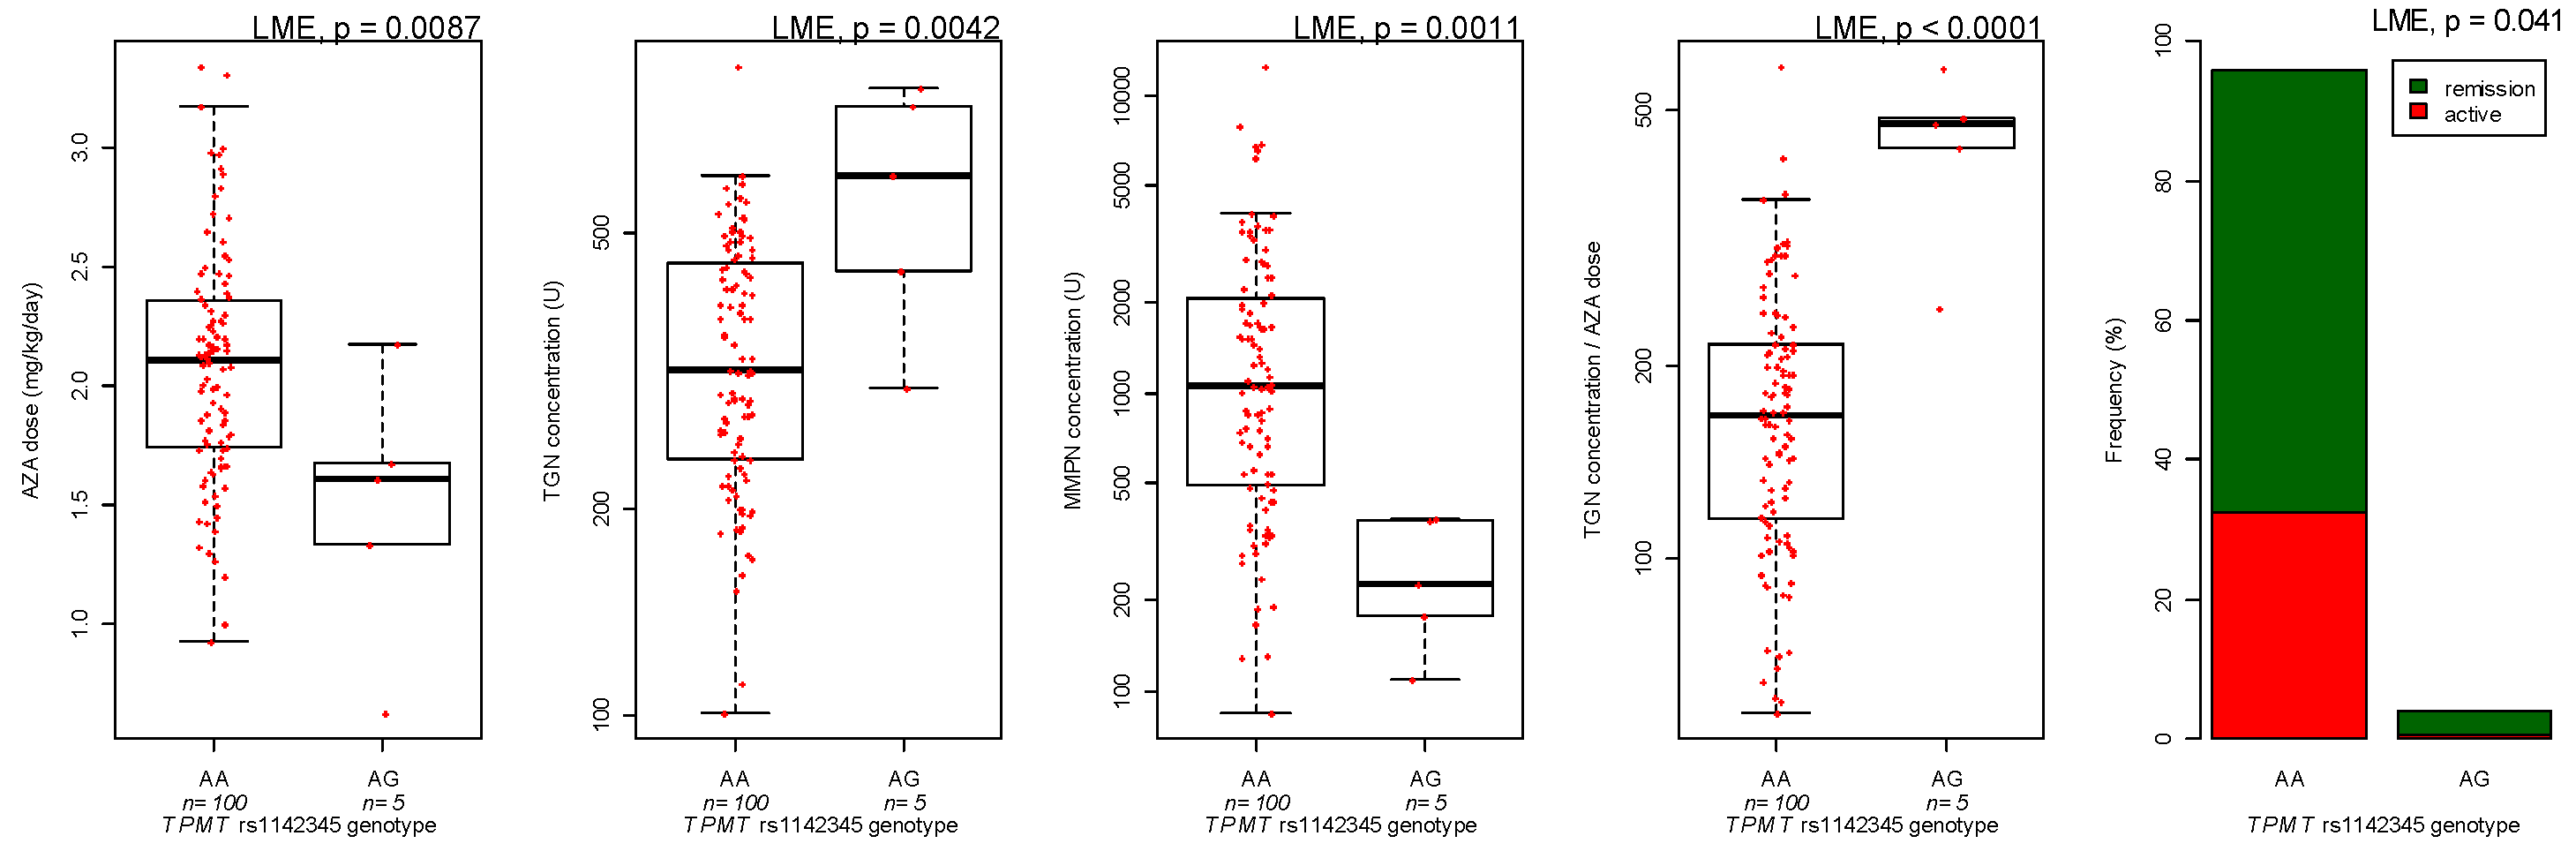
| TPMT genotype | AG versus GG | 0.23 | 0.0049 | |
| MMPN metabolites concentration | GSTM1 genotype | Deletion versus Normal | −0.21 | 0.014 |
| TPMT genotype | Heterozygous versus wild-type | −0.72 | 0.0004 | |
| Azathioprine dose | Age | Each year | −0.035 | <0.0001 |
| TPMT genotype | Heterozygous versus wild-type | −0.58 | 0.0056 | |
| Ratio TGN/dose | TPMT genotype | Heterozygous versus wild-type | 0.41 | 0.0001 |
| GSTM1 genotype | Deletion versus Normal | −0.072 | 0.055 |
© 2019 by the authors. Licensee MDPI, Basel, Switzerland. This article is an open access article distributed under the terms and conditions of the Creative Commons Attribution (CC BY) license (http://creativecommons.org/licenses/by/4.0/).
Share and Cite
Lucafò, M.; Stocco, G.; Martelossi, S.; Favretto, D.; Franca, R.; Malusà, N.; Lora, A.; Bramuzzo, M.; Naviglio, S.; Cecchin, E.; et al. Azathioprine Biotransformation in Young Patients with Inflammatory Bowel Disease: Contribution of Glutathione-S Transferase M1 and A1 Variants. Genes 2019, 10, 277. https://doi.org/10.3390/genes10040277
Lucafò M, Stocco G, Martelossi S, Favretto D, Franca R, Malusà N, Lora A, Bramuzzo M, Naviglio S, Cecchin E, et al. Azathioprine Biotransformation in Young Patients with Inflammatory Bowel Disease: Contribution of Glutathione-S Transferase M1 and A1 Variants. Genes. 2019; 10(4):277. https://doi.org/10.3390/genes10040277
Chicago/Turabian StyleLucafò, Marianna, Gabriele Stocco, Stefano Martelossi, Diego Favretto, Raffaella Franca, Noelia Malusà, Angela Lora, Matteo Bramuzzo, Samuele Naviglio, Erika Cecchin, and et al. 2019. "Azathioprine Biotransformation in Young Patients with Inflammatory Bowel Disease: Contribution of Glutathione-S Transferase M1 and A1 Variants" Genes 10, no. 4: 277. https://doi.org/10.3390/genes10040277
APA StyleLucafò, M., Stocco, G., Martelossi, S., Favretto, D., Franca, R., Malusà, N., Lora, A., Bramuzzo, M., Naviglio, S., Cecchin, E., Toffoli, G., Ventura, A., & Decorti, G. (2019). Azathioprine Biotransformation in Young Patients with Inflammatory Bowel Disease: Contribution of Glutathione-S Transferase M1 and A1 Variants. Genes, 10(4), 277. https://doi.org/10.3390/genes10040277