


The Proteomic Composition and Organization of Constitutive Heterochromatin in Mouse Tissues

 ,
,  , and
, and 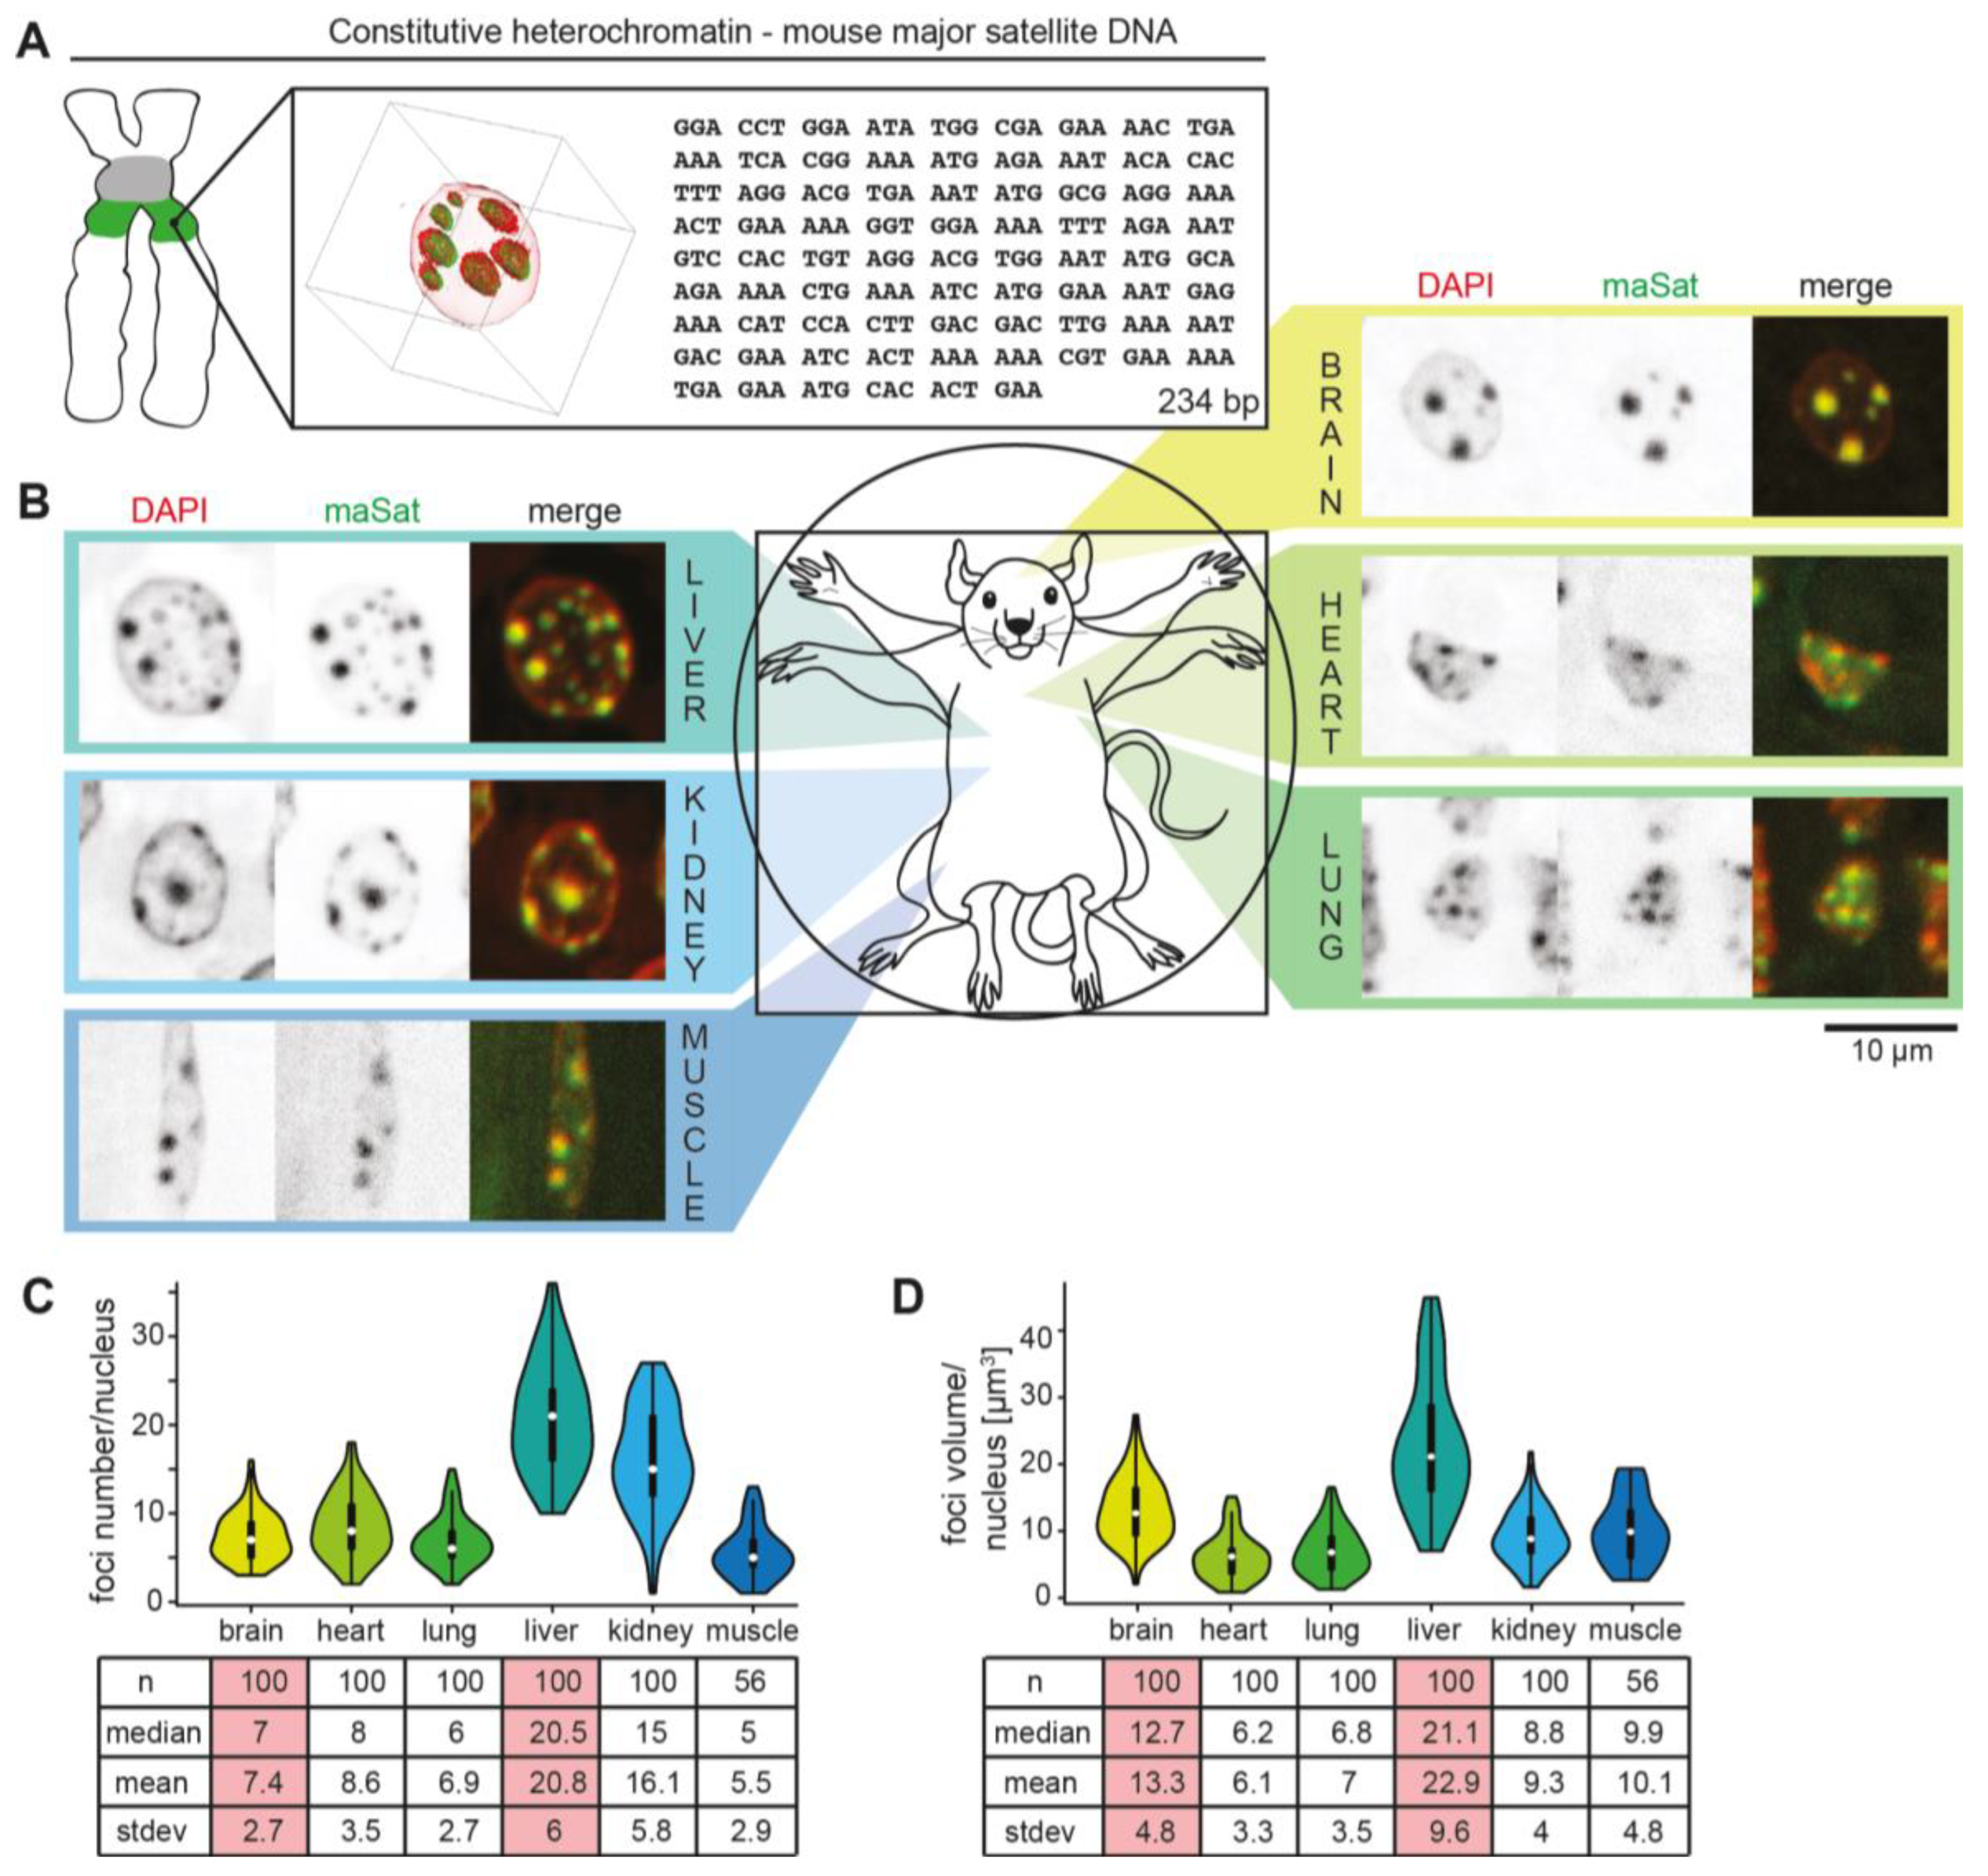
Abstract
1. Introduction
2. Materials and Methods
2.1. Organ Preparation
2.2. Isolation of PCH from Mouse Organs
2.3. Quantitative Mass Spectrometry
2.4. Mass Spectrometry Data Analysis
2.5. Amplification of Repetitive DNA from Isolated Fractions
2.6. Slot Blot Analysis
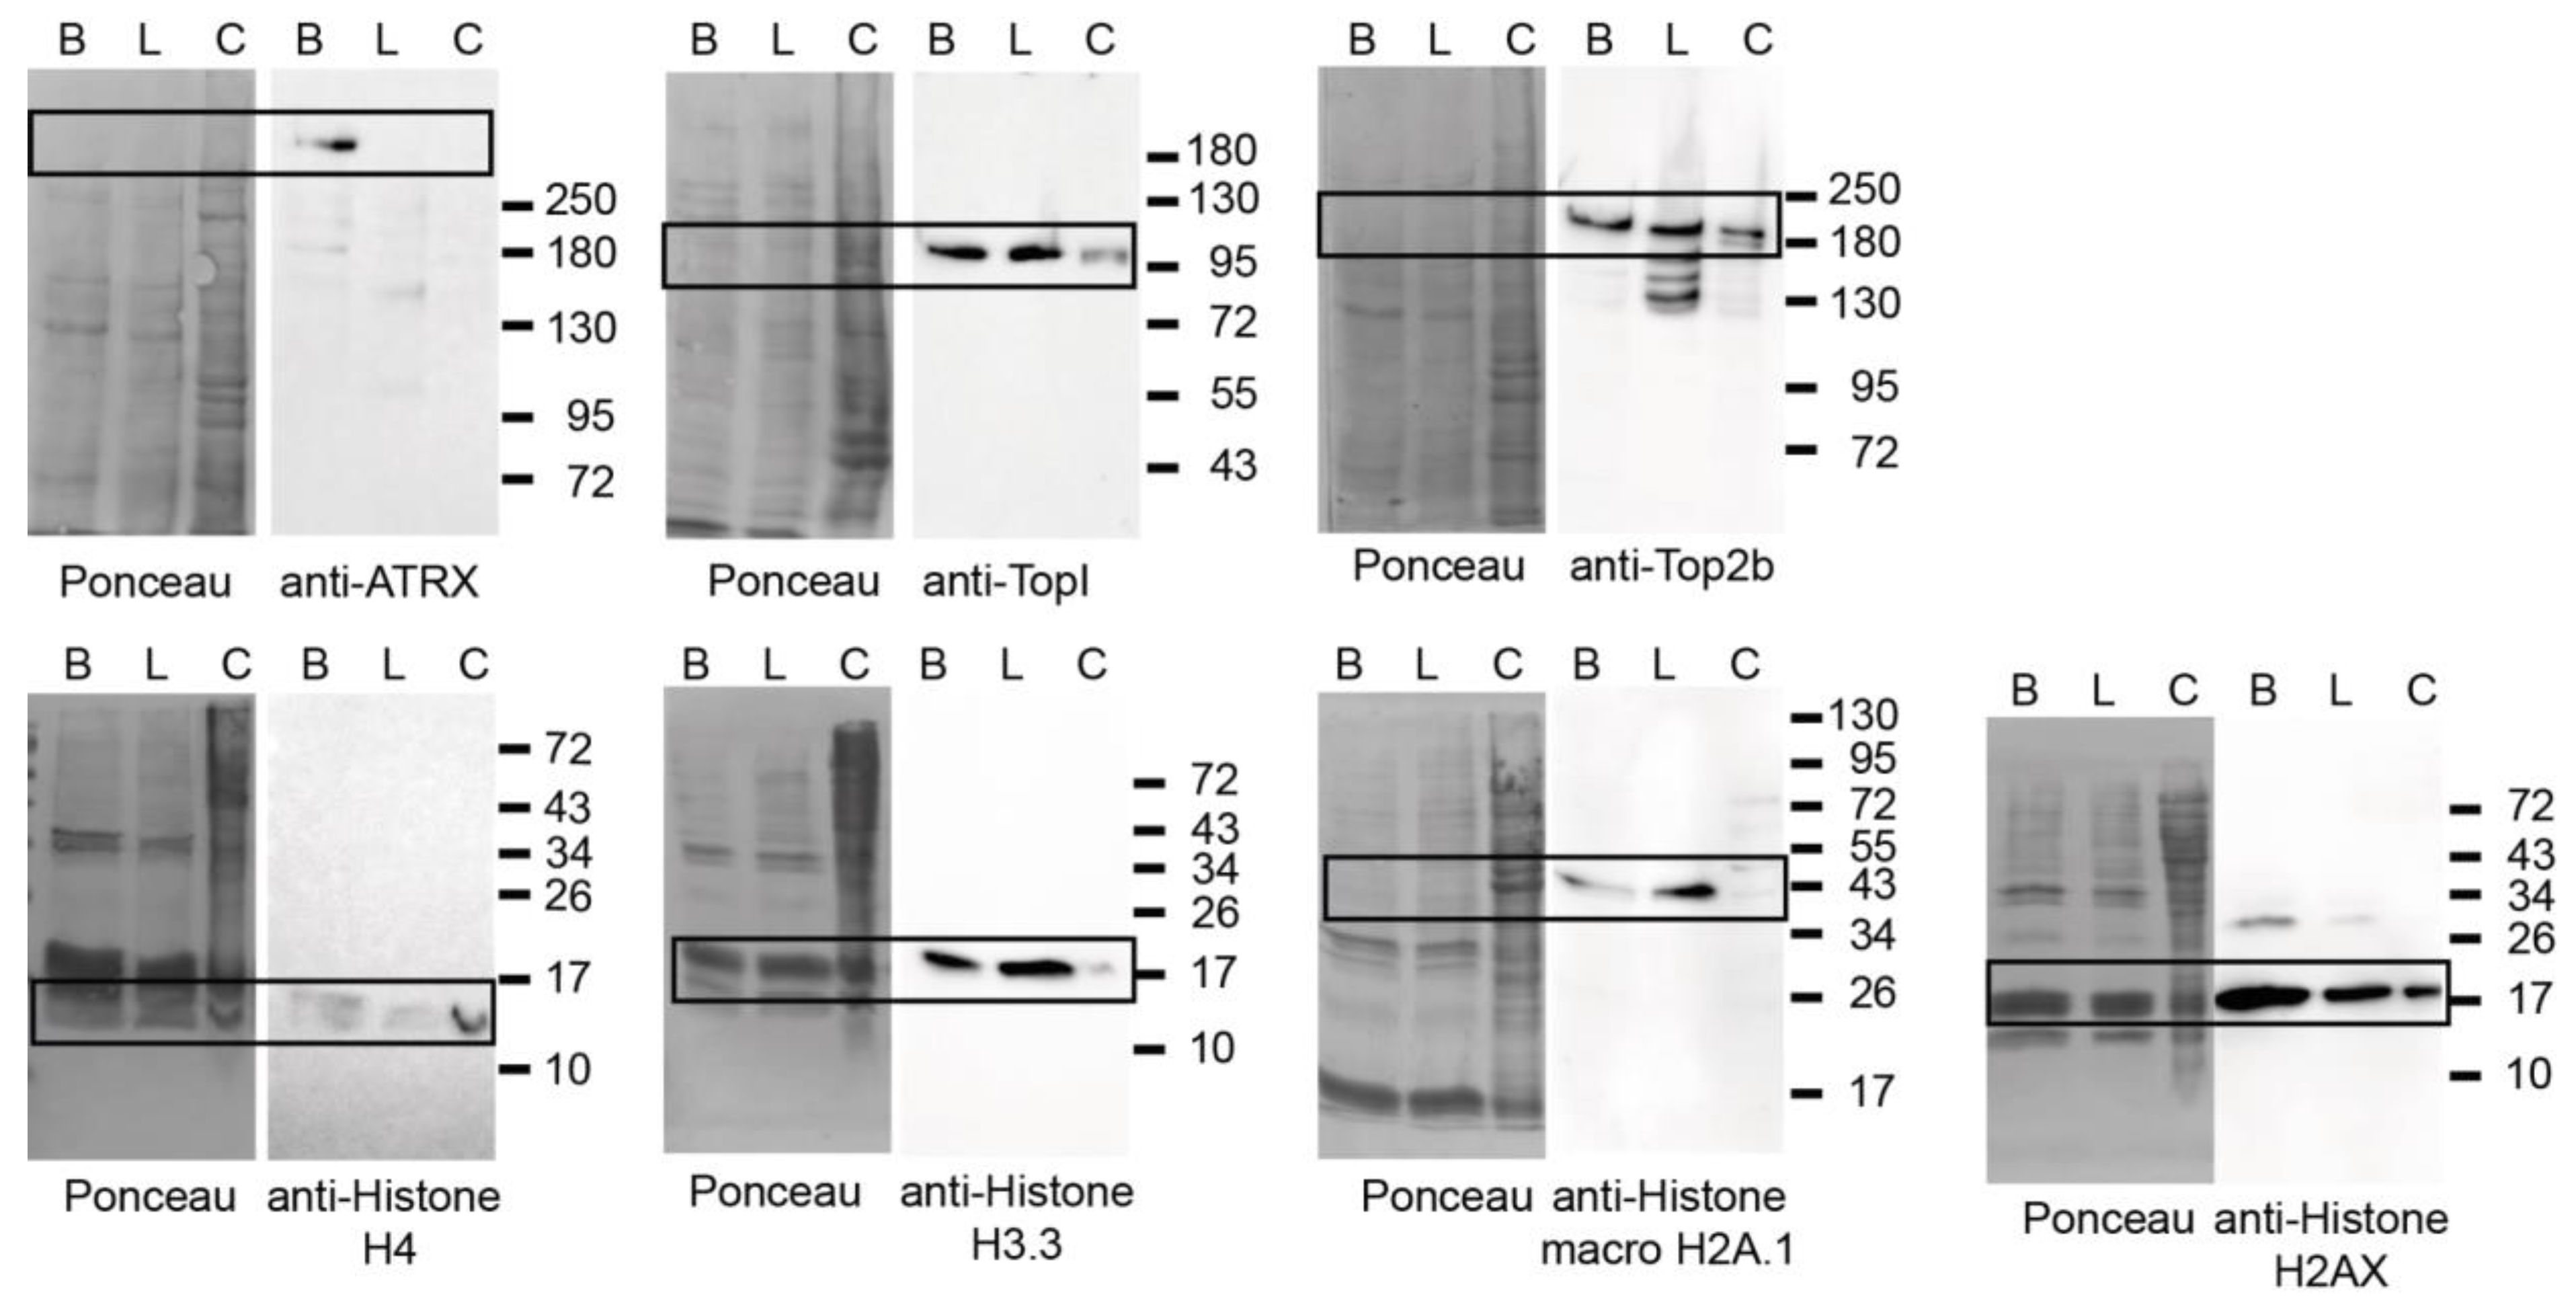
2.7. Western Blot Analysis
2.8. Electron Microscopy and Image Analysis
2.9. Fluorescence In Situ Hybridization
2.10. Immunofluorescence Staining of Tissues
2.11. Cell Culture and Transfection
2.12. Immunofluorescence Staining of Cells
2.13. Fluorescence Microscopy and Image Analysis
3. Results
3.1. (Peri)Centromeric Heterochromatin Organization in Mouse Organs
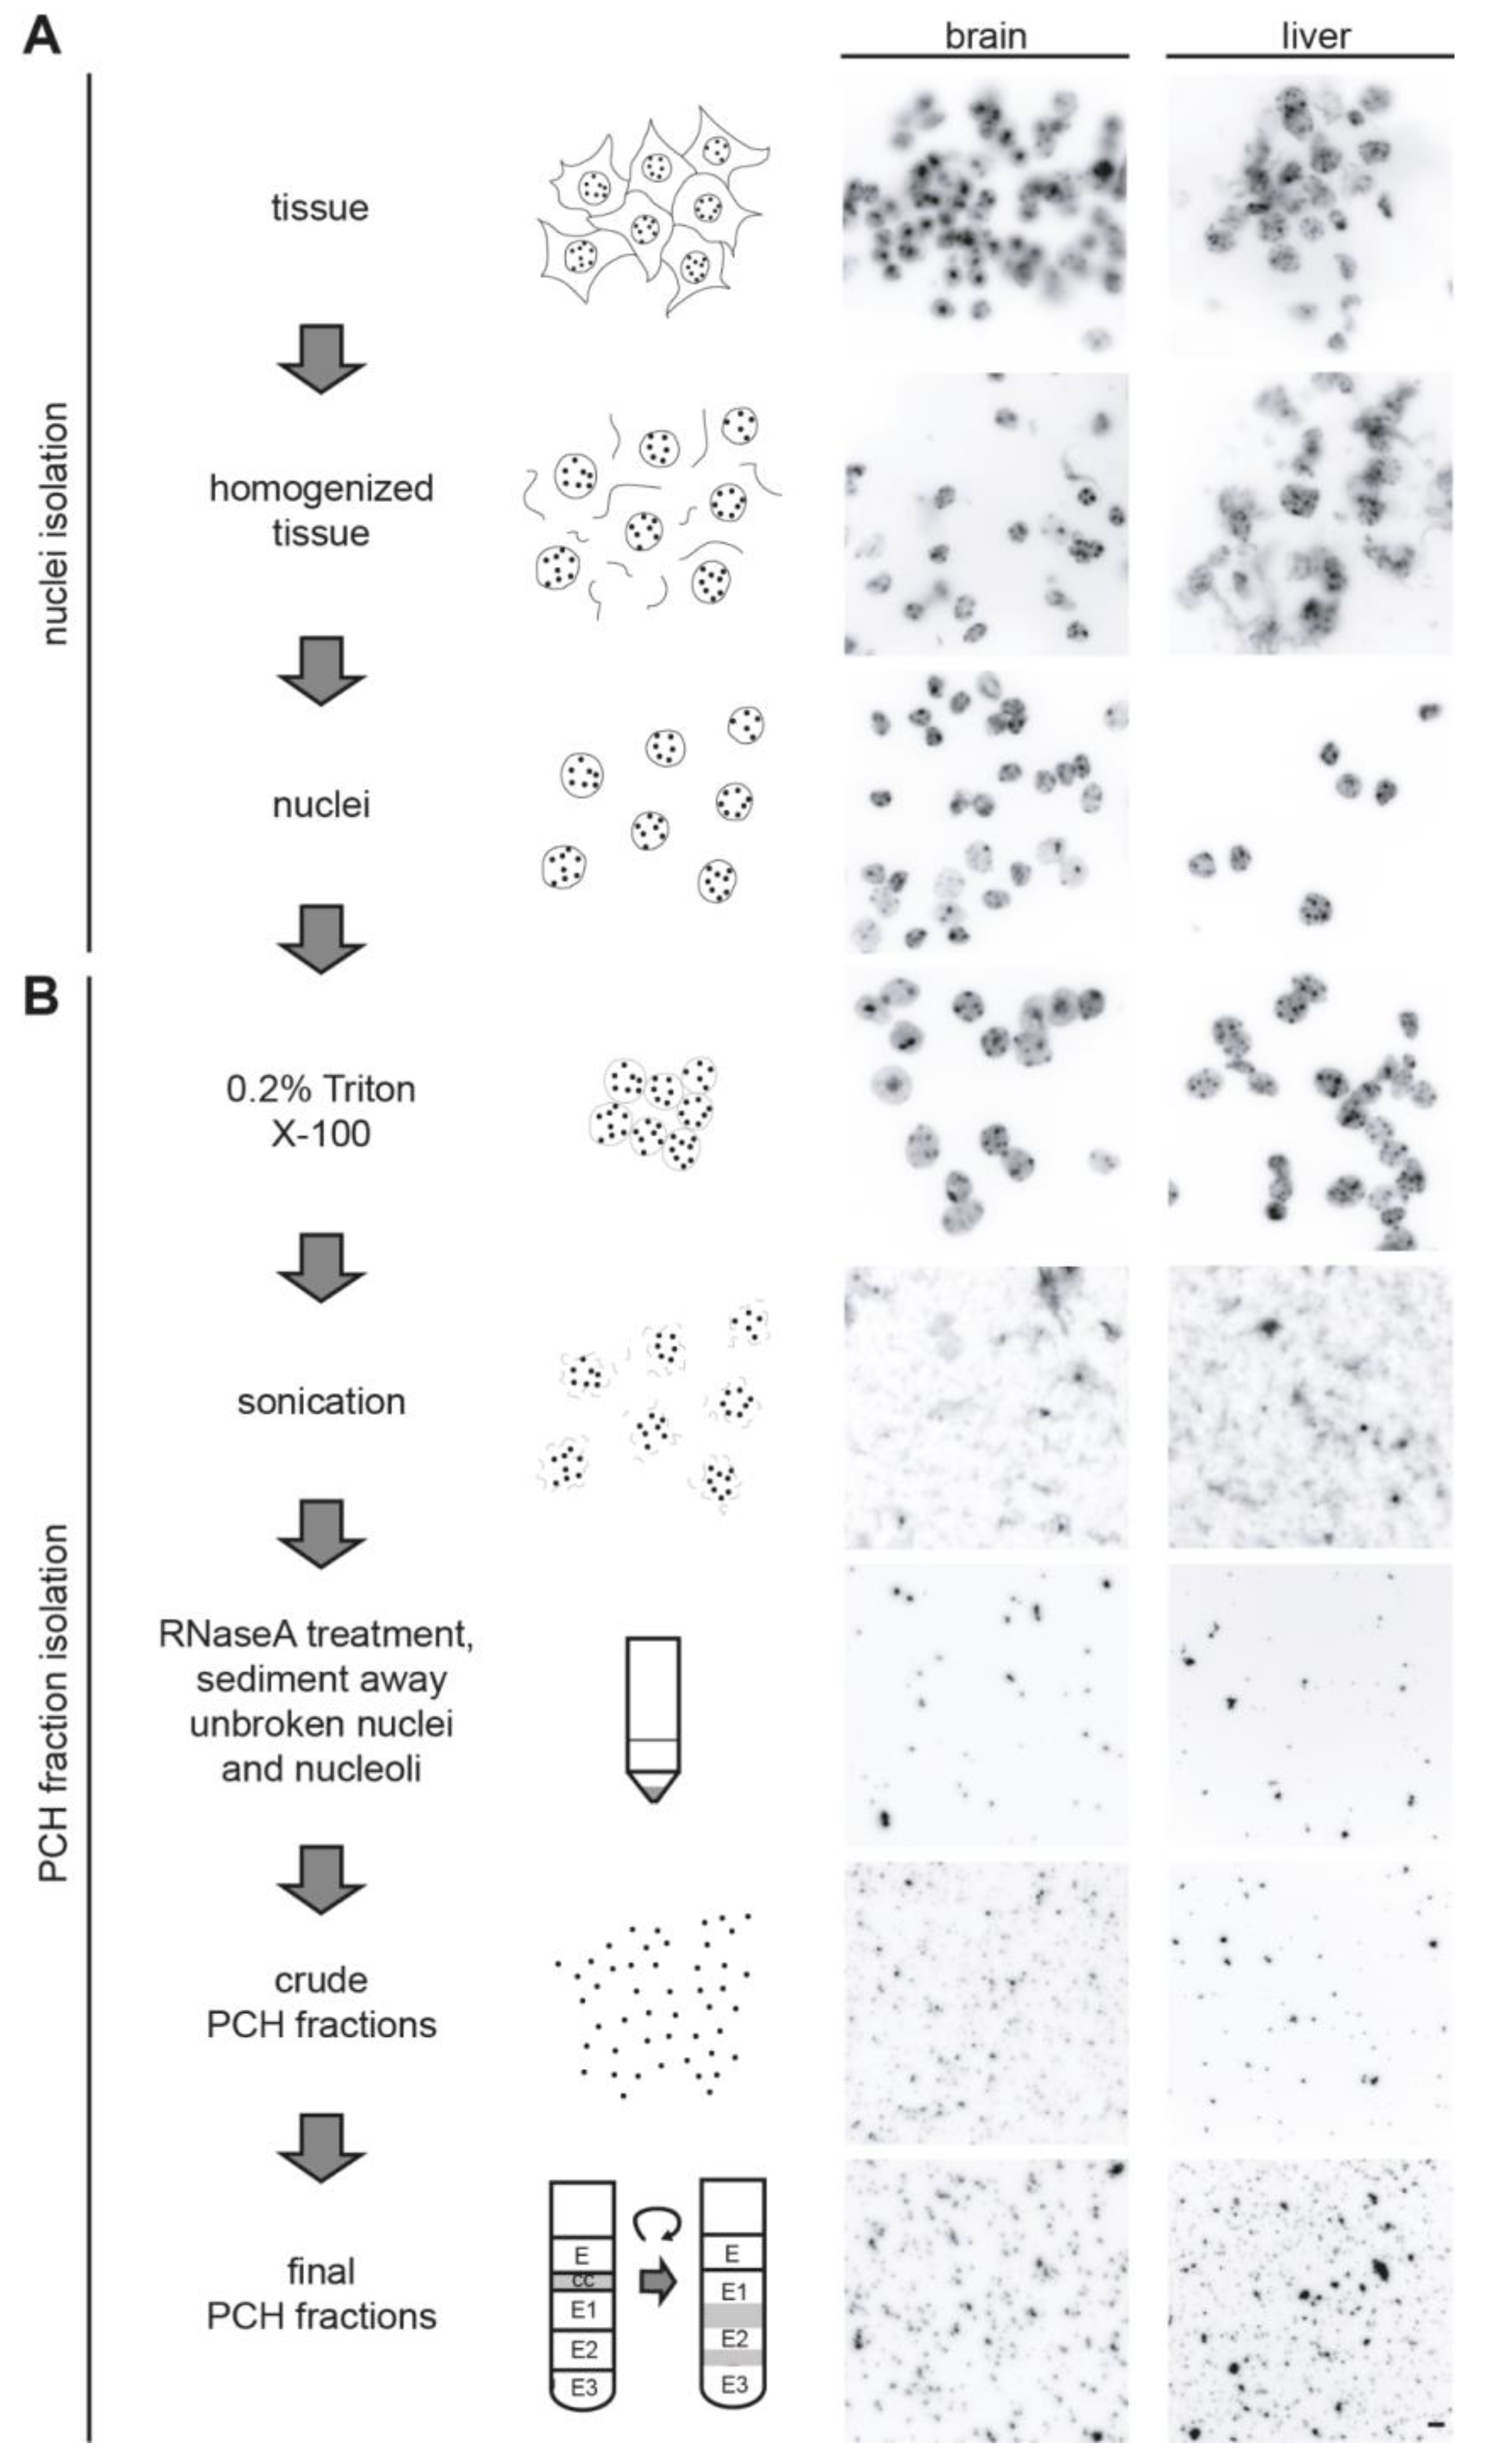
3.2. Isolation of the Native PCH Fraction from Mouse Tissues
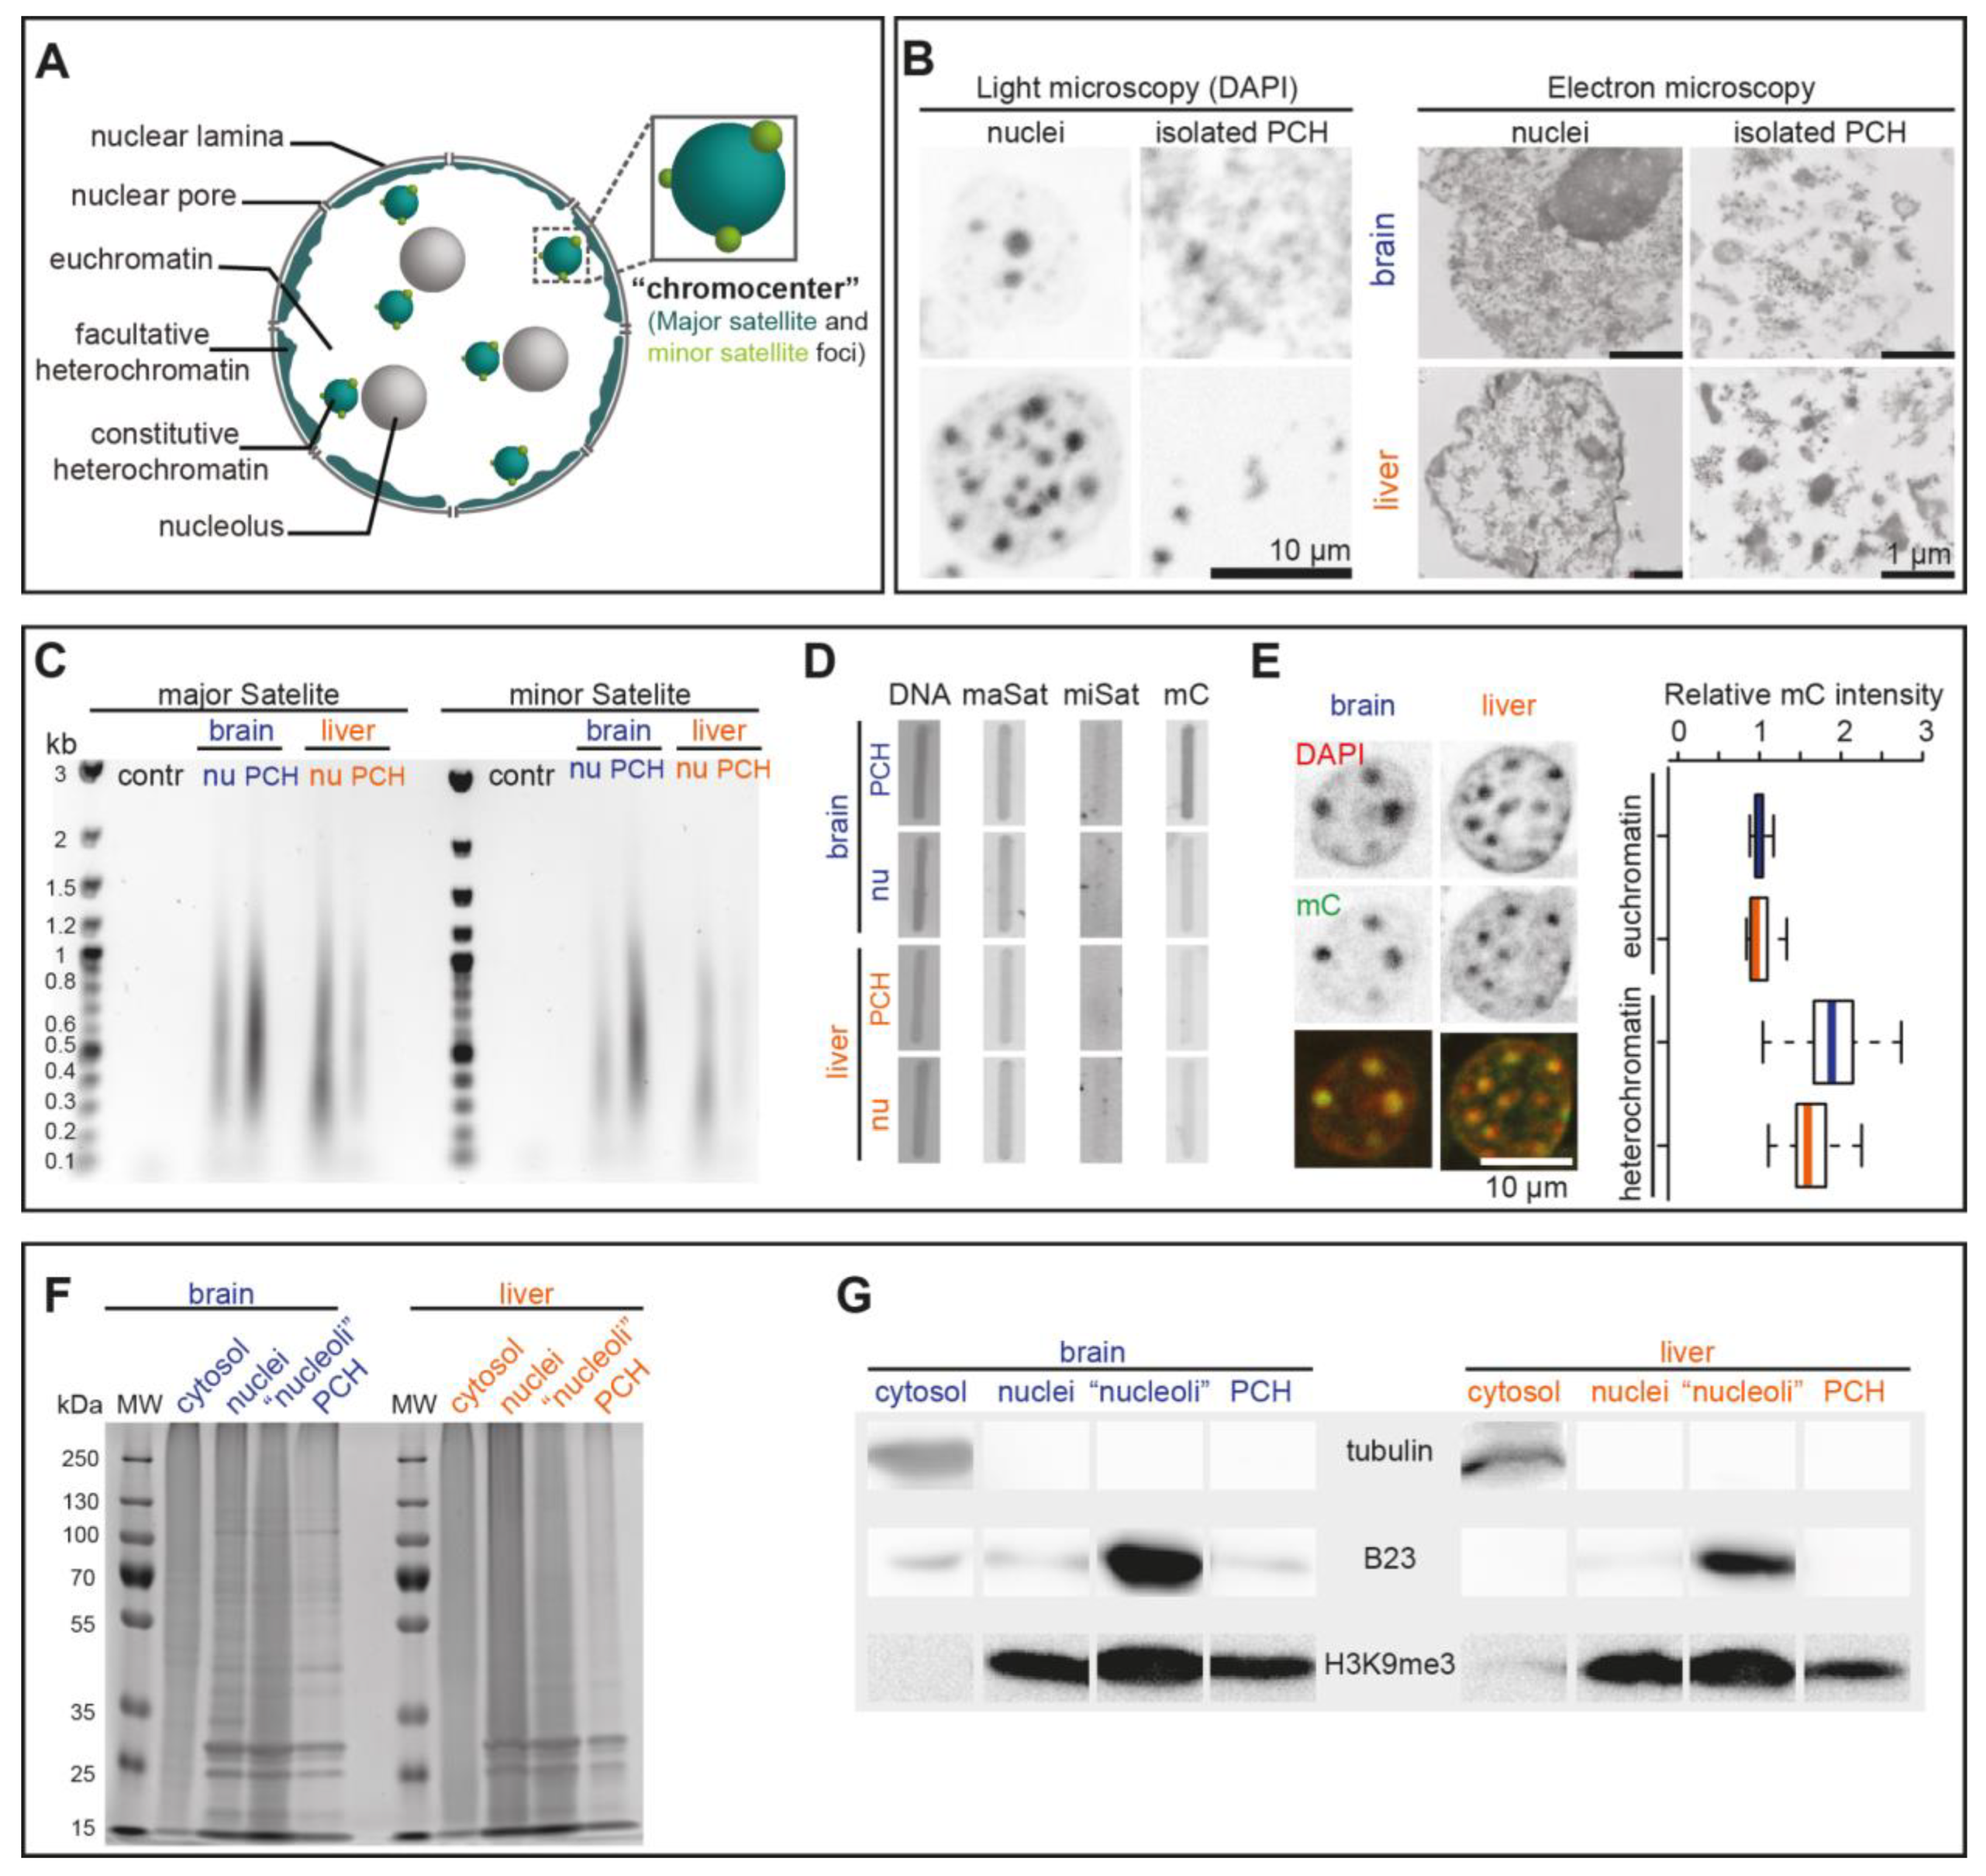
3.3. Validation of the PCH Isolation Strategy
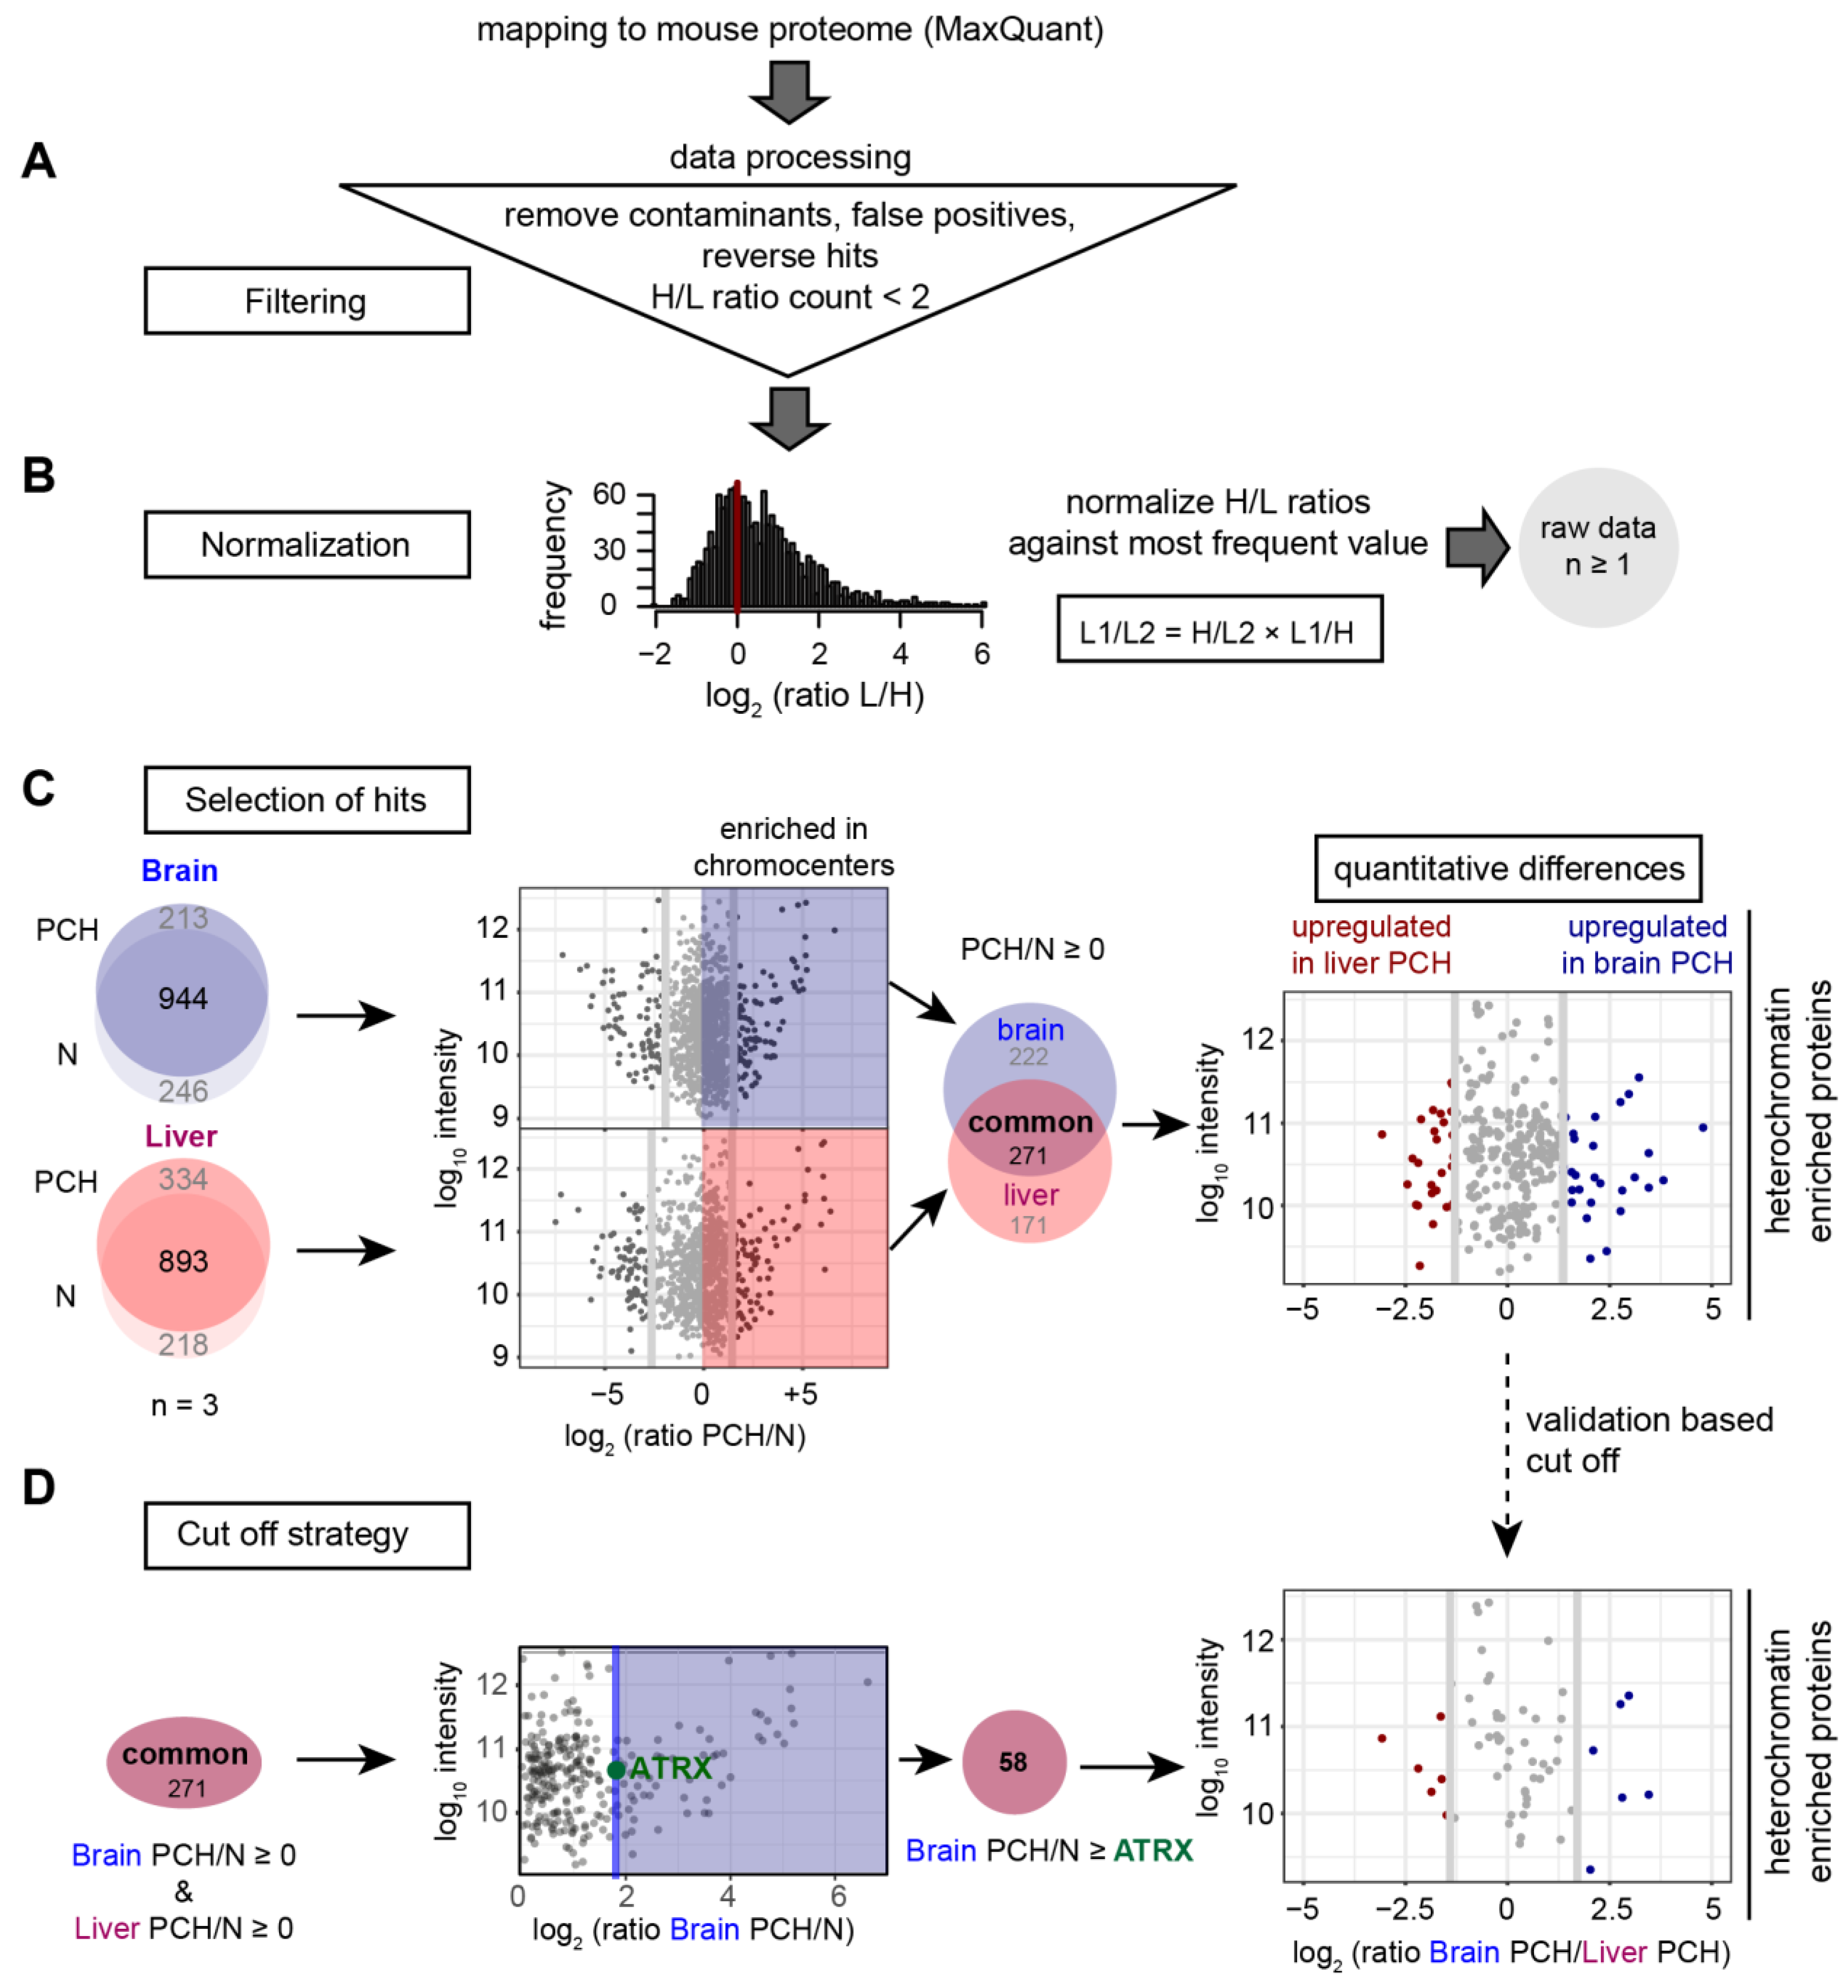
3.4. Quantitative Proteomic Analysis of PCH-Enriched Proteins
3.5. The Isolated PCH Contains Nuclear Membrane- and RNA-Related Protein Hits
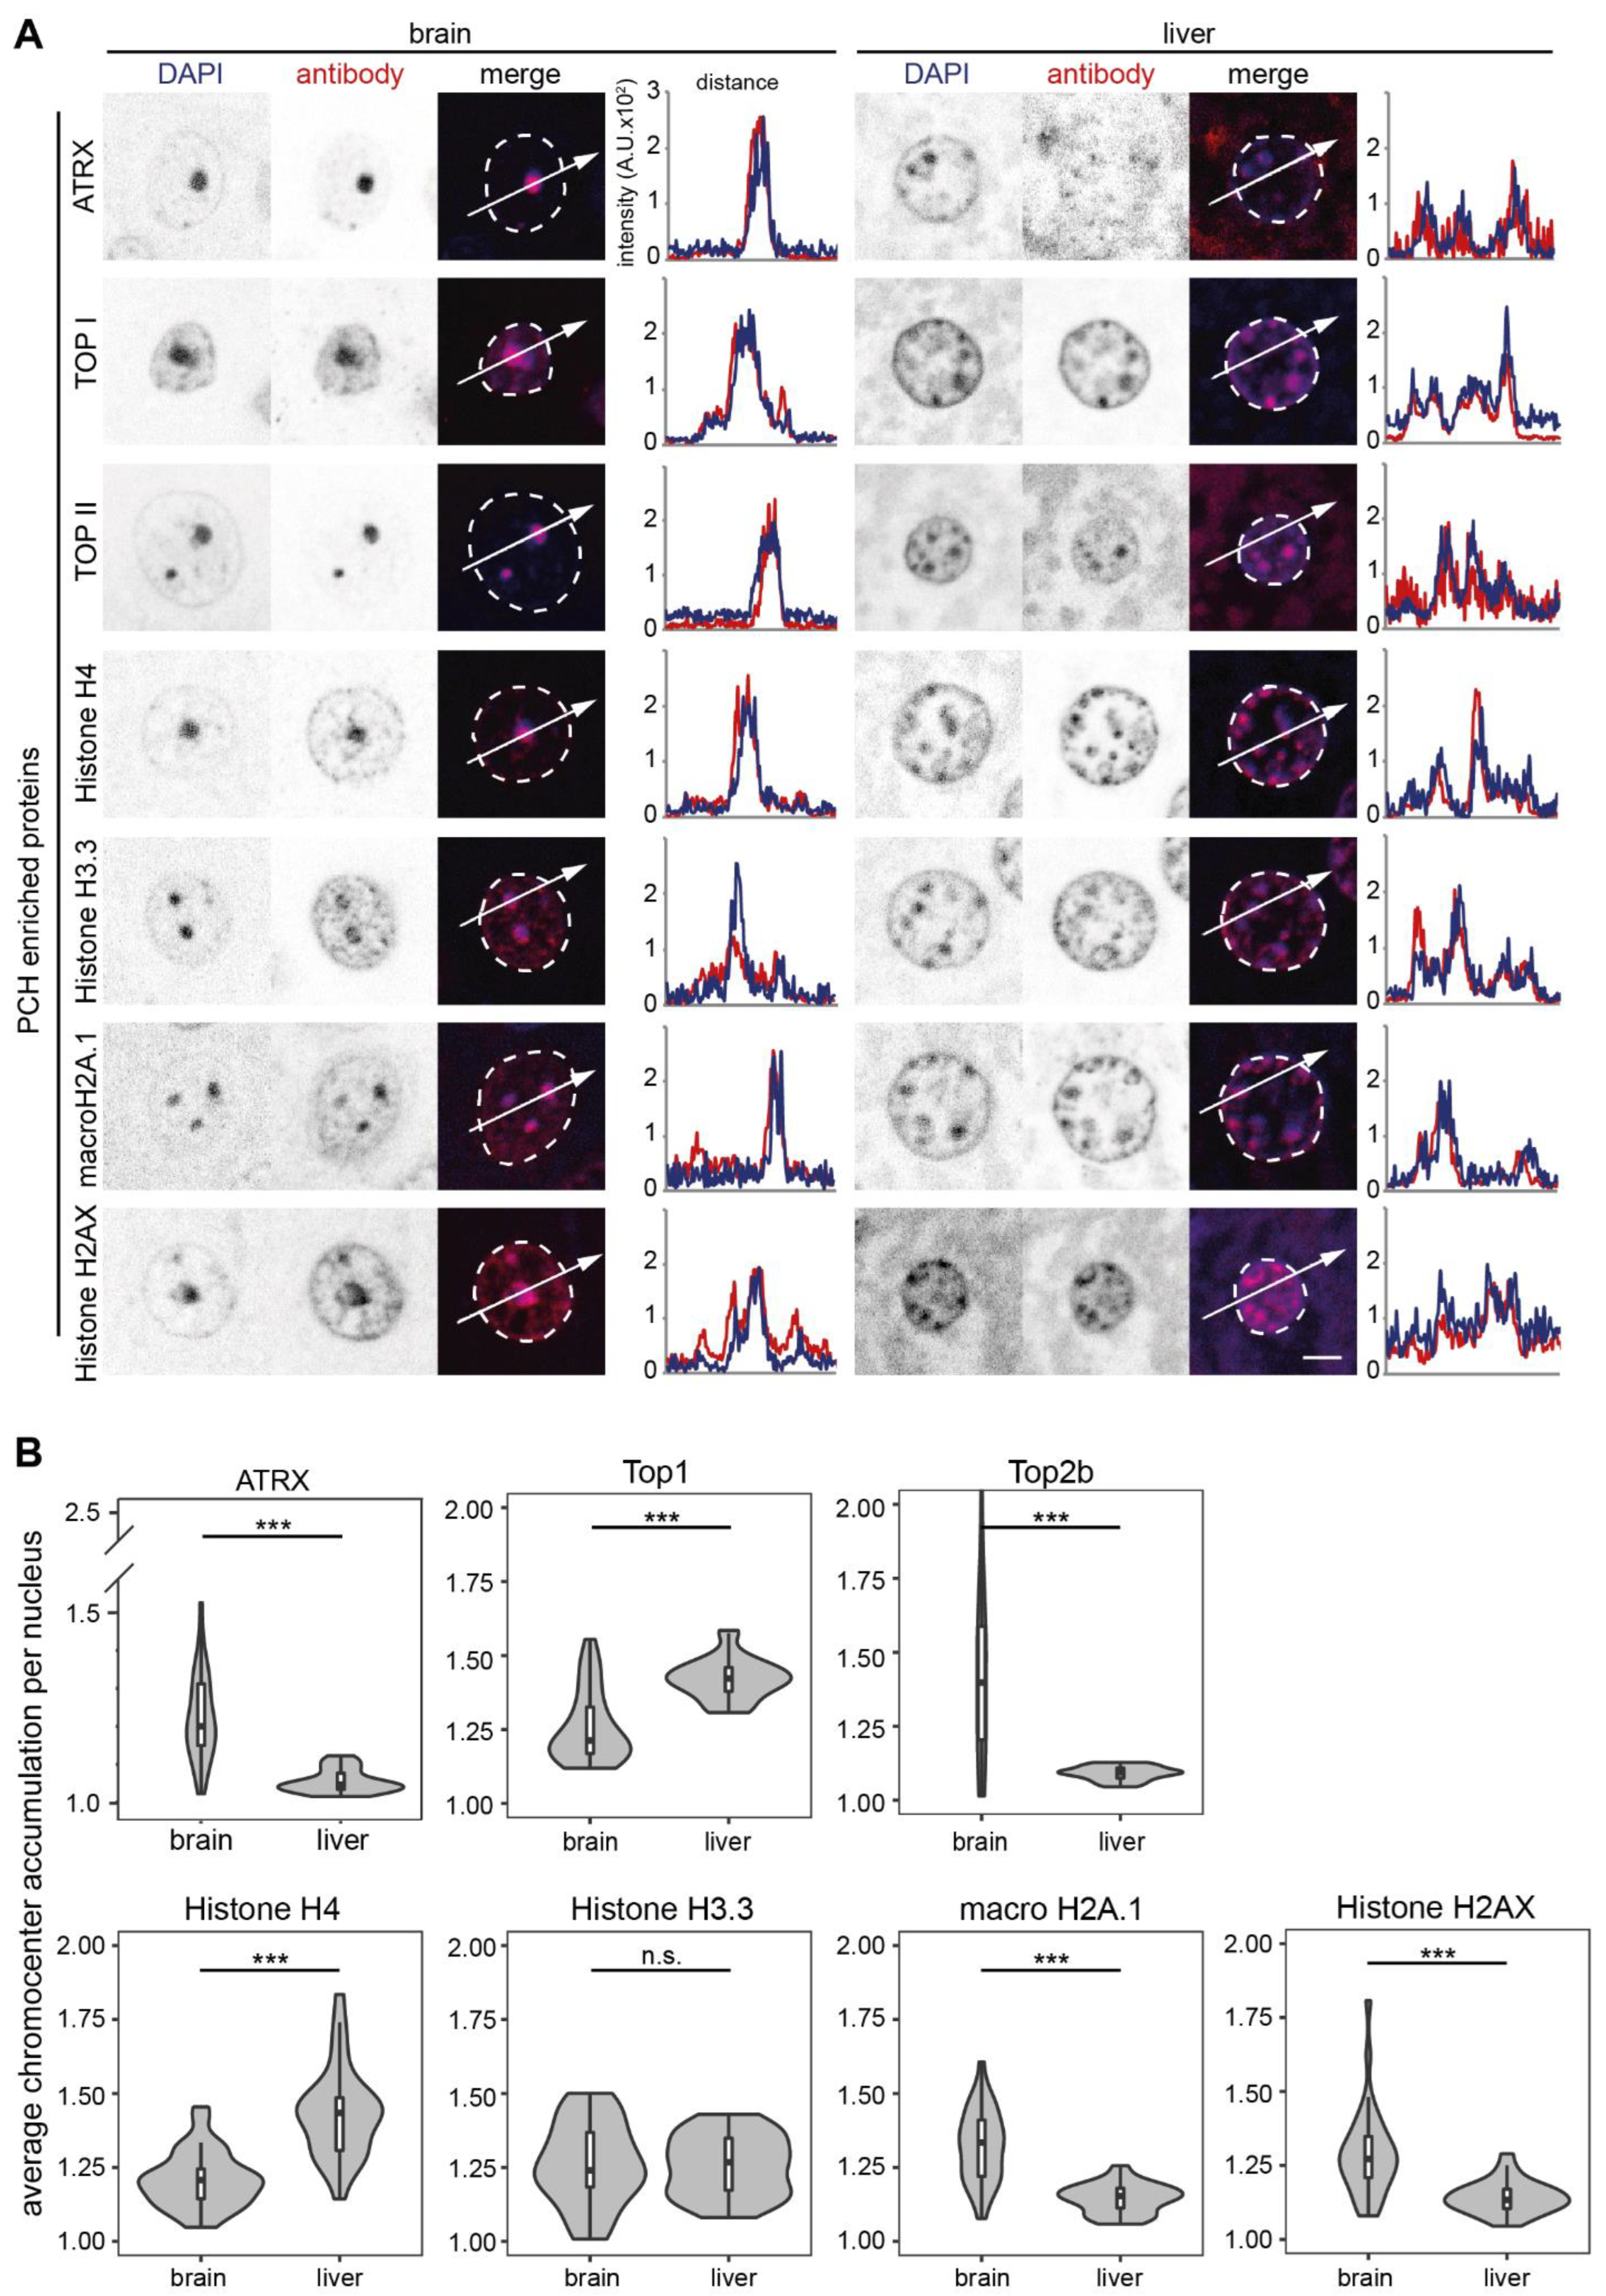
3.6. The Isolated PCH Is Enriched in Histones and Chromatin Related Proteins
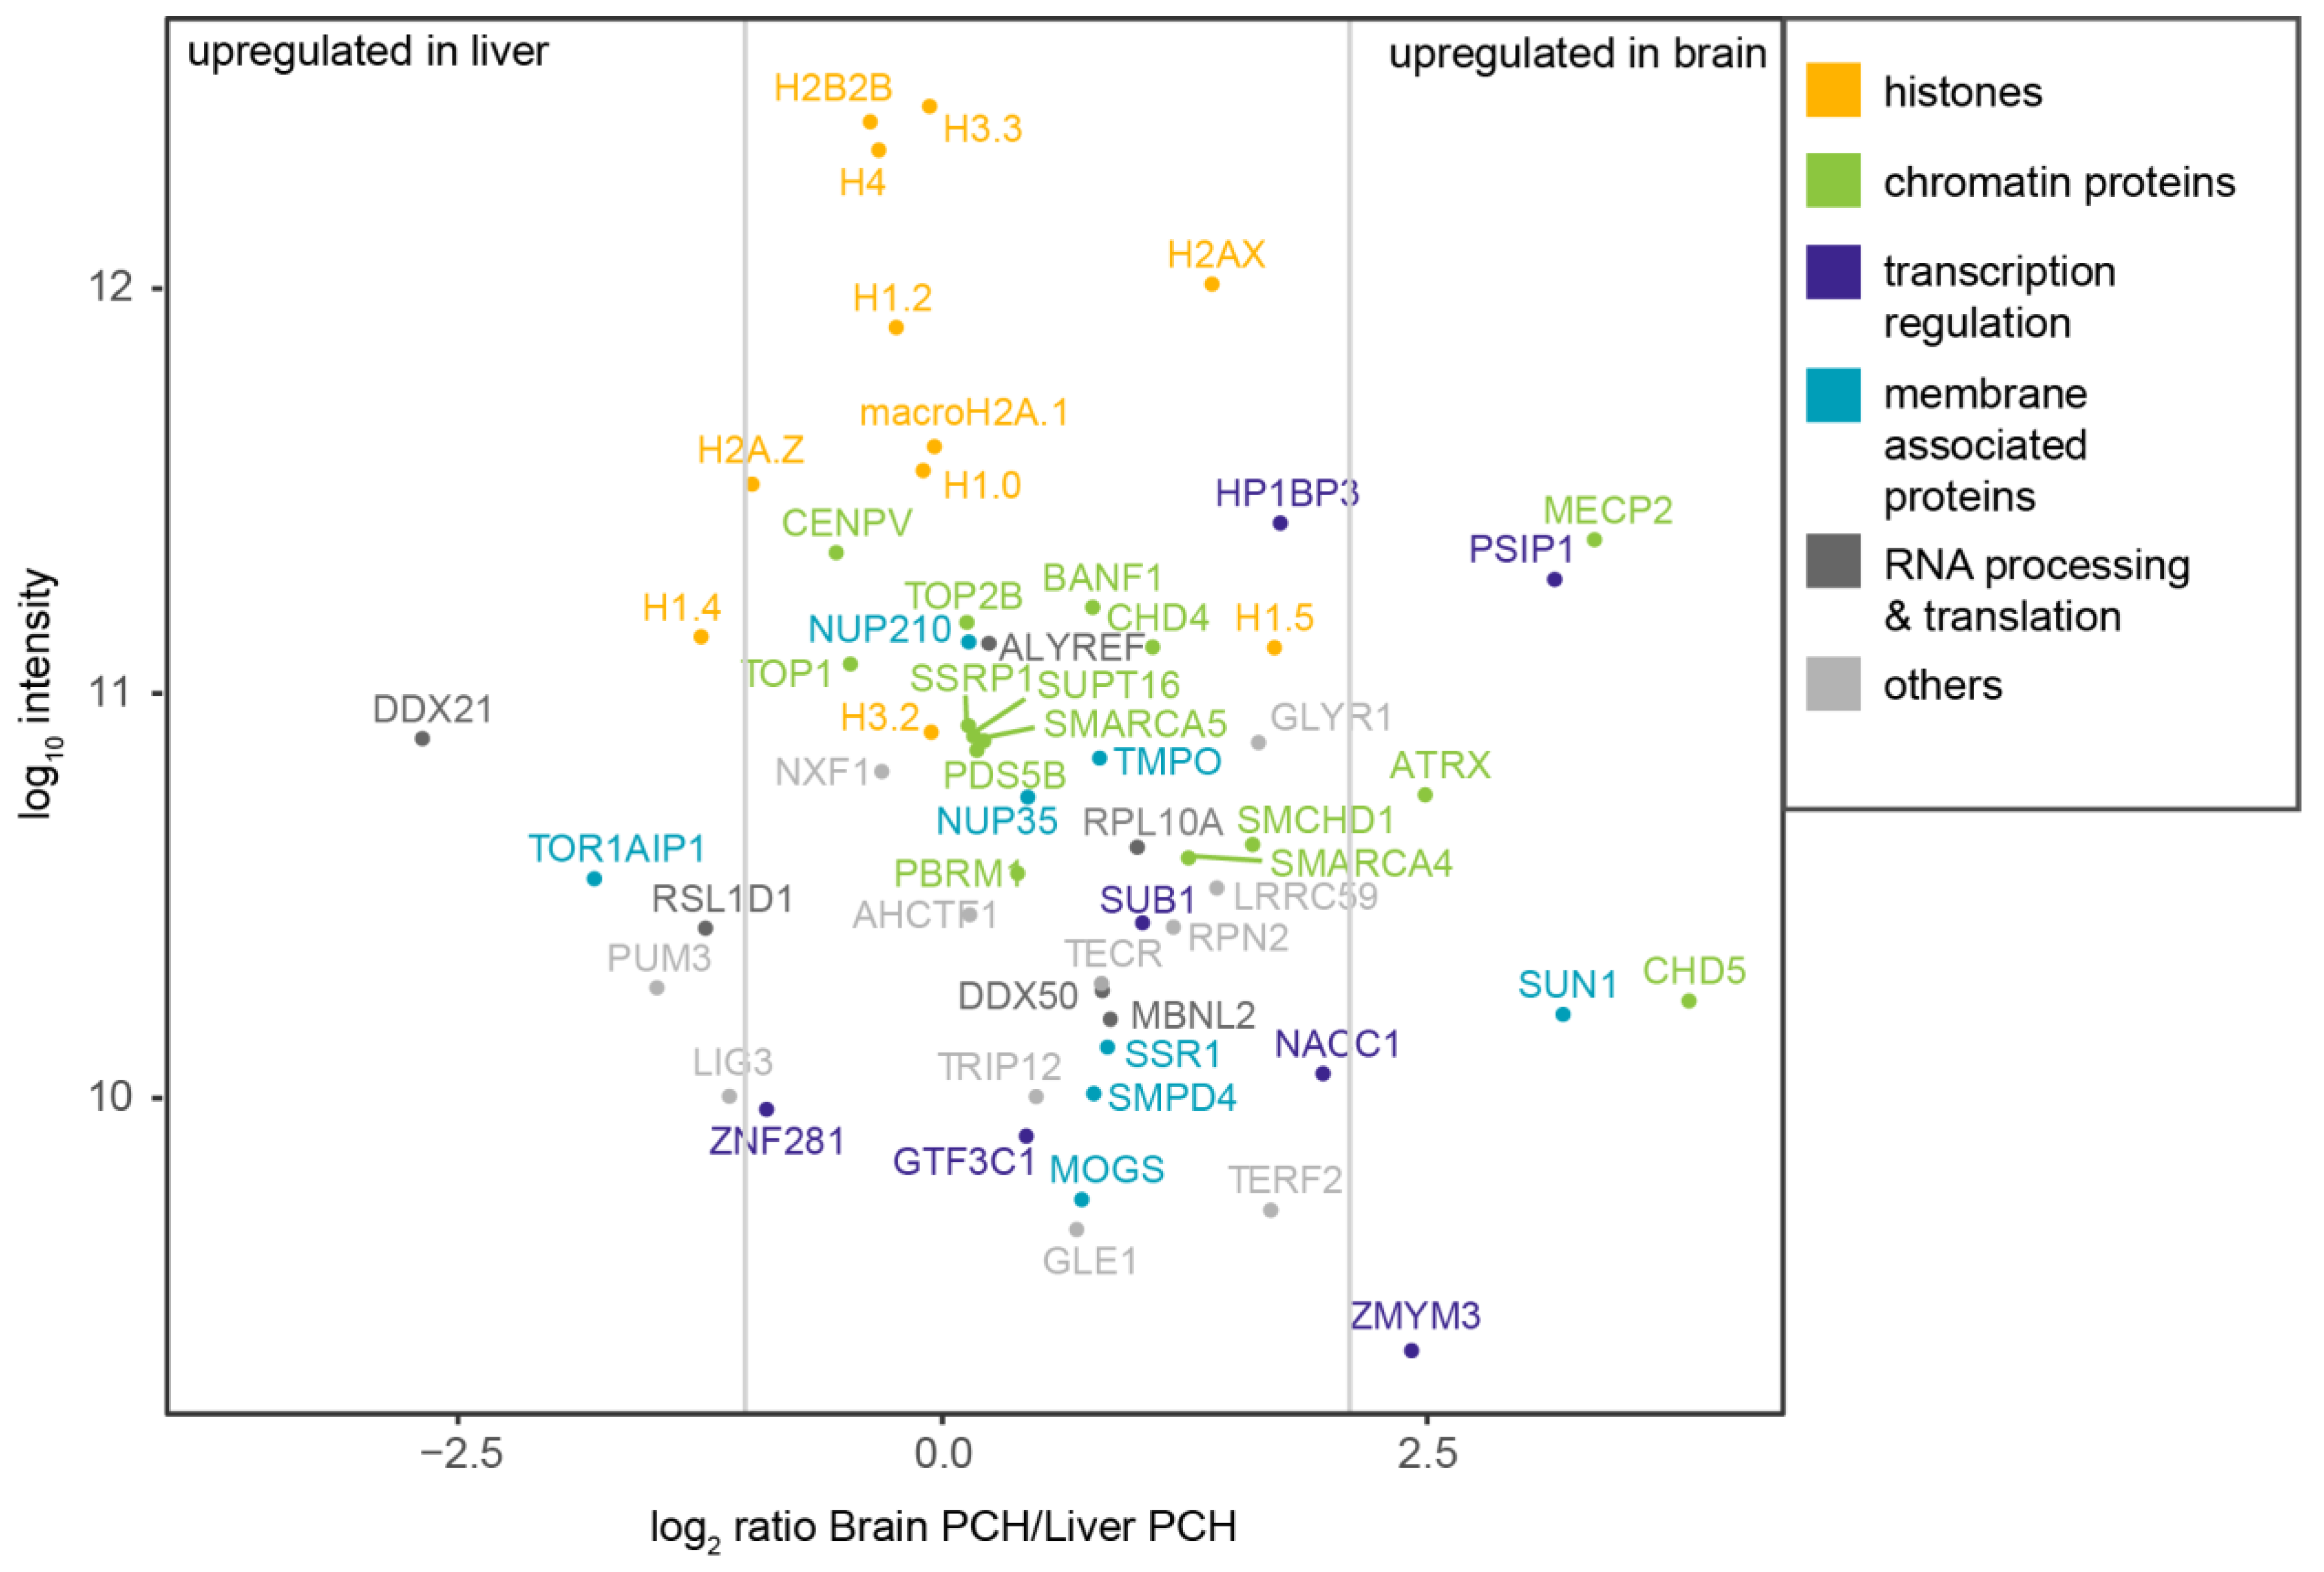
3.7. Proteomic Analysis of Heterochromatin-Enriched Proteins
3.8. MeCP2 Competes with Histone H1 for Heterochromatin Binding and Compartmentalization
4. Conclusions
Supplementary Materials
Author Contributions
Funding
Institutional Review Board Statement
Informed Consent Statement
Data Availability Statement
Acknowledgments
Conflicts of Interest
References
- Heitz, E. Das heterochromatin der moose. Jahrbücher Für Wiss. Bot. 1928, 69, 762–818. [Google Scholar]
- Jost, K.L.; Bertulat, B.; Cardoso, M.C. Heterochromatin and gene positioning: Inside, outside, any side? Chromosoma 2012, 121, 555–563. [Google Scholar] [CrossRef] [PubMed]
- Nishibuchi, G.; Déjardin, J. The molecular basis of the organization of repetitive DNA-containing constitutive heterochromatin in mammals. Chromosome Res. 2017, 25, 77–87. [Google Scholar] [CrossRef] [PubMed]
- Brown, K.E.; Guest, S.S.; Smale, S.T.; Hahm, K.; Merkenschlager, M.; Fisher, A.G. Association of transcriptionally silent genes with Ikaros complexes at centromeric heterochromatin. Cell 1997, 91, 845–854. [Google Scholar] [CrossRef]
- Trojer, P.; Reinberg, D. Facultative heterochromatin: Is there a distinctive molecular signature? Mol. Cell 2007, 28, 1–13. [Google Scholar] [CrossRef]
- Saksouk, N.; Simboeck, E.; Déjardin, J. Constitutive heterochromatin formation and transcription in mammals. Epigenetics Chromatin 2015, 8, 3. [Google Scholar] [CrossRef]
- Pardue, M.L.; Gall, J.G. Chromosomal localization of mouse satellite DNA. Science 1970, 168, 1356–1358. [Google Scholar] [CrossRef]
- Wong, A.K.; Rattner, J.B. Sequence organization and cytological localization of the minor satellite of mouse. Nucleic Acids Res. 1988, 16, 11645–11661. [Google Scholar] [CrossRef]
- Joseph, A.; Mitchell, A.R.; Miller, O.J. The organization of the mouse satellite DNA at centromeres. Exp. Cell Res. 1989, 183, 494–500. [Google Scholar] [CrossRef]
- Baccarini, P. Sulle cinesi vegetative del “Cynomorium coccineum L.”. N. Giorn. Bot. Ital. N. Ser. 1908, 15, 189–203. [Google Scholar]
- Brändle, F.; Frühbauer, B.; Jagannathan, M. Principles and functions of pericentromeric satellite DNA clustering into chromocenters. Semin. Cell Dev. Biol. 2022, 128, 26–39. [Google Scholar] [CrossRef]
- Falk, M.; Feodorova, Y.; Naumova, N.; Imakaev, M.; Lajoie, B.R.; Leonhardt, H.; Joffe, B.; Dekker, J.; Fudenberg, G.; Solovei, I.; et al. Heterochromatin drives compartmentalization of inverted and conventional nuclei. Nature 2019, 570, 395–399. [Google Scholar] [CrossRef] [PubMed]
- Guenatri, M.; Bailly, D.; Maison, C.; Almouzni, G. Mouse centric and pericentric satellite repeats form distinct functional heterochromatin. J. Cell Biol. 2004, 166, 493–505. [Google Scholar] [CrossRef]
- Solovei, I.; Grandi, N.; Knoth, R.; Volk, B.; Cremer, T. Positional changes of pericentromeric heterochromatin and nucleoli in postmitotic Purkinje cells during murine cerebellum development. Cytogenet. Genome Res. 2004, 105, 302–310. [Google Scholar] [CrossRef]
- Brero, A.; Easwaran, H.P.; Nowak, D.; Grunewald, I.; Cremer, T.; Leonhardt, H.; Cardoso, M.C. Methyl CpG-binding proteins induce large-scale chromatin reorganization during terminal differentiation. J. Cell Biol. 2005, 169, 733–743. [Google Scholar] [CrossRef] [PubMed]
- Singleton, M.K.; Gonzales, M.L.; Leung, K.N.; Yasui, D.H.; Schroeder, D.I.; Dunaway, K.; LaSalle, J.M. MeCP2 is required for global heterochromatic and nucleolar changes during activity-dependent neuronal maturation. Neurobiol. Dis. 2011, 43, 190–200. [Google Scholar] [CrossRef] [PubMed]
- Bertulat, B.; De Bonis, M.L.; Della Ragione, F.; Lehmkuhl, A.; Milden, M.; Storm, C.; Jost, K.L.; Scala, S.; Hendrich, B.; D’Esposito, M.; et al. MeCP2 dependent heterochromatin reorganization during neural differentiation of a novel Mecp2-deficient embryonic stem cell reporter line. PLoS ONE 2012, 7, e47848. [Google Scholar] [CrossRef]
- Carone, D.M.; Lawrence, J.B. Heterochromatin instability in cancer: From the Barr body to satellites and the nuclear periphery. Semin. Cancer Biol. 2013, 23, 99–108. [Google Scholar] [CrossRef]
- Agarwal, N.; Becker, A.; Jost, K.L.; Haase, S.; Thakur, B.K.; Brero, A.; Hardt, T.; Kudo, S.; Leonhardt, H.; Cardoso, M.C. MeCP2 Rett mutations affect large scale chromatin organization. Hum. Mol. Genet. 2011, 20, 4187–4195. [Google Scholar] [CrossRef]
- Casas-Delucchi, C.S.; Becker, A.; Bolius, J.J.; Cardoso, M.C. Targeted manipulation of heterochromatin rescues MeCP2 Rett mutants and re-establishes higher order chromatin organization. Nucleic Acids Res. 2012, 40, e176. [Google Scholar] [CrossRef]
- Ito-Ishida, A.; Baker, S.A.; Sillitoe, R.V.; Sun, Y.; Zhou, J.; Ono, Y.; Iwakiri, J.; Yuzaki, M.; Zoghbi, H.Y. Mecp2 levels regulate the 3D structure of heterochromatic foci in mouse neurons. J. Neurosci. 2020, 40, 8746–8766. [Google Scholar] [CrossRef]
- Eymery, A.; Callanan, M.; Vourc’h, C. The secret message of heterochromatin: New insights into the mechanisms and function of centromeric and pericentric repeat sequence transcription. Int. J. Dev. Biol. 2009, 53, 259–268. [Google Scholar] [CrossRef] [PubMed]
- Lu, J.; Gilbert, D.M. Proliferation-dependent and cell cycle regulated transcription of mouse pericentric heterochromatin. J. Cell Biol. 2007, 179, 411–421. [Google Scholar] [CrossRef] [PubMed]
- Rudert, F.; Bronner, S.; Garnier, J.M.; Dollé, P. Transcripts from opposite strands of gamma satellite DNA are differentially expressed during mouse development. Mamm. Genome 1995, 6, 76–83. [Google Scholar] [CrossRef] [PubMed]
- Probst, A.V.; Okamoto, I.; Casanova, M.; El Marjou, F.; Le Baccon, P.; Almouzni, G. A strand-specific burst in transcription of pericentric satellites is required for chromocenter formation and early mouse development. Dev. Cell 2010, 19, 625–638. [Google Scholar] [CrossRef] [PubMed]
- Martens, J.H.A.; O’Sullivan, R.J.; Braunschweig, U.; Opravil, S.; Radolf, M.; Steinlein, P.; Jenuwein, T. The profile of repeat-associated histone lysine methylation states in the mouse epigenome. EMBO J. 2005, 24, 800–812. [Google Scholar] [CrossRef] [PubMed]
- Terranova, R.; Sauer, S.; Merkenschlager, M.; Fisher, A.G. The reorganisation of constitutive heterochromatin in differentiating muscle requires HDAC activity. Exp. Cell Res. 2005, 310, 344–356. [Google Scholar] [CrossRef]
- Enukashvily, N.I.; Malashicheva, A.B.; Waisertreiger, I.S.R. Satellite DNA spatial localization and transcriptional activity in mouse embryonic E-14 and IOUD2 stem cells. Cytogenet. Genome Res. 2009, 124, 277–287. [Google Scholar] [CrossRef]
- Enukashvily, N.I.; Donev, R.; Waisertreiger, I.S.R.; Podgornaya, O.I. Human chromosome 1 satellite 3 DNA is decondensed, demethylated and transcribed in senescent cells and in A431 epithelial carcinoma cells. Cytogenet. Genome Res. 2007, 118, 42–54. [Google Scholar] [CrossRef]
- Rizzi, N.; Denegri, M.; Chiodi, I.; Corioni, M.; Valgardsdottir, R.; Cobianchi, F.; Riva, S.; Biamonti, G. Transcriptional activation of a constitutive heterochromatic domain of the human genome in response to heat shock. Mol. Biol. Cell 2004, 15, 543–551. [Google Scholar] [CrossRef]
- Valgardsdottir, R.; Chiodi, I.; Giordano, M.; Cobianchi, F.; Riva, S.; Biamonti, G. Structural and functional characterization of noncoding repetitive RNAs transcribed in stressed human cells. Mol. Biol. Cell 2005, 16, 2597–2604. [Google Scholar] [CrossRef] [PubMed]
- Jolly, C.; Metz, A.; Govin, J.; Vigneron, M.; Turner, B.M.; Khochbin, S.; Vourc’h, C. Stress-induced transcription of satellite III repeats. J. Cell Biol. 2004, 164, 25–33. [Google Scholar] [CrossRef] [PubMed]
- Valgardsdottir, R.; Chiodi, I.; Giordano, M.; Rossi, A.; Bazzini, S.; Ghigna, C.; Riva, S.; Biamonti, G. Transcription of Satellite III non-coding RNAs is a general stress response in human cells. Nucleic Acids Res. 2008, 36, 423–434. [Google Scholar] [CrossRef] [PubMed]
- Alexiadis, V.; Ballestas, M.E.; Sanchez, C.; Winokur, S.; Vedanarayanan, V.; Warren, M.; Ehrlich, M. RNAPol-ChIP analysis of transcription from FSHD-linked tandem repeats and satellite DNA. Biochim. Biophys. Acta 2007, 1769, 29–40. [Google Scholar] [CrossRef]
- Zhu, Q.; Pao, G.M.; Huynh, A.M.; Suh, H.; Tonnu, N.; Nederlof, P.M.; Gage, F.H.; Verma, I.M. BRCA1 tumour suppression occurs via heterochromatin-mediated silencing. Nature 2011, 477, 179–184. [Google Scholar] [CrossRef]
- Ting, D.T.; Lipson, D.; Paul, S.; Brannigan, B.W.; Akhavanfard, S.; Coffman, E.J.; Contino, G.; Deshpande, V.; Iafrate, A.J.; Letovsky, S.; et al. Aberrant overexpression of satellite repeats in pancreatic and other epithelial cancers. Science 2011, 331, 593–596. [Google Scholar] [CrossRef] [PubMed]
- Janssen, A.; Colmenares, S.U.; Karpen, G.H. Heterochromatin: Guardian of the genome. Annu. Rev. Cell Dev. Biol. 2018, 34, 265–288. [Google Scholar] [CrossRef]
- Thakur, J.; Packiaraj, J.; Henikoff, S. Sequence, chromatin and evolution of satellite DNA. Int. J. Mol. Sci. 2021, 22, 4309. [Google Scholar] [CrossRef]
- Hsu, T.C.; Arrighi, F.E. Distribution of constitutive heterochromatin in mamallian chromosomes. Chromosoma 1971, 34, 243–253. [Google Scholar] [CrossRef]
- Manuelidis, L. Different central nervous system cell types display distinct and nonrandom arrangements of satellite DNA sequences. Proc. Natl. Acad. Sci. USA 1984, 81, 3123–3127. [Google Scholar] [CrossRef]
- Martou, G.; De Boni, U. Nuclear topology of murine, cerebellar Purkinje neurons: Changes as a function of development. Exp. Cell Res. 2000, 256, 131–139. [Google Scholar] [CrossRef]
- Prusov, A.N.; Zatsepina, O.V. Isolation of the chromocenter fraction from mouse liver nuclei. Biochemistry 2002, 67, 423–431. [Google Scholar]
- Zatsepina, O.V.; Zharskaya, O.O.; Prusov, A.N. Isolation of the constitutive heterochromatin from mouse liver nuclei. Methods Mol. Biol. 2008, 463, 169–180. [Google Scholar] [CrossRef] [PubMed]
- Wessel, D.; Flügge, U.I. A method for the quantitative recovery of protein in dilute solution in the presence of detergents and lipids. Anal. Biochem. 1984, 138, 141–143. [Google Scholar] [CrossRef] [PubMed]
- Kanashova, T.; Popp, O.; Orasche, J.; Karg, E.; Harndorf, H.; Stengel, B.; Sklorz, M.; Streibel, T.; Zimmermann, R.; Dittmar, G. Differential proteomic analysis of mouse macrophages exposed to adsorbate-loaded heavy fuel oil derived combustion particles using an automated sample-preparation workflow. Anal. Bioanal. Chem. 2015, 407, 5965–5976. [Google Scholar] [CrossRef] [PubMed]
- Boersema, P.J.; Raijmakers, R.; Lemeer, S.; Mohammed, S.; Heck, A.J.R. Multiplex peptide stable isotope dimethyl labeling for quantitative proteomics. Nat. Protoc. 2009, 4, 484–494. [Google Scholar] [CrossRef] [PubMed]
- Rappsilber, J.; Mann, M.; Ishihama, Y. Protocol for micro-purification, enrichment, pre-fractionation and storage of peptides for proteomics using StageTips. Nat. Protoc. 2007, 2, 1896–1906. [Google Scholar] [CrossRef]
- Cox, J.; Mann, M. MaxQuant enables high peptide identification rates, individualized p.p.b.-range mass accuracies and proteome-wide protein quantification. Nat. Biotechnol. 2008, 26, 1367–1372. [Google Scholar] [CrossRef]
- Tyanova, S.; Temu, T.; Cox, J. The MaxQuant computational platform for mass spectrometry-based shotgun proteomics. Nat. Protoc. 2016, 11, 2301–2319. [Google Scholar] [CrossRef]
- UniProt Consortium UniProt: A worldwide hub of protein knowledge. Nucleic Acids Res. 2019, 47, D506–D515. [CrossRef]
- Geiger, T.; Wisniewski, J.R.; Cox, J.; Zanivan, S.; Kruger, M.; Ishihama, Y.; Mann, M. Use of stable isotope labeling by amino acids in cell culture as a spike-in standard in quantitative proteomics. Nat. Protoc. 2011, 6, 147–157. [Google Scholar] [CrossRef] [PubMed]
- R Core Team R. A Language and Environment for Statistical Computing; R Foundation for Statistical Computing: Vienna, Austria, 2013. [Google Scholar]
- Eden, E.; Navon, R.; Steinfeld, I.; Lipson, D.; Yakhini, Z. GOrilla: A tool for discovery and visualization of enriched GO terms in ranked gene lists. BMC Bioinform. 2009, 10, 48. [Google Scholar] [CrossRef]
- Frauer, C.; Rottach, A.; Meilinger, D.; Bultmann, S.; Fellinger, K.; Hasenöder, S.; Wang, M.; Qin, W.; Söding, J.; Spada, F.; et al. Different binding properties and function of CXXC zinc finger domains in Dnmt1 and Tet1. PLoS ONE 2011, 6, e16627. [Google Scholar] [CrossRef]
- Lehnertz, B.; Ueda, Y.; Derijck, A.A.H.A.; Braunschweig, U.; Perez-Burgos, L.; Kubicek, S.; Chen, T.; Li, E.; Jenuwein, T.; Peters, A.H.F.M. Suv39h-mediated histone H3 lysine 9 methylation directs DNA methylation to major satellite repeats at pericentric heterochromatin. Curr. Biol. 2003, 13, 1192–1200. [Google Scholar] [CrossRef] [PubMed]
- Ovesný, M.; Křížek, P.; Borkovec, J.; Svindrych, Z.; Hagen, G.M. ThunderSTORM: A comprehensive ImageJ plug-in for PALM and STORM data analysis and super-resolution imaging. Bioinformatics 2014, 30, 2389–2390. [Google Scholar] [CrossRef] [PubMed]
- Th’ng, J.P.H.; Sung, R.; Ye, M.; Hendzel, M.J. H1 family histones in the nucleus. Control of binding and localization by the C-terminal domain. J. Biol. Chem. 2005, 280, 27809–27814. [Google Scholar] [CrossRef] [PubMed]
- Schneider, C.A.; Rasband, W.S.; Eliceiri, K.W. NIH Image to ImageJ: 25 years of image analysis. Nat. Methods 2012, 9, 671–675. [Google Scholar] [CrossRef]
- Schindelin, J.; Arganda-Carreras, I.; Frise, E.; Kaynig, V.; Longair, M.; Pietzsch, T.; Preibisch, S.; Rueden, C.; Saalfeld, S.; Schmid, B.; et al. Fiji: An open-source platform for biological-image analysis. Nat. Methods 2012, 9, 676–682. [Google Scholar] [CrossRef]
- Torrente, M.P.; Zee, B.M.; Young, N.L.; Baliban, R.C.; LeRoy, G.; Floudas, C.A.; Hake, S.B.; Garcia, B.A. Proteomic interrogation of human chromatin. PLoS ONE 2011, 6, e24747. [Google Scholar] [CrossRef]
- van Mierlo, G.; Dirks, R.A.M.; De Clerck, L.; Brinkman, A.B.; Huth, M.; Kloet, S.L.; Saksouk, N.; Kroeze, L.I.; Willems, S.; Farlik, M.; et al. Integrative Proteomic Profiling Reveals PRC2-Dependent Epigenetic Crosstalk Maintains Ground-State Pluripotency. Cell Stem Cell 2019, 24, 123–137.e8. [Google Scholar] [CrossRef]
- Iglesias, N.; Paulo, J.A.; Tatarakis, A.; Wang, X.; Edwards, A.L.; Bhanu, N.V.; Garcia, B.A.; Haas, W.; Gygi, S.P.; Moazed, D. Native chromatin proteomics reveals a role for specific nucleoporins in heterochromatin organization and maintenance. Mol. Cell 2020, 77, 51–66.e8. [Google Scholar] [CrossRef] [PubMed]
- Federation, A.J.; Nandakumar, V.; Searle, B.C.; Stergachis, A.; Wang, H.; Pino, L.K.; Merrihew, G.; Ting, Y.S.; Howard, N.; Kutyavin, T.; et al. Highly parallel quantification and compartment localization of transcription factors and nuclear proteins. Cell Rep. 2020, 30, 2463–2471.e5. [Google Scholar] [CrossRef] [PubMed]
- Spector, D.L.; Fu, X.D.; Maniatis, T. Associations between distinct pre-mRNA splicing components and the cell nucleus. EMBO J. 1991, 10, 3467–3481. [Google Scholar] [CrossRef]
- Baker, N.M.; Rajan, R.; Mondragón, A. Structural studies of type I topoisomerases. Nucleic Acids Res. 2009, 37, 693–701. [Google Scholar] [CrossRef]
- Lee, S.K.; Wang, W. Roles of topoisomerases in heterochromatin, aging, and diseases. Genes 2019, 10, 884. [Google Scholar] [CrossRef]
- Kernohan, K.D.; Jiang, Y.; Tremblay, D.C.; Bonvissuto, A.C.; Eubanks, J.H.; Mann, M.R.W.; Bérubé, N.G. ATRX partners with cohesin and MeCP2 and contributes to developmental silencing of imprinted genes in the brain. Dev. Cell 2010, 18, 191–202. [Google Scholar] [CrossRef]
- Nan, X.; Hou, J.; Maclean, A.; Nasir, J.; Lafuente, M.J.; Shu, X.; Kriaucionis, S.; Bird, A. Interaction between chromatin proteins MECP2 and ATRX is disrupted by mutations that cause inherited mental retardation. Proc. Natl. Acad. Sci. USA 2007, 104, 2709–2714. [Google Scholar] [CrossRef] [PubMed]
- Larrigan, S.; Shah, S.; Fernandes, A.; Mattar, P. Chromatin Remodeling in the Brain-a NuRDevelopmental Odyssey. Int. J. Mol. Sci. 2021, 22, 4768. [Google Scholar] [CrossRef]
- Kalimuthu, S.N.; Chetty, R. Gene of the month: SMARCB1. J. Clin. Pathol. 2016, 69, 484–489. [Google Scholar] [CrossRef]
- Maze, I.; Noh, K.-M.; Soshnev, A.A.; Allis, C.D. Every amino acid matters: Essential contributions of histone variants to mammalian development and disease. Nat. Rev. Genet. 2014, 15, 259–271. [Google Scholar] [CrossRef]
- Lennox, R.W.; Cohen, L.H. The histone H1 complements of dividing and nondividing cells of the mouse. J. Biol. Chem. 1983, 258, 262–268. [Google Scholar] [CrossRef] [PubMed]
- Meergans, T.; Albig, W.; Doenecke, D. Varied expression patterns of human H1 histone genes in different cell lines. DNA Cell Biol. 1997, 16, 1041–1049. [Google Scholar] [CrossRef]
- Fan, Y.; Sirotkin, A.; Russell, R.G.; Ayala, J.; Skoultchi, A.I. Individual somatic H1 subtypes are dispensable for mouse development even in mice lacking the H1(0) replacement subtype. Mol. Cell. Biol. 2001, 21, 7933–7943. [Google Scholar] [CrossRef] [PubMed]
- Happel, N.; Doenecke, D. Histone H1 and its isoforms: Contribution to chromatin structure and function. Gene 2009, 431, 1–12. [Google Scholar] [CrossRef] [PubMed]
- Skene, P.J.; Illingworth, R.S.; Webb, S.; Kerr, A.R.W.; James, K.D.; Turner, D.J.; Andrews, R.; Bird, A.P. Neuronal MeCP2 is expressed at near histone-octamer levels and globally alters the chromatin state. Mol. Cell 2010, 37, 457–468. [Google Scholar] [CrossRef]
- Pearson, E.C.; Bates, D.L.; Prospero, T.D.; Thomas, J.O. Neuronal nuclei and glial nuclei from mammalian cerebral cortex. Nucleosome repeat lengths, DNA contents and H1 contents. Eur. J. Biochem. 1984, 144, 353–360. [Google Scholar] [CrossRef]
- Ghosh, R.P.; Horowitz-Scherer, R.A.; Nikitina, T.; Shlyakhtenko, L.S.; Woodcock, C.L. MeCP2 binds cooperatively to its substrate and competes with histone H1 for chromatin binding sites. Mol. Cell. Biol. 2010, 30, 4656–4670. [Google Scholar] [CrossRef]
- Bernard, P.; Maure, J.F.; Partridge, J.F.; Genier, S.; Javerzat, J.P.; Allshire, R.C. Requirement of heterochromatin for cohesion at centromeres. Science 2001, 294, 2539–2542. [Google Scholar] [CrossRef]
- Larson, A.G.; Elnatan, D.; Keenen, M.M.; Trnka, M.J.; Johnston, J.B.; Burlingame, A.L.; Agard, D.A.; Redding, S.; Narlikar, G.J. Liquid droplet formation by HP1α suggests a role for phase separation in heterochromatin. Nature 2017, 547, 236–240. [Google Scholar] [CrossRef]
- Larson, A.G.; Narlikar, G.J. The role of phase separation in heterochromatin formation, function, and regulation. Biochemistry 2018, 57, 2540–2548. [Google Scholar] [CrossRef]
- Gibson, B.A.; Doolittle, L.K.; Schneider, M.W.G.; Jensen, L.E.; Gamarra, N.; Henry, L.; Gerlich, D.W.; Redding, S.; Rosen, M.K. Organization of chromatin by intrinsic and regulated phase separation. Cell 2019, 179, 470–484.e21. [Google Scholar] [CrossRef]
- Qin, W.; Ugur, E.; Mulholland, C.B.; Bultmann, S.; Solovei, I.; Modic, M.; Smets, M.; Wierer, M.; Forné, I.; Imhof, A.; et al. Phosphorylation of the HP1β hinge region sequesters KAP1 in heterochromatin and promotes the exit from naïve pluripotency. Nucleic Acids Res. 2021, 49, 7406–7423. [Google Scholar] [CrossRef] [PubMed]
- Mayer, R.; Brero, A.; von Hase, J.; Schroeder, T.; Cremer, T.; Dietzel, S. Common themes and cell type specific variations of higher order chromatin arrangements in the mouse. BMC Cell Biol. 2005, 6, 44. [Google Scholar] [CrossRef] [PubMed]
- Schildkraut, C.L.; Maio, J.J. Studies on the intranuclear distribution and properties of mouse satellite DNA. Biochim. Et Biophys. Acta (BBA)-Nucleic Acids Protein Synth. 1968, 161, 76–93. [Google Scholar] [CrossRef]
- Rae, M.M.; Franke, W.W. The interphase distribution of satellite DNA-containing heterochromatin in mouse nuclei. Chromosoma 1972, 39, 443–456. [Google Scholar] [CrossRef]
- Kochanova, N.Y.; Schauer, T.; Mathias, G.P.; Lukacs, A.; Schmidt, A.; Flatley, A.; Schepers, A.; Thomae, A.W.; Imhof, A. A multi-layered structure of the interphase chromocenter revealed by proximity-based biotinylation. Nucleic Acids Res. 2020, 48, 4161–4178. [Google Scholar] [CrossRef] [PubMed]
- Ji, X.; Dadon, D.B.; Abraham, B.J.; Lee, T.I.; Jaenisch, R.; Bradner, J.E.; Young, R.A. Chromatin proteomic profiling reveals novel proteins associated with histone-marked genomic regions. Proc. Natl. Acad. Sci. USA 2015, 112, 3841–3846. [Google Scholar] [CrossRef]
- Durand-Dubief, M.; Persson, J.; Norman, U.; Hartsuiker, E.; Ekwall, K. Topoisomerase I regulates open chromatin and controls gene expression in vivo. EMBO J. 2010, 29, 2126–2134. [Google Scholar] [CrossRef]
- Sperling, A.S.; Jeong, K.S.; Kitada, T.; Grunstein, M. Topoisomerase II binds nucleosome-free DNA and acts redundantly with topoisomerase I to enhance recruitment of RNA Pol II in budding yeast. Proc. Natl. Acad. Sci. USA 2011, 108, 12693–12698. [Google Scholar] [CrossRef]
- Dinh, T.T.; Gao, L.; Liu, X.; Li, D.; Li, S.; Zhao, Y.; O’Leary, M.; Le, B.; Schmitz, R.J.; Manavella, P.A.; et al. DNA topoisomerase 1α promotes transcriptional silencing of transposable elements through DNA methylation and histone lysine 9 dimethylation in Arabidopsis. PLoS Genet. 2014, 10, e1004446. [Google Scholar] [CrossRef]
- Blattes, R.; Monod, C.; Susbielle, G.; Cuvier, O.; Wu, J.; Hsieh, T.; Laemmli, U.K.; Käs, E. Displacement of D1, HP1 and topoisomerase II from satellite heterochromatin by a specific polyamide. EMBO J. 2006, 25, 2397–2408. [Google Scholar] [CrossRef] [PubMed]
- Martire, S.; Banaszynski, L.A. The roles of histone variants in fine-tuning chromatin organization and function. Nat. Rev. Mol. Cell Biol. 2020, 21, 522–541. [Google Scholar] [CrossRef] [PubMed]
- Buschbeck, M.; Uribesalgo, I.; Wibowo, I.; Rué, P.; Martin, D.; Gutierrez, A.; Morey, L.; Guigó, R.; López-Schier, H.; Di Croce, L. The histone variant macroH2A is an epigenetic regulator of key developmental genes. Nat. Struct. Mol. Biol. 2009, 16, 1074–1079. [Google Scholar] [CrossRef] [PubMed]
- Kozlowski, M.; Corujo, D.; Hothorn, M.; Guberovic, I.; Mandemaker, I.K.; Blessing, C.; Sporn, J.; Gutierrez-Triana, A.; Smith, R.; Portmann, T.; et al. MacroH2A histone variants limit chromatin plasticity through two distinct mechanisms. EMBO Rep. 2018, 19, e44445. [Google Scholar] [CrossRef]
- Rogakou, E.P.; Pilch, D.R.; Orr, A.H.; Ivanova, V.S.; Bonner, W.M. DNA double-stranded breaks induce histone H2AX phosphorylation on serine 139. J. Biol. Chem. 1998, 273, 5858–5868. [Google Scholar] [CrossRef]
- Soldi, M.; Bonaldi, T. The proteomic investigation of chromatin functional domains reveals novel synergisms among distinct heterochromatin components. Mol. Cell. Proteom. 2013, 12, 764–780. [Google Scholar] [CrossRef]
- Bassing, C.H.; Chua, K.F.; Sekiguchi, J.; Suh, H.; Whitlow, S.R.; Fleming, J.C.; Monroe, B.C.; Ciccone, D.N.; Yan, C.; Vlasakova, K.; et al. Increased ionizing radiation sensitivity and genomic instability in the absence of histone H2AX. Proc. Natl. Acad. Sci. USA 2002, 99, 8173–8178. [Google Scholar] [CrossRef]
- Fernandez-Capetillo, O.; Mahadevaiah, S.K.; Celeste, A.; Romanienko, P.J.; Camerini-Otero, R.D.; Bonner, W.M.; Manova, K.; Burgoyne, P.; Nussenzweig, A. H2AX is required for chromatin remodeling and inactivation of sex chromosomes in male mouse meiosis. Dev. Cell 2003, 4, 497–508. [Google Scholar] [CrossRef]
- Goldberg, A.D.; Banaszynski, L.A.; Noh, K.-M.; Lewis, P.W.; Elsaesser, S.J.; Stadler, S.; Dewell, S.; Law, M.; Guo, X.; Li, X.; et al. Distinct factors control histone variant H3.3 localization at specific genomic regions. Cell 2010, 140, 678–691. [Google Scholar] [CrossRef]
- Lewis, P.W.; Elsaesser, S.J.; Noh, K.-M.; Stadler, S.C.; Allis, C.D. Daxx is an H3.3-specific histone chaperone and cooperates with ATRX in replication-independent chromatin assembly at telomeres. Proc. Natl. Acad. Sci. USA 2010, 107, 14075–14080. [Google Scholar] [CrossRef]
- Wong, L.H.; McGhie, J.D.; Sim, M.; Anderson, M.A.; Ahn, S.; Hannan, R.D.; George, A.J.; Morgan, K.A.; Mann, J.R.; Choo, K.H.A. ATRX interacts with H3.3 in maintaining telomere structural integrity in pluripotent embryonic stem cells. Genome Res. 2010, 20, 351–360. [Google Scholar] [CrossRef]
- Parseghian, M.H.; Newcomb, R.L.; Hamkalo, B.A. Distribution of somatic H1 subtypes is non-random on active vs. inactive chromatin II: Distribution in human adult fibroblasts. J. Cell. Biochem. 2001, 83, 643–659. [Google Scholar] [CrossRef]
- Fan, Y.; Nikitina, T.; Morin-Kensicki, E.M.; Zhao, J.; Magnuson, T.R.; Woodcock, C.L.; Skoultchi, A.I. H1 linker histones are essential for mouse development and affect nucleosome spacing in vivo. Mol. Cell. Biol. 2003, 23, 4559–4572. [Google Scholar] [CrossRef] [PubMed]
- Fan, Y.; Nikitina, T.; Zhao, J.; Fleury, T.J.; Bhattacharyya, R.; Bouhassira, E.E.; Stein, A.; Woodcock, C.L.; Skoultchi, A.I. Histone H1 depletion in mammals alters global chromatin structure but causes specific changes in gene regulation. Cell 2005, 123, 1199–1212. [Google Scholar] [CrossRef] [PubMed]
- Jones, P.L.; Veenstra, G.J.; Wade, P.A.; Vermaak, D.; Kass, S.U.; Landsberger, N.; Strouboulis, J.; Wolffe, A.P. Methylated DNA and MeCP2 recruit histone deacetylase to repress transcription. Nat. Genet. 1998, 19, 187–191. [Google Scholar] [CrossRef] [PubMed]
- Meehan, R.R.; Lewis, J.D.; Bird, A.P. Characterization of MeCP2, a vertebrate DNA binding protein with affinity for methylated DNA. Nucleic Acids Res. 1992, 20, 5085–5092. [Google Scholar] [CrossRef]
- Chahrour, M.; Jung, S.Y.; Shaw, C.; Zhou, X.; Wong, S.T.C.; Qin, J.; Zoghbi, H.Y. MeCP2, a key contributor to neurological disease, activates and represses transcription. Science 2008, 320, 1224–1229. [Google Scholar] [CrossRef]
- Nan, X.; Campoy, F.J.; Bird, A. MeCP2 is a transcriptional repressor with abundant binding sites in genomic chromatin. Cell 1997, 88, 471–481. [Google Scholar] [CrossRef]
- Schmidt, A.; Zhang, H.; Cardoso, M.C. MeCP2 and chromatin compartmentalization. Cells 2020, 9, 878. [Google Scholar] [CrossRef]
- Song, C.; Feodorova, Y.; Guy, J.; Peichl, L.; Jost, K.L.; Kimura, H.; Cardoso, M.C.; Bird, A.; Leonhardt, H.; Joffe, B.; et al. DNA methylation reader MECP2: Cell type- and differentiation stage-specific protein distribution. Epigenet. Chromatin 2014, 7, 17. [Google Scholar] [CrossRef]
- Shahbazian, M.D.; Antalffy, B.; Armstrong, D.L.; Zoghbi, H.Y. Insight into Rett syndrome: MeCP2 levels display tissue- and cell-specific differences and correlate with neuronal maturation. Hum. Mol. Genet. 2002, 11, 115–124. [Google Scholar] [CrossRef]
- Jung, B.P.; Jugloff, D.G.M.; Zhang, G.; Logan, R.; Brown, S.; Eubanks, J.H. The expression of methyl CpG binding factor MeCP2 correlates with cellular differentiation in the developing rat brain and in cultured cells. J. Neurobiol. 2003, 55, 86–96. [Google Scholar] [CrossRef]
- Agarwal, N.; Hardt, T.; Brero, A.; Nowak, D.; Rothbauer, U.; Becker, A.; Leonhardt, H.; Cardoso, M.C. MeCP2 interacts with HP1 and modulates its heterochromatin association during myogenic differentiation. Nucleic Acids Res. 2007, 35, 5402–5408. [Google Scholar] [CrossRef]
- McDowell, T.L.; Gibbons, R.J.; Sutherland, H.; O’Rourke, D.M.; Bickmore, W.A.; Pombo, A.; Turley, H.; Gatter, K.; Picketts, D.J.; Buckle, V.J.; et al. Localization of a putative transcriptional regulator (ATRX) at pericentromeric heterochromatin and the short arms of acrocentric chromosomes. Proc. Natl. Acad. Sci. USA 1999, 96, 13983–13988. [Google Scholar] [CrossRef]
- Clynes, D.; Higgs, D.R.; Gibbons, R.J. The chromatin remodeller ATRX: A repeat offender in human disease. Trends Biochem. Sci. 2013, 38, 461–466. [Google Scholar] [CrossRef]
- Kernohan, K.D.; Vernimmen, D.; Gloor, G.B.; Bérubé, N.G. Analysis of neonatal brain lacking ATRX or MeCP2 reveals changes in nucleosome density, CTCF binding and chromatin looping. Nucleic Acids Res. 2014, 42, 8356–8368. [Google Scholar] [CrossRef]
- Marano, D.; Fioriniello, S.; Fiorillo, F.; Gibbons, R.J.; D’Esposito, M.; Della Ragione, F. ATRX Contributes to MeCP2-Mediated Pericentric Heterochromatin Organization during Neural Differentiation. Int. J. Mol. Sci. 2019, 20, 5371. [Google Scholar] [CrossRef]
- Minc, E.; Allory, Y.; Worman, H.J.; Courvalin, J.C.; Buendia, B. Localization and phosphorylation of HP1 proteins during the cell cycle in mammalian cells. Chromosoma 1999, 108, 220–234. [Google Scholar] [CrossRef]
- Eberhart, A.; Feodorova, Y.; Song, C.; Wanner, G.; Kiseleva, E.; Furukawa, T.; Kimura, H.; Schotta, G.; Leonhardt, H.; Joffe, B.; et al. Epigenetics of eu- and heterochromatin in inverted and conventional nuclei from mouse retina. Chromosome Res. 2013, 21, 535–554. [Google Scholar] [CrossRef]
- Gilbert, N.; Boyle, S.; Sutherland, H.; de Las Heras, J.; Allan, J.; Jenuwein, T.; Bickmore, W.A. Formation of facultative heterochromatin in the absence of HP1. EMBO J. 2003, 22, 5540–5550. [Google Scholar] [CrossRef]


Disclaimer/Publisher’s Note: The statements, opinions and data contained in all publications are solely those of the individual author(s) and contributor(s) and not of MDPI and/or the editor(s). MDPI and/or the editor(s) disclaim responsibility for any injury to people or property resulting from any ideas, methods, instructions or products referred to in the content. |
© 2024 by the authors. Licensee MDPI, Basel, Switzerland. This article is an open access article distributed under the terms and conditions of the Creative Commons Attribution (CC BY) license (https://creativecommons.org/licenses/by/4.0/).
Share and Cite
Schmidt, A.; Zhang, H.; Schmitt, S.; Rausch, C.; Popp, O.; Chen, J.; Cmarko, D.; Butter, F.; Dittmar, G.; Lermyte, F.; et al. The Proteomic Composition and Organization of Constitutive Heterochromatin in Mouse Tissues. Cells 2024, 13, 139. https://doi.org/10.3390/cells13020139
Schmidt A, Zhang H, Schmitt S, Rausch C, Popp O, Chen J, Cmarko D, Butter F, Dittmar G, Lermyte F, et al. The Proteomic Composition and Organization of Constitutive Heterochromatin in Mouse Tissues. Cells. 2024; 13(2):139. https://doi.org/10.3390/cells13020139
Chicago/Turabian StyleSchmidt, Annika, Hui Zhang, Stephanie Schmitt, Cathia Rausch, Oliver Popp, Jiaxuan Chen, Dusan Cmarko, Falk Butter, Gunnar Dittmar, Frederik Lermyte, and et al. 2024. "The Proteomic Composition and Organization of Constitutive Heterochromatin in Mouse Tissues" Cells 13, no. 2: 139. https://doi.org/10.3390/cells13020139
APA StyleSchmidt, A., Zhang, H., Schmitt, S., Rausch, C., Popp, O., Chen, J., Cmarko, D., Butter, F., Dittmar, G., Lermyte, F., & Cardoso, M. C. (2024). The Proteomic Composition and Organization of Constitutive Heterochromatin in Mouse Tissues. Cells, 13(2), 139. https://doi.org/10.3390/cells13020139