Article

A High-Protein Diet Promotes Atrial Arrhythmogenesis via Absent-in-Melanoma 2 Inflammasome

1
Department of Medicine, Section of Cardiovascular Research, Baylor College of Medicine, Houston, TX 77030, USA
2
Department of Medicine, Section of Nephrology, Houston, TX 77030, USA
3
Department of Integrative Physiology, Baylor College of Medicine, Houston, TX 77030, USA
4
Department of Medicine, Section of Gastroenterology, Baylor College of Medicine, Houston, TX 77030, USA
5
Institute of Pharmacology, University Duisburg-Essen, 45147 Essen, Germany
6
Department of Medicine, Montreal Heart Institute, Université de Montréal, Montréal, QC H1T 1C8, Canada
7
Michael E. Debakey VA Medical Center, Houston, TX 77030, USA
*
Author to whom correspondence should be addressed.
Cells 2024, 13(2), 108; https://doi.org/10.3390/cells13020108
Submission received: 17 December 2023 / Revised: 29 December 2023 / Accepted: 3 January 2024 / Published: 5 January 2024
(This article belongs to the Special Issue Mechanisms Driving Electropathology in Cardiac Arrhythmias)

Abstract

:
High-protein diets (HPDs) offer health benefits, such as weight management and improved metabolic profiles. The effects of HPD on cardiac arrhythmogenesis remain unclear. Atrial fibrillation (AF), the most common arrhythmia, is associated with inflammasome activation. The role of the Absent-in-Melanoma 2 (AIM2) inflammasome in AF pathogenesis remains unexplored. In this study, we discovered that HPD increased susceptibility to AF. To demonstrate the involvement of AIM2 signaling in the pathogenesis of HPD-induced AF, wildtype (WT) and Aim2−/− mice were fed normal-chow (NC) and HPD, respectively. Four weeks later, inflammasome activity was upregulated in the atria of WT-HPD mice, but not in the Aim2−/−-HPD mice. The increased AF vulnerability in WT-HPD mice was associated with abnormal sarcoplasmic reticulum (SR) Ca2+-release events in atrial myocytes. HPD increased the cytoplasmic double-strand (ds) DNA level, causing AIM2 activation. Genetic inhibition of AIM2 in Aim2−/− mice reduced susceptibility to AF, cytoplasmic dsDNA level, mitochondrial ROS production, and abnormal SR Ca2+-release in atrial myocytes. These data suggest that HPD creates a substrate conducive to AF development by activating the AIM2-inflammasome, which is associated with mitochondrial oxidative stress along with proarrhythmic SR Ca2+-release. Our data imply that targeting the AIM2 inflammasome might constitute a novel anti-AF strategy in certain patient subpopulations.

Graphical Abstract

1. Introduction

Atrial fibrillation (AF) is the most common tachyarrhythmia observed in the clinic. AF can be promoted by ectopic firing and maintained by a reentrant substrate [1,2,3]. Despite considerable advancements in AF treatment and management, the recurrence and persistence of AF remain a clinical challenge for many patients [4,5,6]. The overall incidence and prevalence of AF is increasing globally [7]. Recently, AF prevention by targeting modifiable risk factors has shown promising therapeutic potential [8]. A high-protein diet (HPD) has been advocated for decades as a means of weight loss and preventing obesity-related metabolic derangements [9]. While HPD provides certain metabolic advantages, such as improved insulin sensitivity and reduced fatty liver disease, recent studies have uncovered that dietary protein may contribute to atherosclerosis and lesion complexity, and elevate the risk of chronic kidney disease [10,11,12]. It has been suggested that HPD may further the progression of coronary artery disease by increasing lipid deposition and inflammation, both of which are associated with AF development [13]. The direct link between HPD and AF pathogenesis has not been previously investigated and was the primary objective of this study.
The role of innate inflammatory signaling in AF pathogenesis has been recognized in recent years [13]. We have previously shown that activation of the ‘NLR family pyrin domain containing 3′ (NLRP3) inflammasome signaling enhances atrial arrhythmogenesis in various contexts, such as obesity, post-surgical procedures, and chronic kidney disease [14,15,16]. Although various inflammasome signaling pathways have been identified in innate immune cells, the potential role of the Absent-in-Melanoma 2 (AIM2) inflammasome in atrial arrhythmogenesis has not yet been investigated. AIM2 is a cytoplasmic sensor that can be activated by double-stranded DNA (dsDNA) originating from foreign pathogens or damaged cellular organelles, such as mitochondrial DNA (mtDNA) [17,18,19]. Upon sensing, AIM2 recruits ‘apoptosis-associated speck-like protein containing a CARD’ (ASC) and pro-caspase-1 to form the AIM2 inflammasome, subsequently promoting caspase-1 autocleavage and eliciting inflammatory responses via cytokine maturation [20,21]. Emerging evidence reveals that activation of the AIM2 inflammasome is involved in the development of cardiovascular diseases, such as atherosclerosis, myocardial infarction, aortic aneurysm, and heart failure [22,23,24]. It has been reported that AIM2 inflammasome activation contributes to chronic inflammation in heart failure, with necrotic DNA potentially serving as a major trigger for AIM2 inflammasome activation in vivo [23]. In this study, our findings demonstrate that HPD can activate the AIM2 inflammasome through altered mitochondrial function, thereby enhancing atrial arrhythmogenesis.

2. Materials and Methods

2.1. Animal Studies

Animal studies were performed according to the protocols approved by the Institutional Animal Care and Use Committee of Baylor College of Medicine and conformed to the Guide for the Care and Use of Laboratory Animals published by the US National Institutes of Health (NIH Publication No. 85-23, revised 1996). Whole-body Aim2 gene-trap mice (Aim2−/−) [25] were purchased from the Jackson Laboratory (Strain #013144, Bar Harbor, ME, USA) and have been backcrossed with C57BL/6J mice more than six times, ensuring that both the wildtype (WT) and Aim2−/− mice were on the same genetic background. Apart from the genotyping protocol, the loss of Aim2 transcripts in the atria of Aim2−/− mice was also confirmed with reverse-transcription (RT)-PCR using atrial RNA samples (Supplementary Figure S1). The primer sequences were as follows (5′ > 3′): Aim2—forward CACACTCGACGTGGCAGATAGGAC, reverse CAGCACCGTGACAACAAGTGG; Rpl7—forward ATCATCTGCATGGAGGATCTAAT, reverse TCATCCGTCTAATAAGCCTGTTT. Six-to-eight-week-old wildtype (WT) and Aim2−/− mice were subjected to either normal chow (NC) or HPD (40% protein diet, ENVIGO Company, Indianapolis, IN, USA), respectively, for 4 weeks before in vivo and ex vivo studies. NC was composed of 21% kcal protein, 64% kcal carbohydrate, and 15% kcal fat, whereas HPD was composed of 42% kcal protein, 44% kcal carbohydrate, and 13.1% kcal fat. Each group included an approximately equal number of male and female mice.

2.2. Serum Creatinine

Creatinine levels in sera were measured with the Creatinine (serum) Colorimetric Assay kit (Cayman Chemicals, Ann Arbor, MI, USA, 7000460). Briefly, 15 µL of sera sample was loaded into duplicate wells, followed by adding the Creatinine Reaction buffer and Creatinine (serum) Color Reagent. Absorbance at 490–500 nm was measured immediately after the Color Reagent buffer was added and repeated 7 min later.

2.3. Glucose and Insulin Tolerance Tests

Glucose (1.5 g/kg body mass, i.p.) and insulin (1.0 unit/kg body mass, i.p.) tolerance tests (GTT, ITT) were conducted to determine blood glucose clearance and insulin response, respectively. Mice underwent a 16 or 4 h fasting period, respectively, prior to GTT or ITT. For GTT, glucose was intraperitoneally injected, and tail vein blood was collected at 0, 30, 60, 90, and 120 min intervals to assess blood glucose concentration. For ITT, insulin was intraperitoneally injected, and tail vein blood was collected at 0, 15, 30, 60, and 90 min intervals to measure blood glucose concentration.

2.4. Western Blotting

Western blots were prepared using the Bio-Rad Mini Trans-Blot® system. Briefly, protein from homogenized atrial tissue (60 µg) was separated on an acrylamide gel before transfer to Immobilon®-FL Transfer membrane (PVDF) (Millipore, Burlington, MA, USA, IPFL00010). The PVDF membrane was blocked with Intercept Blocking Buffer (Li-COR Biosciences, Lincoln, NE, USA, 927-60001) before being probed with antibodies. The primary antibodies included ASC (1:1000, Cell Signaling Technology, Danvers, MA, USA, 2118), Caspase-1 (1:1000, Biovision, Milpitas, CA, USA, #3019-100), IL-1β (1:1000, Abcam, Waltham, MA, USA, ab9722), CD68 (1:1000, Abcam, Waltham, MA, USA, ab201973), F4/80 (D2S9R) (1:1000, Cell Signaling Technology, Danvers, MA, USA, 70076), GAPDH Rabbit mAb (1:1000, Cell Signaling Technology, Danvers, MA, USA, 5174), and GAPDH Mouse mAb (1:1000, Cell Signaling Technology, Danvers, MA, USA, 97166). The primary antibody was added to the membrane and incubated overnight at 4 °C. After washing three times with TBST, the secondary antibodies were added according to the species of the primary antibodies, including goat anti-mouse IgG (H+L) Alexa Fluor™ Plus 800 (1:10,000, Invitrogen, Waltham, MA, USA, A32730); goat anti-rabbit IgG (H+L) Alexa Fluor™ Plus 680 (1:10,000, Invitrogen, Waltham, MA, USA, A32734); goat anti-mouse IgG (H+L) Alexa Fluor™ Plus 680 (1:10,000, Invitrogen, Waltham, MA, USA, A32729); and goat anti-rabbit IgG (H+L) Alexa Fluor™ Plus 800 (1:10,000, Invitrogen, Waltham, MA, USA, A32735). The Odyssey system (Li-COR Biosciences, Lincoln, NE, USA, Serial NO.380) was used to develop the blots. The Image J (Version 1.53a) densitometry function was used to analyze the resulting bands.

2.5. Circulating Cytokines and Biomarkers

Serum was collected from WT and Aim2−/− mice after 4 weeks of NC or HPD treatment, respectively. IL-1β and IL-18 levels were determined according to the instructions provided by the ELISA kits (Mouse IL-1β/IL-1F2 Quantikine ELISA Kit, R&D Systems, Minneapolis, MN, USA, MLB00C; Mouse IL-18 ELISA kit, Medical & Biological Laboratories, Naka-Ku, Nagoya, Japan, CODE No.7625).

2.6. In Vivo Electrophysiology Studies

Programmed electrical stimulation (PES) was performed to determine cardiac electrophysiological differences among treatment groups using the previously published protocols [14,16,26,27]. Briefly, mice were anesthetized with a 1.5% isoflurane/oxygen mixture. A 1.1F octapolar catheter (EPR-800, Millar Instruments, Houston, TX, USA) was inserted into the heart through the right jugular vein. The iWorx Data Acquisition System (iWorx System, Dover, NH, USA, iWorx-Bio8) was used to record surface ECG and intracardiac electrograms, and bipolar pacing was performed to assess sinus node recovery time (SNRT), atrial effective refractory period (AERP), and atrioventricular node effective refractory period (AVNERP). The inducibility of AF was determined using an overdriving pacing protocol to induce AF. Mice underwent the same atrial pacing protocol 3 times, and only mice in which AF (≥1 s) could be induced in at least 2 out of 3 attempts were considered AF-positive. The incidence of inducible AF was calculated as the percentage of the AF-positive mice divided by the total number of mice studied. For quantification of AF duration, we capped the duration at 5 min for any episodes longer than 5 min.

2.7. Echocardiography

Systolic cardiac function was assessed by echocardiography using VisualSonics Vevo F2 Ultrasound (FujiFilm VisualSonics, Toronto, ON, Canada) as described previously [14,16,26]. Briefly, mice were anesthetized using 1.5–2% isoflurane mixed with 100% O2 and placed on a heated platform, with their four limbs taped to ECG electrodes. Body temperature was monitored via a rectal temperature probe and maintained at 37 °C. Left ventricular (LV) function and structure were assessed using M-mode images acquired from the parasternal short-axis views at mid-papillary level. The left atrium (LA) area was measured using B-mode images from the parasternal long-axis views.

2.8. Histology

A whole heart was harvested from the mouse, perfused with 4% KCL, fixed in 10% buffered formalin for 24–48 h, and embedded in paraffin wax. Masson trichrome staining was performed on 6 μm sections. Images were acquired using a Zeiss microscope, and the percentage of fibrosis was quantified using Image J (Version 1.53a).

2.9. Calcium Imaging

Atrial myocytes were isolated as described [14,16,26,27]. Mouse hearts, harvested during anesthesia, were cannulated and perfused in Langendorff mode with Ca2+-free Tyrode solution for 1–3 min at 37 °C, followed by 0.022 mg/mL Liberase (TH Research Grade, Sigma-Aldrich, St. Louis, MO, USA, 5401151001) in Ca2+-free Tyrode at 37 °C until digestion was complete. Typically, the digestion process took between 25–30 min, depending on the flow rate of the efflux buffer. After digestion, the heart was perfused with 5 mL of KB solution containing KCl (90 mmol/L), K2HPO4 (30 mmol/L), MgSO4 (5 mmol/L), pyruvic acid (5 mmol/L), β-hydroxybutyric acid (5 mmol/L), creatine (5 mmol/L), taurine (20 mmol/L), glucose (10 mmol/L), EGTA (0.5 mmol/L), and HEPES (5 mmol/L), adjusted to pH 7.2. The atria were dissected, minced in KB solution, and filtered through a 210 μm polyethylene mesh. The cells were stored in KB solution at room temperature and then incubated with Cal-520 (4 μM) for 30 min at room temperature prior to imaging in normal Tyrode’s solution containing 1.8 mmol/L Ca2+. Confocal (LSM 510, Carl Zeiss, Oberkochen, Germany) fluorescence images were recorded in line-scan mode. To minimize the impact of EGTA and high extracellular K+ on Ca2+ dynamics, the extracellular KB buffer was replaced with a normal Tyrode solution before adding the cells to the recording chamber. Afterward, the cells were also perfused with normal Tyrode solution both before and during Ca2+ imaging. Atrial myocytes that faithfully follow the field stimulation during acclimation are chosen for recording. Once steady-state Ca2+ transients were observed during 1 Hz pacing (10 V), pacing was stopped, and Ca2+ sparks were counted using SparkMaster. To assess the sarcoplasmic reticulum (SR) Ca2+ load, caffeine (1 mmol/L) was applied.

2.10. Real-Time PCR (qPCR)

RNA was extracted from atrial tissue using the Trizol reagent (Invitrogen, Waltham, MA, USA). For the reverse transcription process, a total of 1 μg of RNA was used in a final reaction volume of 20 μL, which included 4 μL of iScript Reverse Transcription Supermix (Bio-Rad, Hercules, CA, USA, 1708841). Following reverse transcription, the cDNA was diluted threefold. PCR was conducted in triplicate through 40 cycles, using 1 μL of the cDNA volume in a total 20 μL reaction mixture containing 10 μL of PowerUP SYBR Green Master Mix (Thermo Fisher, Waltham, MA, USA, A25742). Real-time PCR analysis for mRNA quantification was performed on the QuantStudio5 system (Thermo Fisher, Waltham, MA, USA). The thermocycler conditions comprised 40 cycles, including denaturation at 95 °C for 15 s and an annealing/extension step at 60 °C for 60 s. The ΔCT method was used to quantify all relative mRNA levels, with Rpl7 as the reference and internal standard. The primer sequences were as follows (5′ > 3′): Rpl7—forward ATCATCTGCATGGAGGATCTAAT, reverse TCATCCGTCTAATAAGCCTGTTT; Nppa—forward CACAGATCTGATGGATTTCAAGA, reverse CCTCATCTTCTACCGGCATC; Myh6—forward TGCTGAGGGAACAGTATGAA, reverse TCTGTATGGCATCCGTCTC; Myh7—forward ACAGAGGAAGACAGGAAGAACC, reverse GCTTGTTGACCTGGGACTC.

2.11. Immunofluorescence Staining to Detect Cytosolic DNA

Hearts were embedded in paraffin following a standard protocol and sectioned to a thickness of 6 μm. After deparaffinization, heat-induced epitope retrieval was performed using a pressure cooker. Nonspecific staining was minimized by blocking with 10% donkey serum. The sections were then incubated with primary antibodies overnight at 4 °C, washed with PBS, and subsequently incubated with secondary antibodies. The primary antibodies used include anti-TOMM20 (1:200, Abcam, Waltham, MA, USA, ab-78547) and anti-dsDNA (1:200, Abcam, Waltham, MA, USA, ab-27156). The secondary antibodies used are Alexa Fluor™ 568 donkey anti-mouse IgG (H+L) (1:200, Invitrogen, Waltham, MA, USA, A10037) and Alexa Fluor™ 488 donkey anti-rabbit IgG (H+L) (1:200, Invitrogen, Waltham, MA, USA, A32790). Nuclei were counterstained with 4′,6-diamidino-2-phenylindole (DAPI). As negative controls, slides of sections were also incubated with secondary antibodies alone. Tissue sections were examined using a confocal microscope (LSM 510, Carl Zeiss, Oberkochen, Germany).

2.12. Cytoplasmic Fractionation to Detect Cytosolic DNA

Following atrial myocyte isolation as described above, a single-cell suspension was resuspended in 1 mL of PBS and transferred to a 1.5 mL Eppendorf tube. After a brief spin in the centrifugation, the supernatant was removed. Five hundred microliters of hypotonic lysis buffer (20 mM HEPES, 10 mM KCL, 2 mM MgCl2, 1 mM EDTA, 1 mM EGTA, 1 mM DTT, and protease inhibitors) was added to the tube, then incubated on ice for 15 min with occasional vortexing. Fifteen minutes later, cells in the tube were sheared through a 23 g needle with a 1 mL syringe and then incubated for an additional 15 min on ice. The tube was subsequently centrifuged, and the supernatant was transferred to a new tube. The pellet, containing nuclei and cell debris, was discarded. The supernatant, which contained cytosolic DNA and mitochondria, was transferred to a new tube. The tube was then centrifuged at 4 °C, 15 min, and 15,000× g to remove mitochondria. The clarified supernatant (containing cytosolic DNA) was transferred to a new tube. dsDNA was directly quantified by the Qubit dsDNA High Sensitivity Assay (Thermo Fisher, Waltham, MA, USA, Q33232) following the manufacturer’s instructions. Protein concentration was determined using the BCA Assay. The final data was calculated as cytoplasmic DNA normalized to protein concentration.

2.13. Reactive Oxygen Species (ROS) Detection

Atrial myocytes were isolated as described above. Atrial myocytes are stained with MitoSOX™ Mitochondrial Superoxide Indicators (Invitrogen, Waltham, MA, USA, M36008) following the instruction. The presence of ROS was detected using a confocal microscope (LSM 510, Carl Zeiss, Oberkochen, Germany).

2.14. Statistical Analysis

Numerical data were presented as the mean ± SEM. Statistical analyses were performed using GraphPad Prism 9.0. Normality was assessed using the Kolmogorov–Smirnov test. A Student’s t-test was used to compare data between two groups maintaining normal distributions. The Mann–Whitney test was used for data where normality cannot be assumed. ANOVA followed by Sidak’s or Dunnett’s T3 test was used for multiple comparisons. The Kruskal–Wallis test, followed by the Dunn test, was used for multiple comparisons of nonparametric data. Fisher’s exact test was used to compare categorical data. A nested one-way ANOVA followed by Sidak’s test was used for data from biological replicates with repeated measurements. A p-value of <0.05 was considered statistically significant.

3. Results

3.1. HPD Displayed Mild Beneficial Effects on Body Weight and Glucose Tolerance

Previously, we showed that NLRP3 inflammasome activation in atrial tissue is involved in AF pathogenesis and mediates atrial arrhythmogenesis in the context of obesity or chronic kidney disease [14,16,27]. To determine the impact of HPD on atrial arrhythmogenesis and whether the NLRP3 inflammasome plays a role, we first subjected WT and Nlrp3−/− to NC and HPD, respectively, for 4 weeks. Interestingly, HPD enhanced AF inducibility in WT mice, but genetic ablation of NLRP3 did not prevent HPD-induced AF susceptibility (Supplementary Figure S2). As other inflammasome pathways have not been studied in the context of AF previously, we investigated whether the AIM2 inflammasome could be involved in HPD-induced atrial arrhythmogenesis. For this, we subjected age-matched WT and Aim2−/− mice to NC or HPD, respectively, for 4 weeks (Figure 1A). At 6 weeks of age, there was no difference in body weight (BW) between WT and Aim2−/− mice. After the first week of HPD feeding, both WT and Aim2−/− mice gained less BW compared to their NC-fed controls (WT-NC vs. WT-HPD, p < 0.05; Aim2−/−-NC vs. Aim2−/−-HPD, p = 0.051, Figure 1B). However, the differences in BW gain disappeared during the following 3 weeks of feeding. Given that HPD may lead to a higher level of urea and other nitrogenous waste products [28], we assessed the kidney function after 4 weeks of feeding by measuring the blood urea nitrogen levels (BUN) [29,30] and serum creatinine levels in the four groups of mice. We found significantly higher BUN levels in WT-HPD mice than in WT-NC mice (p < 0.001, Figure 1C). Interestingly, BUN levels were reduced in Aim2−/−-HPD mice compared to WT-HPD mice (p < 0.001, Figure 1C). Despite these changes in BUN levels, all four groups of mice displayed similar serum creatinine levels (Figure 1D), indicating that kidney function was not affected by 4 weeks of HPD. To determine whether HPD or AIM2 deficiency altered glucose metabolism, we performed GTT and ITT after 4 weeks of feeding. For GTT, both WT-HPD and Aim2−/−-HPD mice showed a mild reduction in glucose levels at the 0 and 30 min sampling points compared to their respective NC-fed controls, although the area under the curve (AUC) was comparable among the four groups (Figure 1E, Supplementary Figure S3A,C). For ITT, HPD-fed Aim2−/− mice had a slightly better response to insulin challenge compared to the NC-fed Aim2−/− mice. The AUC of ITT was also comparable among the four groups (Figure 1F, Supplementary Figure S3B,D). In line with previous reports [31], these results suggest that one month of HPD feeding can slightly improve glucose tolerance, and AIM2 inhibition may have a mild effect on glucose homeostasis in mice.

3.2. AIM2 Inhibition Reduced the HPD-Induced Inflammasome Activity

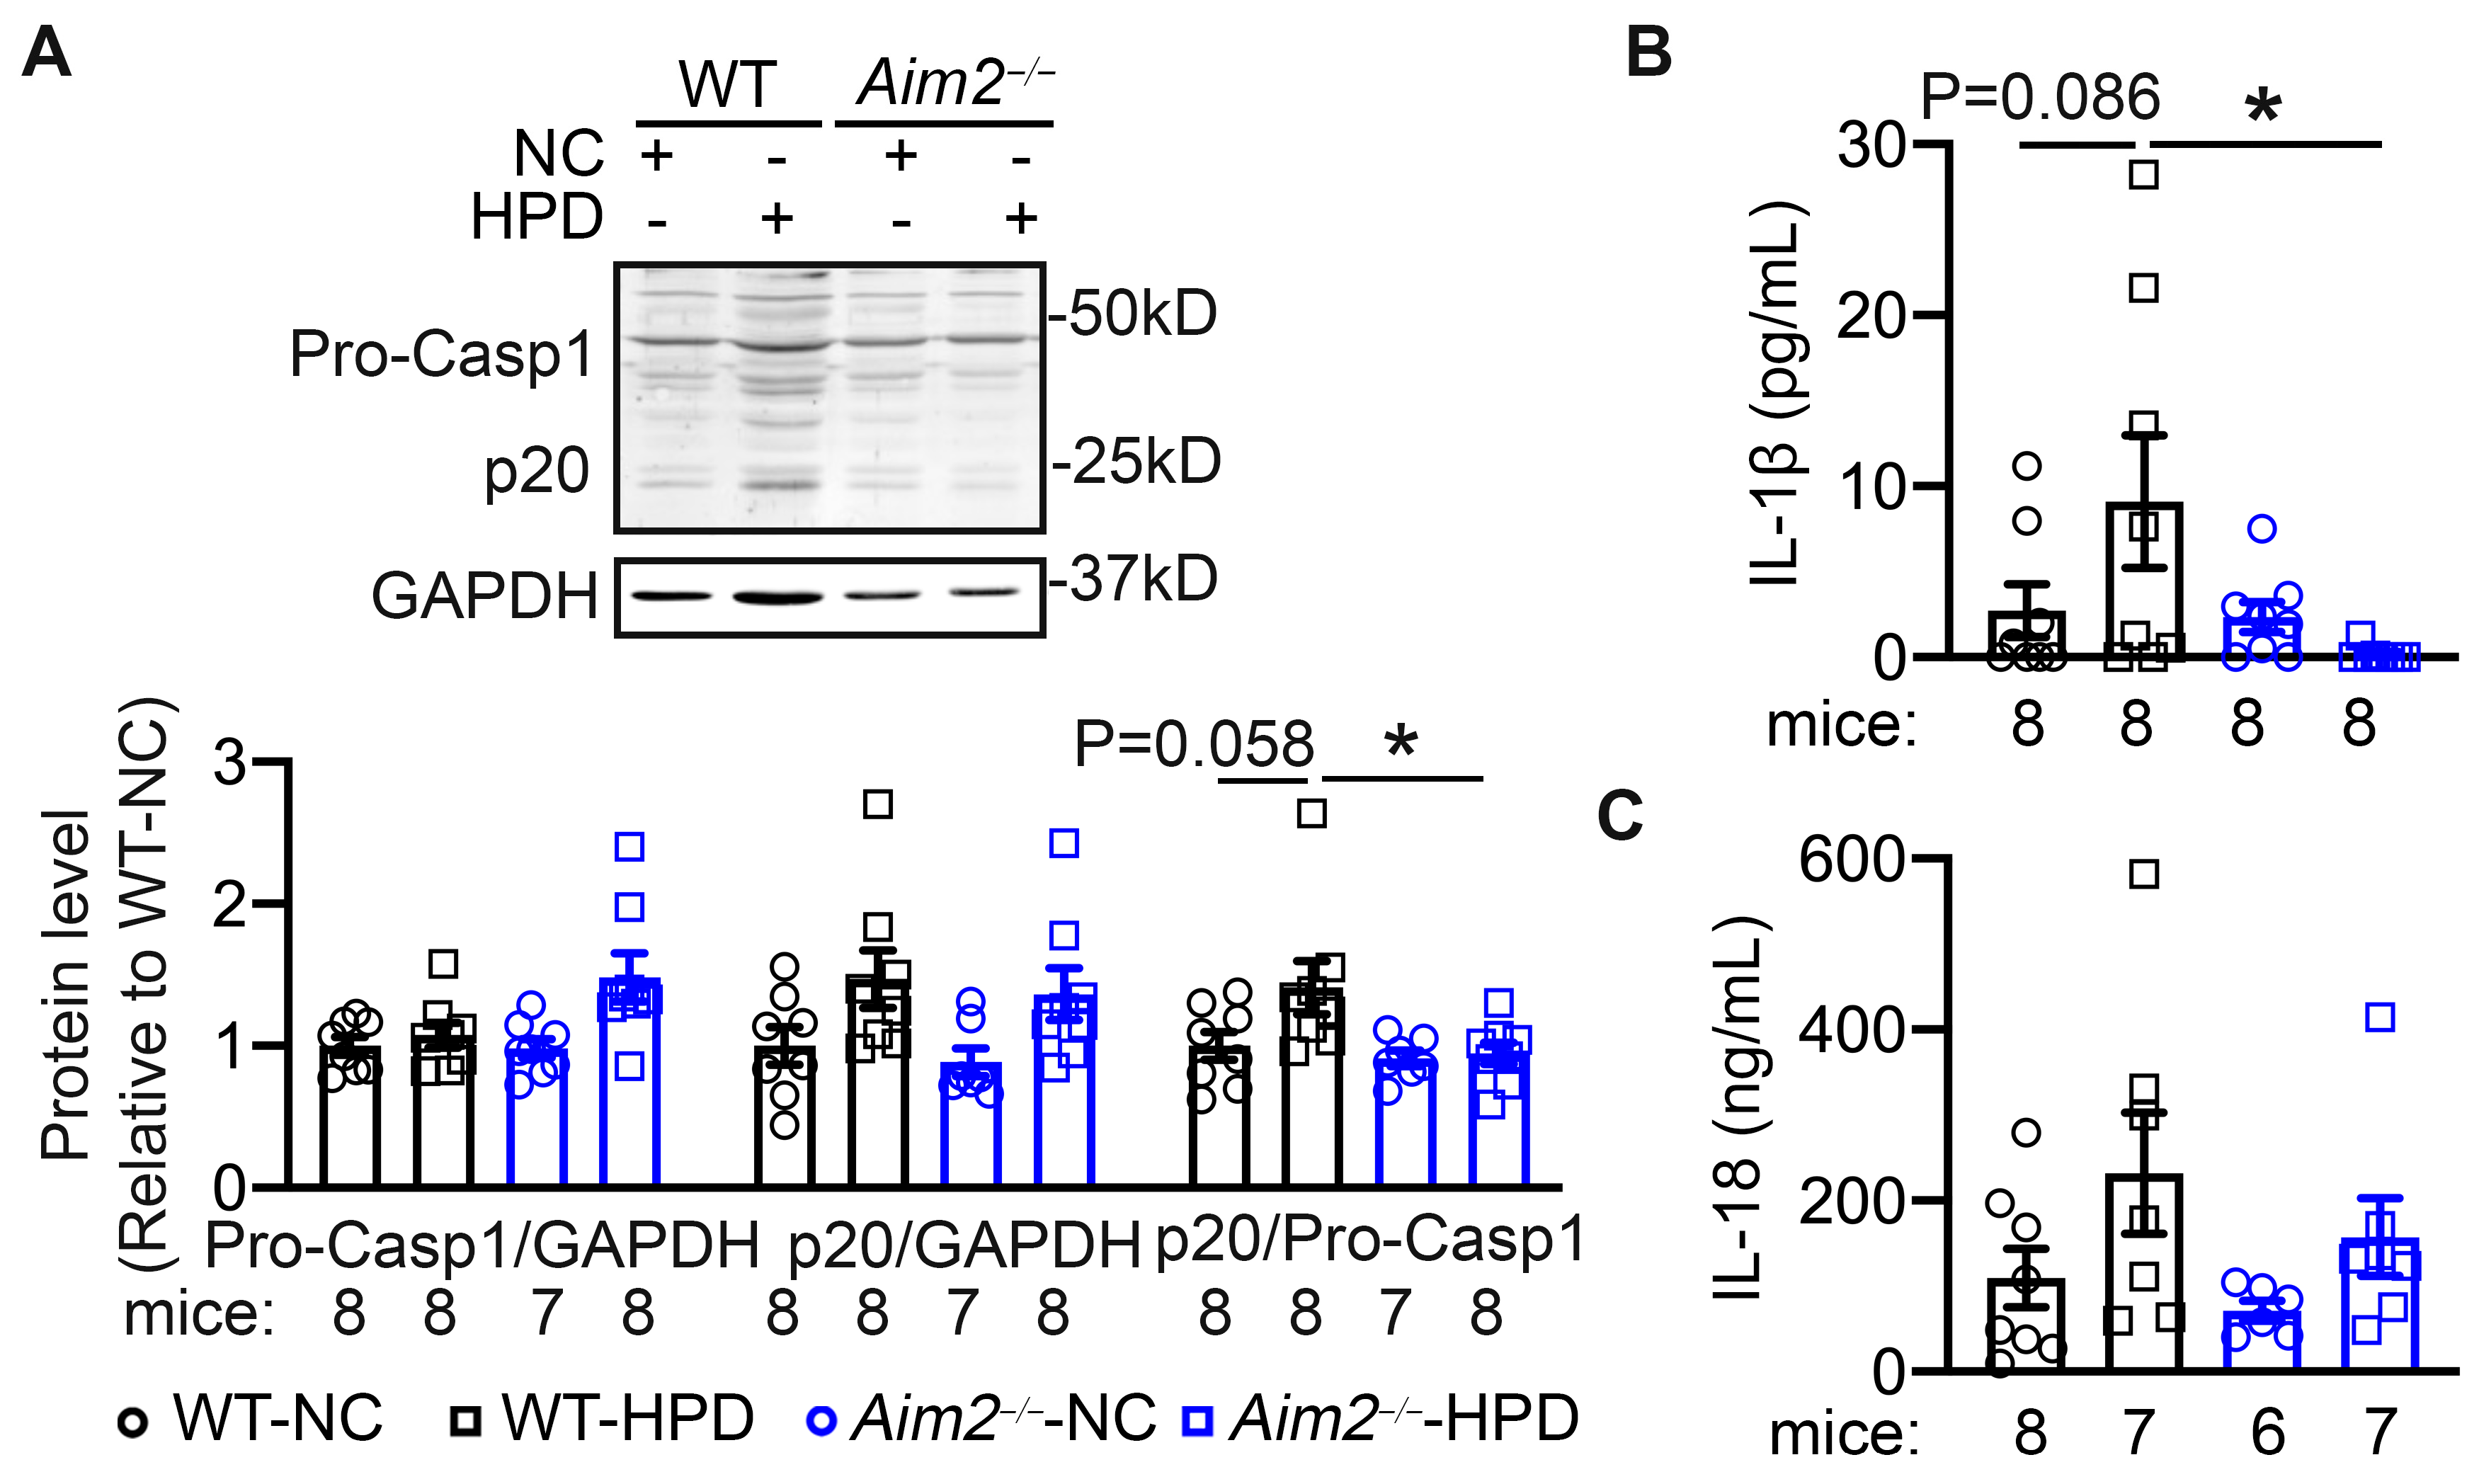
To determine whether HPD activates the AIM2 inflammasome in mouse atria, Western blots were performed with atrial tissue of WT-NC, WT-HPD, Aim2−/−-NC, and Aim2−/−-HPD mice. We found that, while the protein levels of precursor caspase-1 were unchanged between WT-NC and WT-HPD mice, the levels of cleaved caspase-1 (p20) were upregulated in WT-HPD compared to WT-NC mouse atria (Figure 2A). Consistently, the serum levels of IL-1β and IL-18 cytokines showed a trend to be higher in WT-HPD mice than in WT-NC mice (Figure 2B,C), revealing a low-degree and subclinical inflammation status. Genetic inhibition of AIM2 attenuated the increases in protein levels of p20 and the circulating levels of IL-1β and IL-18 cytokines in Aim2−/−-HPD mice (Figure 2A–C). These results suggest that HPD enhances the atrial inflammatory response, which was prevented by the genetic inhibition of AIM2.

3.3. AIM2 Inhibition Reduced the Susceptibility to HPD-Induced AF

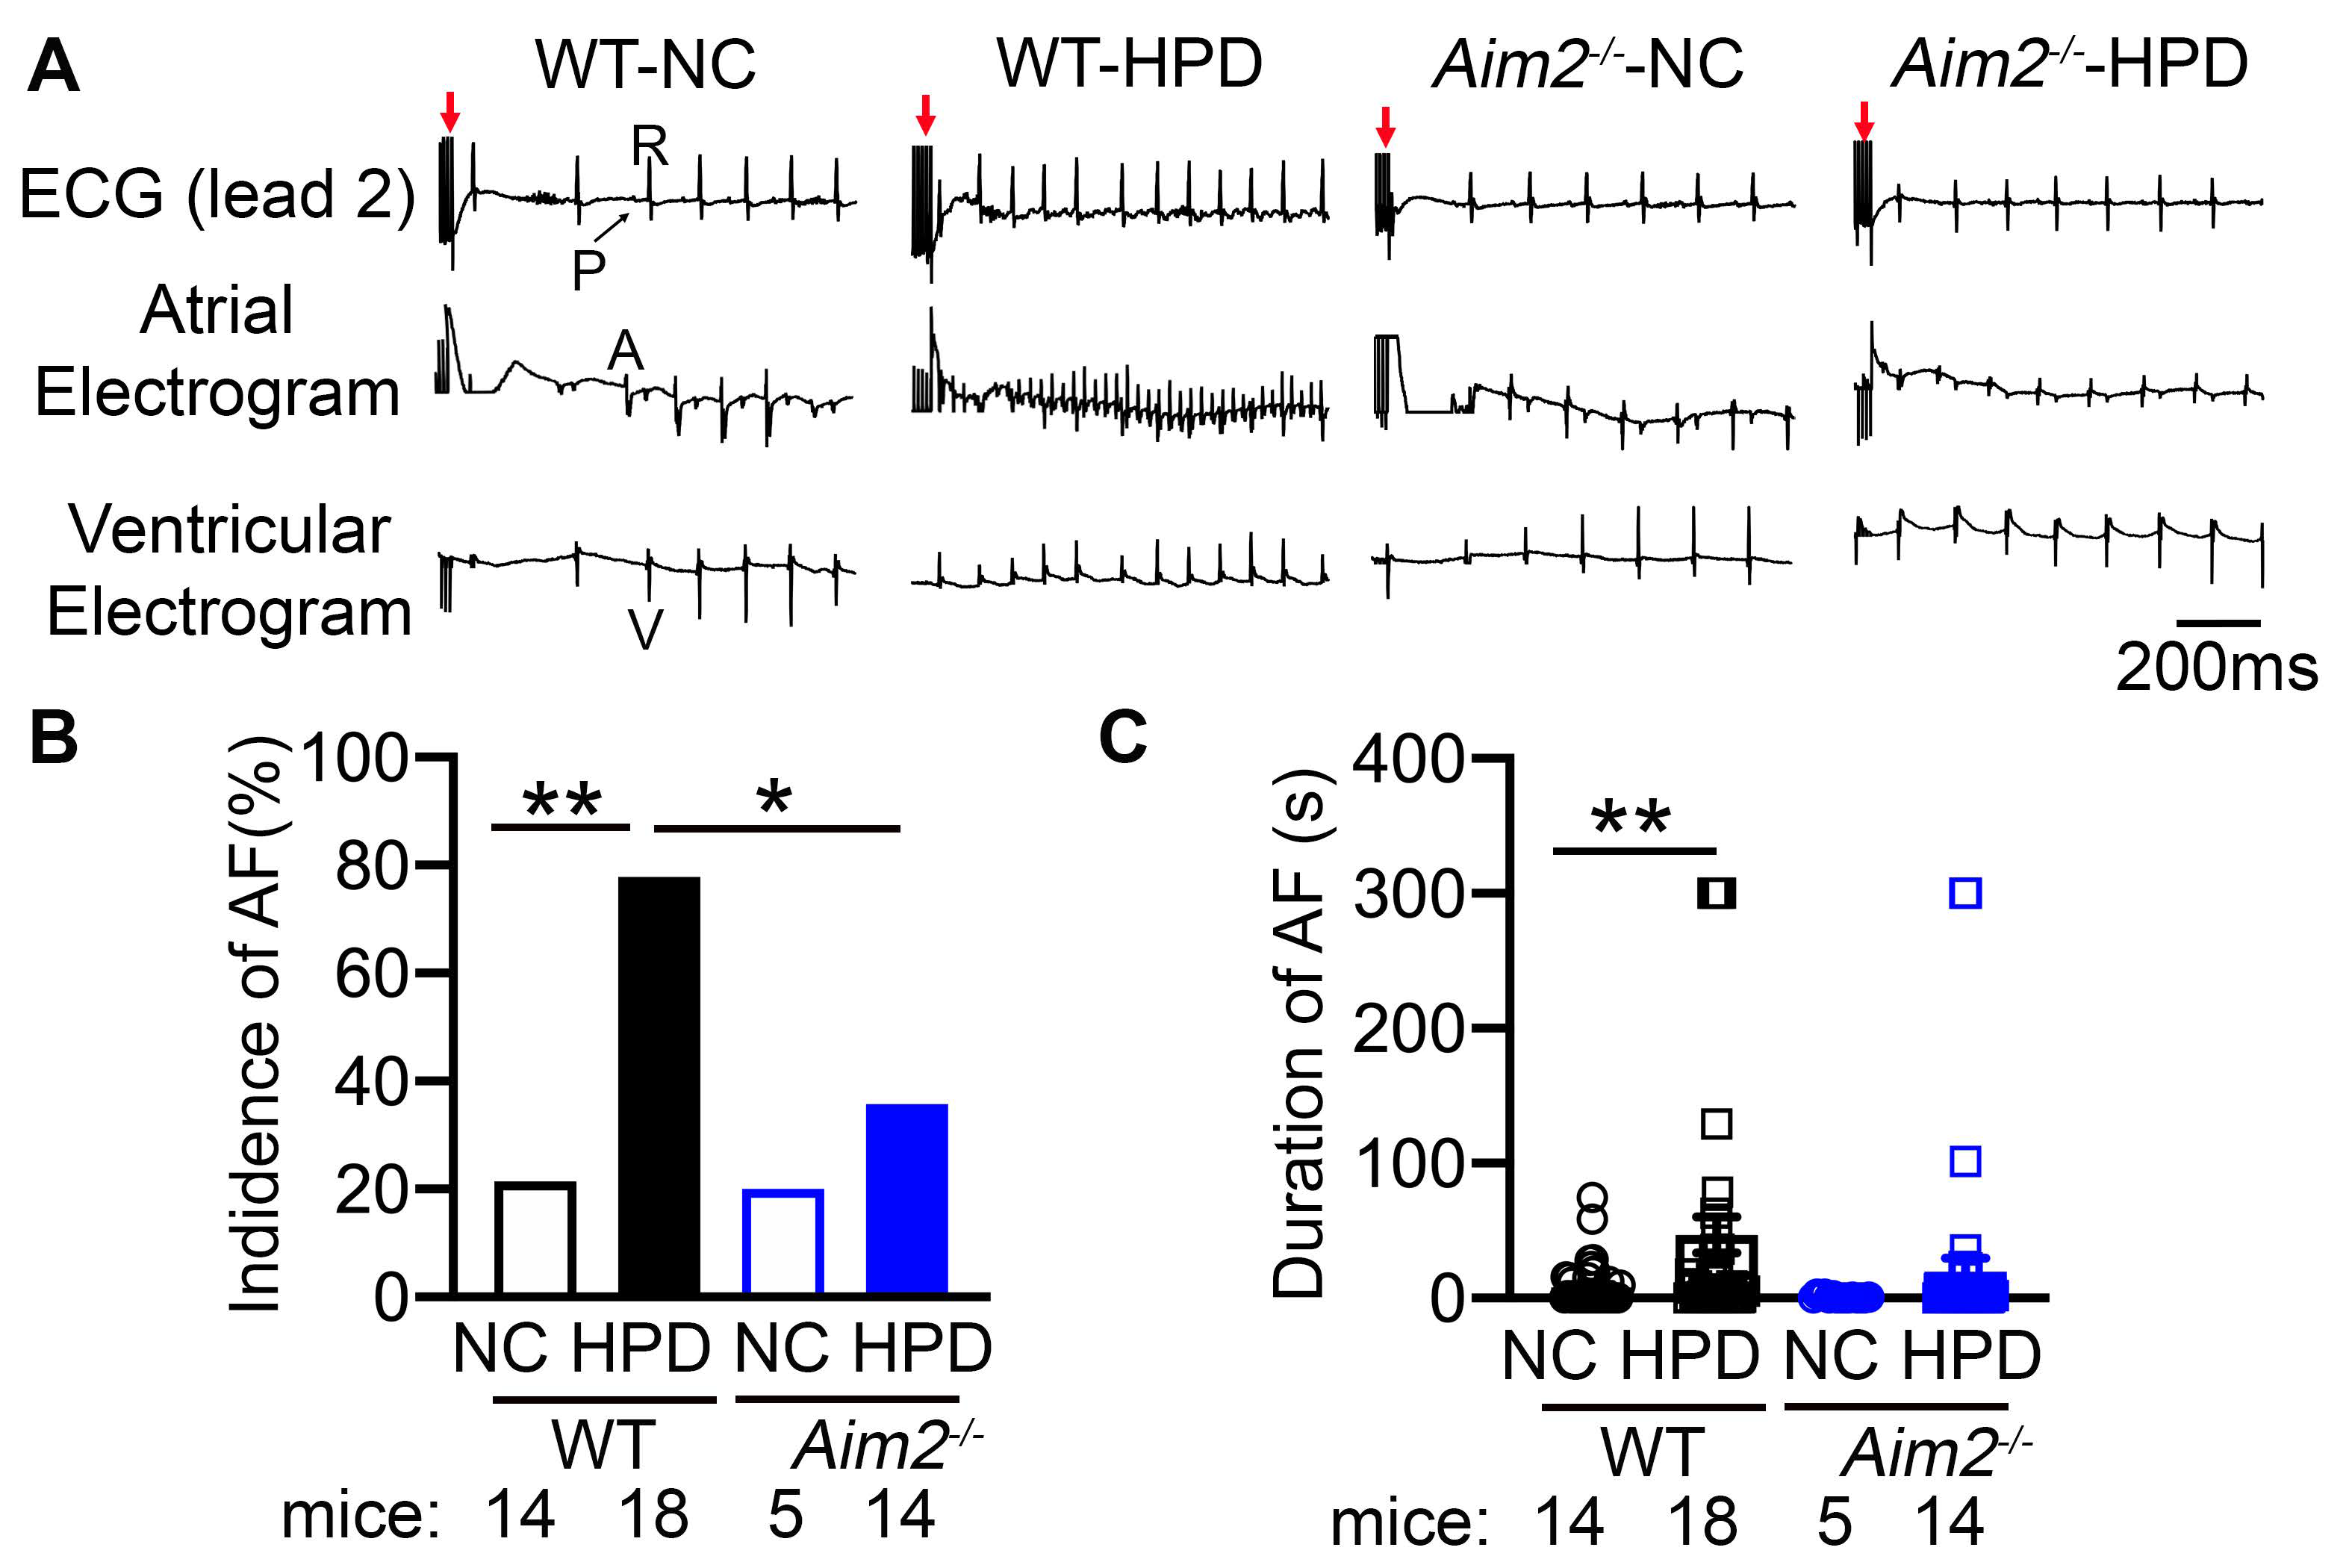
To determine whether HPD affects cardiac electrophysiology, we measured ECG parameters in four groups of mice after 4 weeks of feeding. PQ-, QRS-, and QTc-intervals, SNRT, and AERP parameters were all comparable among the four groups of mice, while only AVNERP was reduced in the WT-HPD group compared to the WT-NC group (Supplementary Table S1). To determine the impact of HPD on arrhythmogenesis, we performed PES to induce AF. Rapid atrial pacing induced AF in 77.8% of WT-HPD mice, whereas only 21.4% of WT-NC mice developed the pacing-induced AF (p < 0.01, Figure 3A,B). The average duration of all AF episodes was longer in WT-HPD mice than in WT-NC mice (p < 0.01, Figure 3C). Conversely, inhibition of AIM2 reduced the incidence and duration of AF in Aim2−/−-HPD (p < 0.05 vs. WT-HPD, Figure 3A,B). Importantly, there was no pacing-induced ventricular tachycardia in all groups of mice. These data suggest that HPD promotes the evolution of an arrhythmogenic substrate for AF, which requires the activation of the AIM2 inflammasome pathway.

3.4. HPD Promoted AF Independently from Structural Remodeling and Fibrosis in Atria

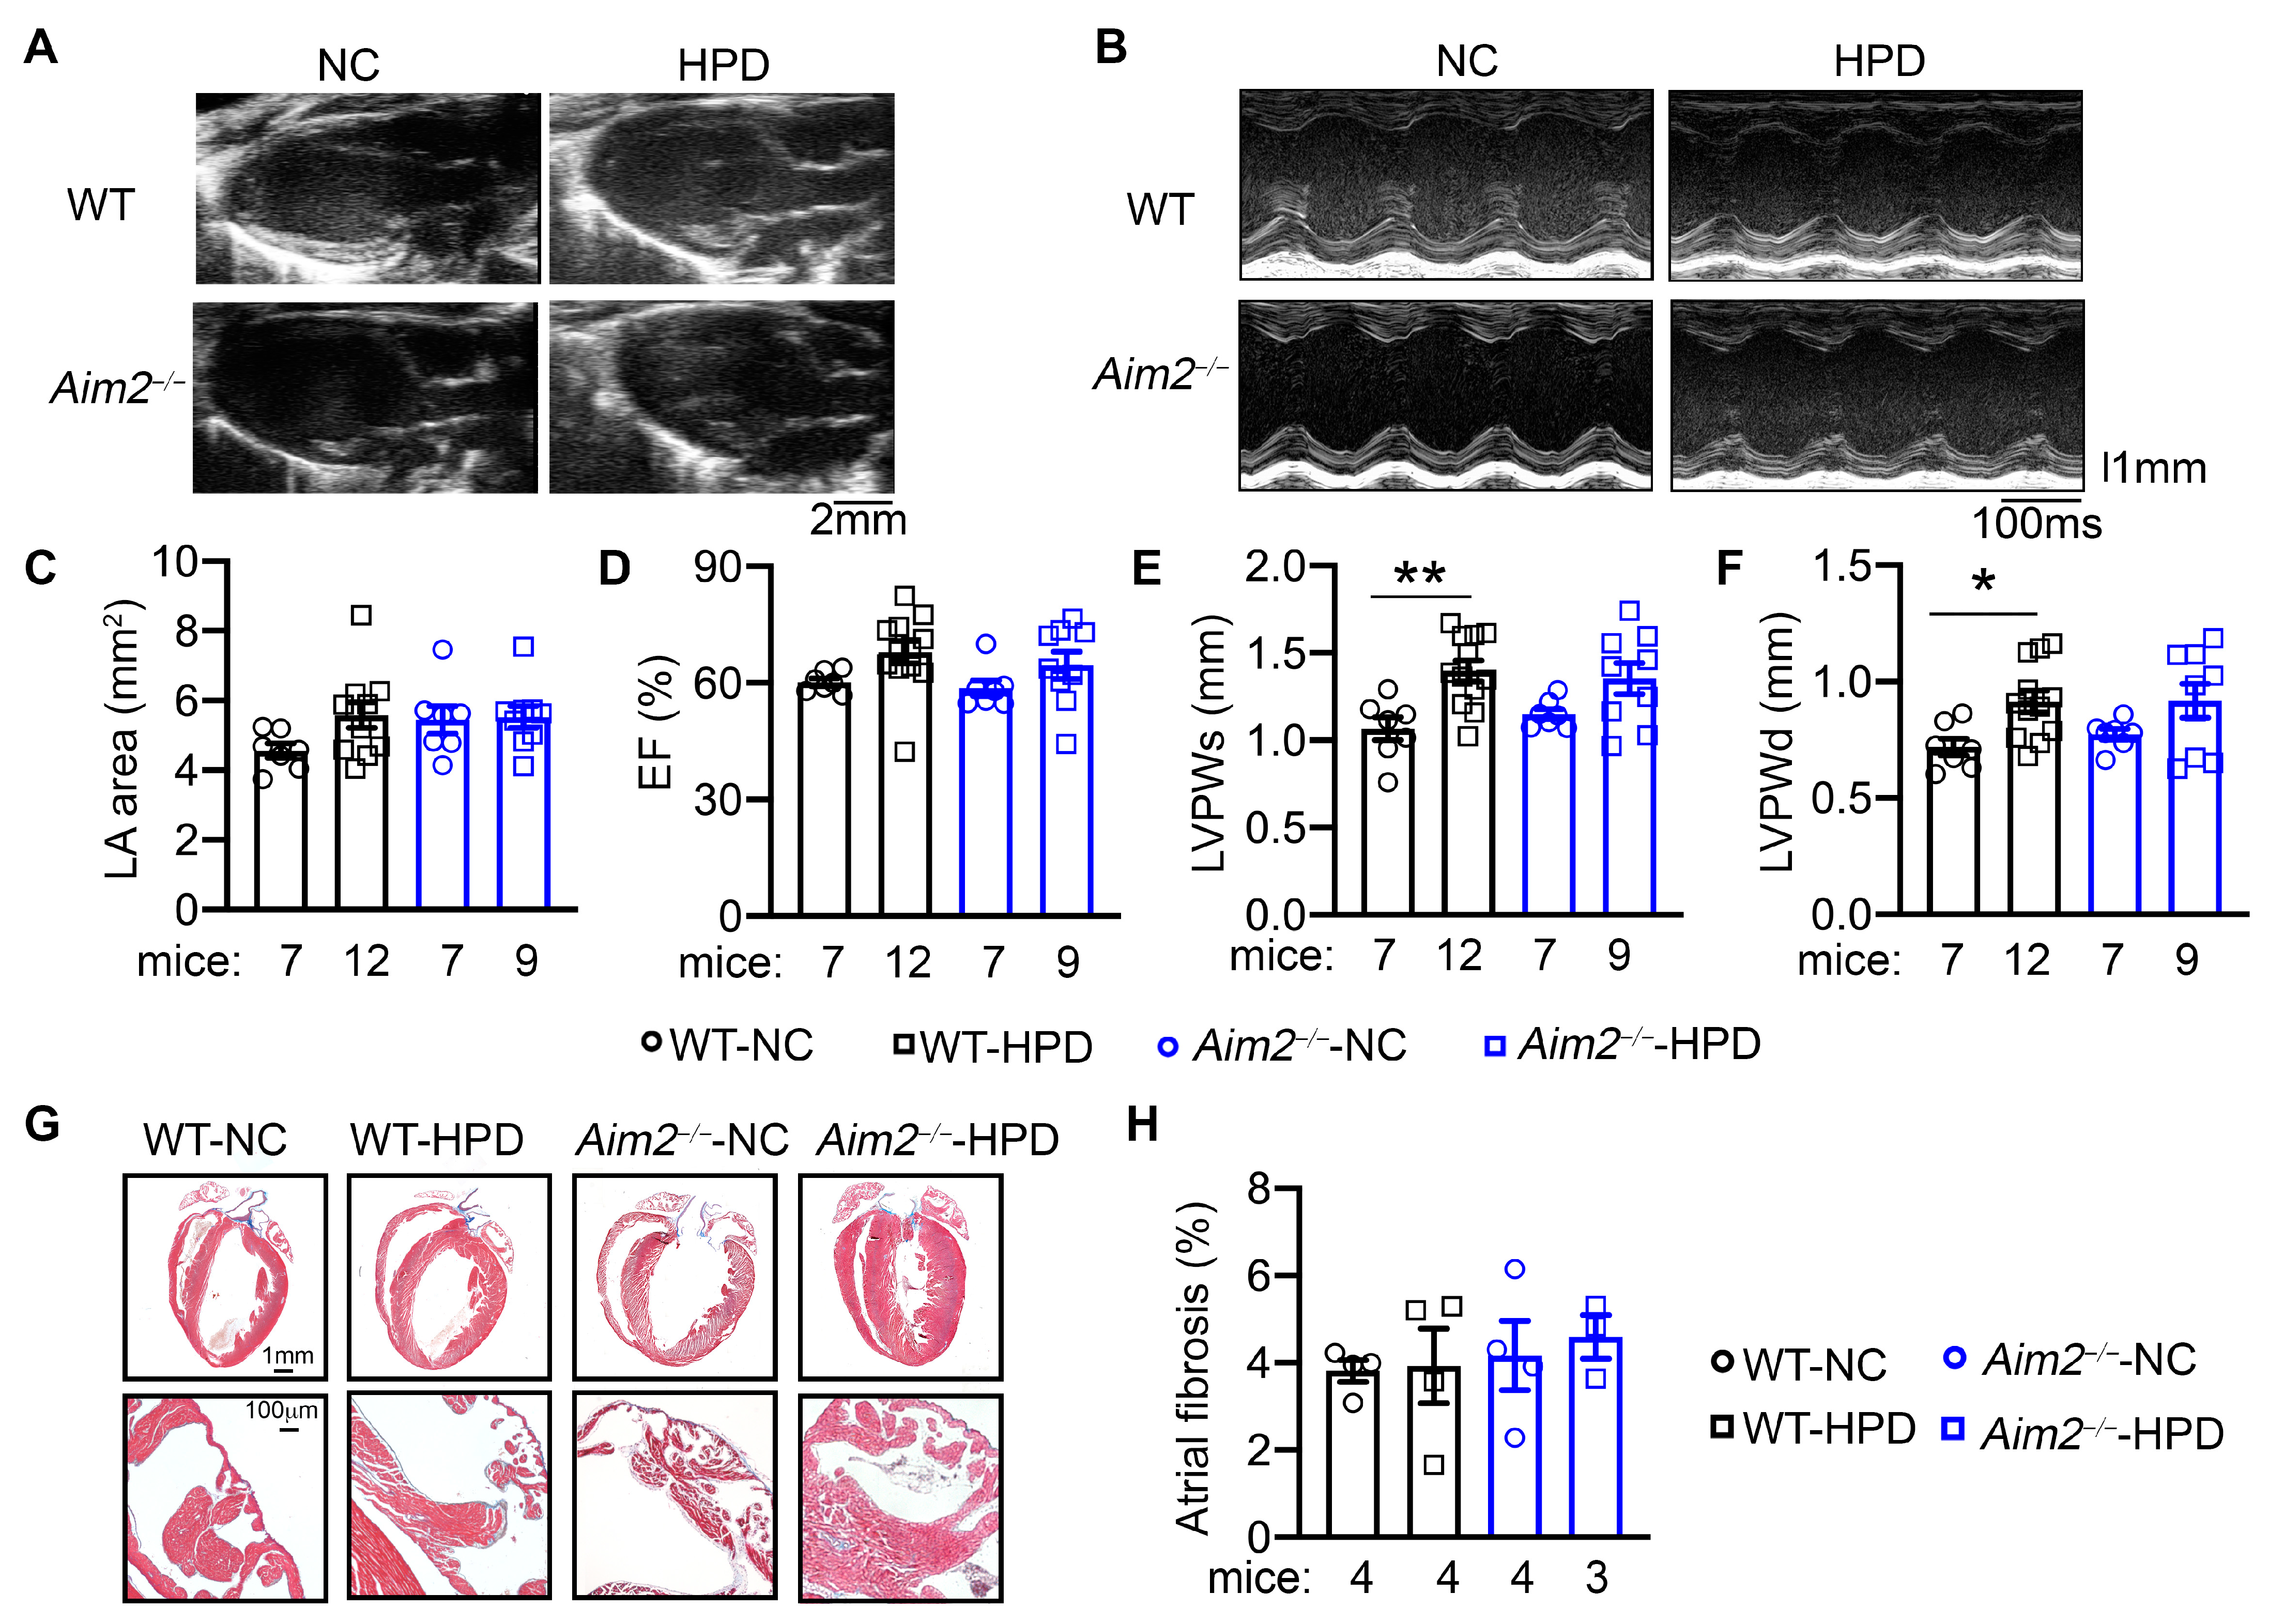
To determine whether structural remodeling within the atria or ventricular dysfunction contributes to the enhanced AF susceptibility in the HPD model, we performed echocardiography analysis prior to the PES studies. We found that the left atrial (LA) dimensions were similar among the four groups (Figure 4A,C). Additionally, we found that all four groups of mice displayed similar left ventricular (LV) ejection fraction (EF%, Figure 4B,D), LV diameters (ESD, EDD), and LV anterior wall thickness (LVAWs, LVAWd) (Supplementary Table S2, Figure S4). Interestingly, LV posterior wall thickness during both systole and diastole (LVPWs and LVPWd) was increased in WT-HPD and Aim2−/−-HPD compared to their NC-fed controls (Figure 4E,F), indicating that 4-week HPD may promote physiological LV hypertrophy. However, the mRNA levels of hypertrophic makers (e.g., Nppa, Myh7, and Mhy6) were not significantly different among the four groups in the ventricle sample of the mice (Supplemental Figure S4). To further evaluate whether HPD promotes fibrotic remodeling, a known pro-AF substrate, histology, and Masson’s trichrome staining were performed. We found that atrial and ventricular fibrosis were comparable among the four groups (Figure 4G,H). Protein levels of the macrophage markers (CD68 and F4/80) in atria were also comparable among the four groups (Supplemental Figure S5). These results establish that HPD promotes the development of a pro-arrhythmic substrate for AF unrelated to structural and fibrotic remodeling of the atria.

3.5. Inhibition of AIM2 Reduced the Aberrant Diastolic Ca2+ Leak Associated with the HPD-Induced AF

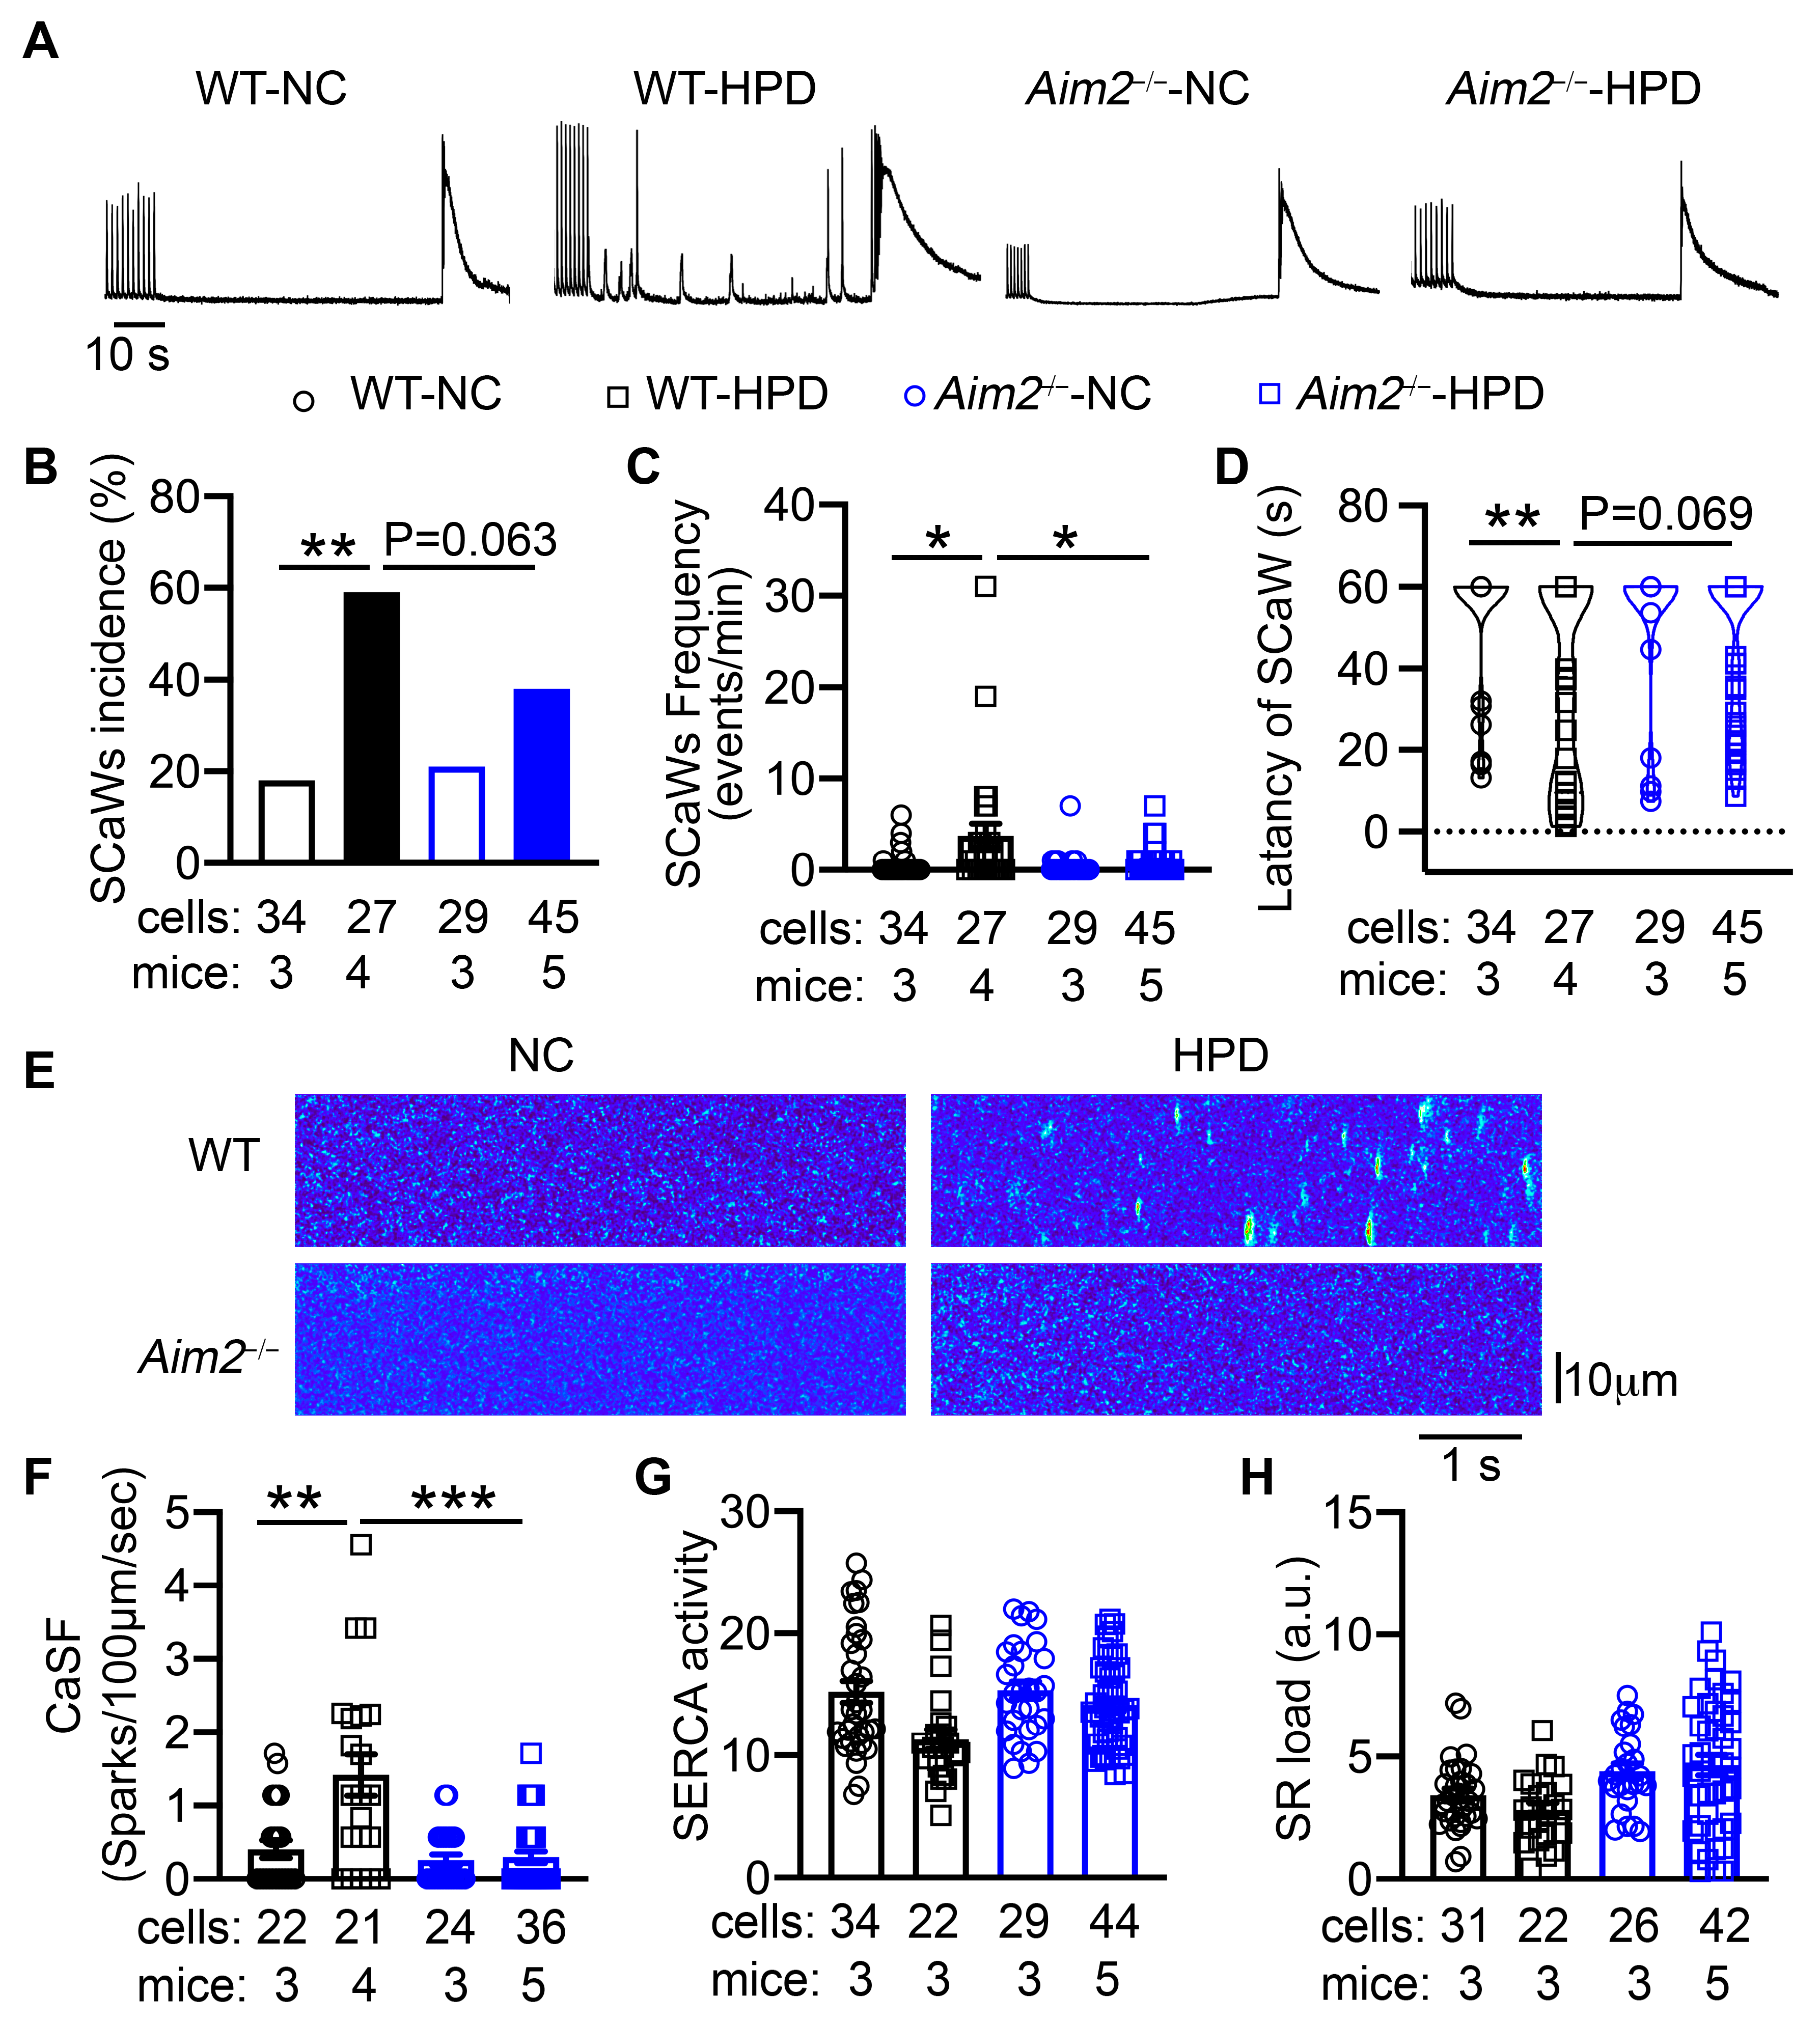
To determine whether HPD promotes abnormal SR Ca2+ release events, we performed Ca2+ imaging studies in isolated atrial myocytes from four groups of mice. After 1 Hz pacing, the incidence of spontaneous Ca2+ waves (SCaWs) was significantly higher in the atrial myocytes from WT-HPD than those of WT-NC mice (p < 0.05, Figure 5A,B). The frequency of SCaWs was also greater in the atrial myocytes of WT-HPD than those of WT-NC mice (p < 0.05, Figure 5C). The latency to onset of SCaWs was shorter in the cells of WT-HPD mice (Figure 5D). Consistently, the frequency of Ca2+ sparks (CaSF), mediated by clusters of ryanodine receptor 2, was increased in the atrial myocytes of WT-HPD mice (p < 0.01 vs. WT-NC mice, Figure 5F). The activity of SERCA, estimated by the decay of pacing-induced Ca2+ transients, as well as the SR load, were unchanged among the four groups (Figure 5G,H). In contrast, atrial myocytes of Aim2−/−-HPD mice displayed reduced incidence and frequency of SCaWs, delayed latency to the onset of SCaWs, and less CaSF compared with the cells of WT-HPD mice (Figure 5). These results suggest that HPD can promote abnormal Ca2+ release-mediated triggered activity, thereby enhancing atrial arrhythmogenesis, which can be attenuated by the inhibition of the AIM2 inflammasome.

3.6. HPD Upregulates the AIM2 Inflammasome by Causing Mitochondrial Dysfunction

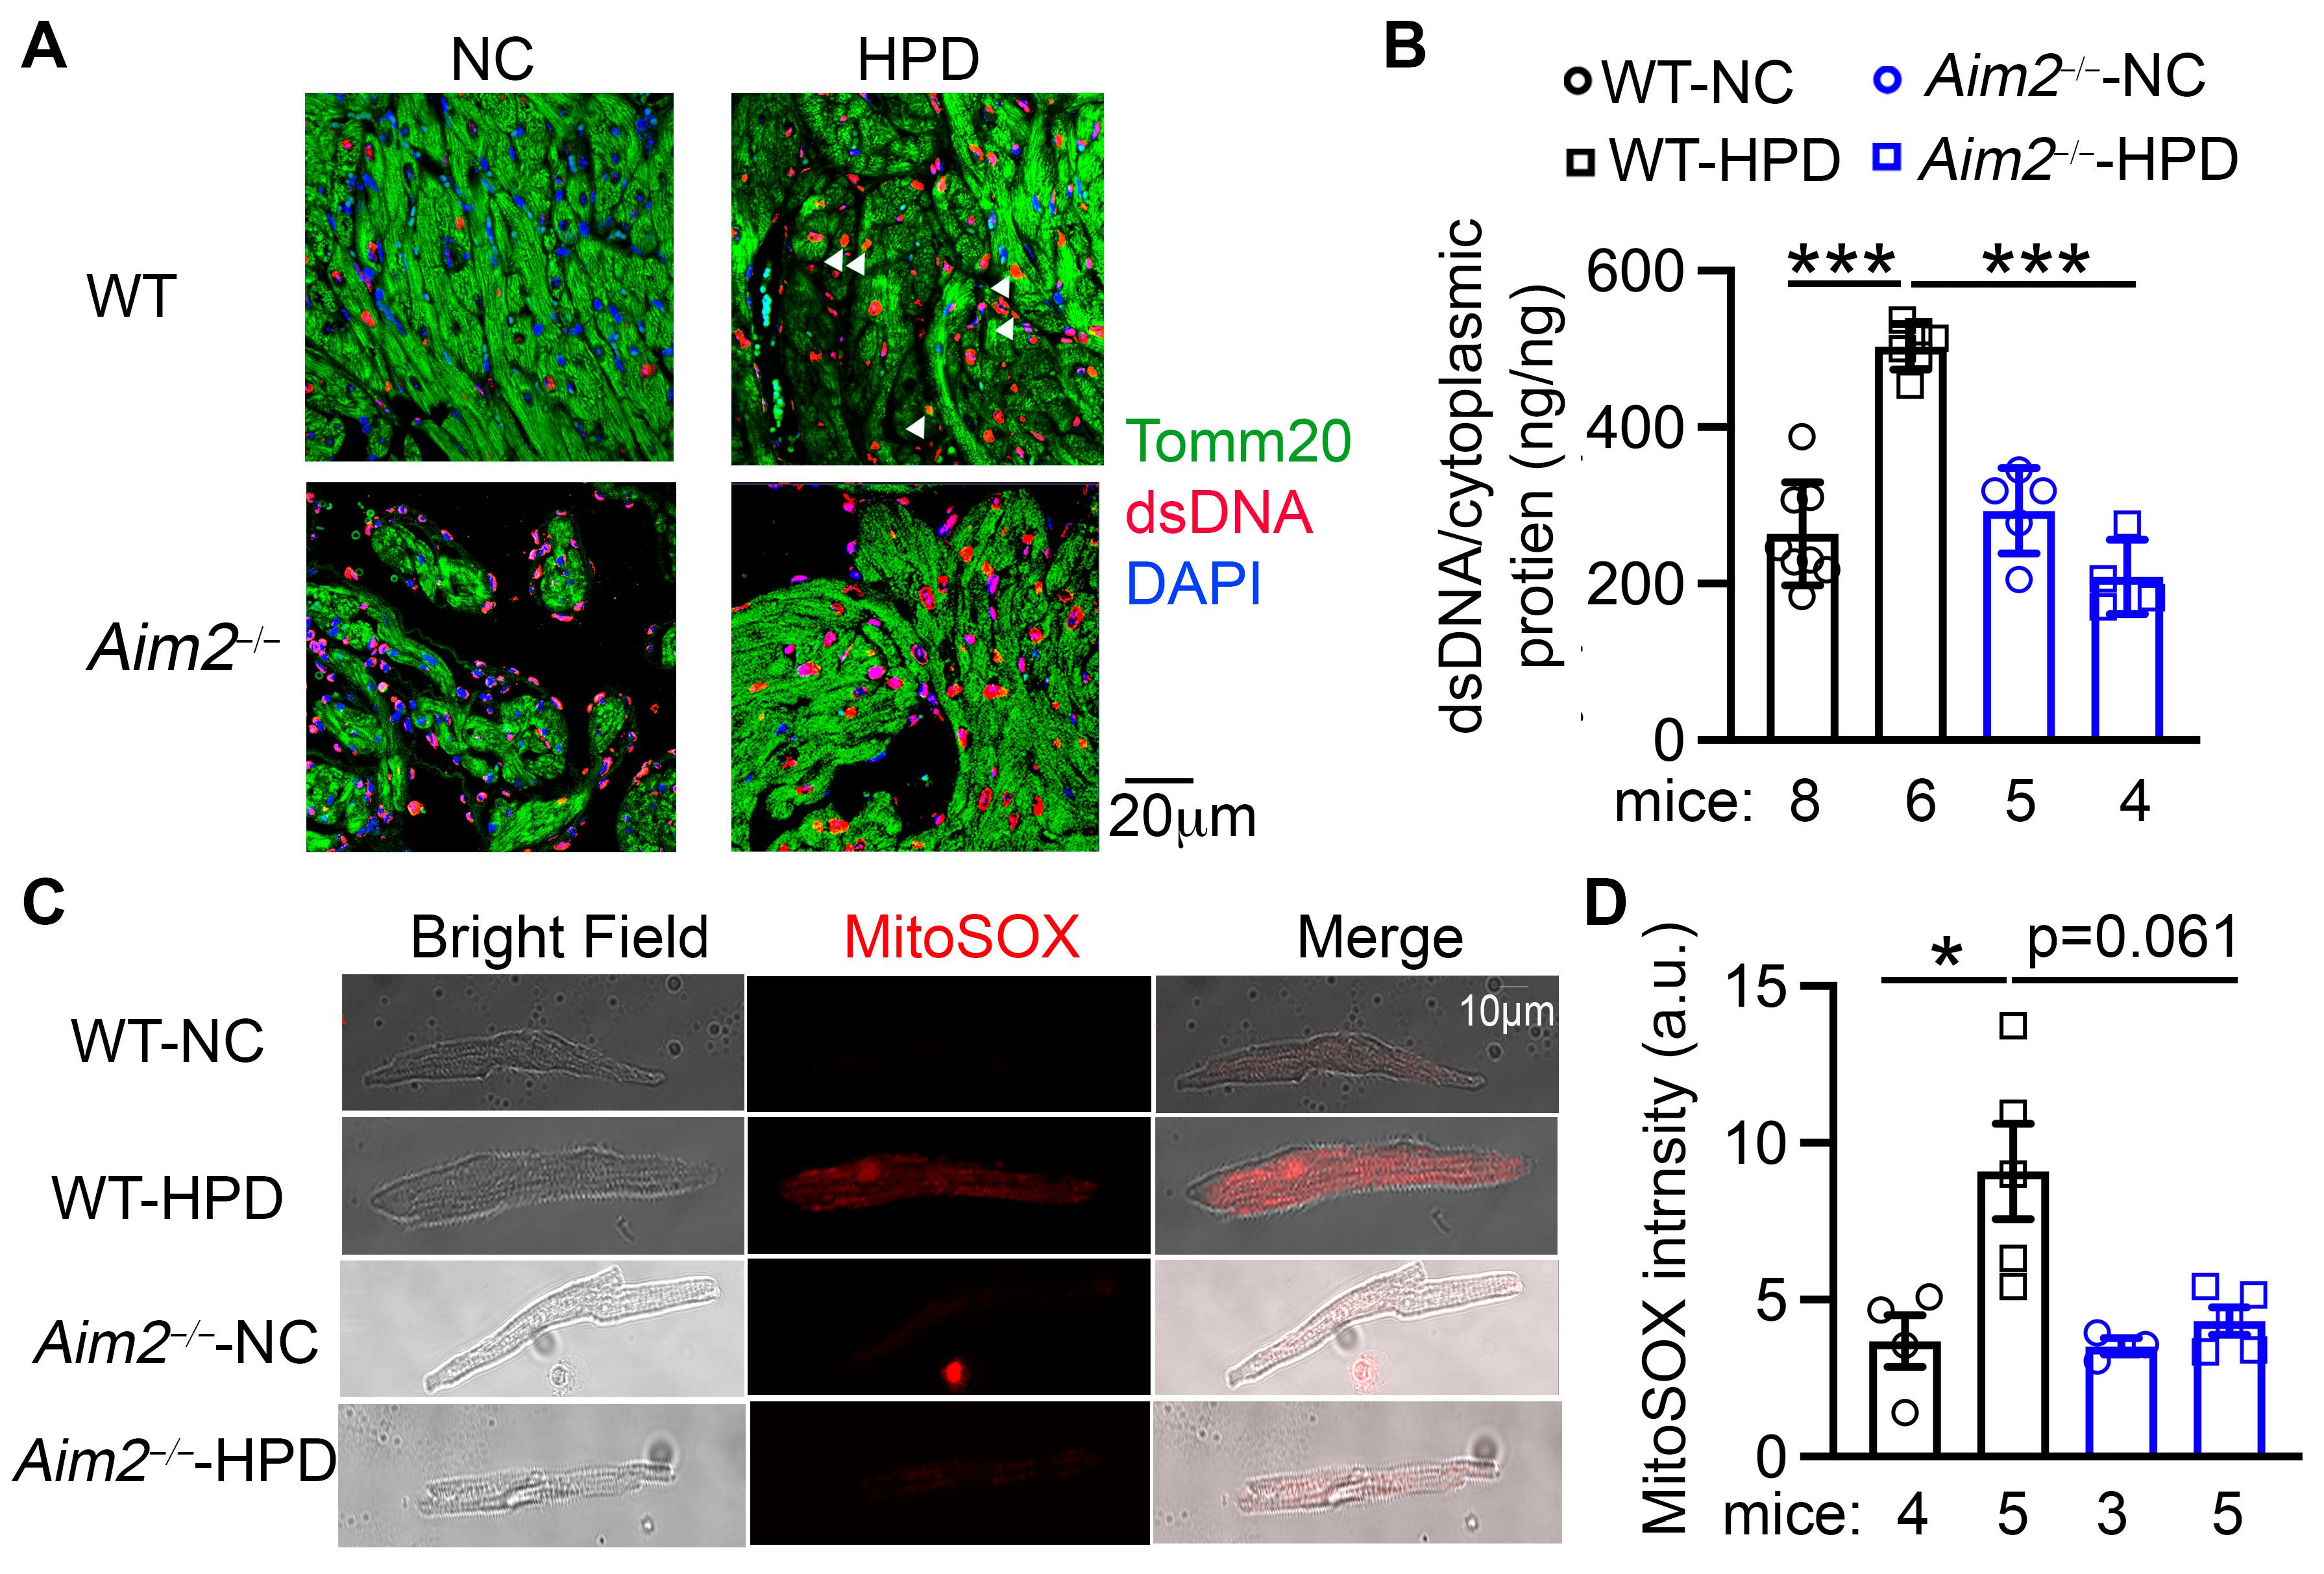
Finally, to determine how HPD enhances the AIM2 inflammasome, we examined the levels of dsDNA in atria, a major activator of the AIM2 inflammasome. We first conducted immunofluorescence staining to examine the localization of dsDNA (Figure 6A). Compared with the atrial tissue of WT-NC mice, WT-HPD atria exhibited a markedly increased level of dsDNA, some of which co-localized with the mitochondrial marker Tomm20 (Figure 6A). We then measured the cytoplasmic dsDNA content in atrial myocytes using a dsDNA hypersensitive kit. We found that the cytoplasmic dsDNA content was increased in the atria of WT-HPD mice compared with that of WT-NC mice (p < 0.001, Figure 6B). These data suggest that HPD may increase cytoplasmic mitochondrial DNA (mtDNA) content, thereby activating the AIM2 inflammasome pathway. The increases in the cytoplasmic dsDNA and mtDNA content were reversed in the Aim2−/−-HPD group (Figure 6A,B), indicating a potential feedforward feedback loop between HPD-mediated increases in dsDNA and AIM2 activation. To determine whether the increased mtDNA release is a result of mitochondrial damage, we assessed levels of mitochondrial reactive oxidative species (mtROS) by staining atrial myocytes with MitoSOXTM Red. We observed that mtROS levels were significantly increased in the atrial myocytes of WT-HPD mice compared to those of WT-NC mice (Figure 6C,D and Supplementary Figure S6). Interestingly, mtROS levels in the atrial myocytes of Aim2−/−-HPD mice were also markedly decreased compared with those from WT-HPD mice (Figure 6C,D and Supplementary Figure S6). These results suggest that HPD-induced mitochondrial stress may activate the atrial AIM2 inflammasome.

4. Discussion

In the present study, using the custom-made protein-enriched diet (40% protein content), we observed that 4-week short-term HPD can mildly improve glucose tolerance, in line with previous findings [31]. Our results also present the first evidence that HPD enhances atrial arrhythmogenesis by promoting abnormal diastolic Ca2+ release events, which depend on the activity of the AIM2 inflammasome in the atria. Importantly, we demonstrate that HPD activates the AIM2 inflammasome by causing mitochondrial stress. To our knowledge, this is the first study to identify an adverse effect of HPD on cardiac electrophysiology and to establish that the AIM2 inflammasome contributes to HPD-mediated atrial arrhythmogenesis.
To date, the association between HPD and cardiovascular diseases has not been well established. While protein-enriched diets and supplementary dietary proteins are widely accepted for weight management and metabolic profile improvement, the health benefits of macronutrients, often derived from dietary protein, continue to be a subject of debate [14,32]. For instance, HPD may exacerbate the progression of coronary artery disease by promoting lipid deposition and activating inflammatory pathways, thereby increasing AF susceptibility. Recent studies also suggest that HPD intake can cause intraglomerular hypertension and increase the risk of chronic kidney disease [11,12], which in turn is associated with a higher risk of AF as a result of elevated circulating IL-1β levels [16]. In our study, the HPD-fed mice exhibit normal serum creatinine levels, in spite of elevated BUN levels. This suggests that kidney function remains compensated after 4 weeks of HPD. While there is no apparent structural remodeling in the atria, the left ventricular posterior wall was thickened in HPD-fed mice. Whether this hypertrophic response has physiological or pathophysiological consequences requires further examination.
Our prior research has established that the NLRP3 inflammasome plays a critical role in AF development in obesity or chronic kidney disease models, serving as a mechanistic link between these risk factors and increased AF risk [14,16,27]. As a known member of the inflammasome family, the AIM2 inflammasome has been implicated in promoting ischemic cardiomyopathy, the progression of atherosclerosis, aortic aneurysms, and ischemic strokes [22,23]. In this study, we reveal that global genetic inactivation of AIM2 prevents the HPD-induced increase in AF susceptibility, providing the first evidence that atrial AIM2 inflammasome activity could also be involved in AF pathogenesis, particularly in the context of HPD.
AIM2 is activated upon binding to a minimum of 250–300 bp of dsDNA in a non-sequence-specific manner [33,34]. Once activated, AIM2 interacts with the adaptor protein ASC and pro-caspase-1, forming the inflammasome complex and leading to caspase-1 autocleavage. Mature caspase-1 can then promote the maturation of IL-1β and IL-18 [35,36]. Our findings show that HPD elevates atrial levels of mature caspase-1, which can be prevented by the genetic inhibition of AIM2. During sterile inflammation, damaged cellular organelles represent a significant source of danger signals. dsDNA is usually confined within the nucleus or mitochondria, and the presence of cytoplasmic dsDNA is an indication of cellular stress [37]. In the HPD model, the increased level of cytoplasmic dsDNA is associated with increased mitochondrial ROS production, typically indicating a state of mitochondrial stress and dysfunction. Mitochondria play an essential role in cardiomyocyte ATP production and are also a primary site of ROS generation [38,39]. Excessive protein intake has been linked to oxidative damage in the mouse pancreas and rat brain by reducing antioxidant systems such as superoxide dismutase. In contrast, protein restriction lowers mitochondrial ROS and mtDNA levels, as well as lipid damage in the rat liver [40]. These studies, together with our current findings, suggest that HPD consumption can distress mitochondria and cause the subsequent release of mtDNA, thereby activating the AIM2 inflammasome. Since oxidative stress is known to be a factor in the development of AF in patients, our study adds a new dimension to the understanding of AF pathogenesis, implicating enhanced AIM2 inflammasome signaling due to oxidative stress. Future studies should explore whether targeting mitochondrial ROS specifically could mitigate the AF-promoting effects of HPD.
Our study has limitations, and additional considerations are warranted. First, our HPD diet comprised 42% kcal protein, 44% kcal carbohydrate, and 13.1% kcal fat, which increased protein while decreasing carbohydrate content. Zhang et al. previously reported an increased incidence of AF in humans with lower carbohydrate intake over a median follow-up of 22 years [41]. However, it remains unclear if the risk of AF, varying with carbohydrate intake levels, shows significant differences in the short term, such as within a 5-year follow-up period [42]. Moreover, in the current study, the carbohydrate contributes to 44% of the total calories of HPD, which is close to the Institute of Medicine’s carbohydrate standard, constituting 45–65% of total caloric intake [43]. Therefore, the alterations observed in mice subjected to an HPD for 4 weeks, considerably shorter than the human study duration, are likely the direct result of the increased protein intake. Second, whether the increased percentage of protein in the diet or the duration of HPD feeding can aggravate AF should be addressed in follow-up studies. It should also be determined if HPD-mediated AF pathogenesis is reversible. Third, although the AIM2 inflammasome promotes abnormal SR Ca2+ leak, the precise molecular mechanisms require further extensive experimentation. Fourth, our study uses the whole atrial tissue for inflammasome activity. Therefore, we could not determine which cells are primarily responsible for the inflammasome activity, despite the lack of macrophage infiltration in the atria. Considering that AIM2 is known to be expressed in bone marrow-derived macrophages and other immune cells, and the bone marrow is the primary source of hemopoietic stem cells and immune cells [24,25], it is plausible that HPD may promote a low degree of inflammatory status within the bone marrow, thereby enhancing the inflammatory signaling in favor of atrial arrhythmogenesis. In future studies, single-cell transcriptome analysis would be helpful to dissect the intercellular interactions altered by HPD and inflammasome activation. A cardiomyocyte- or atrial-selective AIM2 knockout model would be beneficial to define the atrial myocyte-specific role of AIM2 in AF pathogenesis. Lastly, given that some inflammasomes such as AIM2 and NLRP3 share the same downstream pathway [44], studies using WT mice and mice deficient in caspase-1, ASC, or GSDMD are needed to uncover the optimal target to prevent AF associated with the inflammasome activations.

5. Conclusions

Our study reveals that high-protein diets can promote a substrate for AF development in mice. The AIM2 inflammasome serves as a mechanistic link between high-protein diets and AF pathophysiology. The activation of the AIM2 inflammasome in response to high-protein diets is mediated by dsDNA derived from stressed mitochondria. Targeting AIM2 might constitute a novel therapeutic approach against AF.

Supplementary Materials

The following supporting information can be downloaded at: https://www.mdpi.com/article/10.3390/cells13020108/s1, Table S1. ECG parameters in wildtype (WT) and Aim2−/− mice. Table S2. Echocardiography parameters in WT and Aim2−/− mice 4-week feeding of NC or HPD. Figure S1. RT-PCR analysis of Aim2 transcript in atrial tissue of WT and Aim2−/− mice. Figure S2. Incidence of pacing-induced AF in WT and Nlrp3−/− mice with NC or HPD feeding. Figure S3. High-protein diet improved glucose metabolism mice. Figure S4. Unchanged left ventricular diameters and anterior wall thicknesses. Figure S5. Unchanged protein level of macrophage marker. Figure S6. Quantification of mitoSOX intensity.

Author Contributions

Conceptualization, J.S. and N.L.; methodology, J.S., J.W., D.J.R., T.L., S.W. and M.J.A.S.; data analysis, J.S., J.W., T.L., S.W. and M.J.A.S.; data curation, J.S., J.W., D.J.R., T.L., S.W. and M.J.A.S.; data interpretation, J.S., D.J.R., S.W., B.D., D.D., S.S.T. and N.L.; visualization, J.S., J.W., T.L. and M.J.A.S.; manuscript—drafting, J.S. and N.L.; manuscript—critically editing, J.W., D.J.R., B.D., J.K., S.S.T., D.D. and N.L.; revision—intellectual input, D.J.R., J.K., S.W, B.D., D.D., S.S.T. and N.L.; supervision, B.D., J.K., S.S.T. and N.L.; funding acquisition, D.D. and N.L. All authors have read and agreed to the published version of the manuscript.

Funding

This study is supported by grants from the National Institutes of Health [R01HL164838, R01HL136389, and R01HL163277 to N.L. and D.D., R01HL147108 to N.L., R01HL131517, R01HL089598, and R01HL160992 to D.D.], the European Union [large-scale network project MAESTRIA No. 965286 to D.D.], and the American Heart Association [EIA 936111 to N.L.].

Institutional Review Board Statement

The animal study protocol was approved by the Institutional Animal Care and Use Committee of Baylor College of Medicine (protocol code AN-7259).

Informed Consent Statement

Not applicable.

Data Availability Statement

The detailed experimental materials, methods, and data supporting the findings of this study are available within the article and its Supplemental Material. Raw data are available from the corresponding author upon reasonable request.

Acknowledgments

We thank Yue Yuan and Luge Li for their technical support from the Department of Medicine, Section of Cardiovascular Research, at Baylor College of Medicine.

Conflicts of Interest

The authors declare no conflict of interest.

References

  1. Andrade, J.; Khairy, P.; Dobrev, D.; Nattel, S. The clinical profile and pathophysiology of atrial fibrillation: Relationships among clinical features, epidemiology, and mechanisms. Circ. Res. 2014, 114, 1453–1468. [Google Scholar] [CrossRef] [PubMed]
  2. Kotecha, D.; Breithardt, G.; Camm, A.J.; Lip, G.Y.H.; Schotten, U.; Ahlsson, A.; Arnar, D.; Atar, D.; Auricchio, A.; Bax, J.; et al. Integrating new approaches to atrial fibrillation management: The 6th AFNET/EHRA Consensus Conference. Europace 2018, 20, 395–407. [Google Scholar] [CrossRef] [PubMed]
  3. Ifedili, I.; Mouksian, K.; Jones, D.; El Masri, I.; Heckle, M.; Jefferies, J.; Levine, Y.C. Ablation therapy for persistent atrial fibrillation. Curr. Cardiol. Rev. 2021, 18, 40–46. [Google Scholar] [CrossRef] [PubMed]
  4. Tan, A.Y.; Zimetbaum, P. Atrial fibrillation and atrial fibrosis. J. Cardiovasc. Pharmacol. 2011, 57, 625–629. [Google Scholar] [CrossRef] [PubMed]
  5. Gruwez, H.; Proesmans, T.; Evens, S.; Verbrugge, F.H.; Deferm, S.; Dauw, J.; Willems, R.; Vandervoort, P.; Haemers, P.; Pison, L. Atrial Fibrillation Population Screening. Card. Electrophysiol. Clin. 2021, 13, 531–542. [Google Scholar] [CrossRef] [PubMed]
  6. Hamad, A.K.S. New Technologies for Detection and Management of Atrial Fibrillation. J. Saudi Heart Assoc. 2021, 33, 169–176. [Google Scholar] [CrossRef] [PubMed]
  7. Kornej, J.; Borschel, C.S.; Benjamin, E.J.; Schnabel, R.B. Epidemiology of Atrial Fibrillation in the 21st Century: Novel Methods and New Insights. Circ. Res. 2020, 127, 4–20. [Google Scholar] [CrossRef] [PubMed]
  8. Chung, M.K.; Eckhardt, L.L.; Chen, L.Y.; Ahmed, H.M.; Gopinathannair, R.; Joglar, J.A.; Noseworthy, P.A.; Pack, Q.R.; Sanders, P.; Trulock, K.M.; et al. Lifestyle and Risk Factor Modification for Reduction of Atrial Fibrillation: A Scientific Statement From the American Heart Association. Circulation 2020, 141, e750–e772. [Google Scholar] [CrossRef]
  9. Gardner, C.D.; Kiazand, A.; Alhassan, S.; Kim, S.; Stafford, R.S.; Balise, R.R.; Kraemer, H.C.; King, A.C. Comparison of the Atkins, Zone, Ornish, and LEARN diets for change in weight and related risk factors among overweight premenopausal women: The A TO Z Weight Loss Study: A randomized trial. JAMA 2007, 297, 969–977. [Google Scholar] [CrossRef]
  10. Zhang, X.; Sergin, I.; Evans, T.D.; Jeong, S.J.; Rodriguez-Velez, A.; Kapoor, D.; Chen, S.; Song, E.; Holloway, K.B.; Crowley, J.R.; et al. High-protein diets increase cardiovascular risk by activating macrophage mTOR to suppress mitophagy. Nat. Metab. 2020, 2, 110–125. [Google Scholar] [CrossRef]
  11. Ko, G.J.; Rhee, C.M.; Kalantar-Zadeh, K.; Joshi, S. The Effects of High-Protein Diets on Kidney Health and Longevity. J. Am. Soc. Nephrol. 2020, 31, 1667–1679. [Google Scholar] [CrossRef] [PubMed]
  12. Farhadnejad, H.; Asghari, G.; Emamat, H.; Mirmiran, P.; Azizi, F. Low-Carbohydrate High-Protein Diet is Associated with Increased Risk of Incident Chronic Kidney Diseases Among Tehranian Adults. J. Ren. Nutr. 2019, 29, 343–349. [Google Scholar] [CrossRef] [PubMed]
  13. Dobrev, D.; Heijman, J.; Hiram, R.; Li, N.; Nattel, S. Inflammatory signalling in atrial cardiomyocytes: A novel unifying principle in atrial fibrillation pathophysiology. Nat. Rev. Cardiol. 2023, 20, 145–167. [Google Scholar] [CrossRef] [PubMed]
  14. Scott, L., Jr.; Fender, A.C.; Saljic, A.; Li, L.; Chen, X.; Wang, X.; Linz, D.; Lang, J.; Hohl, M.; Twomey, D.; et al. NLRP3 inflammasome is a key driver of obesity-induced atrial arrhythmias. Cardiovasc. Res. 2021, 117, 1746–1759. [Google Scholar] [CrossRef] [PubMed]
  15. Heijman, J.; Muna, A.P.; Veleva, T.; Molina, C.E.; Sutanto, H.; Tekook, M.; Wang, Q.; Abu-Taha, I.H.; Gorka, M.; Kunzel, S.; et al. Atrial Myocyte NLRP3/CaMKII Nexus Forms a Substrate for Postoperative Atrial Fibrillation. Circ. Res. 2020, 127, 1036–1055. [Google Scholar] [CrossRef]
  16. Song, J.; Navarro-Garcia, J.A.; Wu, J.; Saljic, A.; Abu-Taha, I.; Li, L.; Lahiri, S.K.; Keefe, J.A.; Aguilar-Sanchez, Y.; Moore, O.M.; et al. Chronic kidney disease promotes atrial fibrillation via inflammasome pathway activation. J. Clin. Investig. 2023, 133, e167517. [Google Scholar] [CrossRef]
  17. Sharma, B.R.; Karki, R.; Kanneganti, T.D. Role of AIM2 inflammasome in inflammatory diseases, cancer and infection. Eur. J. Immunol. 2019, 49, 1998–2011. [Google Scholar] [CrossRef]
  18. Ciazynska, M.; Olejniczak-Staruch, I.; Sobolewska-Sztychny, D.; Narbutt, J.; Skibinska, M.; Lesiak, A. The Role of NLRP1, NLRP3, and AIM2 Inflammasomes in Psoriasis: Review. Int. J. Mol. Sci. 2021, 22, 5898. [Google Scholar] [CrossRef]
  19. Di Micco, A.; Frera, G.; Lugrin, J.; Jamilloux, Y.; Hsu, E.T.; Tardivel, A.; De Gassart, A.; Zaffalon, L.; Bujisic, B.; Siegert, S.; et al. AIM2 inflammasome is activated by pharmacological disruption of nuclear envelope integrity. Proc. Natl. Acad. Sci. USA 2016, 113, E4671–E4680. [Google Scholar] [CrossRef]
  20. Kumari, P.; Russo, A.J.; Shivcharan, S.; Rathinam, V.A. AIM2 in health and disease: Inflammasome and beyond. Immunol. Rev. 2020, 297, 83–95. [Google Scholar] [CrossRef]
  21. Dombrowski, Y.; Koglin, S.; Schauber, J. DNA-triggered AIM2 inflammasome activation in keratinocytes: Comment on Kopfnagel et al. Exp Dermatol. 2011. 20:1027-9. Exp. Dermatol. 2012, 21, 474–475. [Google Scholar] [CrossRef] [PubMed]
  22. Du, L.; Wang, X.; Chen, S.; Guo, X. The AIM2 inflammasome: A novel biomarker and target in cardiovascular disease. Pharmacol. Res. 2022, 186, 106533. [Google Scholar] [CrossRef] [PubMed]
  23. Onodi, Z.; Ruppert, M.; Kucsera, D.; Sayour, A.A.; Toth, V.E.; Koncsos, G.; Novak, J.; Brenner, G.B.; Makkos, A.; Baranyai, T.; et al. AIM2-driven inflammasome activation in heart failure. Cardiovasc. Res. 2021, 117, 2639–2651. [Google Scholar] [CrossRef] [PubMed]
  24. Fidler, T.P.; Xue, C.; Yalcinkaya, M.; Hardaway, B.; Abramowicz, S.; Xiao, T.; Liu, W.; Thomas, D.G.; Hajebrahimi, M.A.; Pircher, J.; et al. The AIM2 inflammasome exacerbates atherosclerosis in clonal haematopoiesis. Nature 2021, 592, 296–301. [Google Scholar] [CrossRef] [PubMed]
  25. Rathinam, V.A.; Jiang, Z.; Waggoner, S.N.; Sharma, S.; Cole, L.E.; Waggoner, L.; Vanaja, S.K.; Monks, B.G.; Ganesan, S.; Latz, E.; et al. The AIM2 inflammasome is essential for host defense against cytosolic bacteria and DNA viruses. Nat. Immunol. 2010, 11, 395–402. [Google Scholar] [CrossRef]
  26. Wang, X.; Song, J.; Yuan, Y.; Li, L.; Abu-Taha, I.; Heijman, J.; Sun, L.; Dobrev, S.; Kamler, M.; Xie, L.; et al. Downregulation of FKBP5 Promotes Atrial Arrhythmogenesis. Circ. Res. 2023, 133, e1–e16. [Google Scholar] [CrossRef]
  27. Yao, C.; Veleva, T.; Scott, L., Jr.; Cao, S.; Li, L.; Chen, G.; Jeyabal, P.; Pan, X.; Alsina, K.M.; Abu-Taha, I.D.; et al. Enhanced Cardiomyocyte NLRP3 Inflammasome Signaling Promotes Atrial Fibrillation. Circulation 2018, 138, 2227–2242. [Google Scholar] [CrossRef]
  28. Liu, M.; Li, M.; Liu, J.; Wang, H.; Zhong, D.; Zhou, H.; Yang, B. Elevated urinary urea by high-protein diet could be one of the inducements of bladder disorders. J. Transl. Med. 2016, 14, 53. [Google Scholar] [CrossRef]
  29. Roman, R.J.; Bonventre, J.V.; Lechene, C.P. Fluorometric assay for urea in urine, plasma, and tubular fluid. Anal. Biochem. 1979, 98, 136–141. [Google Scholar] [CrossRef]
  30. Mitch, W.E. Amino acid release from the hindquarter and urea appearance in acute uremia. Am. J. Physiol. 1981, 241, E415–E419. [Google Scholar] [CrossRef]
  31. Gong, Z.; Zhang, X.; Su, K.; Jiang, R.; Sun, Z.; Chen, W.; Forno, E.; Goetzman, E.S.; Wang, J.; Dong, H.H.; et al. Deficiency in AIM2 induces inflammation and adipogenesis in white adipose tissue leading to obesity and insulin resistance. Diabetologia 2019, 62, 2325–2339. [Google Scholar] [CrossRef]
  32. Drummen, M.; Tischmann, L.; Gatta-Cherifi, B.; Adam, T.; Westerterp-Plantenga, M. Dietary Protein and Energy Balance in Relation to Obesity and Co-morbidities. Front. Endocrinol. 2018, 9, 443. [Google Scholar] [CrossRef] [PubMed]
  33. Zhao, Z.Z.; Zheng, X.L.; Jiang, Z.S. Emerging roles of absent in melanoma 2 in cardiovascular diseases. Clin. Chim. Acta 2020, 511, 14–23. [Google Scholar] [CrossRef] [PubMed]
  34. Dawson, R.E.; Deswaerte, V.; West, A.C.; Tang, K.; West, A.J.; Balic, J.J.; Gearing, L.J.; Saad, M.I.; Yu, L.; Wu, Y.; et al. STAT3-mediated upregulation of the AIM2 DNA sensor links innate immunity with cell migration to promote epithelial tumourigenesis. Gut 2021, 71, 1515–1531. [Google Scholar] [CrossRef] [PubMed]
  35. Hornung, V.; Ablasser, A.; Charrel-Dennis, M.; Bauernfeind, F.; Horvath, G.; Caffrey, D.R.; Latz, E.; Fitzgerald, K.A. AIM2 recognizes cytosolic dsDNA and forms a caspase-1-activating inflammasome with ASC. Nature 2009, 458, 514–518. [Google Scholar] [CrossRef]
  36. Fernandes-Alnemri, T.; Yu, J.W.; Datta, P.; Wu, J.; Alnemri, E.S. AIM2 activates the inflammasome and cell death in response to cytoplasmic DNA. Nature 2009, 458, 509–513. [Google Scholar] [CrossRef]
  37. Luo, W.; Wang, Y.; Zhang, L.; Ren, P.; Zhang, C.; Li, Y.; Azares, A.R.; Zhang, M.; Guo, J.; Ghaghada, K.B.; et al. Critical Role of Cytosolic DNA and Its Sensing Adaptor STING in Aortic Degeneration, Dissection, and Rupture. Circulation 2020, 141, 42–66. [Google Scholar] [CrossRef]
  38. Spinelli, J.B.; Haigis, M.C. The multifaceted contributions of mitochondria to cellular metabolism. Nat. Cell Biol. 2018, 20, 745–754. [Google Scholar] [CrossRef]
  39. Tian, J.; Huang, B.; Cui, Z.; Wang, P.; Chen, S.; Yang, G.; Zhang, W. Mitochondria-targeting and ROS-sensitive smart nanoscale supramolecular organic framework for combinational amplified photodynamic therapy and chemotherapy. Acta Biomater. 2021, 130, 447–459. [Google Scholar] [CrossRef]
  40. Ayala, V.; Naudi, A.; Sanz, A.; Caro, P.; Portero-Otin, M.; Barja, G.; Pamplona, R. Dietary protein restriction decreases oxidative protein damage, peroxidizability index, and mitochondrial complex I content in rat liver. J. Gerontol. A Biol. Sci. Med. Sci. 2007, 62, 352–360. [Google Scholar] [CrossRef]
  41. Zhang, S.; Zhuang, X.; Lin, X.; Zhong, X.; Zhou, H.; Sun, X.; Xiong, Z.; Huang, Y.; Fan, Y.; Guo, Y.; et al. Low-Carbohydrate Diets and Risk of Incident Atrial Fibrillation: A Prospective Cohort Study. J. Am. Heart Assoc. 2019, 8, e011955. [Google Scholar] [CrossRef] [PubMed]
  42. Naude, C.E.; Brand, A.; Schoonees, A.; Nguyen, K.A.; Chaplin, M.; Volmink, J. Low-carbohydrate versus balanced-carbohydrate diets for reducing weight and cardiovascular risk. Cochrane Database Syst. Rev. 2022, 1, CD013334. [Google Scholar] [CrossRef] [PubMed]
  43. Slavin, J.; Carlson, J. Carbohydrates. Adv. Nutr. 2014, 5, 760–761. [Google Scholar] [CrossRef] [PubMed]
  44. Tall, A.R.; Bornfeldt, K.E. Inflammasomes and Atherosclerosis: A Mixed Picture. Circ. Res. 2023, 132, 1505–1520. [Google Scholar] [CrossRef]
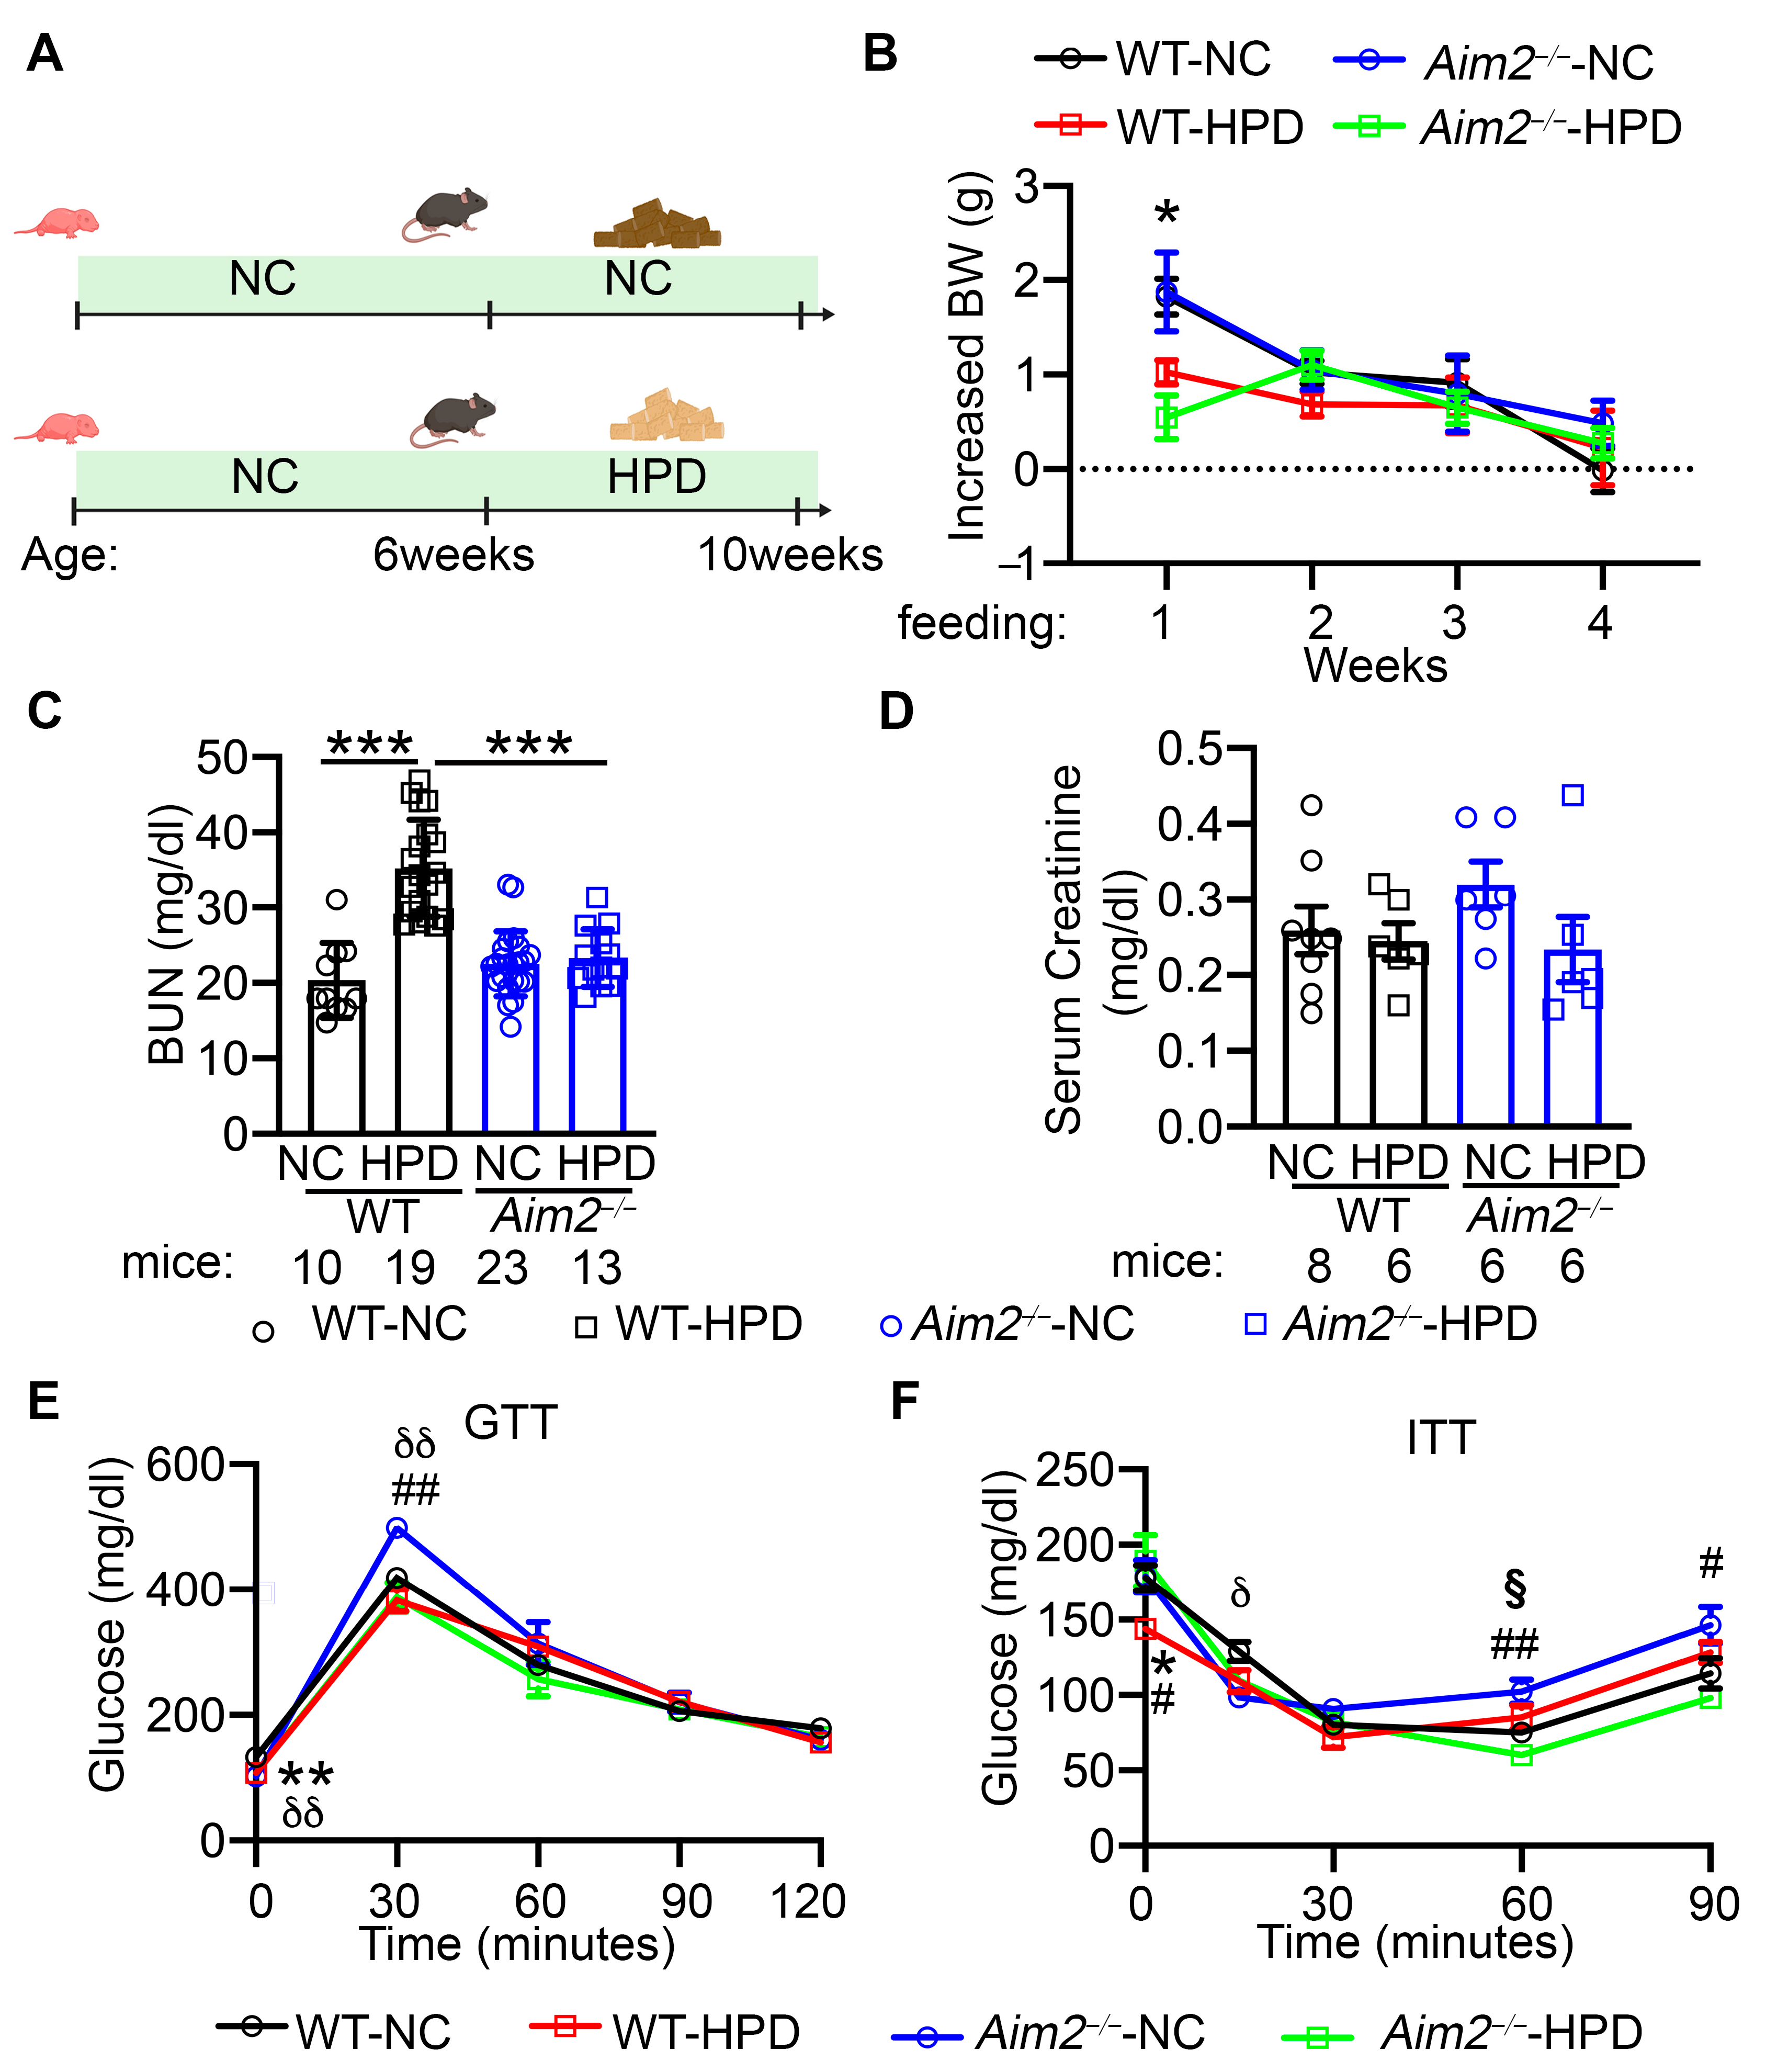
Figure 1. High-protein diet (HPD) displayed salutary effects on body weight and glucose tolerance. (A) Group design of WT and Aim2−/− mice received normal chow (NC) or HPD, respectively. Created with BioRender.com. (B) Weekly body weight (BW) gain. N = 8 mice/group. (C) Blood urea nitrogen level (BUN) levels. (D) Serum creatinine levels. (E,F) Plasma level of glucose during glucose-tolerance test (GTT, E) and insulin-tolerance test (ITT, F) in WT and Aim2−/−-mice after 4 weeks of feeding with NC or HPD, respectively. In (B,C), * p < 0.05, *** p < 0.001. In (E,F), * p < 0.05, ** p < 0.01, WT-NC vs. WT-HPD; δ p < 0.05, δδ p < 0.01, WT-NC vs. Aim2−/− -NC; # p < 0.05, ## p < 0.01, Aim2−/−-NC vs. Aim2−/−-HPD; § p < 0.05, WT-HPD vs. Aim2−/−-HPD. p-values were determined by Welch ANOVA and Dunnett’s T3 multiple comparisons test in (B,C,E), and Welch ANOVA and Dunnett’s T3 multiple comparisons test and Kruskal–Wallis with Dunn’s multiple comparisons test in (F).
Cells 13 00108 g001
Figure 2. Inhibition of AIM2 prevents the high-protein diet (HPD)-induced caspase-1 activation. (A) Representative Western blots of caspase-1 and quantification of precursor caspase-1 (Pro-Casp1) and cleaved caspase-1 (p20). (B,C) Serum levels of IL-1β. (B) and IL-18 (C) * p < 0.05, p-values determined by ordinary one-way ANOVA with Sidak’s multiple comparisons test in (A) and Kruskal–Wallis with Dunn’s multiple comparisons test in (B).
Cells 13 00108 g002
Figure 3. High-protein diet (HPD) enhances AF susceptibility via AIM2 inflammasome. (A) Representative recordings of lead-2 surface ECG and intracardiac electrograms in WT and Aim2−/− mice after 4 weeks’ feeding of NC or HPD, respectively. Red arrows indicate the end of the burst pacing protocol. ‘P’ and ‘R’ designate the P-wave and QRS complex on surface ECG, while ‘A’ and ‘V’ represent the atrial excitation and ventricular excitation on intracardiac electrograms, respectively. (B) The incidence of pacing-induced reproducible AF. (C) The duration of pacing-induced AF. * p < 0.05, ** p < 0.01. p-values determined by Fisher’s exact test in (B), and Kruskal–Wallis with Dunn’s multiple comparisons test in (C).
Cells 13 00108 g003
Figure 4. High-protein diet (HPD) promotes mild ventricular hypertrophy. (A) Representative long-axis echocardiography recording to assess the left atria (LA) area. (B) Representative M-mode echocardiography recordings in four groups of mice at the end of the 4-week feeding period. (C) Quantification of LA area. (D) Quantification of ejection fraction (EF%). (E,F) Quantification of LV posterior wall thickness during systole and diastole (LVPWs, (E); LVPWd, (F)). (G) Representative Masson Trichome’s staining in cardiac tissue. The second row of images indicated the left atria. (H) Quantification of the percentage of fibrosis in atrial tissue. * p < 0.05, ** p < 0.01. p-values were determined by Welch ANOVA and Dunnett’s T3 multiple comparisons test in (E,F).
Cells 13 00108 g004
Figure 5. High-protein diet (HPD) promotes aberrant SR Ca2+ release events. (A) Representative traces of the 1 Hz pacing-induced Ca2+ transients (CaTs), followed by baseline recording and the caffeine (10 mmol/L)-induced CaTs in atrial myocytes from WT-NC, WT-HPD, Aim2−/−-NC, and Aim2−/−-HPD mice. (B) Incidence and (C) frequency of spontaneous Ca2+ waves (SCaWs). (D) The latency to the onset of SCaWs in atrial cardiomyocytes of 4 groups of mice. (E) Representative Ca2+ spark recordings. (F) Quantification of Ca2+ spark frequency (CaSF). (G) SERCA activity estimated as the decay of pacing-induced CaTs. (H) Estimation of sarcoplasmic reticulum (SR) Ca2+ load. * p < 0.05, ** p < 0.01, *** p < 0.001. p-values determined by Fisher’s exact test (one-tailed) in (B), Welch ANOVA with Dunnett’s T3 multiple comparisons test in (C), and Kruskal–Wallis with Dunn’s multiple comparisons test in (D), and nested one-way ANOVA with Sidak’s multiple comparisons text in (F).
Cells 13 00108 g005
Figure 6. High-protein diet (HPD) increases cytoplasmic dsDNA content by promoting mitochondrial damage. (A) Immunostaining of dsDNA and Tomm20 (a mitochondrial marker) in the atrial tissue of four groups of mice. White arrows point to the cytoplasmic dsDNA signal that overlapped with Tomm20 but not with DAPI. (B) Cytoplasmic dsDNA levels in atrial lysates of WT and Aim2−/− mice subjected to NC or HPD, respectively. (C) Representative images of MitoSOX staining in atrial myocytes. (D) Aggregated analysis of MitoSOX intensity. The number of cells analyzed in each group is as follows: 55 in WT-NC, 43 in WT-HPD, 34 in Aim2−/−-NC, and 26 in Aim2−/−-HPD. * p < 0.05, *** p < 0.001. p-values were determined by ordinary one-way ANOVA with Sidak’s multiple comparisons test in (B) and Kruskal–Wallis with Dunn’s multiple comparisons test in (D).
Cells 13 00108 g006
Disclaimer/Publisher’s Note: The statements, opinions and data contained in all publications are solely those of the individual author(s) and contributor(s) and not of MDPI and/or the editor(s). MDPI and/or the editor(s) disclaim responsibility for any injury to people or property resulting from any ideas, methods, instructions or products referred to in the content.