
Diagnostic and Prognostic Power of Active DNA Demethylation Pathway Intermediates in Acute Myelogenous Leukemia and Myelodysplastic Syndromes

 , , , , ,
  and
and
Abstract
:1. Introduction
2. Materials and Methods
2.1. The Determination of the Epigenetic Modifications in Urine
2.2. Isolation of DNA and the Determination of the Epigenetic Modifications in DNA Isolates
2.3. Statistical Analysis
3. Results
4. Discussion
Supplementary Materials
Author Contributions
Funding
Institutional Review Board Statement
Informed Consent Statement
Data Availability Statement
Acknowledgments
Conflicts of Interest
References
- Conway O’Brien, E.; Prideaux, S.; Chevassut, T. The epigenetic landscape of acute myeloid leukemia. Adv. Hematol. 2014, 2014, 103175. [Google Scholar] [CrossRef] [PubMed] [Green Version]
- Siveen, K.S.; Uddin, S.; Mohammad, R.M. Targeting acute myeloid leukemia stem cell signaling by natural products. Mol. Cancer 2017, 16, 13. [Google Scholar] [CrossRef] [PubMed] [Green Version]
- Vardiman, J.W.; Thiele, J.; Arber, D.A.; Brunning, R.D.; Borowitz, M.J.; Porwit, A.; Harris, N.L.; Le Beau, M.M.; Hellstrom-Lindberg, E.; Tefferi, A.; et al. The 2008 revision of the World Health Organization (WHO) classification of myeloid neoplasms and acute leukemia: Rationale and important changes. Blood 2009, 114, 937–951. [Google Scholar] [CrossRef] [PubMed] [Green Version]
- Arber, D.A.; Orazi, A.; Hasserjian, R.; Thiele, J.; Borowitz, M.J.; Le Beau, M.M.; Bloomfield, C.D.; Cazzola, M.; Vardiman, J.W. The 2016 revision to the World Health Organization classification of myeloid neoplasms and acute leukemia. Blood 2016, 127, 2391–2405. [Google Scholar] [CrossRef]
- Haase, D.; Germing, U.; Schanz, J.; Pfeilstocker, M.; Nosslinger, T.; Hildebrandt, B.; Kundgen, A.; Lubbert, M.; Kunzmann, R.; Giagounidis, A.A.; et al. New insights into the prognostic impact of the karyotype in MDS and correlation with subtypes: Evidence from a core dataset of 2124 patients. Blood 2007, 110, 4385–4395. [Google Scholar] [CrossRef]
- Garcia-Manero, G.; Chien, K.S.; Montalban-Bravo, G. Myelodysplastic syndromes: 2021 update on diagnosis, risk stratification and management. Am. J. Hematol. 2020, 95, 1399–1420. [Google Scholar] [CrossRef]
- Jabbour, E.; Takahashi, K.; Wang, X.; Cornelison, A.M.; Abruzzo, L.; Kadia, T.; Borthakur, G.; Estrov, Z.; O’Brien, S.; Mallo, M.; et al. Acquisition of cytogenetic abnormalities in patients with IPSS defined lower-risk myelodysplastic syndrome is associated with poor prognosis and transformation to acute myelogenous leukemia. Am. J. Hematol. 2013, 88, 831–837. [Google Scholar] [CrossRef] [Green Version]
- Haferlach, T.; Schmidts, I. The power and potential of integrated diagnostics in acute myeloid leukaemia. Br. J. Haematol. 2020, 188, 36–48. [Google Scholar] [CrossRef]
- Estey, E.; Hasserjian, R.P.; Dohner, H. Distinguishing AML from MDS: A fixed blast percentage may no longer be optimal. Blood 2022, 139, 323–332. [Google Scholar] [CrossRef]
- Chauhan, S.; Pradhan, S.; Mohanty, R.; Saini, A.; Devi, K.; Sahu, M.C. Evaluation of sensitivity and specificity of bone marrow trephine biopsy tests in an Indian teaching hospital. Alex. J. Med. 2018, 54, 161–166. [Google Scholar] [CrossRef]
- Naqvi, K.; Jabbour, E.; Bueso-Ramos, C.; Pierce, S.; Borthakur, G.; Estrov, Z.; Ravandi, F.; Faderl, S.; Kantarjian, H.; Garcia-Manero, G. Implications of discrepancy in morphologic diagnosis of myelodysplastic syndrome between referral and tertiary care centers. Blood 2011, 118, 4690–4693. [Google Scholar] [CrossRef] [PubMed]
- Della Porta, M.G.; Travaglino, E.; Boveri, E.; Ponzoni, M.; Malcovati, L.; Papaemmanuil, E.; Rigolin, G.M.; Pascutto, C.; Croci, G.; Gianelli, U.; et al. Minimal morphological criteria for defining bone marrow dysplasia: A basis for clinical implementation of WHO classification of myelodysplastic syndromes. Leukemia 2015, 29, 66–75. [Google Scholar] [CrossRef] [PubMed]
- DiNardo, C.D.; Garcia-Manero, G.; Kantarjian, H.M. Time to blur the blast boundaries. Cancer 2022. [Google Scholar] [CrossRef]
- O’Brien, E.C.; Brewin, J.; Chevassut, T. DNMT3A: The DioNysian MonsTer of acute myeloid leukaemia. Ther Adv. Hematol. 2014, 5, 187–196. [Google Scholar] [CrossRef] [PubMed] [Green Version]
- Kohli, R.M.; Zhang, Y. TET enzymes, TDG and the dynamics of DNA demethylation. Nature 2013, 502, 472–479. [Google Scholar] [CrossRef] [Green Version]
- Song, C.X.; He, C. Potential functional roles of DNA demethylation intermediates. Trends Biochem. Sci. 2013, 38, 480–484. [Google Scholar] [CrossRef] [PubMed] [Green Version]
- Bhutani, N.; Burns, D.M.; Blau, H.M. DNA Demethylation Dynamics. Cell 2011, 146, 866–872. [Google Scholar] [CrossRef] [Green Version]
- Cooke, M.S.; Evans, M.D.; Dove, R.; Rozalski, R.; Gackowski, D.; Siomek, A.; Lunec, J.; Olinski, R. DNA repair is responsible for the presence of oxidatively damaged DNA lesions in urine. Mutat. Res. Fundam. Mol. Mech. Mutagen. 2005, 574, 58–66. [Google Scholar] [CrossRef]
- Kroeze, L.I.; Aslanyan, M.G.; van Rooij, A.; Koorenhof-Scheele, T.N.; Massop, M.; Carell, T.; Boezeman, J.B.; Marie, J.P.; Halkes, C.J.; de Witte, T.; et al. Characterization of acute myeloid leukemia based on levels of global hydroxymethylation. Blood 2014, 124, 1110–1118. [Google Scholar] [CrossRef] [Green Version]
- Gurnari, C.; Pagliuca, S.; Guan, Y.; Adema, V.; Hershberger, C.E.; Ni, Y.; Awada, H.; Kongkiatkamon, S.; Zawit, M.; Coutinho, D.; et al. TET2 mutations as a part of DNA dioxygenase deficiency in myelodysplastic syndromes. Blood Adv. 2022, 6, 100–107. [Google Scholar] [CrossRef]
- Rozalski, R.; Gackowski, D.; Skalska-Bugala, A.; Starczak, M.; Siomek-Gorecka, A.; Zarakowska, E.; Modrzejewska, M.; Dziaman, T.; Szpila, A.; Linowiecka, K.; et al. The urinary excretion of epigenetically modified DNA as a marker of pediatric ALL status and chemotherapy response. Sci. Rep. 2021, 11, 21345. [Google Scholar] [CrossRef] [PubMed]
- Rozalski, R.; Gackowski, D.; Siomek-Gorecka, A.; Starczak, M.; Modrzejewska, M.; Banaszkiewicz, Z.; Olinski, R. Urinary 5-hydroxymethyluracil and 8-oxo-7,8-dihydroguanine as potential biomarkers in patients with colorectal cancer. Biomarkers 2015, 20, 287–291. [Google Scholar] [CrossRef]
- Gackowski, D.; Starczak, M.; Zarakowska, E.; Modrzejewska, M.; Szpila, A.; Banaszkiewicz, Z.; Olinski, R. Accurate, Direct, and High-Throughput Analyses of a Broad Spectrum of Endogenously Generated DNA Base Modifications with Isotope-Dilution Two-Dimensional Ultraperformance Liquid Chromatography with Tandem Mass Spectrometry: Possible Clinical Implication. Anal. Chem. 2016, 88, 12128–12136. [Google Scholar] [CrossRef] [PubMed]
- Starczak, M.; Gawronski, M.; Olinski, R.; Gackowski, D. Quantification of DNA Modifications Using Two-Dimensional Ultraperformance Liquid Chromatography Tandem Mass Spectrometry (2D-UPLC-MS/MS). Methods Mol. Biol. 2021, 2198, 91–108. [Google Scholar] [CrossRef]
- Jankowska, A.M.; Szpurka, H.; Tiu, R.V.; Makishima, H.; Afable, M.; Huh, J.; O’Keefe, C.L.; Ganetzky, R.; McDevitt, M.A.; Maciejewski, J.P. Loss of heterozygosity 4q24 and TET2 mutations associated with myelodysplastic/myeloproliferative neoplasms. Blood 2009, 113, 6403–6410. [Google Scholar] [CrossRef] [Green Version]
- Ko, M.; Huang, Y.; Jankowska, A.M.; Pape, U.J.; Tahiliani, M.; Bandukwala, H.S.; An, J.; Lamperti, E.D.; Koh, K.P.; Ganetzky, R.; et al. Impaired hydroxylation of 5-methylcytosine in myeloid cancers with mutant TET2. Nature 2010, 468, 839–843. [Google Scholar] [CrossRef] [PubMed] [Green Version]
- Iyer, L.M.; Tahiliani, M.; Rao, A.; Aravind, L. Prediction of novel families of enzymes involved in oxidative and other complex modifications of bases in nucleic acids. Cell Cycle 2009, 8, 1698–1710. [Google Scholar] [CrossRef] [Green Version]
- Loenarz, C.; Schofield, C.J. Expanding chemical biology of 2-oxoglutarate oxygenases. Nat. Chem. Biol. 2008, 4, 152–156. [Google Scholar] [CrossRef]
- Wu, H.; Zhang, Y. Reversing DNA Methylation: Mechanisms, Genomics, and Biological Functions. Cell 2014, 156, 45–68. [Google Scholar] [CrossRef] [Green Version]
- Spruijt, C.G.; Gnerlich, F.; Smits, A.H.; Pfaffeneder, T.; Jansen, P.W.T.C.; Bauer, C.; Munzel, M.; Wagner, M.; Muller, M.; Khan, F.; et al. Dynamic Readers for 5-(Hydroxy)Methylcytosine and Its Oxidized Derivatives. Cell 2013, 152, 1146–1159. [Google Scholar] [CrossRef] [Green Version]
- Shukla, A.; Sehgal, M.; Singh, T.R. Hydroxymethylation and its potential implication in DNA repair system: A review and future perspectives. Gene 2015, 564, 109–118. [Google Scholar] [CrossRef] [PubMed]
- Bachman, M.; Uribe-Lewis, S.; Yang, X.P.; Burgess, H.E.; Iurlaro, M.; Reik, W.; Murrell, A.; Balasubramanian, S. 5-Formylcytosine can be a stable DNA modification in mammals. Nat. Chem. Biol. 2015, 11, 555–557. [Google Scholar] [CrossRef] [PubMed] [Green Version]
- Bachman, M.; Uribe-Lewis, S.; Yang, X.P.; Williams, M.; Murrell, A.; Balasubramanian, S. 5-Hydroxymethylcytosine is a predominantly stable DNA modification. Nat. Chem. 2014, 6, 1049–1055. [Google Scholar] [CrossRef] [PubMed] [Green Version]
- Iurlaro, M.; Ficz, G.; Oxley, D.; Raiber, E.A.; Bachman, M.; Booth, M.J.; Andrews, S.; Balasubramanian, S.; Reik, W. A screen for hydroxymethylcytosine and formylcytosine binding proteins suggests functions in transcription and chromatin regulation. Genome Biol. 2013, 14, 1–11. [Google Scholar] [CrossRef] [Green Version]
- Parker, M.J.; Weigele, P.R.; Saleh, L. Insights into the Biochemistry, Evolution, and Biotechnological Applications of the Ten-Eleven Translocation (TET) Enzymes. Biochemistry 2019, 58, 450–467. [Google Scholar] [CrossRef] [Green Version]
- Schiesser, S.; Hackner, B.; Pfaffeneder, T.; Muller, M.; Hagemeier, C.; Truss, M.; Carell, T. Mechanism and Stem-Cell Activity of 5-Carboxycytosine Decarboxylation Determined by Isotope Tracing. Angew. Chem. Int. Ed. 2012, 51, 6516–6520. [Google Scholar] [CrossRef]
- Munzel, M.; Lischke, U.; Stathis, D.; Pfaffeneder, T.; Gnerlich, F.A.; Deiml, C.A.; Koch, S.C.; Karaghiosoff, K.; Carell, T. Improved Synthesis and Mutagenicity of Oligonucleotides Containing 5-Hydroxymethylcytosine, 5-Formylcytosine and 5-Carboxylcytosine. Chem. Eur. J. 2011, 17, 13782–13788. [Google Scholar] [CrossRef]
- He, Y.F.; Li, B.Z.; Li, Z.; Liu, P.; Wang, Y.; Tang, Q.Y.; Ding, J.P.; Jia, Y.Y.; Chen, Z.C.; Li, L.; et al. Tet-Mediated Formation of 5-Carboxylcytosine and Its Excision by TDG in Mammalian DNA. Science 2011, 333, 1303–1307. [Google Scholar] [CrossRef] [Green Version]
- Maiti, A.; Drohat, A.C. Thymine DNA Glycosylase Can Rapidly Excise 5-Formylcytosine and 5-Carboxylcytosine potential implications for active demethylation of CpG sites. J. Biol. Chem. 2011, 286, 35334–35338. [Google Scholar] [CrossRef] [Green Version]
- Olinski, R.; Starczak, M.; Gackowski, D. Enigmatic 5-hydroxymethyluracil: Oxidatively modified base, epigenetic mark or both? Mutat Res. Rev. Mutat. 2016, 767, 59–66. [Google Scholar] [CrossRef]
- Franchini, D.M.; Chan, C.F.; Morgan, H.; Incorvaia, E.; Rangam, G.; Dean, W.; Santos, F.; Reik, W.; Petersen-Mahrt, S.K. Processive DNA Demethylation via DNA Deaminase-Induced Lesion Resolution. PLoS ONE 2014, 9, e97754. [Google Scholar] [CrossRef] [PubMed] [Green Version]
- Grin, I.; Ishchenko, A.A. An interplay of the base excision repair and mismatch repair pathways in active DNA demethylation. Nucleic Acids Res. 2016, 44, 3713–3727. [Google Scholar] [CrossRef]
- Steensma, D.P.; Bennett, J.M. The myelodysplastic syndromes: Diagnosis and treatment. Mayo Clin. Proc. 2006, 81, 104–130. [Google Scholar] [CrossRef] [PubMed]
- Haferlach, T.; Nagata, Y.; Grossmann, V.; Okuno, Y.; Bacher, U.; Nagae, G.; Schnittger, S.; Sanada, M.; Kon, A.; Alpermann, T.; et al. Landscape of genetic lesions in 944 patients with myelodysplastic syndromes. Leukemia 2014, 28, 241–247. [Google Scholar] [CrossRef] [PubMed] [Green Version]
- Issa, J.P. The myelodysplastic syndrome as a prototypical epigenetic disease. Blood 2013, 121, 3811–3817. [Google Scholar] [CrossRef] [PubMed] [Green Version]
- Sperling, A.S.; Gibson, C.J.; Ebert, B.L. The genetics of myelodysplastic syndrome: From clonal haematopoiesis to secondary leukaemia. Nat. Rev. Cancer 2017, 17, 5–19. [Google Scholar] [CrossRef] [Green Version]
- Medeiros, B.C.; Fathi, A.T.; DiNardo, C.D.; Pollyea, D.A.; Chan, S.M.; Swords, R. Isocitrate dehydrogenase mutations in myeloid malignancies. Leukemia 2017, 31, 272–281. [Google Scholar] [CrossRef]
- Xu, W.; Yang, H.; Liu, Y.; Yang, Y.; Wang, P.; Kim, S.H.; Ito, S.; Yang, C.; Wang, P.; Xiao, M.T.; et al. Oncometabolite 2-hydroxyglutarate is a competitive inhibitor of alpha-ketoglutarate-dependent dioxygenases. Cancer Cell 2011, 19, 17–30. [Google Scholar] [CrossRef] [Green Version]


| Number of Patients, n (%) | ||
|---|---|---|
| MDS patients | 44 | |
| Age | <60 years | 8 (19) |
| ≥60 years | 34 (81) | |
| Sex | Male | 24 (55) |
| Female | 20 (45) | |
| BM blast count | <5% | 12 (39) |
| 5–10% | 8 (26) | |
| 11–20% | 11 (35) | |
| WHO subtype | RA | 1 (2) |
| RARS | 1 (2) | |
| RCMD | 10 (22) | |
| ‘5q−syndrome’ | 1 (2) | |
| RAEB-1 | 7 (17) | |
| RAEB-2 | 14 (35) | |
| MDS-U | 9 (20) | |
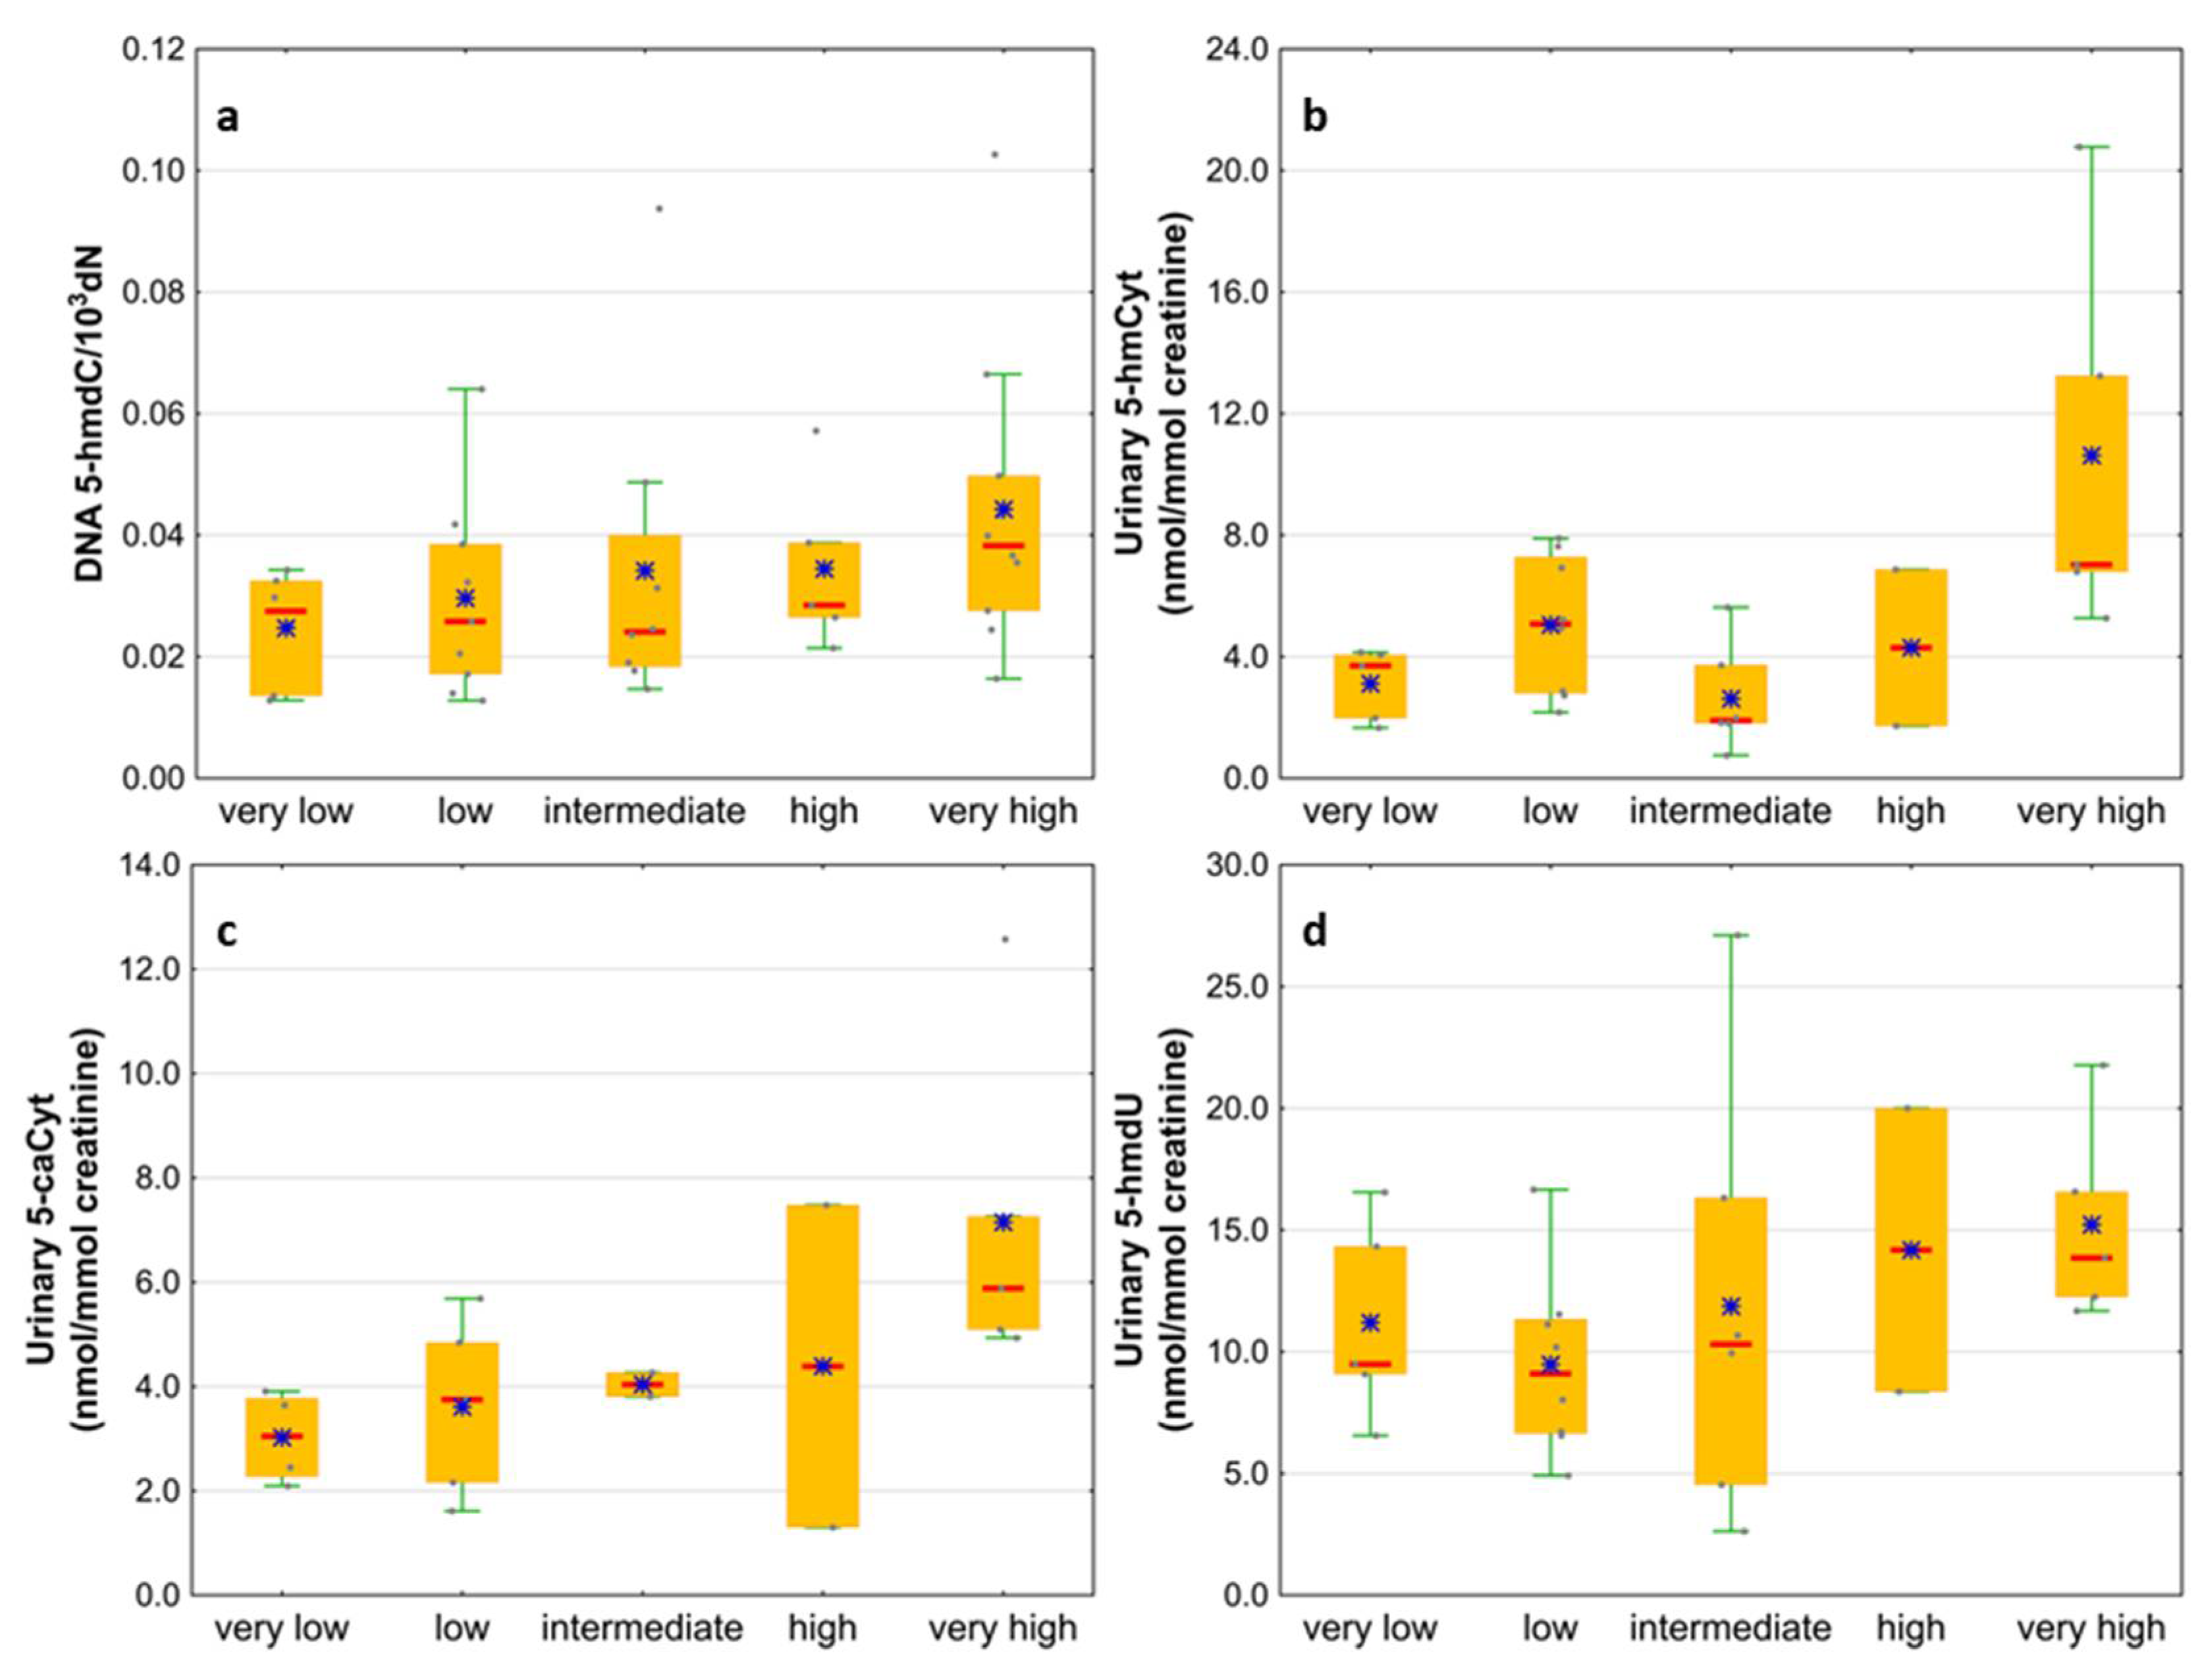
| IPSS-R risk group | Very low | 6 (16) |
| Low | 9 (24) | |
| Intermediate | 8 (21) | |
| High | 5 (13) | |
| Very high | 10 (26) | |
| Cytogenetic risk group | Low | 25 (71) |
| Intermediate | 5 (14) | |
| High | 5 (14) | |
| AML patients | 65 | |
| Age | <60 years | 24 (40) |
| ≥60 years | 40 (63) | |
| Sex | Male | 33 (51) |
| Female | 32 (49) | |
| BM blast count | 20–29% | 6 (32) |
| >30% | 13 (68) | |
| Cytogenetic risk group | Low | 8 (18) |
| Intermediate | 27 (61) | |
| High | 9 (20) |
| AML | MDS | CONTROL | AML vs. CONTROL | MDS vs. CONTROL | AML vs. MDS | ||
|---|---|---|---|---|---|---|---|
| Mean ± SD | t-Student Test | ||||||
| Median (Interquartile Range) | U-Mann–Whitney Test | ||||||
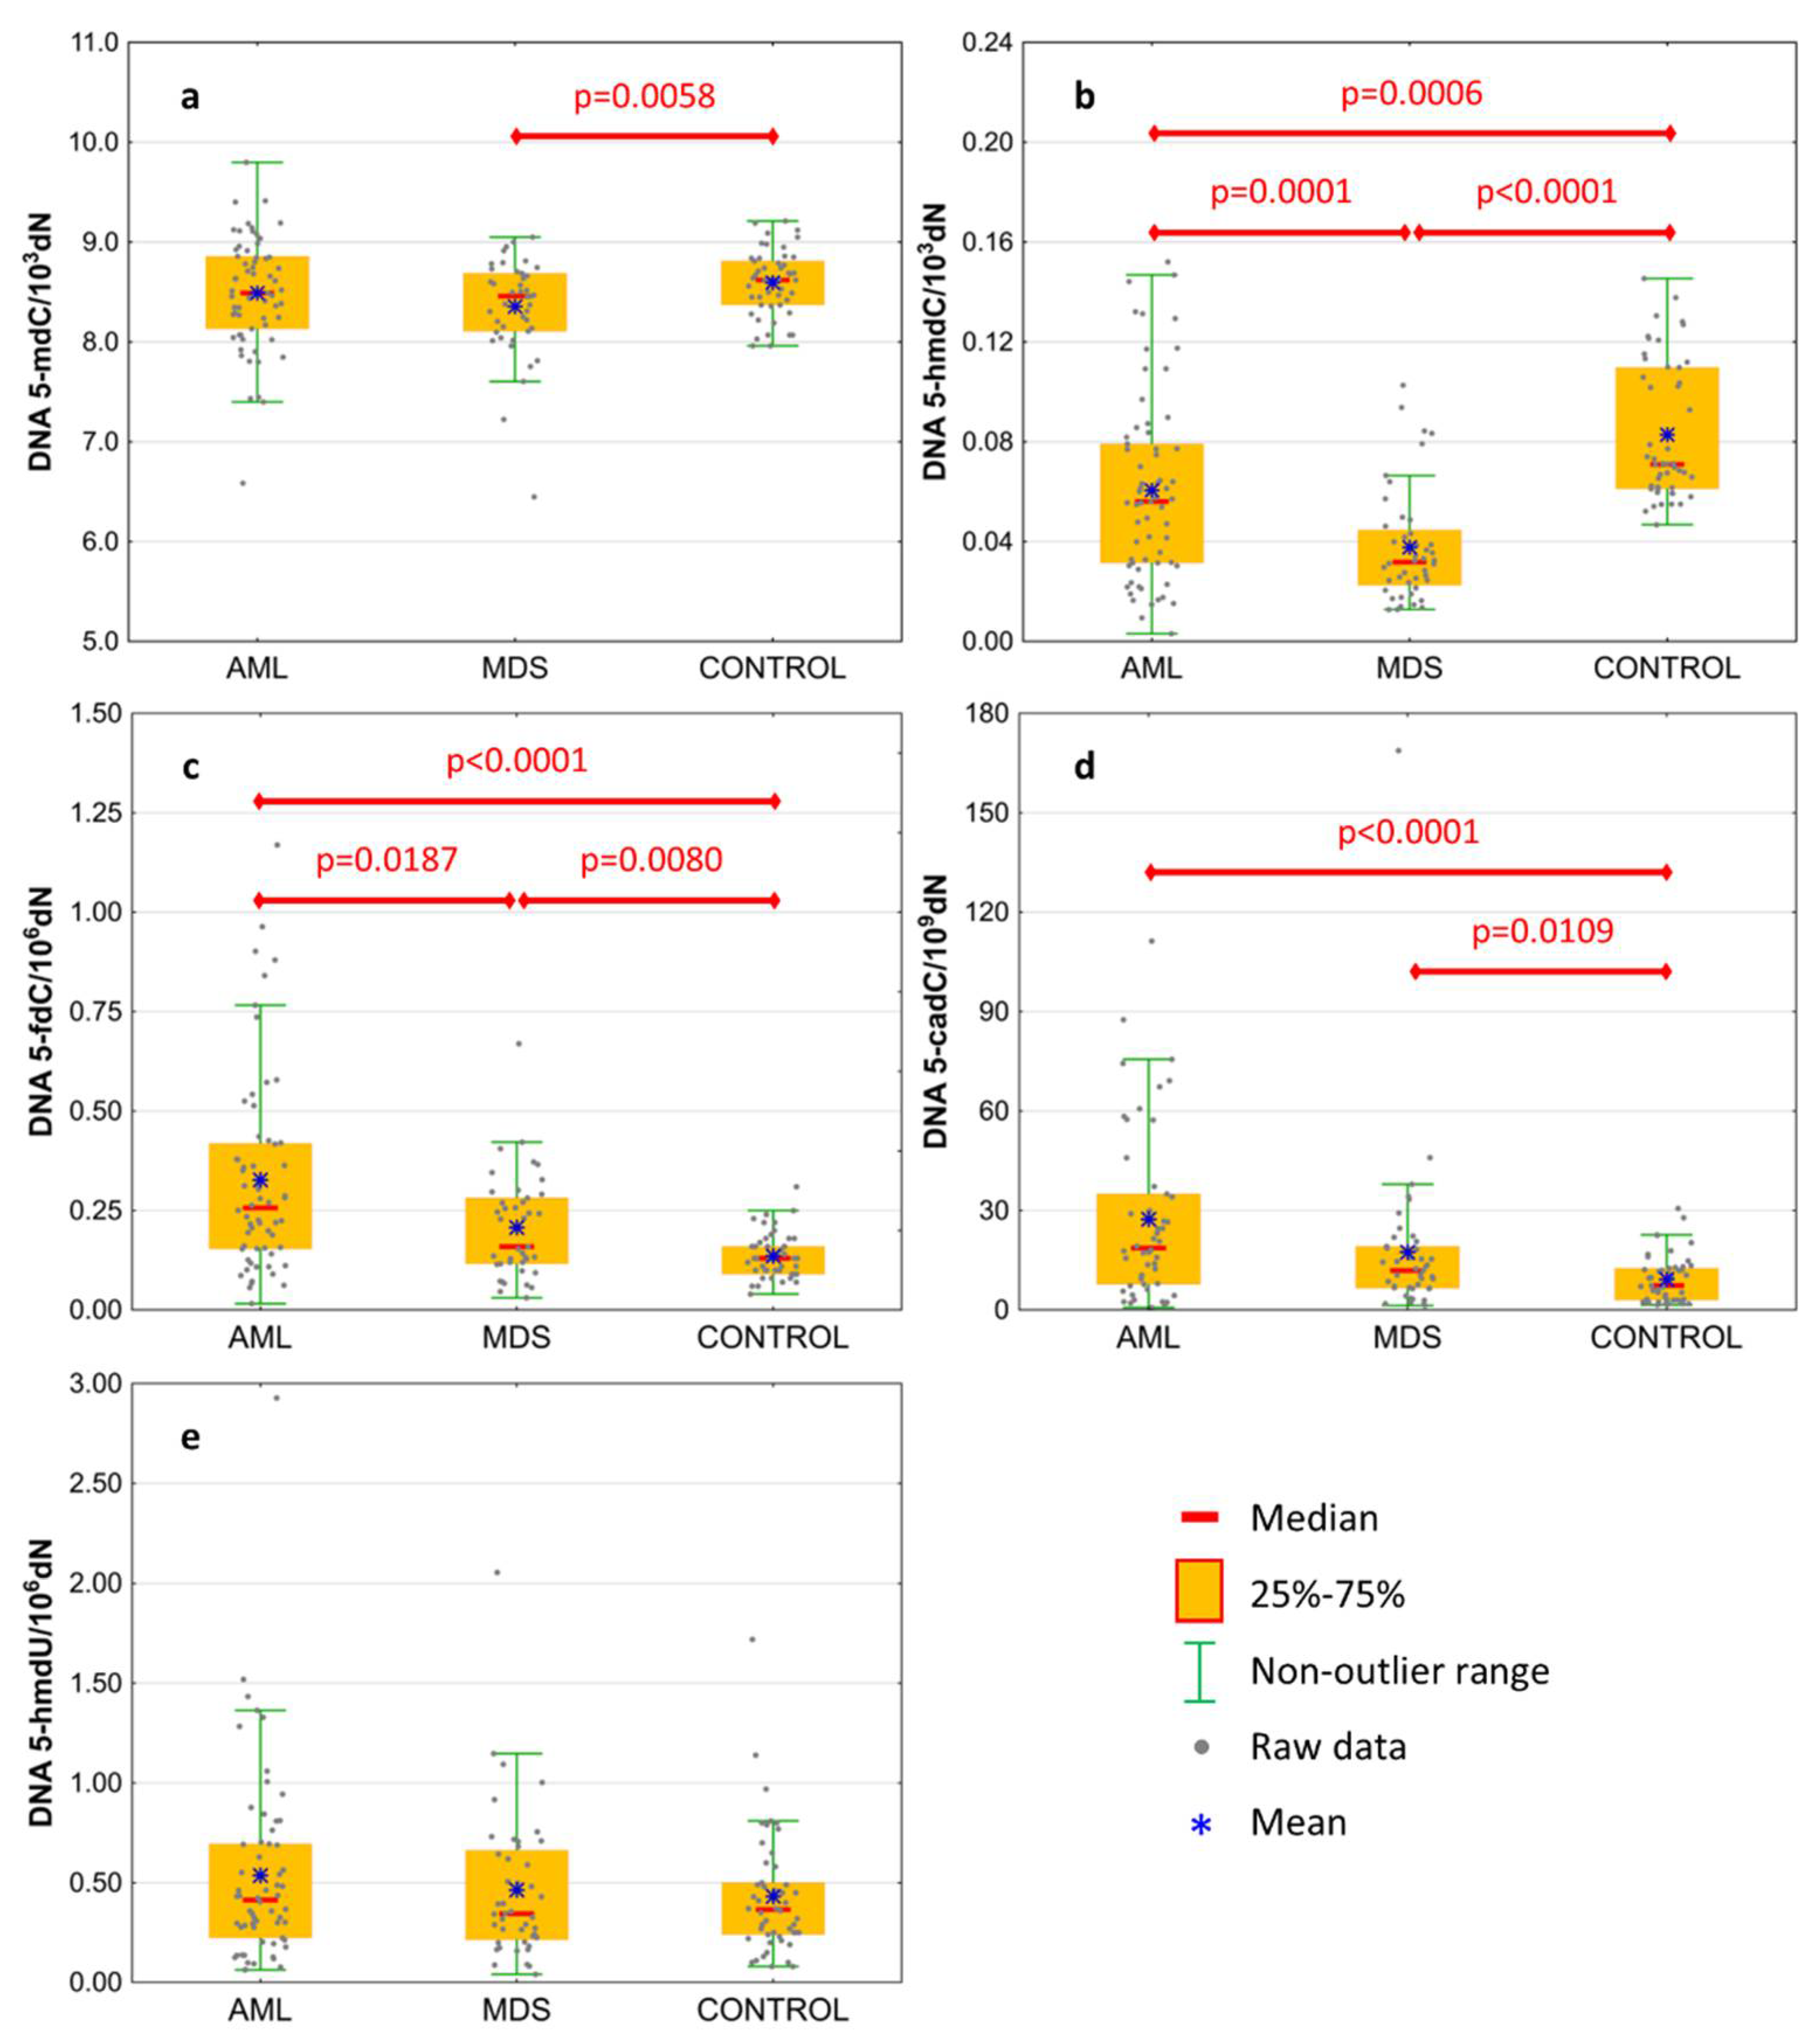
| DNA | 5-methyl-2′-deoxycytidine | 8.49 ± 0.56 | 8.354 ± 0.491 | 8.594 ± 0.322 | 0.2148 | 0.0058 | 0.2018 |
| 8.49 (8.132;8.859) | 8.459 (8.106;8.687) | 8.622 (8.372;8.805) | 0.3446 | 0.0190 | 0.2096 | ||
| DNA | 5-(hydroxymethyl)-2′-deoxycytidine | 0.061 ± 0.037 | 0.038 ± 0.023 | 0.083 ± 0.028 | 0.0006 | <0.0001 | 0.0001 |
| 0.056 (0.031;0.079) | 0.032 (0.023;0.045) | 0.071 (0.061;0.11) | 0.0002 | <0.0001 | 0.0010 | ||
| DNA | 5-formyl-2′-deoxycytidine | 0.327 ± 0.253 | 0.208 ± 0.131 | 0.136 ± 0.057 | <0.0001 | 0.0080 | 0.0187 |
| 0.257 (0.154;0.419) | 0.159 (0.116;0.282) | 0.131 (0.094;0.164) | <0.0001 | 0.0130 | 0.0215 | ||
| DNA | 5-carboxy-2′-deoxycytidine | 27.371 ± 25.802 | 17.446 ± 25.789 | 9.234 ± 7.16 | <0.0001 | 0.0109 | 0.0618 |
| 18.678 (7.749;34.981) | 11.915 (6.587;19.176) | 7.353 (2.983;12.601) | <0.0001 | 0.0197 | 0.0295 | ||
| DNA | 5-(hydroxymethyl)-2′-deoxyuridine | 0.536 ± 0.478 | 0.463 ± 0.372 | 0.431 ± 0.306 | 0.3592 | 0.8438 | 0.7834 |
| 0.414 (0.222;0.695) | 0.344 (0.214;0.663) | 0.363 (0.235;0.498) | 0.3880 | 0.9728 | 0.4866 | ||
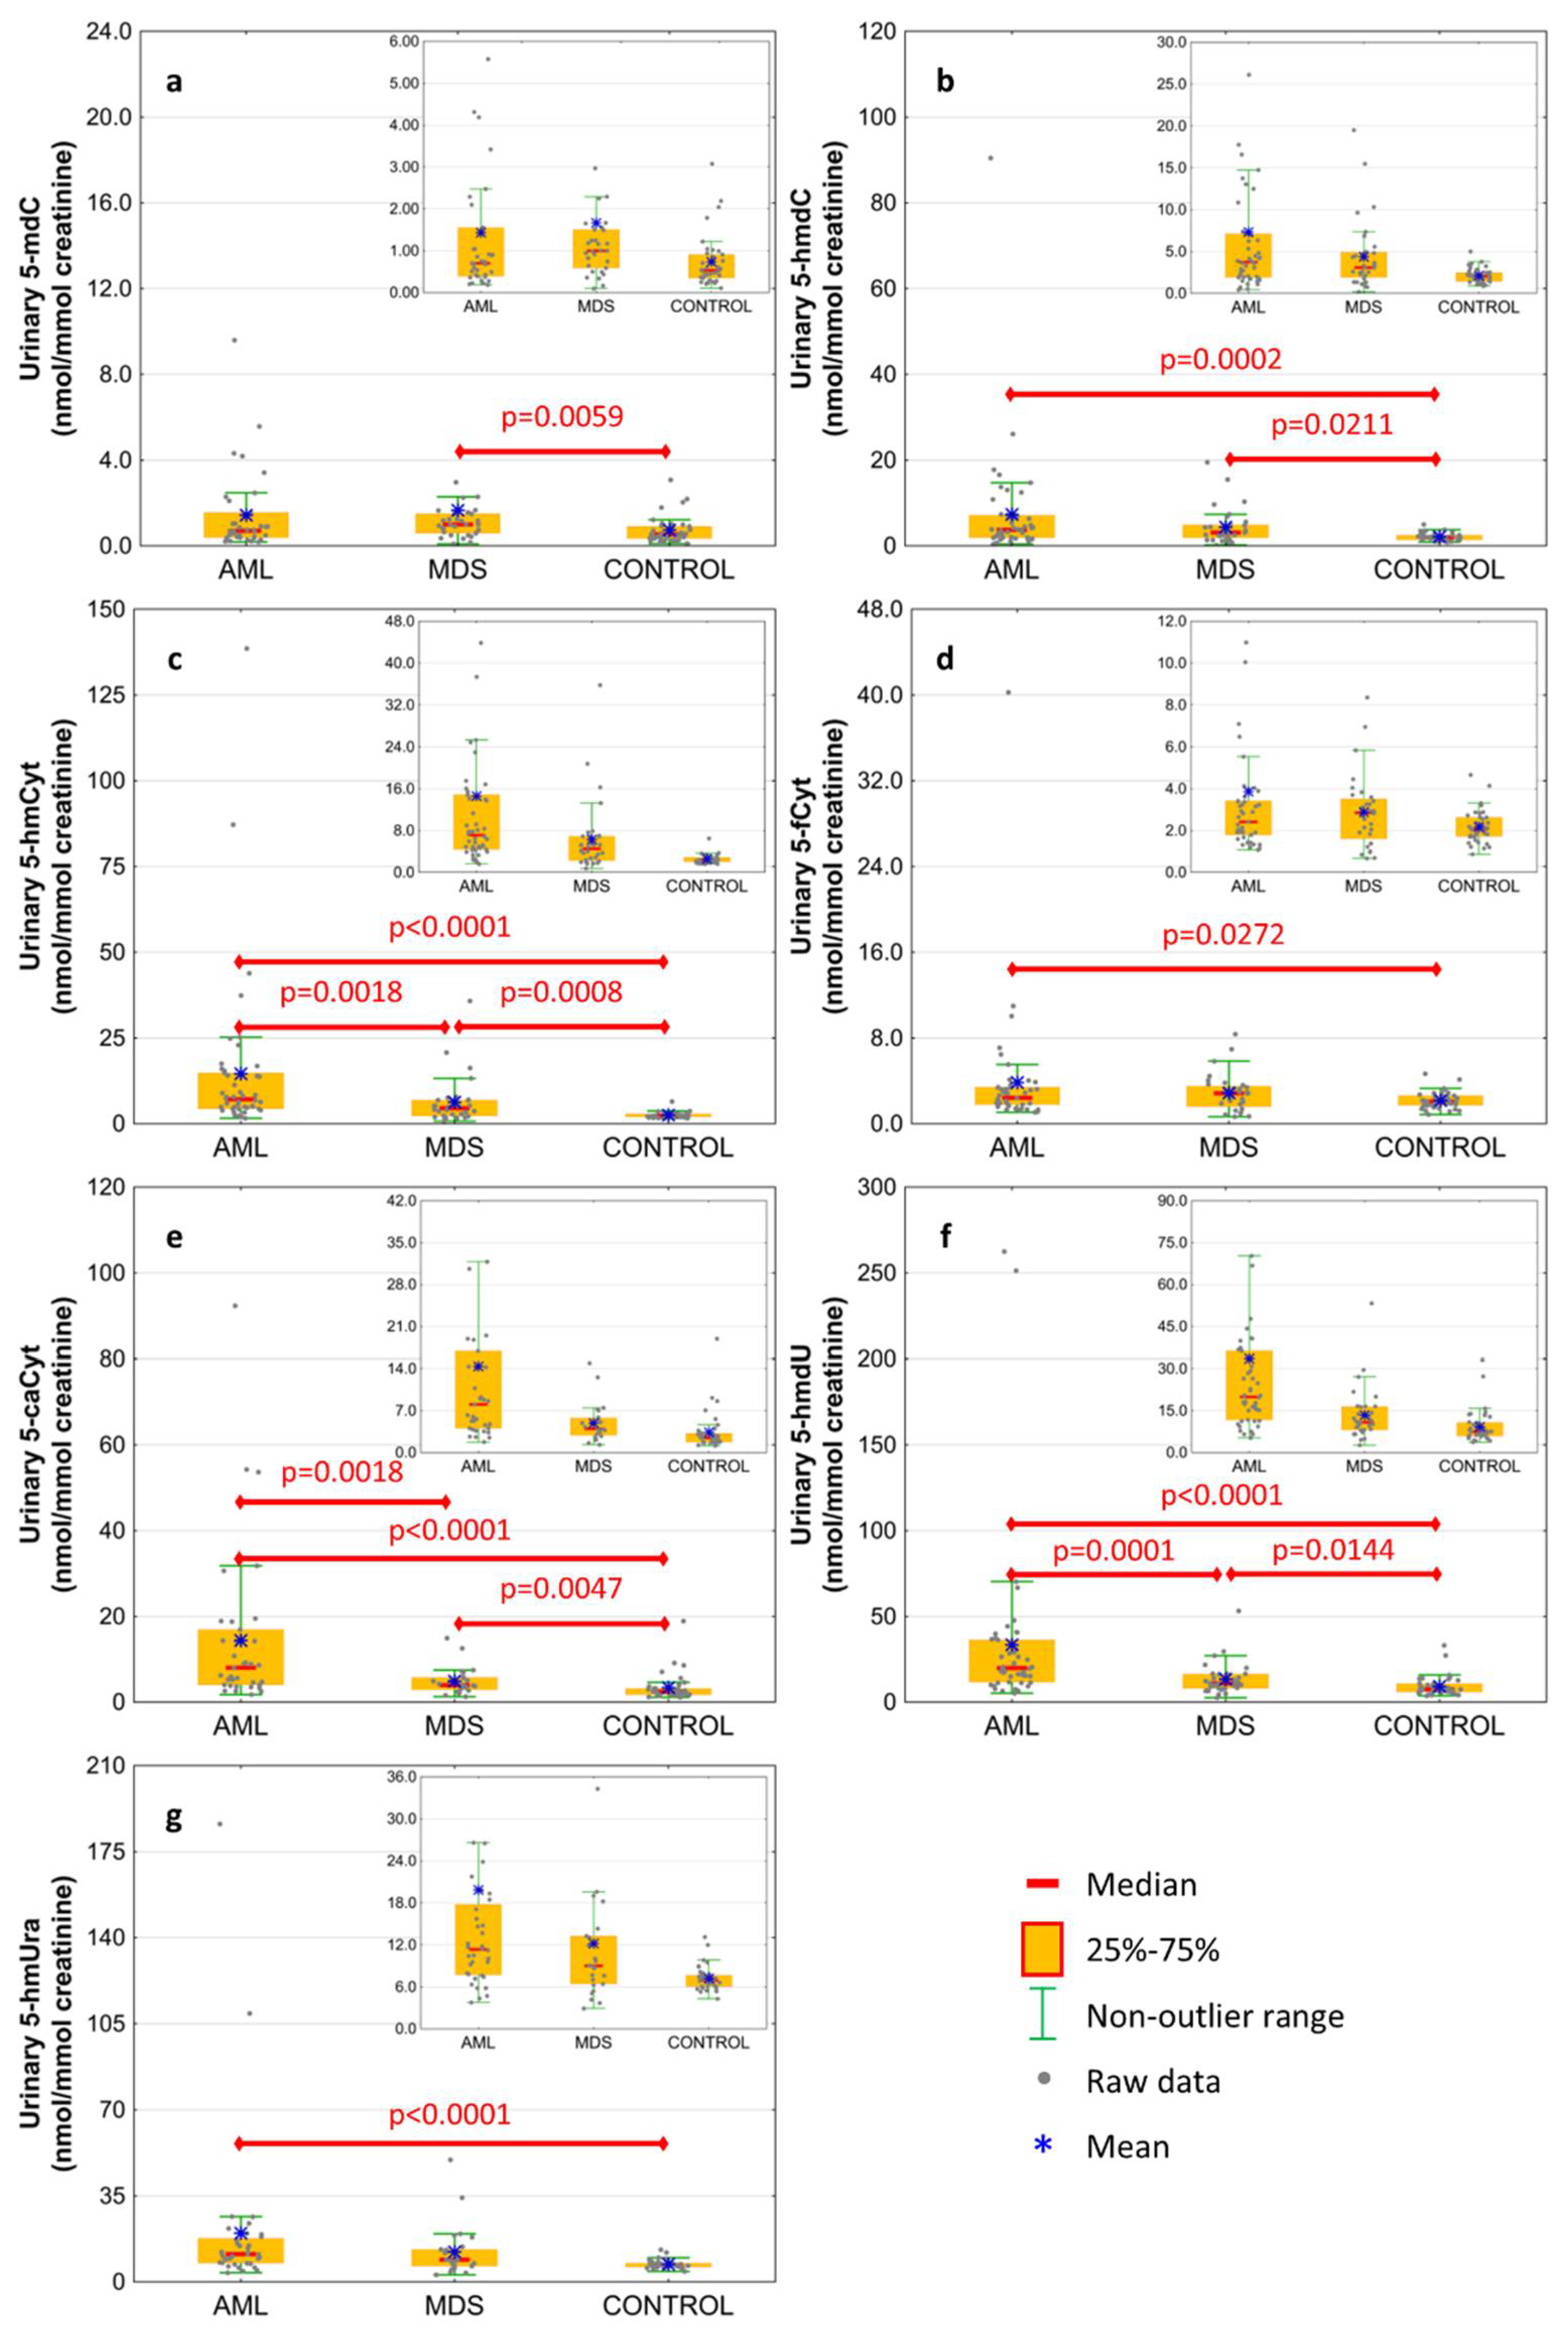
| urine | 5-methyl-2′-deoxycytidine | 1.435 ± 1.936 | 1.663 ± 3.339 | 0.734 ± 0.623 | 0.0955 | 0.0059 | 0.3664 |
| 0.701 (0.389;1.554) | 1 (0.587;1.506) | 0.534 (0.346;0.908) | 0.1983 | 0.0043 | 0.2174 | ||
| urine | 5-(hydroxymethyl)-2′-deoxycytidine | 7.338 ± 13.642 | 4.377 ± 4.228 | 2.136 ± 0.869 | 0.0002 | 0.0211 | 0.3459 |
| 3.746 (1.902;7.138) | 3.086 (1.917;4.913) | 2.032 (1.439;2.488) | 0.0005 | 0.0053 | 0.4311 | ||
| urine | 5-hydroxymethylcytosine | 14.594 ± 23.616 | 6.307 ± 6.906 | 2.55 ± 0.865 | <0.0001 | 0.0008 | 0.0018 |
| 7.142 (4.394;14.866) | 4.543 (2.288;6.901) | 2.344 (2.047;2.866) | <0.0001 | 0.0004 | 0.0044 | ||
| urine | 5-formylcytosine | 3.858 ± 5.936 | 2.88 ± 1.741 | 2.174 ± 0.789 | 0.0272 | 0.3259 | 0.4543 |
| 2.419 (1.793;3.42) | 2.853 (1.607;3.507) | 2.062 (1.713;2.626) | 0.0669 | 0.0554 | 0.8809 | ||
| urine | 5-carboxycytosine | 14.403 ± 18.667 | 4.918 ± 3.226 | 3.397 ± 3.275 | <0.0001 | 0.0047 | 0.0018 |
| 8.042 (4.055;16.928) | 3.977 (2.91;5.785) | 2.453 (1.746;3.195) | <0.0001 | 0.0026 | 0.0031 | ||
| urine | 5-(hydroxymethyl)-2′-deoxyuridine | 33.514 ± 50.361 | 13.399 ± 9.518 | 9.223 ± 5.956 | <0.0001 | 0.0144 | 0.0001 |
| 19.942 (11.7;36.332) | 10.904 (8.093;16.438) | 7.518 (5.931;10.78) | <0.0001 | 0.0049 | 0.0002 | ||
| urine | 5-hydroxymethyluracil | 19.84 ± 33.341 | 12.197 ± 10.309 | 7.227 ± 1.746 | <0.0001 | 0.0708 | 0.1528 |
| 11.341 (7.718;17.778) | 9.018 (6.428;13.269) | 6.921 (6.052;7.658) | <0.0001 | 0.0160 | 0.1570 | ||
| AML vs. CONTROL | |||||||||||
|---|---|---|---|---|---|---|---|---|---|---|---|
| AUC | SE | p | S/D | Cut-Off | Sensitivity | Specificity | Accuracy | PPV | NPV | ||
| DNA | 5-methyl-2′-deoxycytidine | 0.552 | 0.054 | 0.3394 | D | ||||||
| DNA | 5-(hydroxymethyl)-2′-deoxycytidine | 0.702 | 0.049 | <0.0001 | D | 0.049 | 43% | 98% | 67% | 97% | 57% |
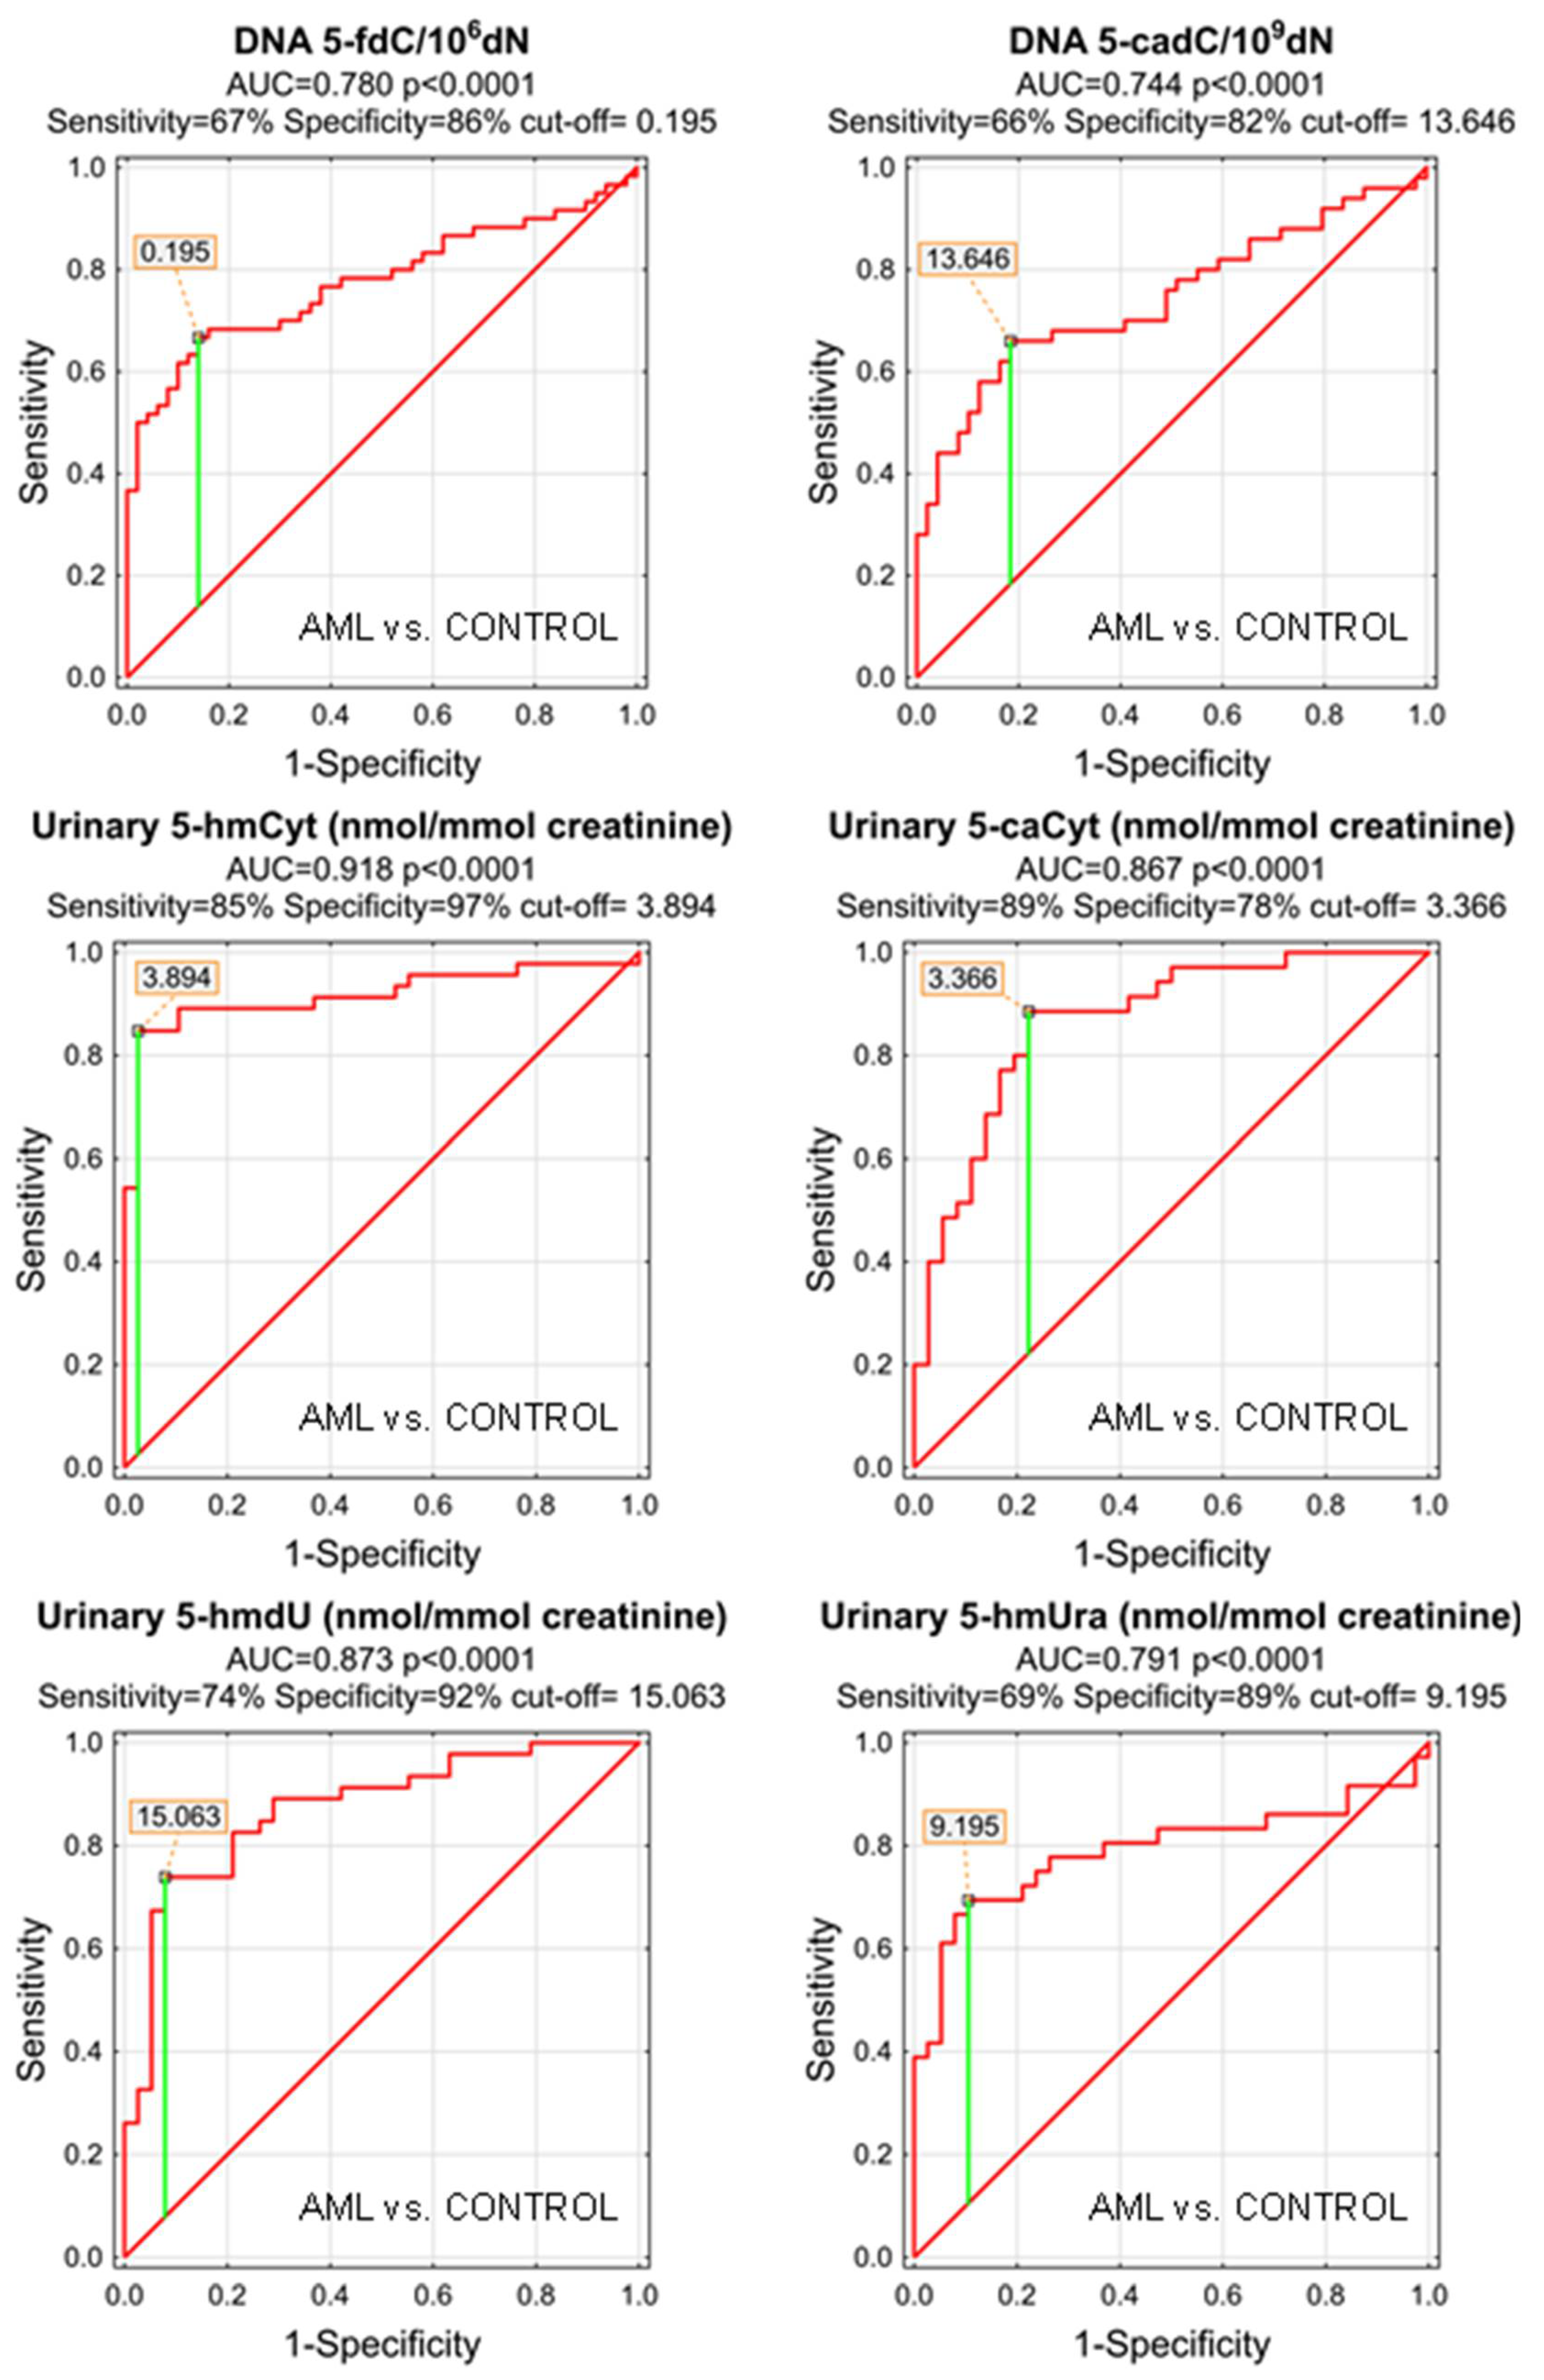
| DNA | 5-formyl-2′-deoxycytidine | 0.780 | 0.045 | <0.0001 | S | 0.195 | 67% | 86% | 75% | 85% | 68% |
| DNA | 5-carboxy-2′-deoxycytidine | 0.744 | 0.051 | <0.0001 | S | 13.64 | 66% | 82% | 74% | 79% | 70% |
| DNA | 5-(hydroxymethyl)-2′-deoxyuridine | 0.547 | 0.054 | 0.3890 | S | ||||||
| urine | 5-methyl-2′-deoxycytidine | 0.588 | 0.067 | 0.1898 | S | ||||||
| urine | 5-(hydroxymethyl)-2′-deoxycytidine | 0.723 | 0.057 | 0.0001 | S | 3.627 | 54% | 95% | 73% | 93% | 63% |
| urine | 5-hydroxymethylcytosine | 0.918 | 0.033 | <0.0001 | S | 3.894 | 85% | 97% | 90% | 98% | 84% |
| urine | 5-formylcytosine | 0.618 | 0.062 | 0.0581 | S | ||||||
| urine | 5-carboxycytosine | 0.867 | 0.043 | <0.0001 | S | 3.366 | 89% | 78% | 83% | 79% | 88% |
| urine | 5-(hydroxymethyl)-2′-deoxyuridine | 0.873 | 0.039 | <0.0001 | S | 15.063 | 74% | 92% | 82% | 92% | 74% |
| urine | 5-hydroxymethyluracil | 0.791 | 0.058 | <0.0001 | S | 9.195 | 69% | 89% | 80% | 86% | 76% |
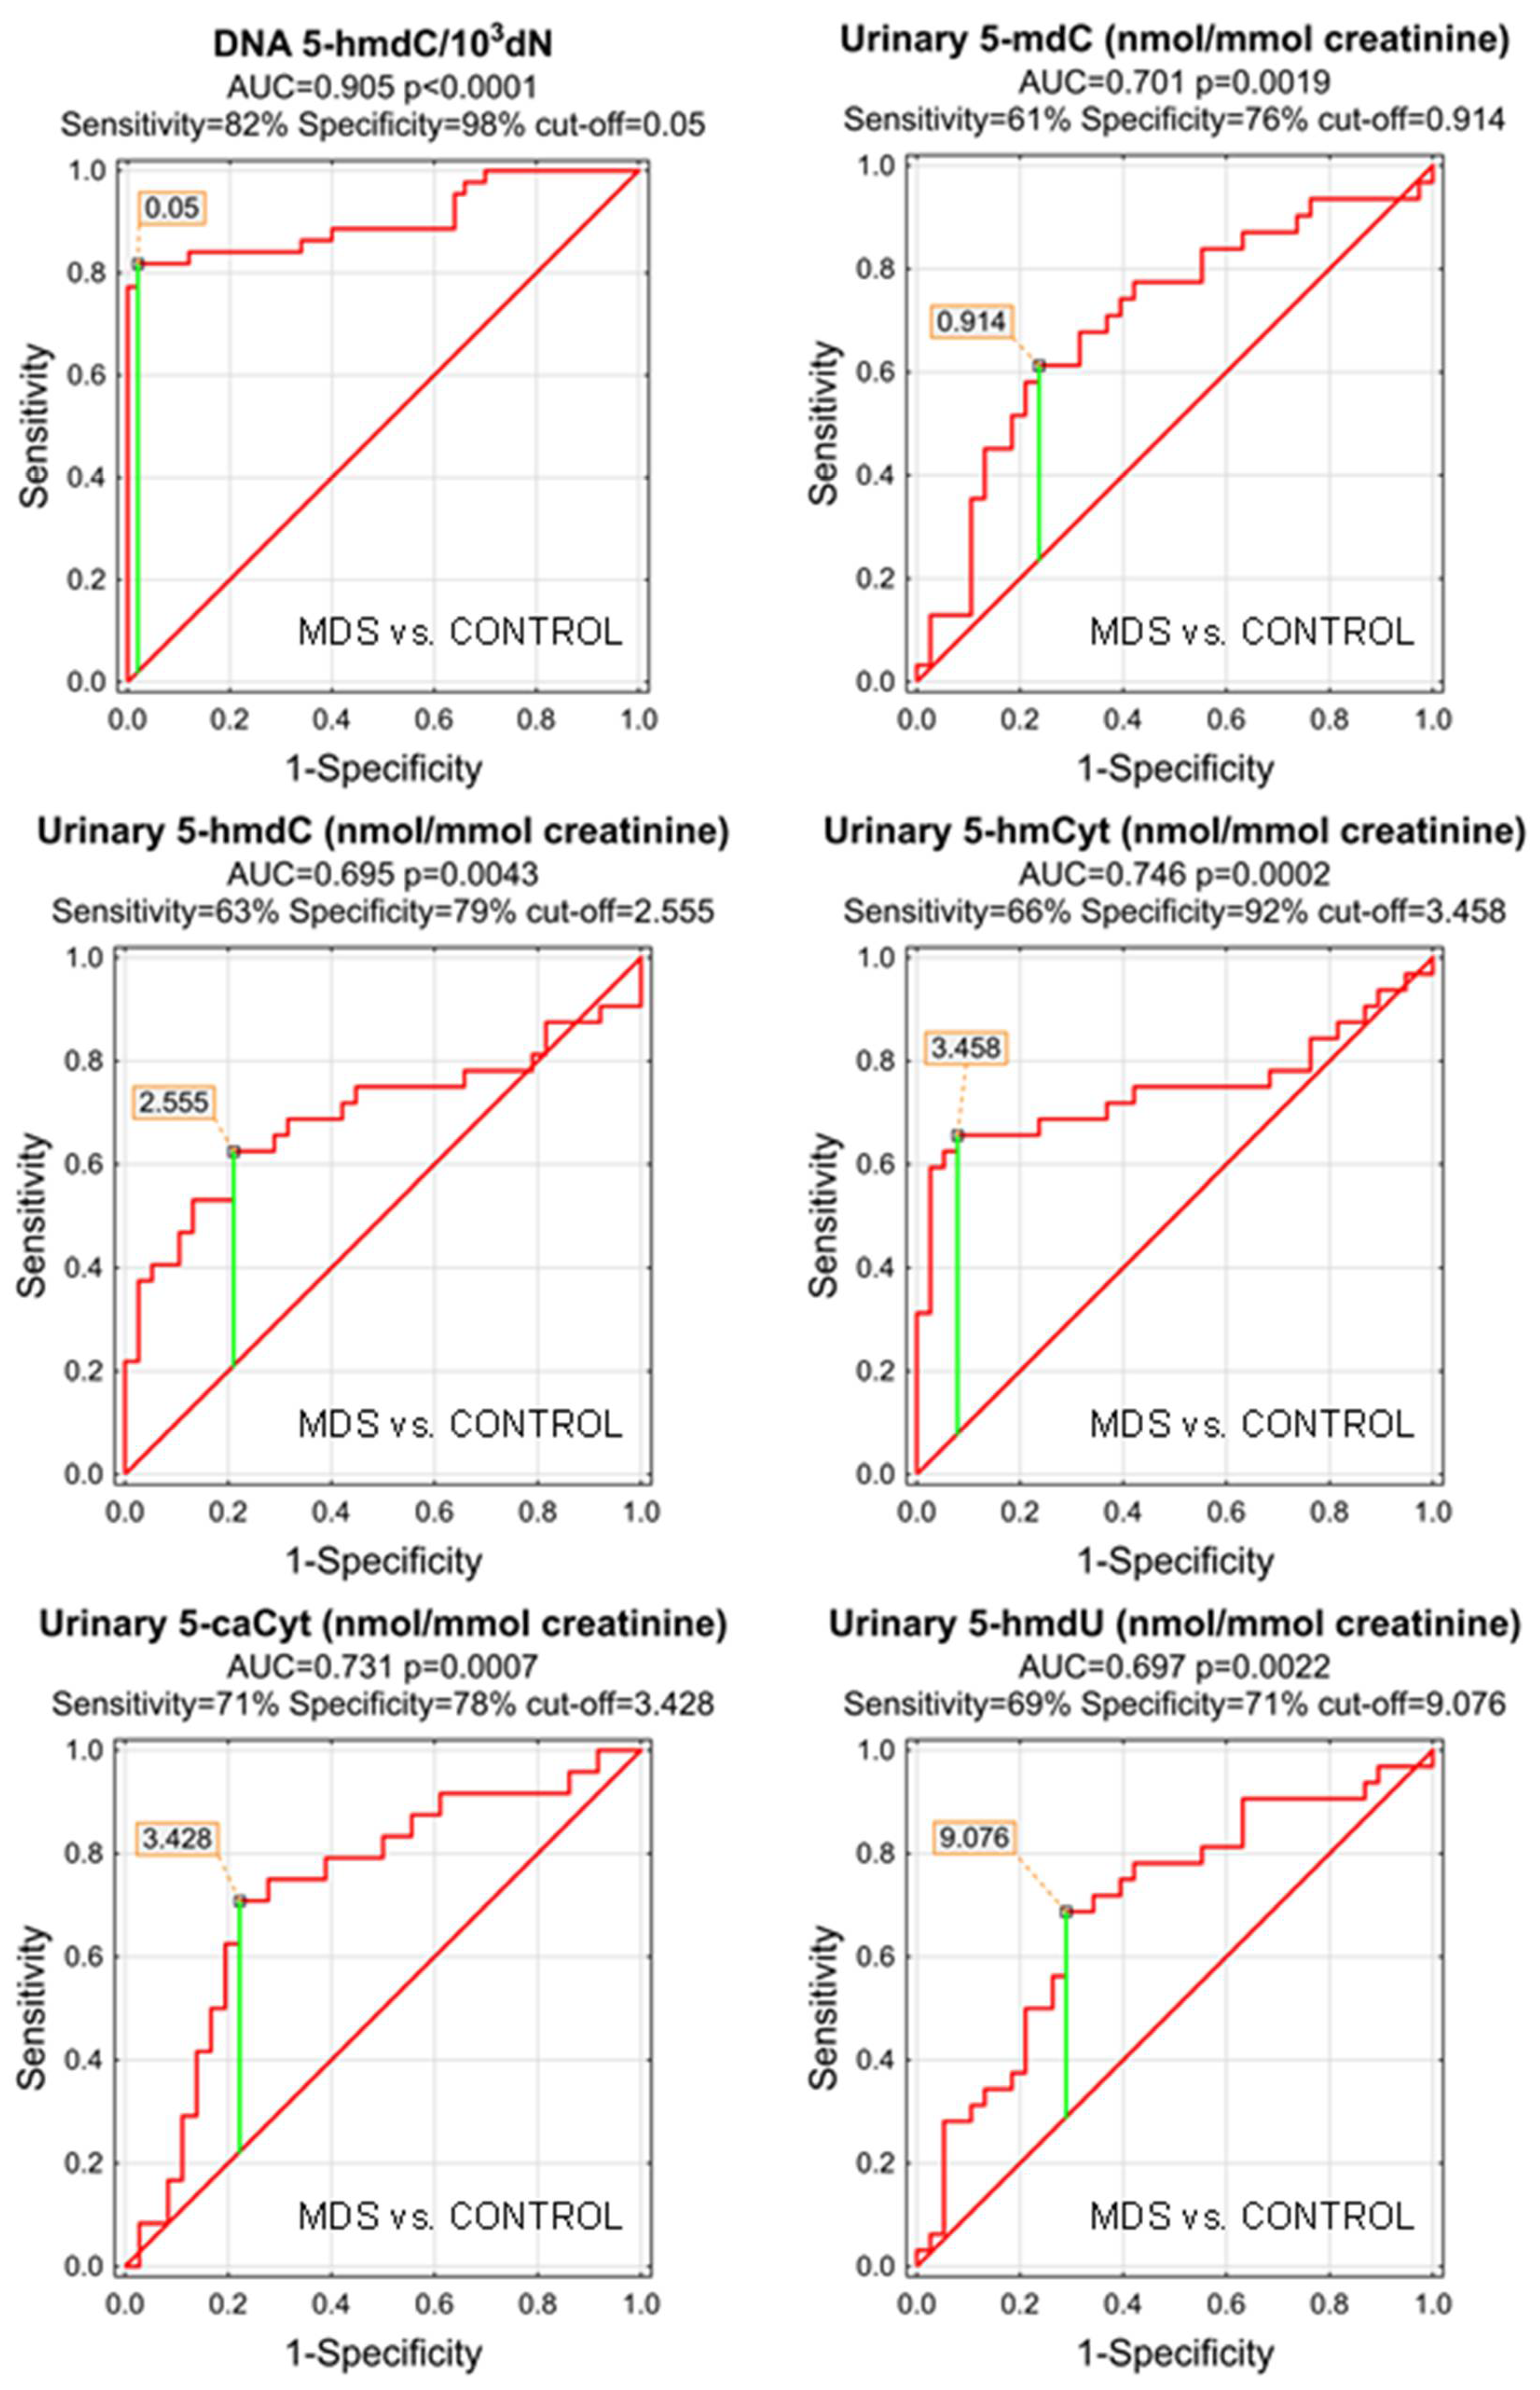
| MDS vs. CONTROL | |||||||||||
|---|---|---|---|---|---|---|---|---|---|---|---|
| AUC | SE | p | S/D | Cut-Off | Sensitivity | Specificity | Accuracy | PPV | NPV | ||
| DNA | 5-methyl-2′-deoxycytidine | 0.642 | 0.057 | 0.0133 | D | 8.601 | 67% | 56% | 61% | 57% | 67% |
| DNA | 5-(hydroxymethyl)-2′-deoxycytidine | 0.905 | 0.034 | <0.0001 | D | 0.05 | 82% | 98% | 90% | 97% | 86% |
| DNA | 5-formyl-2′-deoxycytidine | 0.654 | 0.062 | 0.0125 | S | 0.228 | 49% | 92% | 73% | 83% | 69% |
| DNA | 5-carboxy-2′-deoxycytidine | 0.642 | 0.058 | 0.0145 | S | 6.497 | 81% | 45% | 62% | 56% | 73% |
| DNA | 5-(hydroxymethyl)-2′-deoxyuridine | 0.503 | 0.061 | 0.9551 | S | ||||||
| urine | 5-methyl-2′-deoxycytidine | 0.701 | 0.065 | 0.0019 | S | 0.914 | 61% | 76% | 70% | 68% | 71% |
| urine | 5-(hydroxymethyl)-2′-deoxycytidine | 0.695 | 0.068 | 0.0043 | S | 2.555 | 63% | 79% | 71% | 71% | 71% |
| urine | 5-hydroxymethylcytosine | 0.746 | 0.066 | 0.0002 | S | 3.458 | 66% | 92% | 80% | 88% | 76% |
| urine | 5-formylcytosine | 0.634 | 0.072 | 0.0635 | S | ||||||
| urine | 5-carboxycytosine | 0.731 | 0.068 | 0.0007 | S | 3.428 | 71% | 78% | 75% | 68% | 80% |
| urine | 5-(hydroxymethyl)-2′-deoxyuridine | 0.697 | 0.064 | 0.0022 | S | 9.076 | 69% | 71% | 70% | 67% | 73% |
| urine | 5-hydroxymethyluracil | 0.681 | 0.080 | 0.0232 | S | 8.666 | 60% | 84% | 75% | 71% | 76% |
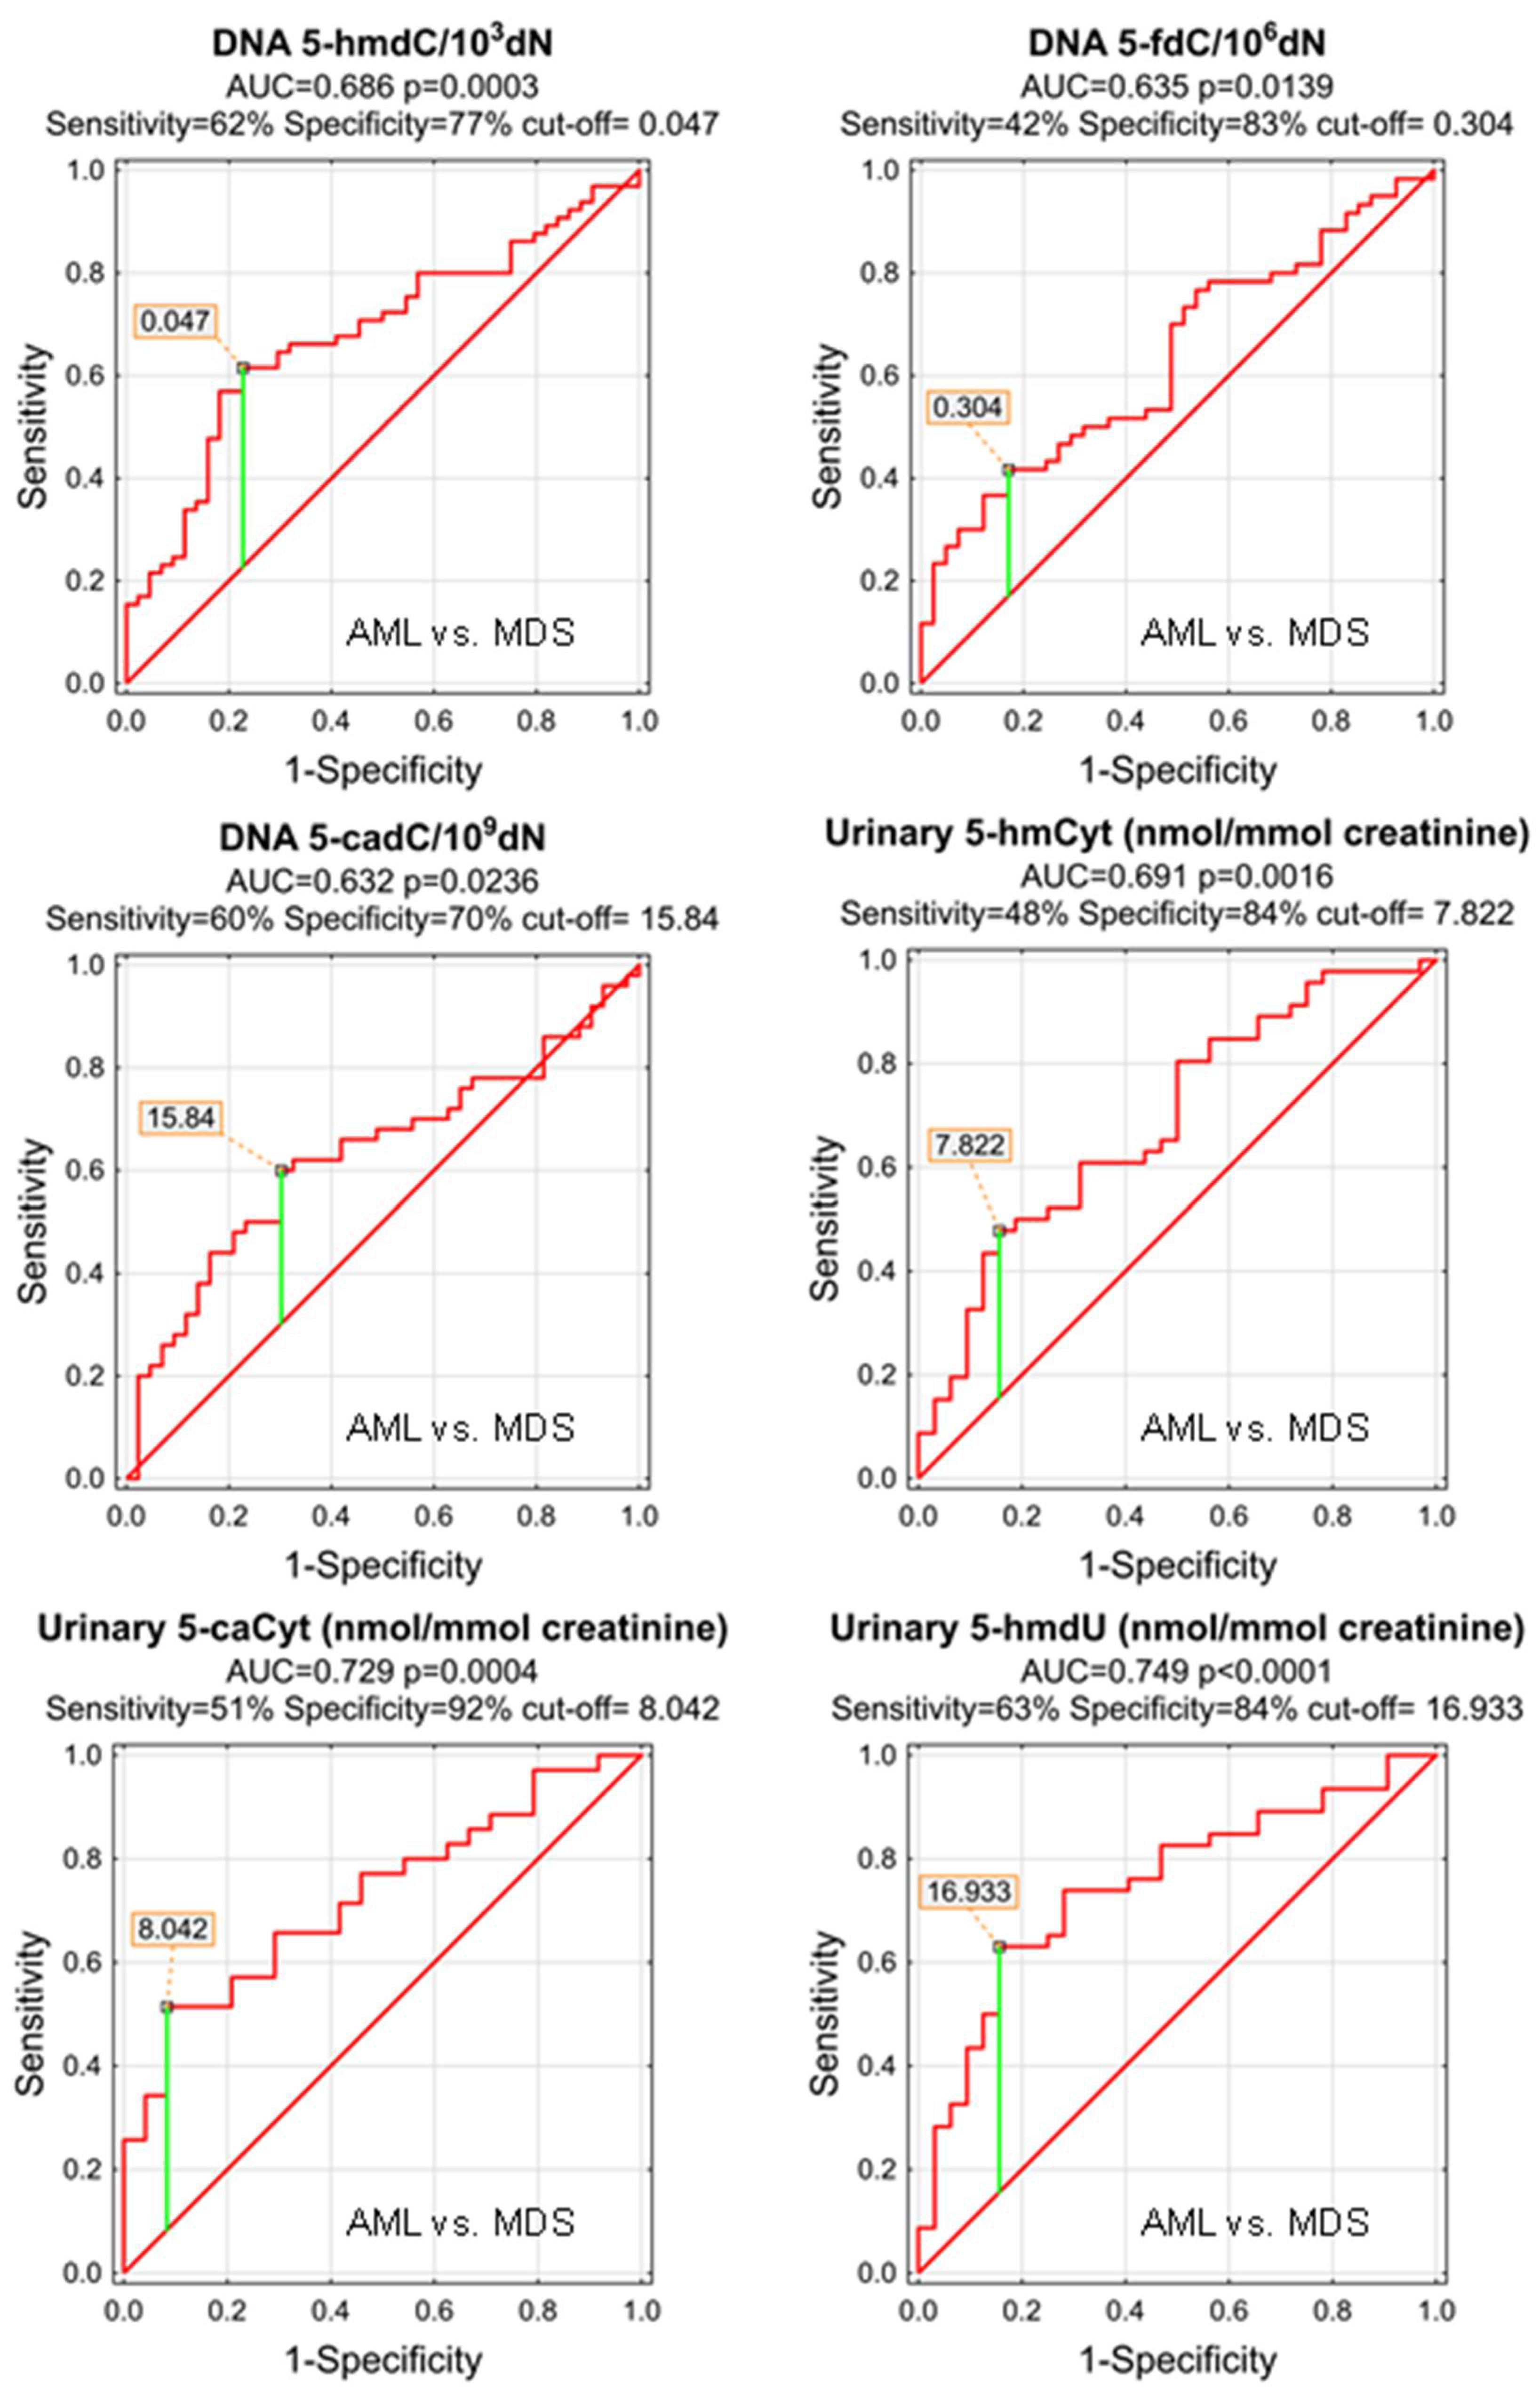
| AML vs. MDS | |||||||||||
|---|---|---|---|---|---|---|---|---|---|---|---|
| AUC | SE | p | S/D | Cut-Off | Sensitivity | Specificity | Accuracy | PPV | NPV | ||
| DNA | 5-methyl-2′-deoxycytidine | 0.572 | 0.055 | 0.1927 | S | ||||||
| DNA | 5-(hydroxymethyl)-2′-deoxycytidine | 0.686 | 0.051 | 0.0003 | S | 0.047 | 62% | 77% | 68% | 80% | 58% |
| DNA | 5-formyl-2′-deoxycytidine | 0.635 | 0.055 | 0.0139 | S | 0.304 | 42% | 83% | 58% | 78% | 49% |
| DNA | 5-carboxy-2′-deoxycytidine | 0.632 | 0.058 | 0.0236 | S | 15.84 | 60% | 70% | 65% | 70% | 60% |
| DNA | 5-(hydroxymethyl)-2′-deoxyuridine | 0.540 | 0.057 | 0.4836 | S | ||||||
| urine | 5-methyl-2′-deoxycytidine | 0.589 | 0.072 | 0.2169 | D | ||||||
| urine | 5-(hydroxymethyl)-2′-deoxycytidine | 0.553 | 0.066 | 0.4203 | S | ||||||
| urine | 5-hydroxymethylcytosine | 0.691 | 0.061 | 0.0016 | S | 7.822 | 48% | 84% | 63% | 81% | 53% |
| urine | 5-formylcytosine | 0.510 | 0.068 | 0.8790 | S | ||||||
| urine | 5-carboxycytosine | 0.729 | 0.065 | 0.0004 | S | 8.042 | 51% | 92% | 68% | 90% | 56% |
| urine | 5-(hydroxymethyl)-2′-deoxyuridine | 0.749 | 0.056 | <0.0001 | S | 16.933 | 63% | 84% | 72% | 85% | 61% |
| urine | 5-hydroxymethyluracil | 0.608 | 0.074 | 0.1475 | S | ||||||
| MDS to AML Transformation | |||||||||||
|---|---|---|---|---|---|---|---|---|---|---|---|
| AUC | SE | p | S/D | Cut-Off | Sensitivity | Specificity | Accuracy | PPV | NPV | ||
| DNA | 5-methyl-2′-deoxycytidine | 0.514 | 0.108 | 0.8975 | S | ||||||
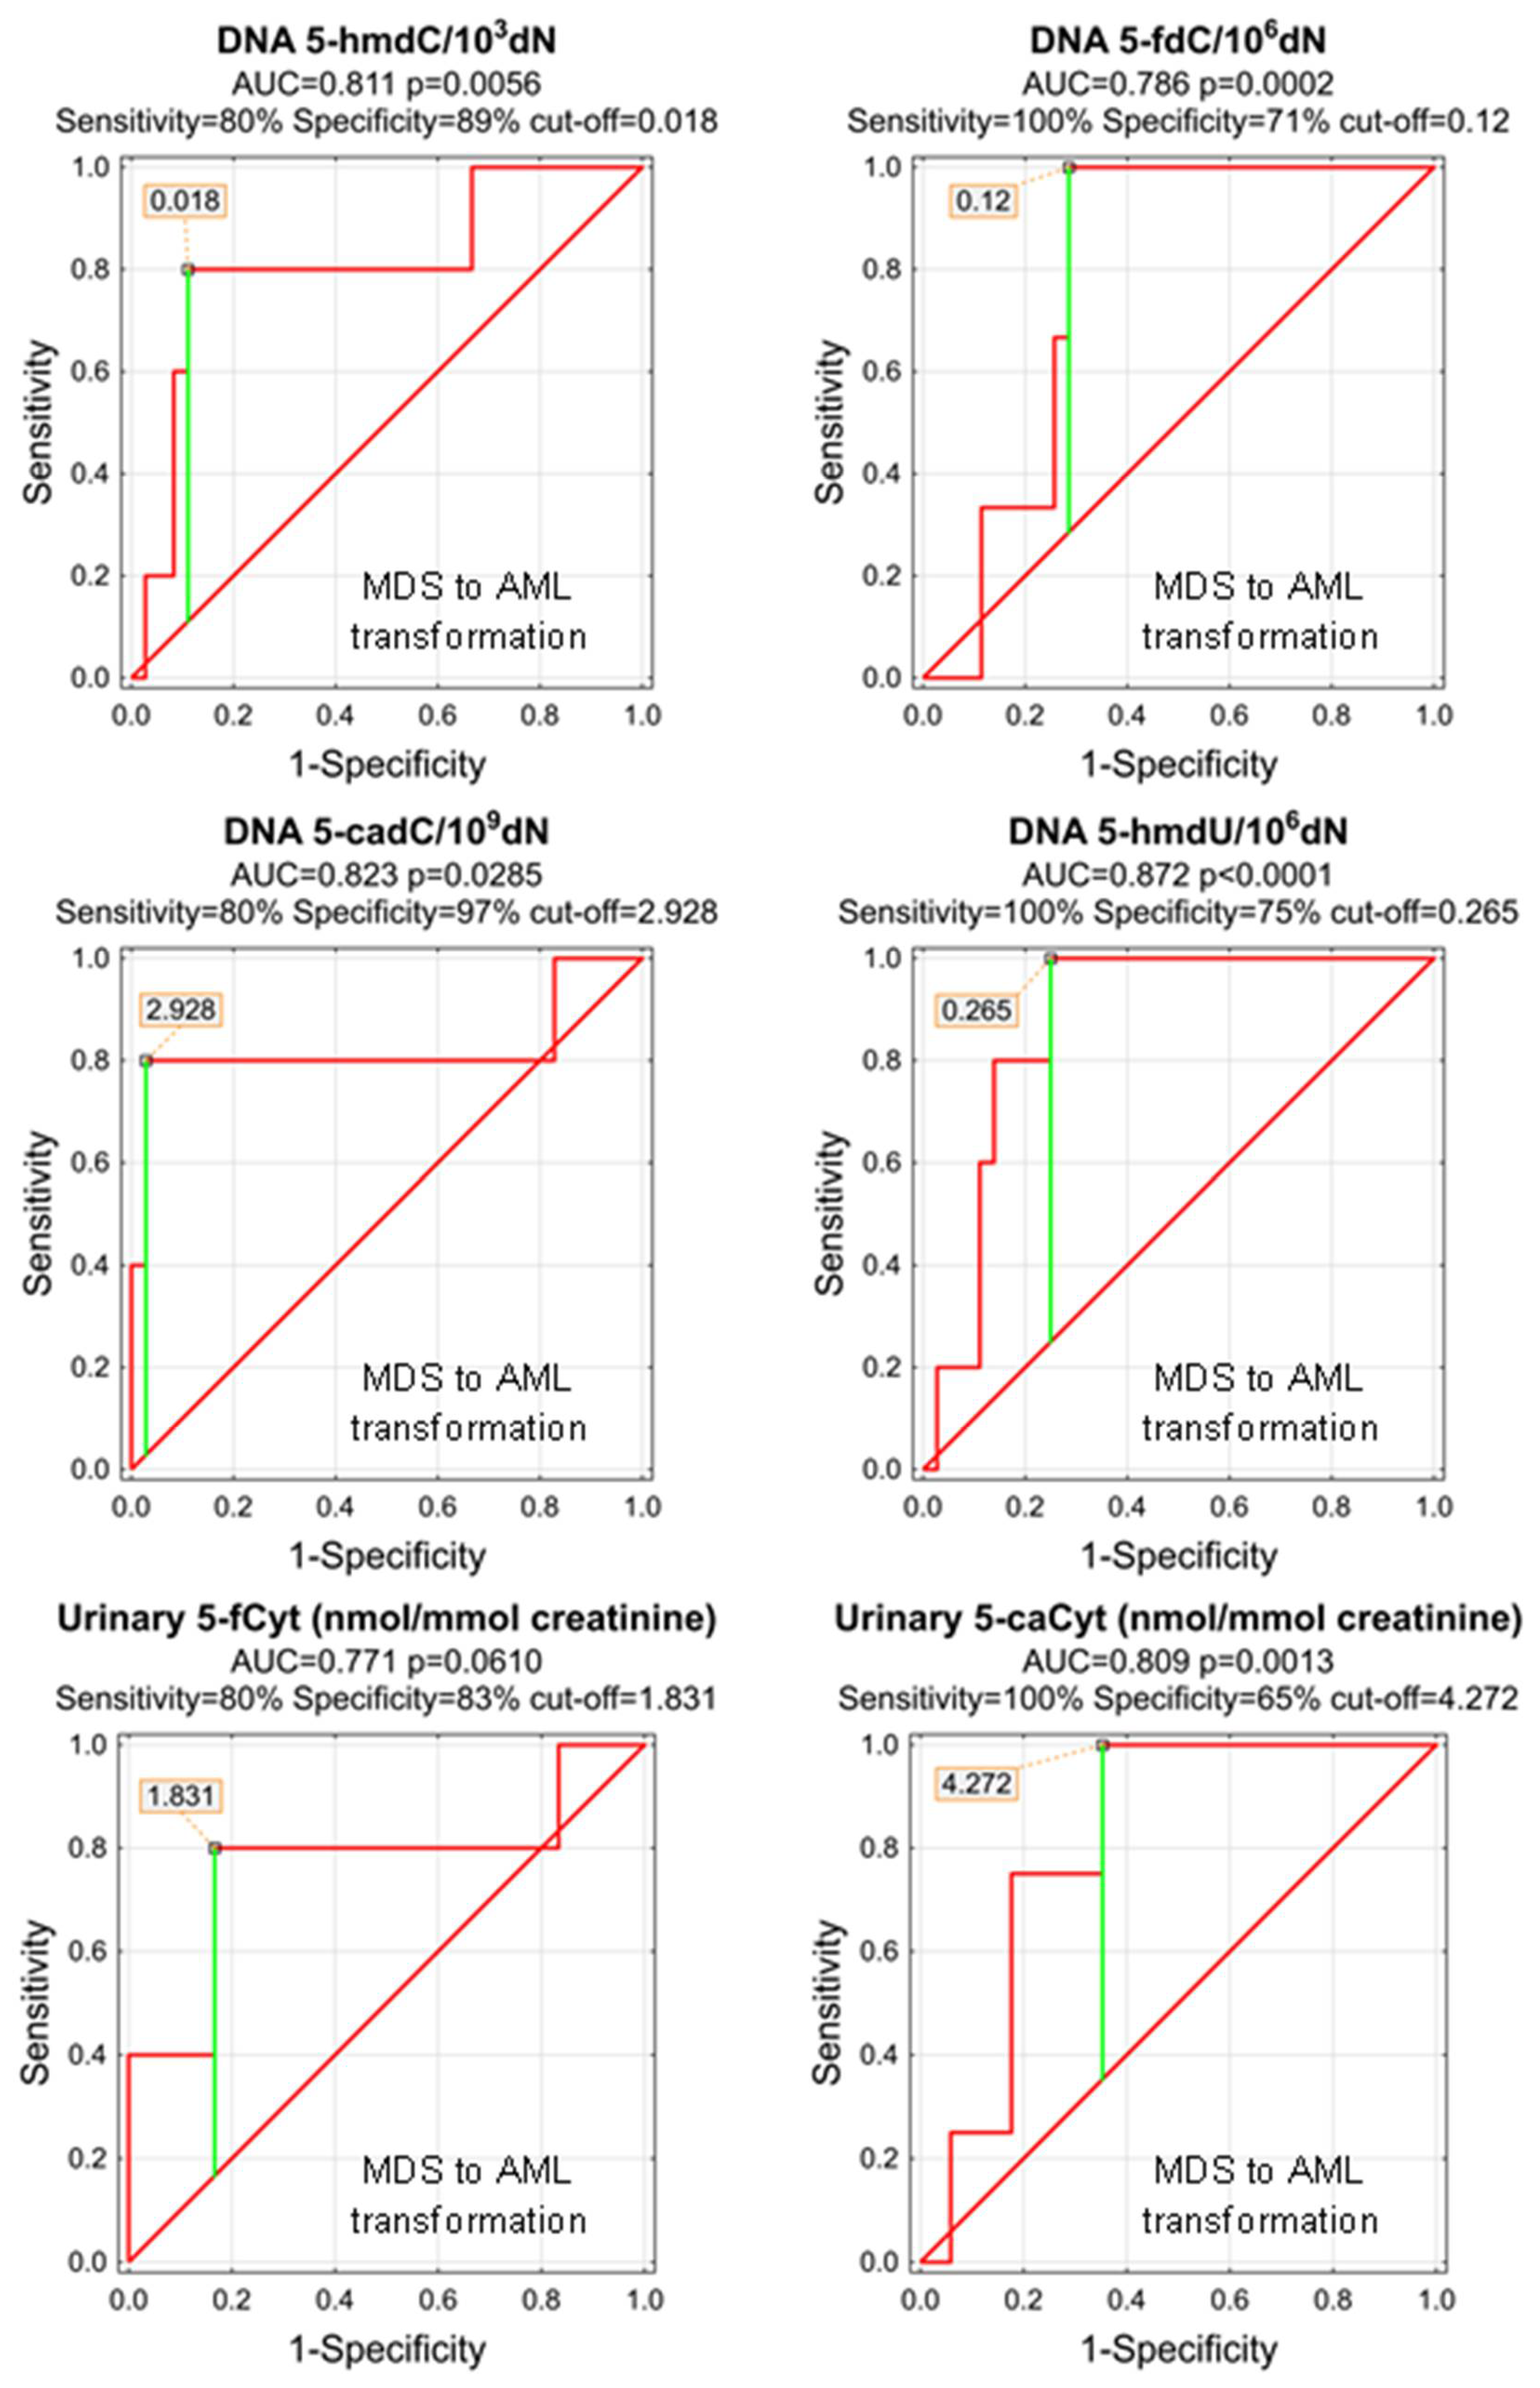
| DNA | 5-(hydroxymethyl)-2′-deoxycytidine | 0.811 | 0.112 | 0.0056 | D | 0.018 | 80% | 89% | 88% | 50% | 97% |
| DNA | 5-formyl-2′-deoxycytidine | 0.786 | 0.076 | 0.0002 | D | 0.12 | 100% | 71% | 74% | 23% | 100% |
| DNA | 5-carboxy-2′-deoxycytidine | 0.823 | 0.147 | 0.0285 | D | 2.928 | 80% | 97% | 95% | 80% | 97% |
| DNA | 5-(hydroxymethyl)-2′-deoxyuridine | 0.872 | 0.057 | <0.0001 | D | 0.265 | 100% | 75% | 78% | 36% | 100% |
| urine | 5-methyl-2′-deoxycytidine | 0.643 | 0.164 | 0.3822 | D | ||||||
| urine | 5-(hydroxymethyl)-2′-deoxycytidine | 0.583 | 0.161 | 0.6054 | D | ||||||
| urine | 5-hydroxymethylcytosine | 0.550 | 0.154 | 0.7449 | D | ||||||
| urine | 5-formylcytosine | 0.771 | 0.145 | 0.0610 | D | ||||||
| urine | 5-carboxycytosine | 0.809 | 0.096 | 0.0013 | S | 4.272 | 100% | 65% | 71% | 40% | 100% |
| urine | 5-(hydroxymethyl)-2′-deoxyuridine | 0.508 | 0.144 | 0.9539 | D | ||||||
| urine | 5-hydroxymethyluracil | 0.596 | 0.236 | 0.6825 | D | ||||||
Publisher’s Note: MDPI stays neutral with regard to jurisdictional claims in published maps and institutional affiliations. |
© 2022 by the authors. Licensee MDPI, Basel, Switzerland. This article is an open access article distributed under the terms and conditions of the Creative Commons Attribution (CC BY) license (https://creativecommons.org/licenses/by/4.0/).
Share and Cite
Skalska-Bugala, A.; Starczak, M.; Szukalski, Ł.; Gawronski, M.; Siomek-Gorecka, A.; Szpotan, J.; Labejszo, A.; Zarakowska, E.; Szpila, A.; Jachalska, A.; et al. Diagnostic and Prognostic Power of Active DNA Demethylation Pathway Intermediates in Acute Myelogenous Leukemia and Myelodysplastic Syndromes. Cells 2022, 11, 888. https://doi.org/10.3390/cells11050888
Skalska-Bugala A, Starczak M, Szukalski Ł, Gawronski M, Siomek-Gorecka A, Szpotan J, Labejszo A, Zarakowska E, Szpila A, Jachalska A, et al. Diagnostic and Prognostic Power of Active DNA Demethylation Pathway Intermediates in Acute Myelogenous Leukemia and Myelodysplastic Syndromes. Cells. 2022; 11(5):888. https://doi.org/10.3390/cells11050888
Chicago/Turabian StyleSkalska-Bugala, Aleksandra, Marta Starczak, Łukasz Szukalski, Maciej Gawronski, Agnieszka Siomek-Gorecka, Justyna Szpotan, Anna Labejszo, Ewelina Zarakowska, Anna Szpila, Anna Jachalska, and et al. 2022. "Diagnostic and Prognostic Power of Active DNA Demethylation Pathway Intermediates in Acute Myelogenous Leukemia and Myelodysplastic Syndromes" Cells 11, no. 5: 888. https://doi.org/10.3390/cells11050888
APA StyleSkalska-Bugala, A., Starczak, M., Szukalski, Ł., Gawronski, M., Siomek-Gorecka, A., Szpotan, J., Labejszo, A., Zarakowska, E., Szpila, A., Jachalska, A., Szukalska, A., Kruszewski, M., Sadowska, A., Wasilow, A., Baginska, P., Czyz, J., Olinski, R., Rozalski, R., & Gackowski, D. (2022). Diagnostic and Prognostic Power of Active DNA Demethylation Pathway Intermediates in Acute Myelogenous Leukemia and Myelodysplastic Syndromes. Cells, 11(5), 888. https://doi.org/10.3390/cells11050888