Article

Dynamic Spatiotemporal Expression Pattern of the Senescence-Associated Factor p16Ink4a in Development and Aging

by
Hasan Safwan-Zaiter
1,†,
Nicole Wagner
1,*,†,
Jean-François Michiels
2 and
Kay-Dietrich Wagner
1,*
1
The National Center for Scientific Research (CNRS), The National Institute of Health and Medical Research (INSERM), iBV, Université Côte d’Azur, 06107 Nice, France
2
Department of Pathology, CHU Nice, 06107 Nice, France
*
Authors to whom correspondence should be addressed.
These authors contributed equally to this work.
Cells 2022, 11(3), 541; https://doi.org/10.3390/cells11030541
Submission received: 13 January 2022 / Revised: 27 January 2022 / Accepted: 2 February 2022 / Published: 4 February 2022
(This article belongs to the Special Issue Controversies and Recent Advances in Senescence and Aging)

Abstract

:
A plethora of factors have been attributed to underly aging, including oxidative stress, telomere shortening and cellular senescence. Several studies have shown a significant role of the cyclin-dependent kinase inhibitor p16ink4a in senescence and aging. However, its expression in development has been less well documented. Therefore, to further clarify a potential role of p16 in development and aging, we conducted a developmental expression study of p16, as well as of p19ARF and p21, and investigated their expression on the RNA level in brain, heart, liver, and kidney of mice at embryonic, postnatal, adult, and old ages. P16 expression was further assessed on the protein level by immunohistochemistry. Expression of p16 was highly dynamic in all organs in embryonic and postnatal stages and increased dramatically in old mice. Expression of p19 and p21 was less variable and increased to a moderate extent at old age. In addition, we observed a predominant expression of p16 mRNA and protein in liver endothelial cells versus non-endothelial cells of old mice, which suggests a functional role specifically in liver endothelium of old subjects. Thus, p16 dynamic spatiotemporal expression might implicate p16 in developmental and physiological processes in addition to its well-known function in the build-up of senescence.

1. Introduction

Aging is characterized by the gradual continuous decline of functions of cells, tissues, and the whole organism [1]. This age-related functional degeneration affects each organism that passes through developmental phases up to aging, as it is experienced by single cellular and multicellular organisms [2]. In mammals, aging is associated with a variety of pathologies and has been classified as the leading predictive factor of many chronic diseases that account for the majority of morbidity and mortality worldwide [3]. These diseases include neurodegenerative (Alzheimer’s and Parkinson), cardiovascular, pulmonary, renal, and bone disorders, and cancers [4,5,6,7,8,9]. What makes aging a common risk factor is the fact that it arises from molecular mechanisms and pathological pathways that are cornerstones for the development of all these diseases. This includes oxidative stress and overproduction of reactive oxygen species, overproduction of inflammatory cytokines, activation of oncogenes, DNA damage, telomere shortening, and, consequently, accumulation of senescent cells [10,11,12,13,14,15].
Cellular senescence is a stress response defined as an irreversible arrest of cellular proliferation that results from experiencing potentially oncogenic stress [16]. Senescence was first discovered in primary cell culture in which cells exhibited a replicative senescence after extended period of growth which was termed the Hayflick’s limit [17,18]. Senescent cells are usually characterized by phenotypic changes, morphological and biochemical, and adopt a secretory phenotype known as the senescence-associated secretory phenotype (SASP) [3,19,20,21]. Morphologically, senescent cells are usually larger than normal ones and exhibit a flattened shape, sometimes with multi-nuclei. However biochemically, these cells show a differential expression profile especially for some genes which rendered them as senescence fingerprints. Senescence-associated β-galactosidase, is an enzyme that is upregulated in senescent cells, and which acts as senescence biomarker [22]. Moreover, ectopic expression or upregulation of several genes has been identified, which includes augmented secretion of proinflammatory cytokines, proteases, and growth factors, which are all together termed the SASP [23,24,25]. A variety of causes underly the induction of cellular senescence; this includes oncogenic stress, telomere shortening, mitogenic signals, genomic DNA damage, epigenomic modifications, and tumor suppressor gene dysregulation [26,27,28,29,30,31,32,33].
Two major pathways have been identified to generate and maintain senescence, representing the intrinsic arm of cellular senescence. The key regulatory proteins of these pathways are the cell cycle regulators p16Ink4a (afterwards termed p16), p19Arf (afterwards p19), and p21 in addition to p53 and retinoblastoma protein (pRB). p21 acts mainly as a downstream effector of p53, and p16 is an upstream regulator of pRB via inhibition of cyclin-dependent kinases Cdk4 and Cdk6 [34,35,36,37,38]. Based on their action in regulating the cell cycle, p16, p19, and p21 were associated with cancer, aging, senescence, regeneration, and tumor suppression [21,35,39]. Expression of p19and p21 in embryonic development has been described [21,40,41,42,43], while little is known about the expression of p16 during development [44,45,46]. Therefore, we investigated p16, p19, and p21 RNA expression and p16 protein localization in several organs during embryonic and postnatal development as well as in adult and old mice.

2. Materials and Methods

2.1. Mice and Tissue Preparation

All animal work was conducted according to national and international guidelines and was approved by the local ethics committee (PEA-NCE/2013/106).
Timed pregnant mice (NMRI and C57BL/6) were purchased from Janvier Labs (Le Genest-Saint-Isle, France). The day of vaginal plug was considered embryonic day (E) 0.5. Pregnant mice were sacrificed by cervical dislocation at the indicated time points. Embryonic tissues were dissected, and tissues were used to prepare RNA. The day of birth was considered postnatal day (P) 0.

2.2. Mouse Tissue Samples, Histology, and Immunohistology

For immunohistochemistry, collections of paraffin-embedded whole embryos were used up to E18.5; for later stages, hearts, livers, kidneys, and brains were dissected. Samples from at least three different animals per time point were analyzed. Three-micrometer paraffin sections were used for histological and immunohistological procedures. For p16 immunohistology, after heat-mediated antigen retrieval and quenching of endogenous peroxidase activity, the antigen was detected after antibody application (1:500 dilution, p16 mouse monoclonal antibody, clone 2D9A12; ab54210, Abcam, Cambridge, UK,; additionally for some samples, a p16 mouse monoclonal antibody, clone 1E12E10, MA5-17142, Thermo Scientific, Courtaboeuf, France) using the M.O.M peroxidase kit from Vector (Vector Laboratories, PK-2200, Burlingame, CA, USA.) following the manufacturer’s instructions. Avidin/Biotin blocking was performed using a kit from Vector (SP-2001). Diaminobenzidine (DAB) served as substrate (Sigma, Saint-Quentin-Fallavier, France). Sections were counterstained with hematoxylin (Dako, Trappes, France) [47,48]. Omission of the first antibody served as a negative control, and additional controls were livers from p16 knockout mice. Slides were photographed using a slide scanner (Leica Microsystems, Nanterre, France) or an epifluorescence microscope (DMLB, Leica, Germany) connected to a digital camera (Spot RT Slider, Diagnostic Instruments, Sterling Heights, MI, USA). For immunofluorescence double-labelling of mouse livers, anti-CD31 rabbit monoclonal antibody (1:2000 dilution, clone EPR17259, Ref: ab225883) from Abcam was combined with the mouse monoclonal anti-p16 antibody (Abcam) using Alexa Fluor 594 donkey anti rabbit and Alexa-Fluor 488 donkey anti mouse secondary antibodies (Jackson ImmunoResearch, Newmarket, Suffolk, UK) [49]. Negative controls were obtained by omission of first antibodies. Images were taken using a confocal ZEISS LSM Exciter microscope (Zeiss, Jena, Germany).

2.3. RNA Isolation, Reverse Transcription, and Quantitative PCR

Using the Trizol reagent (Thermo Scientific, Courtaboeuf, France), total RNA was isolated from brain, heart, liver, and kidneys of four different samples each at different stages of development (embryonic day 10.5, 12.5, 14.5, 16.5, and 18.5; postnatal days 1, 7, 21, 3 months, and 16–18 months) [50]. For E10.5 and E12.5, tissues from 7 embryos each were pooled per sample. For E14.5 and E16.5, organs from 4 embryos were used per sample. First-strand cDNA synthesis was performed with 500 ng of total RNA using the Thermo Scientific Maxima First Strand cDNA Synthesis Kit (#K1672, Thermo Scientific, Courtaboeuf, France), which contains DNase I, RNase inhibitor, oligo (DT) and random hexamer primers. The cDNAs were diluted 10 times in nuclease free water. Two microliters of the diluted reaction product were taken for real-time RT-PCR amplification which was performed using a StepOne Plus thermocycler (Thermo Scientific) and the PowerUp SYBR® Green Master Mix (#A25742, Thermo Scientific) or EurobioGreen Mix (GAEMMX02H, Eurobio, Les Ulis, France). For each sample, expression of the housekeeping genes Gapdh, Rplp0, and β-actin was determined. Three independent housekeeping genes were used as expression for each gene might vary under different experimental conditions [51,52]. Expression for each sample was calculated by subtracting the mean value of housekeeping gene Ct’s from the gene of interest Ct using the ΔCt method [47,48,50,52,53,54,55,56,57,58]. Afterward, relative gene expression values were obtained by normalization of each sample against the mean value of all samples at E10.5 to determine differences between the organs and time points investigated. The mean value of all samples at E10.5 was set to 1 for easier illustration as described [50]. Primer sequences are listed in Table 1.

2.4. Endothelial Cell Magnetic-Activated Cell Sorting (MACS)

Kidneys, livers, hearts, and brains were isolated from four adult (3 months) mice and four old (18 months) mice each. Organs were minced and afterward digested with 0.1 mg/mL of DNase I (10104159001, Roche Diagnostics, Mannheim, Germany) and 1 mg/mL of Collagenase A (11088793001, Roche) in 10 mL of DMEM culture media (ThermoScientific) for 1 h at 37 °C. Digested samples were passed through 70-μm filters (SmartStrainers, 130-098-462, Miltenyi Biotec, Paris, France), centrifuged, and washed twice with PBS containing 2% fetal calf serum (FCS) and 0.5 mM of EDTA (ThermoScientific). Cells were re-suspended in 90 μL of the same buffer (PBS + FCS + EDTA)/107 cells. Endothelial cells were labelled by adding 10 μL/107 cells of magnetic microbead-associated anti-CD31 antibody (130-097-418, Miltenyi) at 4 °C for 15–30 min. Cells were separated via LS column (130-042-401, Miltenyi) pre-washed with 3 mL of PBS + FCS + EDTA and attached to a MidiMACS separator magnet (130-042-302, Miltenyi). Non-endothelial cells were eluted by washes with 3x 3 mL of PBS + FCS + EDTA. Afterward, endothelial cells were eluted by removing the LS columns from the magnetic field and flushing with 6 mL of PBS + FCS + EDTA. Eluted cells were separated as 1/3 for RNA extraction (see above) and 2/3 for protein extraction and quantification.

2.5. Protein Isolation, Quantification, and Western Blot

After endothelial cell sorting as described above, 2/3 of each endothelial and organ cells were taken from the total cell suspension. Cells where centrifuged at 3000 rpm for 10 min at 4 °C. Then, cells were incubated with 100 μL and 150 μL of RIPA buffer (Sigma) for endothelial and organ cells, respectively, and kept on ice for 30 min. Afterwards, samples were agitated overnight at 4 °C. The next day, the tubes were centrifuged at 16,000 rpm for 30 min at 4 °C. The total protein containing supernatant was recovered and stored at −80 °C.
Proteins were quantified by colorimetric BCA assay according to manufacturer’s instructions (Uptima, Montluçon, France). Samples were diluted 20 times in distilled water and loaded in triplicates of 10 μL each, in transparent 96-well plates. In addition, BSA standards ranging from 0 to 2 mg were loaded in triplicates (10 μL). Absorbance was measured at a wavelength of 560 nm in a plate spectrophotometer (Biorad, Marnes-la-Coquette, France).
For Western blotting, 60 μg of protein in Laemmli buffer was denatured at 95 °C for 5–10 min. Samples were loaded on acrylamide gels (acrylamide/bisacrylamide 37.5/1) and set for electrophoresis. Afterward, proteins were transferred to PVDF membranes (162-0177, Biorad), and the membranes were blocked with 5% milk for 1 h (232100, Difco Skim Milk). p16 was detected using a rabbit monoclonal anti-p16 (Abcam; ab211542) diluted 1:2000 in PBS + 0.05% Tween 20 + 2.5% milk powder (overnight, 4 °C), followed by anti-rabbit peroxidase-labeled secondary antibody addition (Vector Laboratories) diluted 1:2000 in PBS + 0.05% Tween 20 + 2.5% milk powder for 1 h. Then, the chemiluminescence signal was obtained by incubation with the enzyme-specific substrate (RPN2235, Amersham, ECL Select Western blotting detection reagent). Afterward, the membrane was stripped by application of 10 mL of stripping buffer for 15 min (ST010, Gene Bio-Application L.T.D., Kfar-Hanagid, Israel) and washed 5x 5 min with distilled water before a second identical blocking step with milk for the detection of Gapdh as housekeeping protein. A rabbit monoclonal anti-Gapdh antibody (Abcam; ab181602) was used, and the signal was generated with same secondary antibody and substrate mentioned above.

2.6. Statistics

Data are expressed as means ± standard error of the mean (S.E.M.). Statistical differences were assessed by analysis of variance (ANOVA) followed by the Bonferroni post-hoc test (Graph Pad Instat, GraphPad Software, Inc., San Diego, CA, USA). A p-value < 0.05 was considered to reflect statistical significance.

3. Results

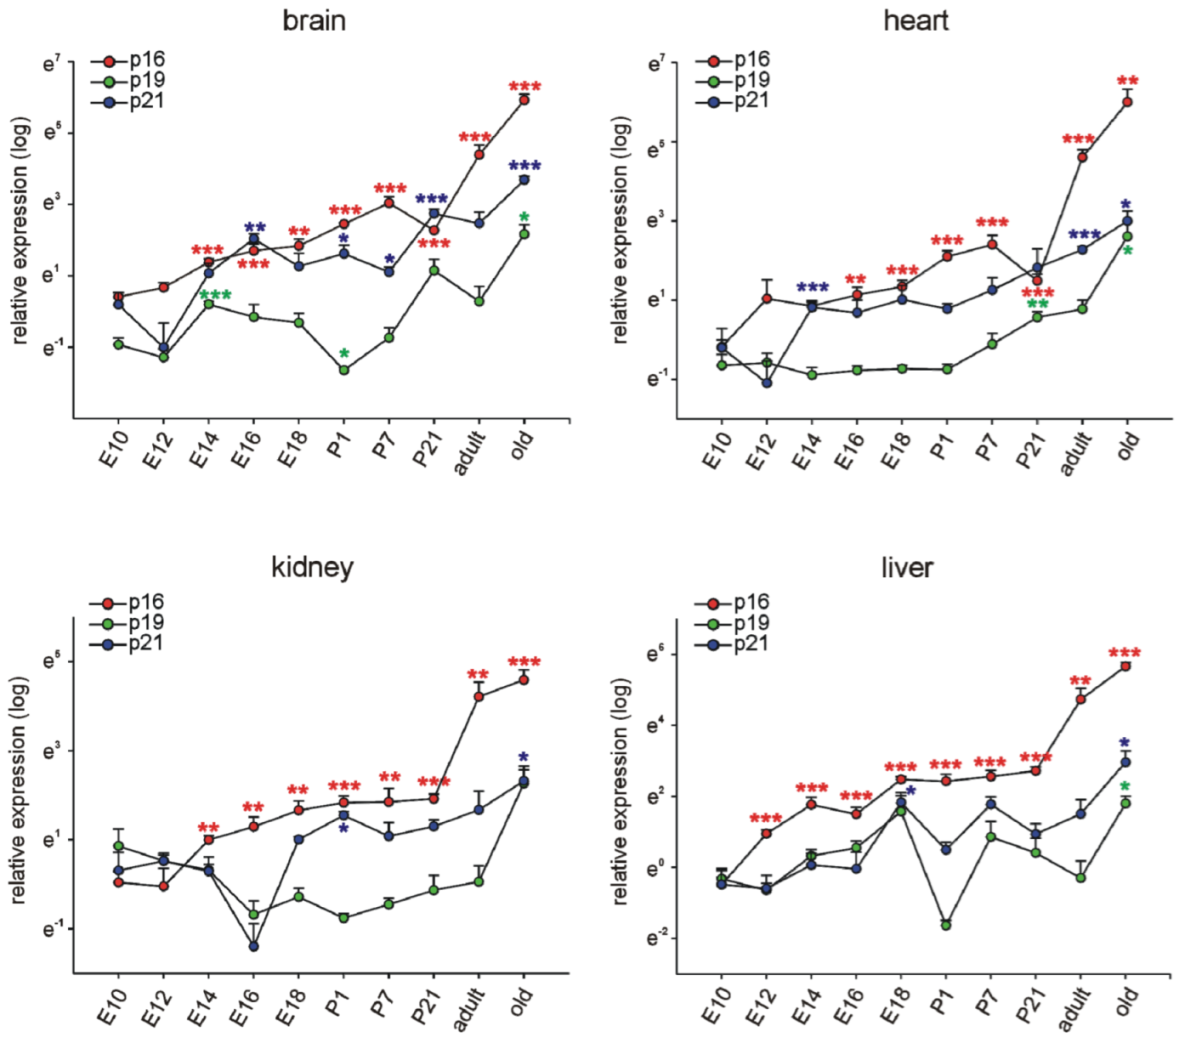
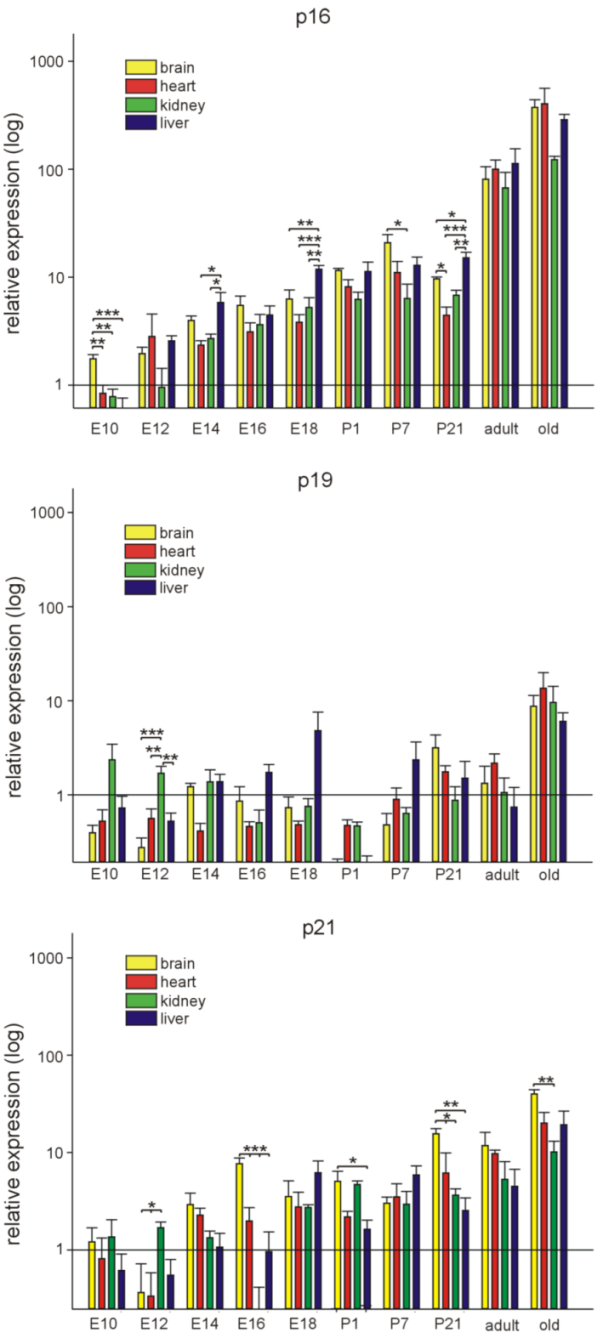
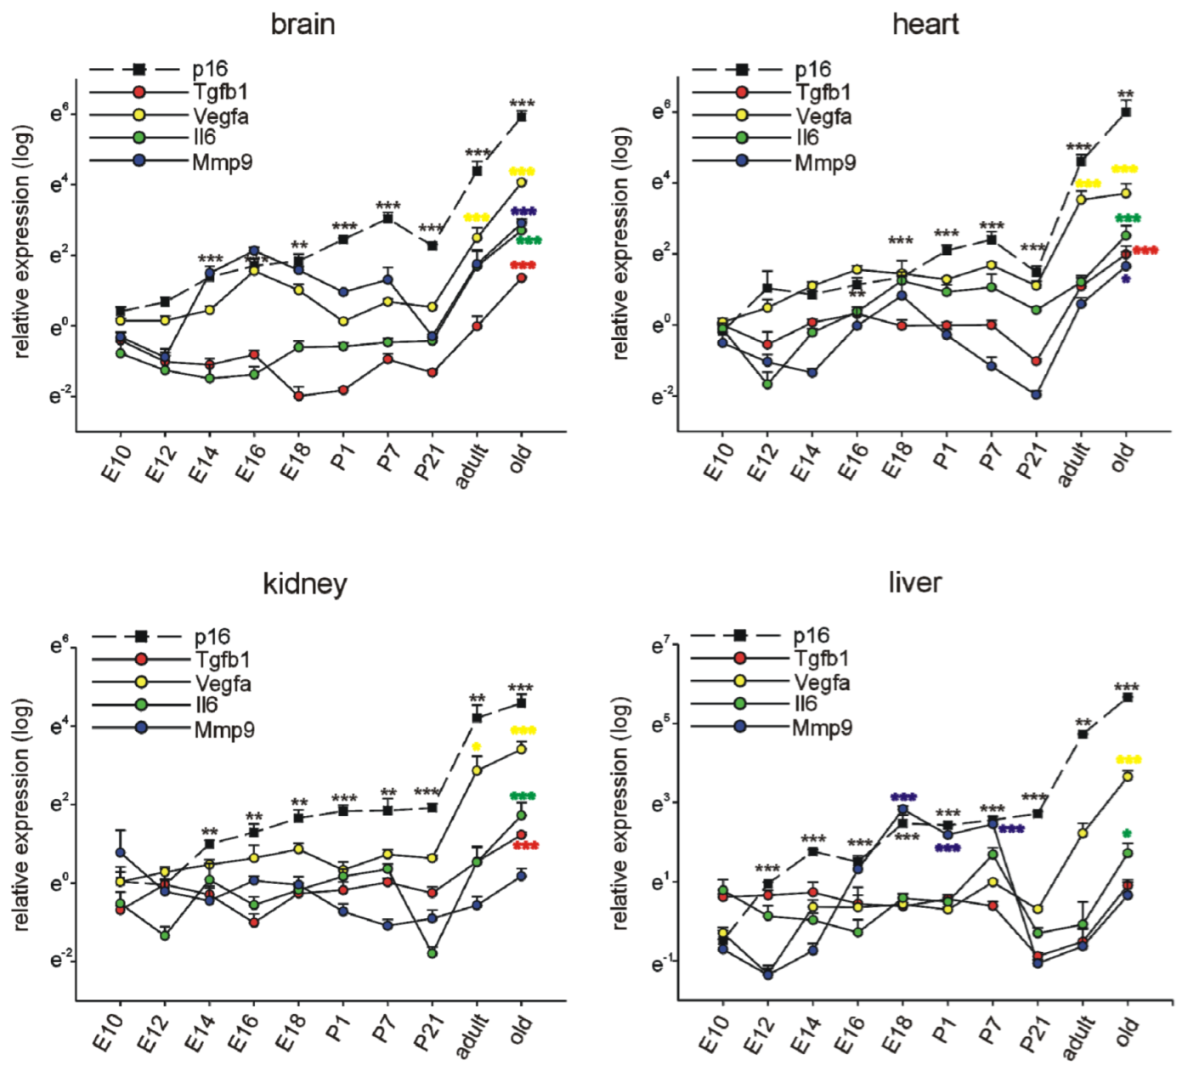
3.1. p16Ink4a, p19, and p21 mRNA Expression during Embryonic Development and Postnatal Stages in Different Organs

Expression of the mRNAs of the three genes p16, p19 and p21 was assessed at different ages (E10.5, E12.5, E14.5, E16.5, E18.5, P1, P7, P21, 3 months (adult), and 16–18 months (old)). Experiments were conducted on brain, heart, kidney, and liver tissues from which RNA samples were extracted and quantified by reverse transcription-quantitative PCR, normalized to the respective means of Rplp0, Gapdh, and β-actin housekeeping genes. The results below show the comparison of relative expression levels at all investigated ages in each organ for the three genes of interest (Figure 1) and the comparison of the expression levels of each gene in the different organs at each age (Figure 2).
In the brain, we observed a significant upregulation of p16 expression beginning at E14.5 until P7 compared to E10.5. Surprisingly, p16 expression dropped significantly at P21 compared to P7 (p < 0.05) to reach the highest levels in old animals. p21 levels increased significantly around E16.5 during embryonic development and remained at stable levels during further development, increasing less than p16 in brains from old mice. p19 expression became upregulated around E14.5 and remained more or less stable during further brain development, showing an increase only in brains of old subjects.
Also in the heart, kidney, and liver p16 expression increased constantly over time with higher expression levels than p19 and p21, which both showed rather low, fluctuating expression during embryonic and postnatal development. Interestingly, in the heart, p16 tended to drop between P7 and P21 (p = 0.070) comparable to the time course in the developing brain. In old stages, p16 expression in brain, heart, kidney, and liver was largely increased. Also, p19 and p21 levels were upregulated in the respective organs, but to a much lesser extent than p16 (Figure 1).
To further analyze the relative mRNA expression data for p16, p19, and p21 in embryonic development and in postnatal stages, we compared the expression of each gene in the brain, heart, kidneys, and liver at each time point (Figure 2). Expression levels of p16 were significantly higher at E10.5 in the brain compared to the developing heart, kidney, and liver. At E14.5, E18.5, and P21, the liver displayed the highest p16 expression compared to the other investigated organs. At adult and old life stages, p16 expression was high, but not significantly different in the four organ systems studied. P19 expression did not vary much between brain, heart, kidneys, and liver. An increase of p19 could be observed in the kidney during development at embryonic day E12.5. Therefore, although p16 and p19 are situated in the same chromosomal region, spatiotemporal expression patterns seem to be unrelated. Expression of p21 increased mostly in the brain during embryonic and postnatal development beginning at E16.5 compared to E10.5, while in the other organs, only temporary very restricted significant alterations were observed. Only in old animals, in all organs a significant increase in p21 expression was noted (Figure 1). At embryonic day 12.5, p21 expression was highest in the kidneys, while at E16.5 and P21, it was highest in the brain, compared to heart, kidneys, and liver. Even in old animals, p21 mRNA levels were elevated in brains compared to the kidneys (Figure 2).

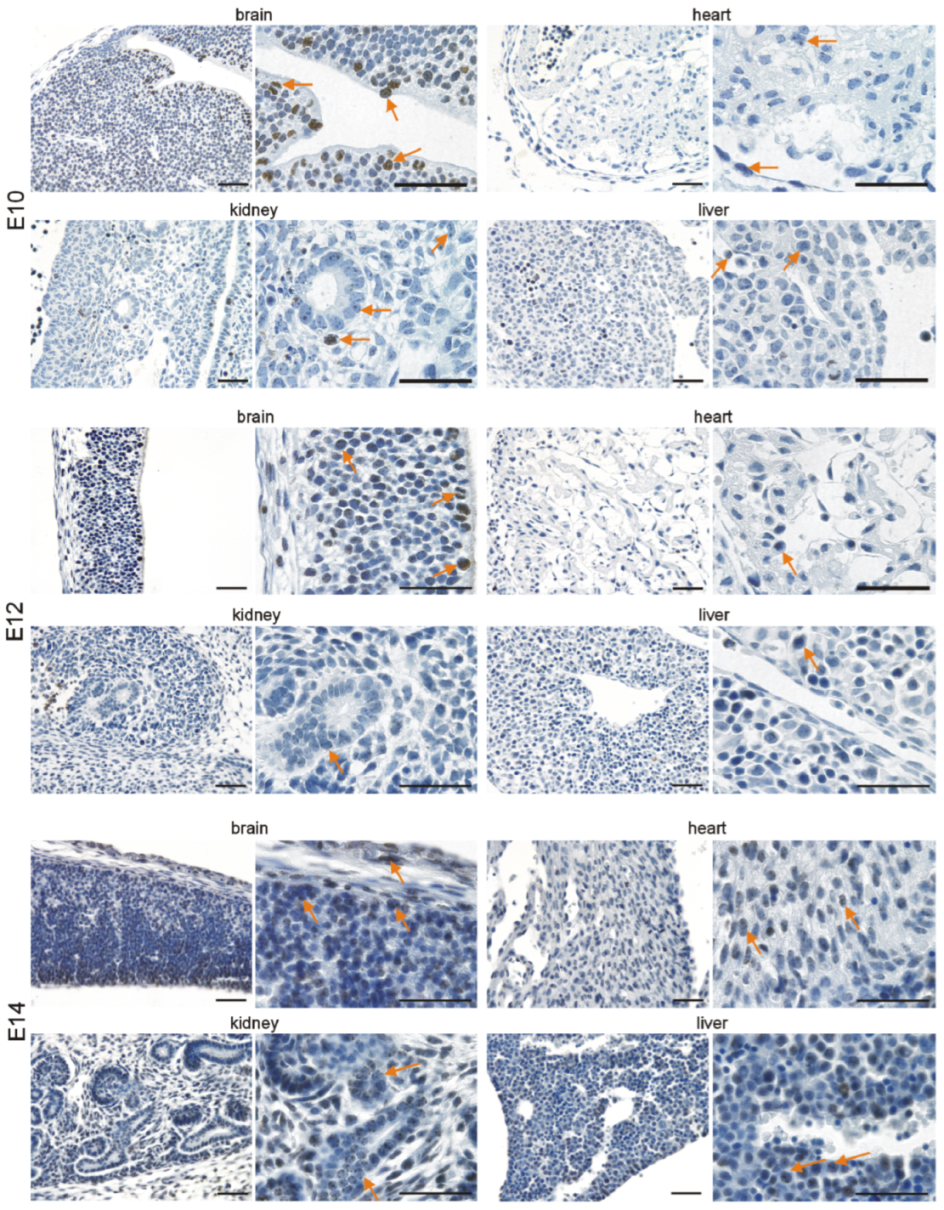
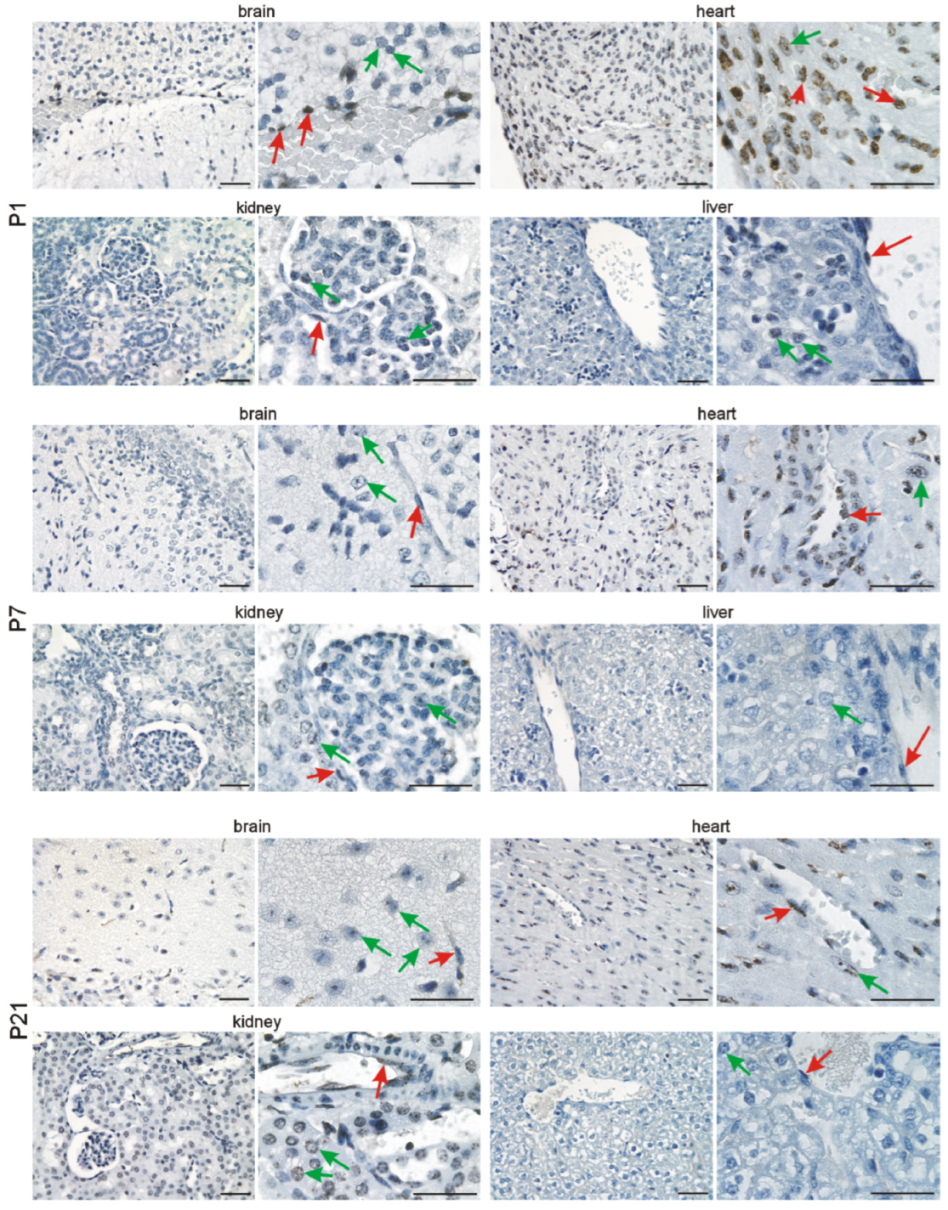
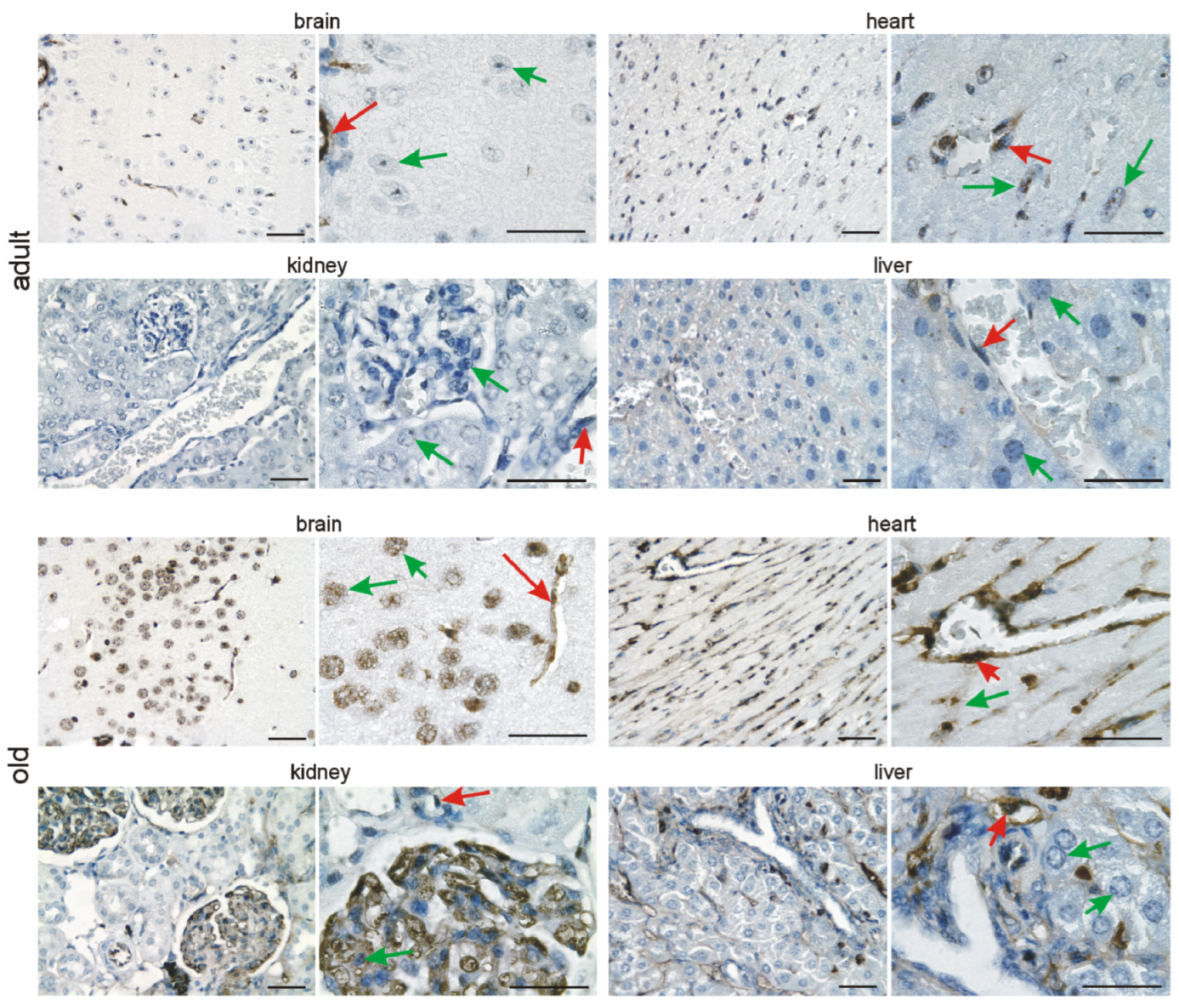
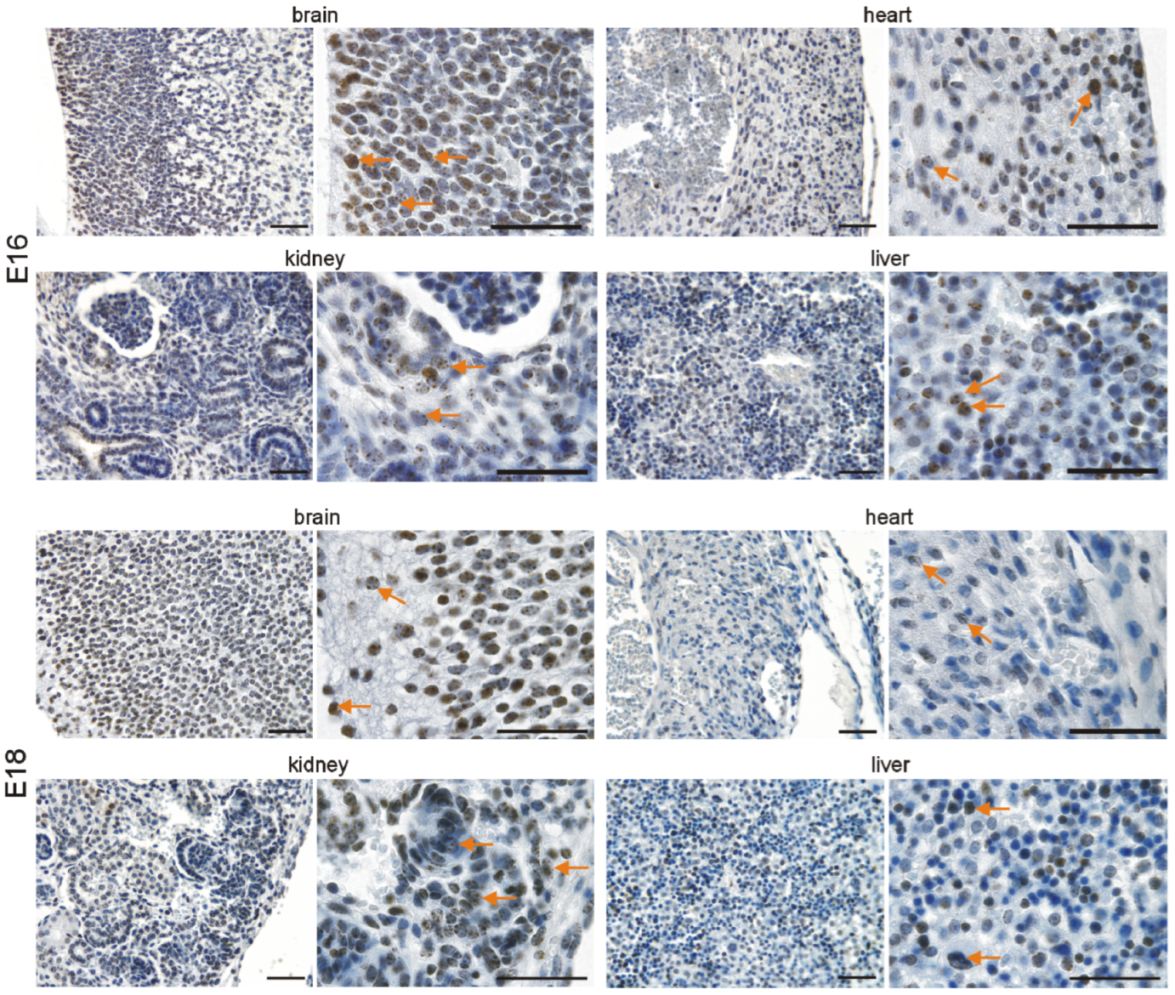
3.2. Immunohistochemical Investigation of p16 Expression

In addition to quantitative p16 assessment on the mRNA level, we investigated its expression in the brain, heart, kidneys, and liver at the different time points by immunohistochemistry. In the developing brain, we detected p16 in neuronal cells of the cephalic mesenchyme (E10.5) and the neopallial cortex (E12.5–E18.5). The number of p16-positive neurons increased with differentiation of the brain up to E18.5. (Figure 3 and Figure 4). Neurons of the cortex of old animals displayed a high p16 reactivity. Endothelial cells of the cortex occasionally showed a faint p16 signal (Figure 5), which increased at adult (3 months) and old (16–18 months) stages (Figure 6). Some cardiomyocytes showed p16 expression at early embryonic stages E10.5–E12.5 (Figure 3). With compaction of the myocardium, the number of p16 expressing cardiomyocytes increased from E14.5 to P1. From P7 on, the frequency of p16 expressing cardiomyocytes decreased (Figure 3, Figure 4 and Figure 5). Endothelial cardiac cells frequently showed p16 expression, with a strong increase in old animals (Figure 6). Similarly to the brain and the heart, more p16-positive cells were found upon differentiation of the kidney. Whereas only faint expression of p16 could be detected in the ureteric bud at E10.5 and E12.5, during formation of the metanephric nephrons and interstitial mesenchyme, a high number of cells expressed p16. The number of p16 expressing cells in the kidney decreased postnatally (Figure 3, Figure 4 and Figure 5). In old mice, p16 was highly expressed in glomerular structures, composed of podocytes, fibroblasts, and endothelial cells, and in vessels of the kidney (Figure 6). In the hepatic primordium (E10.5–E12.5), very few cells exhibited p16 expression. With the onset of hepatic hematopoiesis, the number of p16 expressing cells in the embryonic liver increased (Figure 3). From P1 on, when the bone marrow becomes the dominant hematopoietic organ, very few cells in the liver expressed p16 (Figure 5). In livers of old mice, we detected a strong signal in endothelial cells compared to hepatocytes (Figure 6). Liver sections with omission of the primary antibody and sections from p16 knockout mice were used as negative controls for the immunostaining (Figure S1). Embryonic p16 expression was confirmed using a different monoclonal antibody (Figure S2).

3.3. Selected SASP Factor Expression

To gain additional insights into the potential relevance and function of p16 expression during embryonic and postnatal development and in adult and old mice, we measured mRNA expression of Il-6, Mmp9, Tgfb1, and Vegfa as selected SASP (senescence associated secretory phenotype) factors [21,62,63] during the time points and in the organs mentioned before. As each of these genes has individual functions at different time points and in different organs, we considered only a concomitant modification of the four genes as indicative of SASP. In agreement with the literature, we observed an increase in the measured SASP factors in all organs in old mice (Figure 7). Mmp9 was transiently upregulated during late embryonic and early postnatal development in the liver, but as the other investigated genes did not follow the same time course, it might not be indicative for SASP, and the increase in p16 expression during embryonic and postnatal development alone is not indicative for senescence.

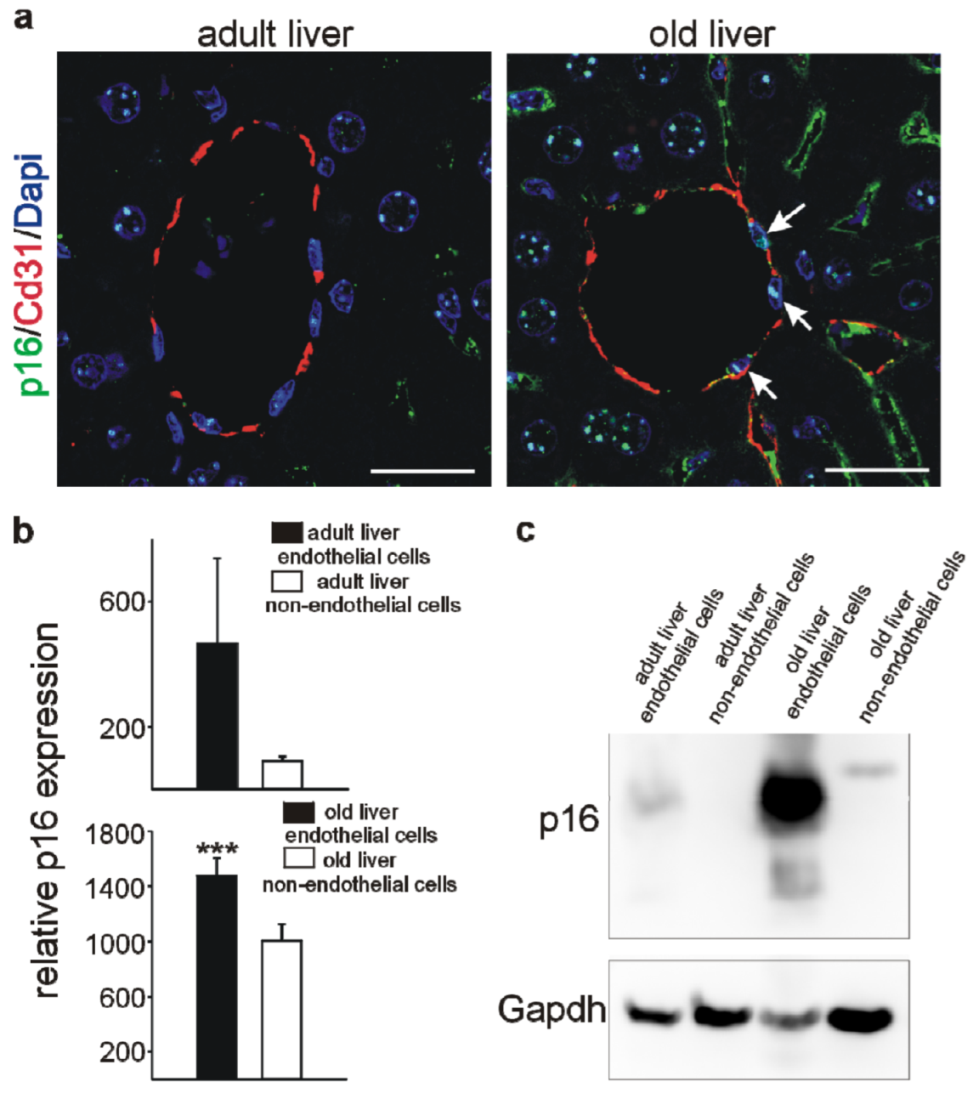
3.4. Higher p16 Expression in Endothelial versus Non-Endothelial Cells in the Liver

As our immunohistochemistry approach suggested higher p16 expression in endothelial versus non-endothelial cells in the liver, we confirmed colocalization of p16 with Cd31 by double-labelling and confocal imaging of wild-type mice livers at 3 and 18 months of age (Figure 8a). For quantitative determinations, endothelial and organ liver cells were isolated from adult (3 months) and old (18 months) mice. In adult livers, endothelial vs. non-endothelial p16 mRNA levels tended to be higher, which became highly significant in old livers (Figure 8b). A comparable result was obtained in Western Blot analyses, showing slightly higher p16 expression in endothelial vs. non-endothelial cells in adult livers, and a dramatic increase of p16 expression in endothelial cells from livers of old animals (Figure 8c). Expression levels for p16 mRNA in endothelial versus non-endothelial cells did not differ for the other adult and old organs, except for the hearts of old mice, where organ cells showed higher p16 expression than endothelial cells. Interestingly, although we observed high p16 expression in old liver endothelial cells versus non-endothelial cells, this was not correlated with an increase in the expression of SASP genes except for Tgfb1, while Vegfa expression was even lower in endothelial cells (Figure S3). This is consistent with the previous observation that liver endothelial cells in aged mice are highly metabolic active and functional despite high p16 expression [64].

4. Discussion

Our results have shown dynamic and differential expression of p16 during embryonic and postnatal development as well as in adult and old mice in the brain, heart, kidneys, and liver. Expression of p16 was varying significantly within each organ during embryonic development in a matter of days. At the same time, p19 and p21 did not show such a remarkable variation of expression. We limited the current study to the investigation of brain, heart, kidney, and liver as these organs already develop at the embryonic time points chosen [65,66,67,68] and are relatively easy to isolate. Nevertheless, it is possible that p16, p19, and p21 might be expressed in a variety of developing organs. For example, p21 expression has already been described during embryonic development, i.e., in muscle, nasal epithelium, tongue muscles, hair follicles, epidermis, and cartilage, and was related in part to growth arrest and senescence [42,69,70]. Expression of p19 has been described in the developing nervous system [44], while p16 has not been detected during embryonic development in earlier studies [45]. However, the authors of this study did not exclude that p16INK4a mRNA might be expressed at low levels or restricted sites in embryos. The authors reported an upregulation of p16 transcripts in organs from 15 month-old mice; however, the original PCR data do not show a specific p16 signal [45]. Using highly sensitive quantitative RT-PCR and antibody staining methods [48,54,55,56,57,58,71], our finding of a relatively high p16 expression during development and especially at old stages might be more accurate.
Upregulation of p16/p19 and p21 is widely accepted as a marker of aging and senescence [16,72,73,74]. In human tissue samples, P16 was detected in endocrine and exocrine pancreas, skin, kidneys, liver, intestine, spleen, brain, and lung. Its expression increased in all investigated organs except for the lung with increasing age [75]. We demonstrate here that murine p16 expression highly increased in all organs investigated between 3 months and 16 months of age. We observed a less pronounced increase in p19 and p21 compared to p16 in old versus adult mice, which is consistent with previous reports in mice and humans [76]. We could not detect organ-specific differences in p16 expression at 16 months of age, which contrasts with a recent study from Yousefzadeh et al. [77]. This might be explained by the age difference of the animals used in their study which compares mice aged from 15–19 weeks with 120-week-old subjects. A study comparing P16 protein expression by immunohistochemistry in human tissues from young, middle-aged, and old donors confirmed a significant increase of P16 in the liver, kidneys, and brain in old subjects. However, no P16 expression could be detected at all ages investigated in the heart, which might be due to species differences [75].
Regarding expression of p16, p19, and p21 and the role of senescence during embryonic development, the literature is more controversial. Unlike p21, p16 and p19 were reported to be absent in early studies as discussed above [45,69]. Senescence, however, has been detected based on SA-β-galactosidase staining during embryonic development, which seems to depend on p21 expression [42,43,78]. Interestingly, absence of p21 was compensated by apoptosis, but still slight developmental abnormalities were detectable [43]. Although these studies focused mainly on p21, p16 loss has also been shown to result in developmental defects in the eye [79]; inactivation of p16 and p19 induced cardiomyocyte proliferation [80]; p16 has been detected in the ventricular and subventricular zones at embryonic and early postnatal stages in the rat brain; SA-β-galactosidase activity and p16 expression has been detected in regressing mesonephros of quails [81]; p16 expression in mouse embryos has been detected in motoneurons and the senolytic ABT-263 decreased the number of these cells [82]. Nevertheless, not all highly p16-positive cells are necessarily senescent [83,84]. For example, overexpression of p16 slowed cell cycle progression in the G0/G1 phase and induced erythroid lineage differentiation [85], which might correspond to the early p16 expression in embryonic mouse livers [86]. Lack of p16 is linked to increased cardiomyocyte proliferation [80], while lower cardiomyocyte proliferation, differentiation, and specification are required for myocardial compaction [87,88], which coincides with our observed cardiac p16 expression.
Furthermore, the notion of senescence as an irreversible form of cell cycle arrest, leading to death of the cell [18] has been recently questioned by the observation that cancer cells can escape from the senescence induced cell cycle arrest and gain a highly aggressive growth potential [89]. Highly interesting, it has also been demonstrated that embryonic senescent cells re-enter the cell cycle and contribute later to tissue formation [40]. We observed organ specific variations of p16 expression, especially by immunohistochemical localization of p16 protein during development. Expression of p16 in development might reflect its function of slowing down cell cycle progression, a process essential for cell type specific differentiation. Knockout mice for p16/p19 and selectively for p16 are prone to tumor development [90,91,92], but potential developmental defects have not been investigated as the mice are viable and fertile. Thus, re-evaluation of potential developmental defects in mice with inactivation of p16 or elimination of p16 expressing cells remains an interesting challenge for further studies.
In postnatal livers, p16 has been intensively studied. p16 has protective effects in non-alcoholic steatohepatitis and liver fibrosis through the regulation of reactive oxygen species (ROS) and oxidative stress [93,94]. Specific removal of liver endothelial cells expressing high levels of p16 resulted in fibrosis and liver deterioration, indicating that these cells are required for the maintenance of liver physiology [64]. However, detailed future studies using conditional cell type-specific knockout approaches will be needed to determine the specific function of p16 in liver endothelial cells.

5. Conclusions

Taken together, p16 expression in embryonic stages might reflect an implication in developmental differentiation processes. Further elucidation of the characteristics of p16 expressing cells, using embryos with inactivation or specific elimination of p16 expressing cells will hopefully shed light on the possible functions of p16 in differentiation, in addition to its implication in senescence and aging. Moreover, in aged mice, the significant upregulation of p16 expression in liver endothelial cells points to a selective role in liver endothelial physiology.

Supplementary Materials

The following are available online at www.mdpi.com/article/10.3390/cells11030541/s1, Figure S1: Representative photomicrographs of p16 immunostaining on sections of mouse livers, Figure S2: Representative photomicrographs of p16 immunostaining using a different p16 antibody (clone 1E12E10) on sections of mouse embryos, Figure S3: Expression of selected senescence-associated secretory phenotype (SASP) factors and p16 in endothelial and non-endothelial cells.

Author Contributions

Conceptualization, N.W. and K.-D.W.; methodology, H.S.-Z., N.W. and K.-D.W.; formal analysis, H.S.-Z., N.W., J.-F.M. and K.-D.W.; investigation, H.S.-Z., N.W. and K.-D.W.; resources, N.W., J.-F.M. and K.-D.W.; writing—original draft preparation, H.S.-Z., N.W. and K.-D.W.; writing—review and editing, N.W. and K.-D.W.; visualization, H.S.-Z. and N.W.; supervision, N.W. and K.-D.W.; project administration, N.W. and K.-D.W.; funding acquisition, N.W. and K.-D.W. All authors have read and agreed to the published version of the manuscript.

Funding

This research was funded by Fondation pour la Recherche Medicale, grant number FRM DPC20170139474 (K.-D.W.), Fondation ARC pour la recherche sur le cancer”, grant number n°PJA 20161204650 (N.W.), Gemluc (N.W.), Plan Cancer INSERM (K.-D.W.), and Agence Nationale de la Recherche, grant R19125AA “Senage” (K.-D.W.).

Institutional Review Board Statement

All animal work was conducted according to national and international guidelines and was approved by the local ethics committee (Ciepal Cote d’Azur, PEA-NCE/2013/106).

Informed Consent Statement

Not applicable.

Acknowledgments

The authors thank A. Biancardini, A. Martres, A. Borderie, M. Goracci, and M. Cutajar-Bossert for technical assistance.

Conflicts of Interest

The authors declare no conflict of interest.

References

  1. Campisi, J. Aging, Cellular Senescence, and Cancer. Annu. Rev. Physiol. 2013, 75, 685–705. [Google Scholar] [CrossRef] [Green Version]
  2. Rose, M.R.; Charlesworth, B. A test of evolutionary theories of senescence. Nature 1980, 287, 141–142. [Google Scholar] [CrossRef]
  3. Tchkonia, T.; Kirkland, J.L. Aging, Cell Senescence, and Chronic Disease. J. Am. Med. Assoc. 2018, 320, 1319–1320. [Google Scholar] [CrossRef]
  4. Hou, Y.; Dan, X.; Babbar, M.; Wei, Y.; Hasselbalch, S.G.; Croteau, D.L.; Bohr, V.A. Ageing as a risk factor for neurodegenerative disease. Nat. Rev. Neurol. 2019, 15, 565–581. [Google Scholar] [CrossRef]
  5. North, B.J.; Sinclair, D.A. The Intersection Between Aging and Cardiovascular Disease. Circ. Res. 2012, 110, 1097–1108. [Google Scholar] [CrossRef]
  6. Ramly, E.; Kaafarani, H.M.; Velmahos, G.C. The Effect of Aging on Pulmonary Function. Surg. Clin. N. Am. 2015, 95, 53–69. [Google Scholar] [CrossRef]
  7. Meyer, B.R. Renal Function in Aging. J. Am. Geriatr. Soc. 1989, 37, 791–800. [Google Scholar] [CrossRef]
  8. Tung, S.; Iqbal, J. Evolution, Aging, and Osteoporosis. Ann. N. Y. Acad. Sci. 2007, 1116, 499–506. [Google Scholar] [CrossRef]
  9. Misra, D.; Seo, P.H.; Cohen, H.J. Aging and cancer. Clin. Adv. Hematol. Oncol. 2004, 2, 457–465. [Google Scholar]
  10. Liguori, I.; Russo, G.; Curcio, F.; Bulli, G.; Aran, L.; DELLA-Morte, D.; Gargiulo, G.; Testa, G.; Cacciatore, F.; Bonaduce, D.; et al. Oxidative stress, aging, and diseases. Clin. Interv. Aging 2018, 13, 757–772. [Google Scholar] [CrossRef] [Green Version]
  11. Michaud, M.; Balardy, L.; Moulis, G.; Gaudin, C.; Peyrot, C.; Vellas, B.; Cesari, M.; Nourhashemi, F. Proinflammatory Cytokines, Aging, and Age-Related Diseases. J. Am. Med. Dir. Assoc. 2013, 14, 877–882. [Google Scholar] [CrossRef]
  12. Burhans, W.C.; Weinberger, M. DNA replication stress, genome instability and aging. Nucleic Acids Res. 2007, 35, 7545–7556. [Google Scholar] [CrossRef]
  13. Best, B.P. Nuclear DNA Damage as a Direct Cause of Aging. Rejuvenation Res. 2009, 12, 199–208. [Google Scholar] [CrossRef] [Green Version]
  14. Freitas, A.; de Magalhaes, J.P. A review and appraisal of the DNA damage theory of ageing. Mutat. Res. Mutat. Res. 2011, 728, 12–22. [Google Scholar] [CrossRef]
  15. Ohtani, N.; Mann, D.J.; Hara, E. Cellular senescence: Its role in tumor suppression and aging. Cancer Sci. 2009, 100, 792–797. [Google Scholar] [CrossRef]
  16. Campisi, J.; d’Adda di Fagagna, F. Cellular senescence: When bad things happen to good cells. Nat. Rev. Mol. Cell Biol. 2007, 8, 729–740. [Google Scholar] [CrossRef]
  17. Hayflick, L.; Moorhead, P.S. The serial cultivation of human diploid cell strains. Exp. Cell Res. 1961, 25, 585–621. [Google Scholar] [CrossRef]
  18. Hayflick, L. The limited in vitro lifetime of human diploid cell strains. Exp. Cell Res. 1965, 37, 614–636. [Google Scholar] [CrossRef]
  19. Tchkonia, T.; Zhu, Y.; Van Deursen, J.; Campisi, J.; Kirkland, J.L. Cellular senescence and the senescent secretory phenotype: Therapeutic opportunities. J. Clin. Investig. 2013, 123, 966–972. [Google Scholar] [CrossRef] [Green Version]
  20. Di Micco, R.; Krizhanovsky, V.; Baker, D.; di Fagagna, F.D. Cellular senescence in ageing: From mechanisms to therapeutic opportunities. Nat. Rev. Mol. Cell Biol. 2021, 22, 75–95. [Google Scholar] [CrossRef]
  21. Rhinn, M.; Ritschka, B.; Keyes, W.M. Cellular senescence in development, regeneration and disease. Development 2019, 146, dev151837. [Google Scholar] [CrossRef] [Green Version]
  22. Dimri, G.P.; Lee, X.; Basile, G.; Acosta, M.; Scott, G.; Roskelley, C.; Medrano, E.E.; Linskens, M.; Rubelj, I.; Pereira-Smith, O.; et al. A biomarker that identifies senescent human cells in culture and in aging skin in vivo. Proc. Natl. Acad. Sci. USA 1995, 92, 9363–9367. [Google Scholar] [CrossRef] [Green Version]
  23. Acosta, J.C.; Banito, A.; Wuestefeld, T.; Georgilis, A.; Janich, P.; Morton, J.P.; Athineos, D.; Kang, T.-W.; Lasitschka, F.; Andrulis, M.; et al. A complex secretory program orchestrated by the inflammasome controls paracrine senescence. Nat. Cell Biol. 2013, 15, 978–990. [Google Scholar] [CrossRef]
  24. Coppé, J.-P.; Patil, C.K.; Rodier, F.; Sun, Y.; Muñoz, D.P.; Goldstein, J.; Nelson, P.S.; Desprez, P.-Y.; Campisi, J. Senescence-Associated Secretory Phenotypes Reveal Cell-Nonautonomous Functions of Oncogenic RAS and the p53 Tumor Suppressor. PLoS Biol. 2008, 6, e301. [Google Scholar] [CrossRef]
  25. Coppé, J.-P.; Desprez, P.-Y.; Krtolica, A.; Campisi, J. The Senescence-Associated Secretory Phenotype: The Dark Side of Tumor Suppression. Annu. Rev. Pathol. Mech. Dis. 2010, 5, 99–118. [Google Scholar] [CrossRef] [Green Version]
  26. Levy, M.Z.; Allsopp, R.C.; Futcher, A.; Greider, C.; Harley, C.B. Telomere end-replication problem and cell aging. J. Mol. Biol. 1992, 225, 951–960. [Google Scholar] [CrossRef]
  27. Allsopp, R.C.; Chang, E.; Kashefi-Aazam, M.; Rogaev, E.I.; Piatyszek, M.A.; Shay, J.W.; Harley, C.B. Telomere Shortening Is Associated with Cell Division in Vitro and in Vivo. Exp. Cell Res. 1995, 220, 194–200. [Google Scholar] [CrossRef]
  28. McEachern, M.J.; Krauskopf, A.; Blackburn, E.H. TELOMERES AND THEIR CONTROL. Annu. Rev. Genet. 2000, 34, 331–358. [Google Scholar] [CrossRef]
  29. Serrano, M.; Lin, A.W.; McCurrach, M.E.; Beach, D.; Lowe, S.W. Oncogenic ras Provokes Premature Cell Senescence Associated with Accumulation of p53 and p16INK4a. Cell 1997, 88, 593–602. [Google Scholar] [CrossRef] [Green Version]
  30. Nakamura, A.J.; Chiang, Y.J.; Hathcock, K.S.; Horikawa, I.; A Sedelnikova, O.; Hodes, R.J.; Bonner, W.M. Both telomeric and non-telomeric DNA damage are determinants of mammalian cellular senescence. Epigenetics Chromatin 2008, 1, 6–12. [Google Scholar] [CrossRef] [Green Version]
  31. Narita, M.; Nuñez, S.; Heard, E.; Narita, M.; Lin, A.W.; Hearn, S.A.; Spector, D.L.; Hannon, G.J.; Lowe, S.W. Rb-Mediated Heterochromatin Formation and Silencing of E2F Target Genes during Cellular Senescence. Cell 2003, 113, 703–716. [Google Scholar] [CrossRef] [Green Version]
  32. Adams, P.D. Healing and Hurting: Molecular Mechanisms, Functions, and Pathologies of Cellular Senescence. Mol. Cell 2009, 36, 2–14. [Google Scholar] [CrossRef] [PubMed] [Green Version]
  33. Munro, J.; I Barr, N.; Ireland, H.; Morrison, V.; Parkinson, E. Histone deacetylase inhibitors induce a senescence-like state in human cells by a p16-dependent mechanism that is independent of a mitotic clock. Exp. Cell Res. 2004, 295, 525–538. [Google Scholar] [CrossRef]
  34. Collins, C.J.; Sedivy, J.M. Involvement of the INK4a/Arf gene locus in senescence. Aging Cell 2003, 2, 145–150. [Google Scholar] [CrossRef] [PubMed]
  35. Takeuchi, S.; Takahashi, A.; Motoi, N.; Yoshimoto, S.; Tajima, T.; Yamakoshi, K.; Hirao, A.; Yanagi, S.; Fukami, K.; Ishikawa, Y.; et al. Intrinsic Cooperation between p16INK4a and p21Waf1/Cip1 in the Onset of Cellular Senescence and Tumor Suppression In vivo. Cancer Res. 2010, 70, 9381–9390. [Google Scholar] [CrossRef] [Green Version]
  36. A Weinberg, R. The Cat and Mouse Games That Genes, Viruses, and Cells Play. Cell 1997, 88, 573–575. [Google Scholar] [CrossRef] [Green Version]
  37. Serrano, M.; Hannon, G.J.; Beach, D.C. A new regulatory motif in cell-cycle control causing specific inhibition of cyclin D/CDK4. Nature 1993, 366, 704–707. [Google Scholar] [CrossRef]
  38. Parry, D.; Bates, S.; Mann, D.J.; Peters, G. Lack of cyclin D-Cdk complexes in Rb-negative cells correlates with high levels of p16INK4/MTS1 tumour suppressor gene product. EMBO J. 1995, 14, 503–511. [Google Scholar] [CrossRef]
  39. Shamloo, B.; Usluer, S. p21 in Cancer Research. Cancers 2019, 11, 1178. [Google Scholar] [CrossRef] [Green Version]
  40. Li, Y.; Zhao, H.; Huang, X.; Tang, J.; Zhang, S.; Li, Y.; Liu, X.; He, L.; Ju, Z.; Lui, K.O.; et al. Embryonic senescent cells re-enter cell cycle and contribute to tissues after birth. Cell Res. 2018, 28, 775–778. [Google Scholar] [CrossRef]
  41. Hosako, H.; Francisco, L.E.; Martin, G.S.; Mirkes, P.E. The roles of p53 and p21 in normal development and hyperthermia-induced malformations. Birth Defects Res. Part B Dev. Reprod. Toxicol. 2009, 86, 40–47. [Google Scholar] [CrossRef]
  42. Storer, M.; Mas, A.; Robert-Moreno, À.; Pecoraro, M.; Ortells, M.C.; Di Giacomo, V.; Yosef, R.; Pilpel, N.; Krizhanovsky, V.; Sharpe, J.; et al. Senescence Is a Developmental Mechanism that Contributes to Embryonic Growth and Patterning. Cell 2013, 155, 1119–1130. [Google Scholar] [CrossRef] [Green Version]
  43. Muñoz-Espín, D.; Cañamero, M.; Maraver, A.; López, G.G.; Contreras, J.; Murillo-Cuesta, S.; Rodríguez-Baeza, A.; Varela-Nieto, I.; Ruberte, J.; Collado, M.; et al. Programmed Cell Senescence during Mammalian Embryonic Development. Cell 2013, 155, 1104–1118. [Google Scholar] [CrossRef] [Green Version]
  44. Zindy, F.; Soares, H.; Herzog, K.H.; Morgan, J.; Sherr, C.J.; Roussel, M.F. Expression of INK4 inhibitors of cyclin D-dependent kinases during mouse brain development. Cell Growth Differ. Mol. Biol. J. Am. Assoc. Cancer Res. 1997, 8, 1139–1150. [Google Scholar]
  45. Zindy, F.; Quelle, D.; Roussel, M.F.; Sherr, C.J. Expression of the p16INK4a tumor suppressor versus other INK4 family members during mouse development and aging. Oncogene 1997, 15, 203–211. [Google Scholar] [CrossRef] [Green Version]
  46. Ouelle, D.E.; Zindy, F.; Ashmun, R.A.; Sherr, C.J. Alternative reading frames of the INK4a tumor suppressor gene encode two unrelated proteins capable of inducing cell cycle arrest. Cell 1995, 83, 993–1000. [Google Scholar] [CrossRef] [Green Version]
  47. Wagner, K.-D.; Cherfils-Vicini, J.; Hosen, N.; Hohenstein, P.; Gilson, E.; Hastie, N.D.; Michiels, J.-F.; Wagner, N. The Wilms’ tumour suppressor Wt1 is a major regulator of tumour angiogenesis and progression. Nat. Commun. 2014, 5, 5852. [Google Scholar] [CrossRef] [Green Version]
  48. Wagner, N.; Ninkov, M.; Vukolic, A.; Deniz, G.C.; Rassoulzadegan, M.; Michiels, J.-F.; Wagner, K.-D. Implications of the Wilms’ Tumor Suppressor Wt1 in Cardiomyocyte Differentiation. Int. J. Mol. Sci. 2021, 22, 4346. [Google Scholar] [CrossRef]
  49. Wagner, N.; Michiels, J.F.; Schedl, A.; Wagner, K.-D. The Wilms’ tumour suppressor WT1 is involved in endothelial cell proliferation and migration: Expression in tumour vessels in vivo. Oncogene 2008, 27, 3662–3672. [Google Scholar] [CrossRef] [Green Version]
  50. Wagner, K.-D.; Ying, Y.; Leong, W.; Jiang, J.; Hu, X.; Chen, Y.; Michiels, J.-F.; Lu, Y.; Gilson, E.; Wagner, N.; et al. The differential spatiotemporal expression pattern of shelterin genes throughout lifespan. Aging 2017, 9, 1219–1232. [Google Scholar] [CrossRef] [Green Version]
  51. Silver, N.; Best, S.; Jiang, J.; Thein, S.L. Selection of housekeeping genes for gene expression studies in human reticulocytes using real-time PCR. BMC Mol. Biol. 2006, 7, 33. [Google Scholar] [CrossRef] [Green Version]
  52. Keber, R.; Motaln, H.; Wagner, K.D.; Debeljak, N.; Rassoulzadegan, M.; Ačimovič, J.; Rozman, D.; Horvat, S. Mouse Knockout of the Cholesterogenic Cytochrome P450 Lanosterol 14α-Demethylase (Cyp51) Resembles Antley-Bixler Syndrome. J. Biol. Chem. 2011, 286, 29086–29097. [Google Scholar] [CrossRef] [Green Version]
  53. Faulkner, A.; Lynam, E.; Purcell, R.; Jones, C.; Lopez, C.; Board, M.; Wagner, K.-D.; Wagner, N.; Carr, C.; Wheeler-Jones, C. Context-dependent regulation of endothelial cell metabolism: Differential effects of the PPARβ/δ agonist GW0742 and VEGF-A. Sci. Rep. 2020, 10, 7849. [Google Scholar] [CrossRef]
  54. Wagner, K.D.; Du, S.; Martin, L.; Leccia, N.; Michiels, J.-F.; Wagner, N. Vascular PPARβ/δ Promotes Tumor Angiogenesis and Progression. Cells 2019, 8, 1623. [Google Scholar] [CrossRef] [Green Version]
  55. Wagner, K.-D.; El Maï, M.; Ladomery, M.; Belali, T.; Leccia, N.; Michiels, J.-F.; Wagner, N. Altered VEGF Splicing Isoform Balance in Tumor Endothelium Involves Activation of Splicing Factors Srpk1 and Srsf1 by the Wilms’ Tumor Suppressor Wt1. Cells 2019, 8, 41. [Google Scholar] [CrossRef] [Green Version]
  56. Wagner, K.-D.; Vukolic, A.; Baudouy, D.; Michiels, J.-F.; Wagner, N. Inducible Conditional Vascular-Specific Overexpression of Peroxisome Proliferator-Activated Receptor Beta/Delta Leads to Rapid Cardiac Hypertrophy. PPAR Res. 2016, 2016, 7631085. [Google Scholar] [CrossRef] [Green Version]
  57. EL Maï, M.; Wagner, K.-D.; Michiels, J.-F.; Ambrosetti, D.; Borderie, A.; Destree, S.; Renault, V.; Djerbi, N.; Giraud-Panis, M.-J.; Gilson, E.; et al. The Telomeric Protein TRF2 Regulates Angiogenesis by Binding and Activating the PDGFRβ Promoter. Cell Rep. 2014, 9, 1047–1060. [Google Scholar] [CrossRef] [Green Version]
  58. Wagner, N.; Morrison, H.; Pagnotta, S.; Michiels, J.-F.; Schwab, Y.; Tryggvason, K.; Schedl, A.; Wagner, K.-D. The podocyte protein nephrin is required for cardiac vessel formation. Hum. Mol. Genet. 2011, 20, 2182–2194. [Google Scholar] [CrossRef] [Green Version]
  59. Sato, S.; Kawamata, Y.; Takahashi, A.; Imai, Y.; Hanyu, A.; Okuma, A.; Takasugi, M.; Yamakoshi, K.; Sorimachi, H.; Kanda, H.; et al. Ablation of the p16INK4a tumour suppressor reverses ageing phenotypes of klotho mice. Nat. Commun. 2015, 6, 7035. [Google Scholar] [CrossRef] [Green Version]
  60. Bruggeman, S.W.; Valk-Lingbeek, M.E.; van der Stoop, P.P.; Jacobs, J.J.; Kieboom, K.; Tanger, E.; Hulsman, D.; Leung, C.; Arsenijevic, Y.; Marino, S.; et al. Ink4a and Arf differentially affect cell proliferation and neural stem cell self-renewal in Bmi1-deficient mice. Genes Dev. 2005, 19, 1438–1443. [Google Scholar] [CrossRef] [Green Version]
  61. Sladky, V.C.; Knapp, K.; Soratroi, C.; Heppke, J.; Eichin, F.; Rocamora-Reverte, L.; Szabó, T.G.; Bongiovanni, L.; Westendorp, B.; Moreno, E.; et al. E2F-Family Members Engage the PIDDosome to Limit Hepatocyte Ploidy in Liver Development and Regeneration. Dev. Cell 2020, 52, 335–349.e7. [Google Scholar] [CrossRef]
  62. Pulido, T.; Velarde, M.C.; Alimirah, F. The senescence-associated secretory phenotype: Fueling a wound that never heals. Mech. Ageing Dev. 2021, 199, 111561. [Google Scholar] [CrossRef]
  63. Chambers, C.R.; Ritchie, S.; Pereira, B.A.; Timpson, P. Overcoming the senescence-associated secretory phenotype (SASP): A complex mechanism of resistance in the treatment of cancer. Mol. Oncol. 2021. [Google Scholar] [CrossRef]
  64. Grosse, L.; Wagner, N.; Emelyanov, A.; Molina, C.; Lacas-Gervais, S.; Wagner, K.-D.; Bulavin, D.V. Defined p16High Senescent Cell Types Are Indispensable for Mouse Healthspan. Cell Metab. 2020, 32, 87–99.e6. [Google Scholar] [CrossRef]
  65. Costantini, F.; Kopan, R. Patterning a Complex Organ: Branching Morphogenesis and Nephron Segmentation in Kidney Development. Dev. Cell 2010, 18, 698–712. [Google Scholar] [CrossRef] [Green Version]
  66. Wagner, N.; Wagner, K.-D. Every Beat You Take—The Wilms′ Tumor Suppressor WT1 and the Heart. Int. J. Mol. Sci. 2021, 22, 7675. [Google Scholar] [CrossRef]
  67. Henry, A.M.; Hohmann, J.G. High-resolution gene expression atlases for adult and developing mouse brain and spinal cord. Mamm. Genome 2012, 23, 539–549. [Google Scholar] [CrossRef]
  68. Zhao, R.; Duncan, S.A. Embryonic development of the liver. Hepatology 2005, 41, 956–967. [Google Scholar] [CrossRef]
  69. Vasey, D.B.; Wolf, C.R.; Brown, K.; Whitelaw, C.B.A. Spatial p21 expression profile in the mid-term mouse embryo. Transgenic Res. 2010, 20, 23–28. [Google Scholar] [CrossRef]
  70. Parker, S.B.; Eichele, G.; Zhang, P.; Rawls, A.; Sands, A.T.; Bradley, A.; Olson, E.N.; Harper, J.W.; Elledge, S.J. p53-Independent Expression of p21 Cip1 in Muscle and Other Terminally Differentiating Cells. Science 1995, 267, 1024–1027. [Google Scholar] [CrossRef]
  71. Wagner, N.; Wagner, K.-D.; Scholz, H.; Kirschner, K.; Schedl, A. Intermediate filament protein nestin is expressed in developing kidney and heart and might be regulated by the Wilms’ tumor suppressor Wt1. Am. J. Physiol. Integr. Comp. Physiol. 2006, 291, R779–R787. [Google Scholar] [CrossRef]
  72. Krishnamurthy, J.; Torrice, C.; Ramsey, M.R.; Kovalev, G.I.; Al-Regaiey, K.; Su, L.; Sharpless, N.E. Ink4a/Arf expression is a biomarker of aging. J. Clin. Investig. 2004, 114, 1299–1307. [Google Scholar] [CrossRef]
  73. Sharpless, N.E.; Sherr, C.J. Forging a signature of in vivo senescence. Nat. Rev. Cancer 2015, 15, 397–408. [Google Scholar] [CrossRef]
  74. López-Domínguez, J.A.; Rodríguez-López, S.; Ahumada-Castro, U.; Desprez, P.-Y.; Konovalenko, M.; Laberge, R.-M.; Cárdenas, C.; Villalba, J.M.; Campisi, J. Cdkn1a transcript variant 2 is a marker of aging and cellular senescence. Aging 2021, 13, 13380–13392. [Google Scholar] [CrossRef]
  75. Idda, M.L.; McClusky, W.G.; Lodde, V.; Munk, R.; Abdelmohsen, K.; Rossi, M.; Gorospe, M. Survey of senescent cell markers with age in human tissues. Aging 2020, 12, 4052–4066. [Google Scholar] [CrossRef]
  76. Hudgins, A.D.; Tazearslan, C.; Tare, A.; Zhu, Y.; Huffman, D.; Suh, Y. Age- and Tissue-Specific Expression of Senescence Biomarkers in Mice. Front. Genet. 2018, 9, 59. [Google Scholar] [CrossRef] [Green Version]
  77. Yousefzadeh, M.J.; Zhao, J.; Bukata, C.; Wade, E.A.; McGowan, S.J.; Angelini, L.A.; Bank, M.P.; Gurkar, A.; McGuckian, C.A.; Calubag, M.F.; et al. Tissue specificity of senescent cell accumulation during physiologic and accelerated aging of mice. Aging Cell 2020, 19, e13094. [Google Scholar] [CrossRef]
  78. Wanner, E.; Thoppil, H.; Riabowol, K. Senescence and Apoptosis: Architects of Mammalian Development. Front. Cell Dev. Biol. 2021, 8, 620089. [Google Scholar] [CrossRef]
  79. Cheong, C.; Sung, Y.H.; Lee, J.; Choi, Y.S.; Song, J.; Kee, C.; Lee, H.-W. Role of INK4a locus in normal eye development and cataract genesis. Mech. Ageing Dev. 2006, 127, 633–638. [Google Scholar] [CrossRef]
  80. An, S.; Chen, Y.; Gao, C.; Qin, B.; Du, X.; Meng, F.; Qi, Y. Inactivation of INK4a and ARF induces myocardial proliferation and improves cardiac repair following ischemia-reperfusion. Mol. Med. Rep. 2015, 12, 5911–5916. [Google Scholar] [CrossRef] [Green Version]
  81. Nacher, V.; Carretero, A.; Navarro, M.; Ayuso, E.; Ramos, D.; Luppo, M.; Rodríguez, A.; Mendes, L.; Herrero-Fresneda, I.; Ruberte, J. Endothelial Cell Transduction in Primary Cultures from Regressing Mesonephros. Cells Tissues Organs 2010, 191, 84–95. [Google Scholar] [CrossRef]
  82. Dominguez-Bautista, J.A.; Acevo-Rodríguez, P.S.; Castro-Obregón, S. Programmed Cell Senescence in the Mouse Developing Spinal Cord and Notochord. Front. Cell Dev. Biol. 2021, 9, 587096. [Google Scholar] [CrossRef]
  83. Frescas, D.; Hall, B.M.; Strom, E.; Virtuoso, L.P.; Gupta, M.; Gleiberman, A.S.; Rydkina, E.; Balan, V.; Vujcic, S.; Chernova, O.B.; et al. Murine mesenchymal cells that express elevated levels of the CDK inhibitor p16(Ink4a) in vivo are not necessarily senescent. Cell Cycle 2017, 16, 1526–1533. [Google Scholar] [CrossRef]
  84. Hall, B.M.; Balan, V.; Gleiberman, A.S.; Strom, E.; Krasnov, P.; Virtuoso, L.P.; Rydkina, E.; Vujcic, S.; Balan, K.; Gitlin, I.; et al. Aging of mice is associated with p16(Ink4a)- and β-galactosidase-positive macrophage accumulation that can be induced in young mice by senescent cells. Aging 2016, 8, 1294–1315. [Google Scholar] [CrossRef] [Green Version]
  85. Minami, R.; Muta, K.; Umemura, T.; Motomura, S.; Abe, Y.; Nishimura, J.; Nawata, H. p16INK4a induces differentiation and apoptosis in erythroid lineage cells. Exp. Hematol. 2003, 31, 355–362. [Google Scholar] [CrossRef]
  86. Wang, X.; Yang, L.; Wang, Y.-C.; Xu, Z.-R.; Feng, Y.; Zhang, J.; Wang, Y.; Xu, C.-R. Comparative analysis of cell lineage differentiation during hepatogenesis in humans and mice at the single-cell transcriptome level. Cell Res. 2020, 30, 1109–1126. [Google Scholar] [CrossRef]
  87. Wu, T.; Liang, Z.; Zhang, Z.; Liu, C.; Zhang, L.; Gu, Y.; Peterson, K.L.; Evans, S.M.; Fu, X.-D.; Chen, J. PRDM16 Is a Compact Myocardium-Enriched Transcription Factor Required to Maintain Compact Myocardial Cardiomyocyte Identity in Left Ventricle. Circulation 2021. [Google Scholar] [CrossRef]
  88. Sedmera, D.; Pexieder, T.; Vuillemin, M.; Thompson, R.P.; Anderson, R.H. Developmental patterning of the myocardium. Anat. Rec. 2000, 258, 319–337. [Google Scholar] [CrossRef]
  89. Milanovic, M.; Fan, D.N.Y.; Belenki, D.; Däbritz, J.H.M.; Zhao, Z.; Yu, Y.; Dörr, J.R.; Dimitrova, L.; Lenze, D.; Barbosa, I.A.M.; et al. Senescence-associated reprogramming promotes cancer stemness. Nature 2017, 553, 96–100. [Google Scholar] [CrossRef] [Green Version]
  90. E Sharpless, N.; Ramsey, M.; Balasubramanian, P.; Castrillon, D.H.; DePinho, R. The differential impact of p16INK4a or p19ARF deficiency on cell growth and tumorigenesis. Oncogene 2004, 23, 379–385. [Google Scholar] [CrossRef] [Green Version]
  91. Sharpless, N.; Bardeesy, N.; Lee, K.-H.; Carrasco, D.; Castrillon, D.H.; Aguirre, A.J.; Wu, E.A.; Horner, J.W.; DePinho, R. Loss of p16Ink4a with retention of p19Arf predisposes mice to tumorigenesis. Nature 2001, 413, 86–91. [Google Scholar] [CrossRef] [PubMed]
  92. Serrano, M.; Lee, H.-W.; Chin, L.; Cordon-Cardo, C.; Beach, D.; DePinho, R. Role of the INK4a Locus in Tumor Suppression and Cell Mortality. Cell 1996, 85, 27–37. [Google Scholar] [CrossRef] [Green Version]
  93. Lv, F.; Li, N.; Kong, M.; Wu, J.; Fan, Z.; Miao, D.; Xu, Y.; Ye, Q.; Wang, Y. CDKN2a/p16 Antagonizes Hepatic Stellate Cell Activation and Liver Fibrosis by Modulating ROS Levels. Front. Cell Dev. Biol. 2020, 8, 176. [Google Scholar] [CrossRef] [PubMed]
  94. Lv, F.; Wu, J.; Miao, D.; An, W.; Wang, Y. p16 deficiency promotes nonalcoholic steatohepatitis via regulation of hepatic oxidative stress. Biochem. Biophys. Res. Commun. 2017, 486, 264–269. [Google Scholar] [CrossRef] [PubMed]
Figure 1. p16, p19, and p21 are differentially expressed during development and adulthood. Quantitative RT-PCRs for p16, p19, and p21 in mouse brains, hearts, kidneys, and livers at different time-points of development and in adulthood (n = 4 each, the four samples for E10.5 were each pooled from 7 organs, at E12.5, and 14.5 the four samples were pooled from four organs each). E: embryonic day, P: postnatal day, adult: 3 months of age, old: 16–18 months of age. Expression of each gene was normalized to the respective Gapdh, actin, and Rplp0 expression. Next, the average of all organs and samples at E10.5 was calculated. Individual samples were then normalized against this average value (see Materials and Methods for details). Significance was tested for all time points between E10.5 and 18 months. Data are mean ± SEM. * p < 0.05, ** p < 0.01, *** p < 0.001.
Cells 11 00541 g001
Figure 2. Differential spatiotemporal expression of p16, p19, and p21. Quantitative RT-PCRs for p16, p19, and p21 in mouse brains, hearts, kidneys, and livers at different time points of development and in adulthood (n = 4 each, the four samples for E10.5 were each pooled from 7 organs, at E12.5 and 14.5 the four samples were pooled from four organs each). E: embryonic day, P: postnatal day, adult: 3 months of age, old: 16–18 months of age. Expression of each gene was normalized to the respective Gapdh, actin, and Rplp0 expression. The average of all organs and samples at E10.5 was calculated and set to 1. Individual samples were then normalized against this average value (see Materials and Methods for details). Significance was tested between the different organs for each time point. Data are mean ± SEM. * p < 0.05, ** p < 0.01, *** p < 0.001.
Cells 11 00541 g002
Figure 3. p16 is expressed in the brain, heart, kidneys, and liver during embryonic development (E10–E14). Representative photomicrographs of p16 immunostaining on sections of mouse embryos (3,3′ diaminobenzidine (DAB) substrate, brown, hematoxylin counterstaining) at different stages before birth. Arrows indicate exemplary p16-positive cells. Scale bars represent 50 µm.
Cells 11 00541 g003
Figure 4. p16 is expressed in the brain, heart, kidneys, and liver during embryonic development (E16–E18). Representative photomicrographs of p16 immunostaining on sections of mouse embryos (3,3′ diaminobenzidine (DAB) substrate, brown, hematoxylin counterstaining) at different stages before birth. Arrows indicate exemplary p16-positive cells. Scale bars represent 50 µm.
Cells 11 00541 g004
Figure 5. p16 is continuously expressed after birth in vascular and organ cells. Representative photomicrographs of p16 immunostaining for the brain, heart, kidneys, and liver (3,3′ diaminobenzidine (DAB) substrate, brown, hematoxylin counterstaining) at different stages after birth. Note the persistent expression of p16 in neuronal cells of the brain, cardiomyocytes, tubular and glomerular kidney cells, and hepatocytes (green arrows) and endothelial cells (red arrows). Scale bars indicate 50 µm.
Cells 11 00541 g005
Figure 6. p16 is continuously expressed in adults and increases in old animals. Representative photomicrographs of p16 immunostaining for the brain, heart, kidneys, and liver (3,3′ diaminobenzidine (DAB) substrate, brown, hematoxylin counterstaining). Note the persistent expression of p16 in neuronal cells of the brain, cardiomyocytes, tubular and glomerular kidney cells, and hepatocytes (green arrows) and endothelial cells (red arrows), which increases with age. Scale bars indicate 50 µm.
Cells 11 00541 g006
Figure 7. Differential spatiotemporal expression of SASP factors in comparison to p16. Quantitative RT-PCRs for p16, Tgfb, Vegfa, Il6, and Mmp9 in mouse brains, hearts, kidneys, and livers at different time points of development and in adulthood (n = 4 each, the four samples for E10.5 were each pooled from 7 organs, at E12.5 and 14.5 the four samples were pooled from four organs each). Expression of each gene was normalized to the respective Gapdh, actin, and Rplp0 expression. Next, the average of all organs and samples at E10.5 was calculated. Individual samples were then normalized against this average value. Significance was tested for all time points between E10.5 and 18 months. E: embryonic day, P: postnatal day, adult: 3 months of age, old: 16–18 months of age. Data are mean ± SEM. * p < 0.05, ** p < 0.01, *** p < 0.001.
Cells 11 00541 g007
Figure 8. Liver vascular cells express higher levels of p16 than liver cells with aging. (a) Confocal images of Cd31 (red)/p16 (green) double-labeling on adult (3 months) (left image) and old (18 months) (right image) liver tissues. Arrows indicate p16/Cd31-positive vascular cells. Scale bars represent 50 µm. (b) Quantitative RT-PCRs for p16 of sorted liver endothelial cells (black bar) and liver organ cells (white bar) at 3 months (upper panel) and 18 months (lower panel). Expression of p16 was normalized to the respective Gapdh, actin, and Rplp0 expression. Data are mean ± SEM. *** p < 0.001. (c) Western Blot for p16 in 3- or 18-month-old liver endothelial cells and 3- or 18-month-old liver cells. Gapdh served as standard.
Cells 11 00541 g008
Table 1. Primers used for quantitative RT-PCR.
Gene of InterestOligonucleotide SequencesReferences
p16ink4F: AGGGCCGTGTGCATGACGTG
R: GCACCGGGCGGGAGAAGGTA
[59]
p19arfF: CGCTCTGGCTTTCGTGAAC
R: GTGCGGCCCTCTTCTCAA
[60]
p21F: AATTGGAGTCAGGCGCAGAT
R: CATGAGCGCATCGCAATCAC
[61]
Tgf-b1F: AGCTGGTGAAACGGAAGCG
R: GCGAGCCTTAGTTTGGACAGG
This study
VegfaF: CTCACCAAAGCCAGCACATA
R: AATGCTTTCTCCGCTCTGAA
[54]
Il-6F: CACTTCACAAGTCGGAGGCT
R: TGCCATTGCACAACTCTTTTCT
[54]
Mmp9F: CCATGCACTGGGCTTAGATCA
B: GGCCTTGGGTCAGGCTTAGA
[54]
GapdhF: AGGTCGGTGTGAACGGATTTG
R: TGTAGACCATGTAGTTGAGGTCA
[47,48,54,58]
β-actinF: CTTCCTCCCTGGAGAAGAGC
R: ATGCCACAGGATTCCATACC
[47,48,54,58]
Rplp0F: CACTGGTCTAGGACCCGAGAAG
R: GGTGCCTCTGGAGATTTTCG
[47,48,54,58]
Publisher’s Note: MDPI stays neutral with regard to jurisdictional claims in published maps and institutional affiliations.

