Article

The Expression Pattern of Adhesion G Protein-Coupled Receptor F5 Is Related to Cell Adhesion and Metastatic Pathways in Colorectal Cancer—Comprehensive Study Based on In Silico Analysis

by
Huining Kang
1,
Jakub Fichna
2,
Ksenia Matlawska-Wasowska
3,4,† and
Damian Jacenik
5,*,†
1
Department of Internal Medicine, University of New Mexico Health Sciences Center, Albuquerque, NM 87131-0001, USA
2
Department of Biochemistry, Faculty of Medicine, Medical University of Lodz, 92-215 Lodz, Poland
3
Department of Pediatrics, University of New Mexico Health Sciences Center, Albuquerque, NM 87131-0001, USA
4
Department of Pharmacology and Toxicology, University of Alabama at Birmingham, Birmingham, AL 35294-0019, USA
5
Department of Cytobiochemistry, Faculty of Biology and Environmental Protection, University of Lodz, 90-236 Lodz, Poland
*
Author to whom correspondence should be addressed.
These authors contributed equally to this work.
Cells 2022, 11(23), 3876; https://doi.org/10.3390/cells11233876
Submission received: 30 September 2022 / Revised: 19 November 2022 / Accepted: 21 November 2022 / Published: 1 December 2022

Abstract

:
Adhesion G protein-coupled receptor F5 (ADGRF5) is involved inthe neoplastic transformation of some cancer types. However, the significance of ADGRF5 expression signature and the impact of signaling pathways mediated by ADGRF5 during neoplastic transformation of the colon and colorectal cancer (CRC) progression has been poorly examined. Using Gene Expression Omnibus and The Cancer Genome Atlas datasets, we showed that ADGRF5 is overexpressed in the colons of patients with CRC. In line, combined analysis of ADGRF5 expression with clinical characterization revealed an increased expression of ADGRF5 in patients with more advanced stages of CRC compared to patients with early stages of CRC. The Spearman correlation analysis documented numerous genes positively and negatively correlated with the expression pattern of ADGRF5 in the colon of patients with CRC. In the colon of CRC patients, the expression signature of ADGRF5 was associated with genes participating in phosphatidylinositol 3-kinase/Akt, focal adhesion, cell adhesion molecules, and ribosome signaling pathways. Of note, ADGRF5 expression correlated with the levels of tumor-infiltrating immune cells in the colon of CRC patients. Moreover, we found that CRC patients with high expression of ADGRF5 had a significantly lower probability of overall survival and disease-free survival. In conclusion, our results support the prognostic value of ADGRF5 and its potent therapeutic implication in CRC.

1. Introduction

Among several cancer types, colorectal cancer (CRC) is one of the most diagnosed cancer types in men and women worldwide. Most CRCs are sporadic, and an accumulation of genetic and epigenetic alterations is observed. Genomic alterations are responsible for oncogenes activation and/or tumor suppressor genes inactivation leading to the neoplastic transformation of the colon [1,2]. Several processes, such as chromosomal and microsatellite instability, as well as aberrant CpG methylation, are responsible for CRC development and progression. On the contrary, numerous signaling pathways such as mitogen-activated protein kinase, phosphatidylinositol 3-kinase (PI3K), transforming growth factor-β (TGF-β), WNT, and Notch pathways are deregulated in CRC and play crucial roles in the regulation of proliferation and migration as well as invasion of CRC cells [3,4,5,6,7]. In the past decades, several efforts have been made to improve the prevention of the neoplastic transformation of the colon and the treatment strategy for patients with CRC [2]. Despite many therapeutic approaches, such as surgical intervention, radiotherapy, and chemotherapy, including both classical and biological agents, many therapeutic strategies are not enough effective in the treatment of CRC patients. This clinical challenge seems to be directly associated with the late diagnosis of CRC. In fact, 86% of patients manifest some symptoms at the time of diagnosis that are directly related to more advanced disease stages [8]. Thus, additional efforts should be taken to improve CRC detection and treatment strategies for CRC patients.
Accumulating evidence highlights the role of adhesion G protein-coupled receptors (GPCRs) in multiple processes such as metabolism and immune response as well as several pathological conditions, including conditions that affect the cardiovascular, urinary, endocrine and nervous systems, respiratory and gastrointestinal tract systems, reproductive organs, and cancers, among others [9]. The adhesion GPCRs are a unique receptor subfamily in which amino acids sequences are composed of a GPCR proteolysis site and a highly conserved GPCR autoproteolysis-inducing domain which is responsible for the self-cleavage activity of adhesion GPCRs [9]. On the other hand, adhesion GPCRs are characterized by long extracellular fragments with multiple domains that mediate cell-cell and cell-matrix interaction [9]. Most adhesion GPCRs are orphan receptors; however, growing evidence suggests that adhesion GPCRs can act as typical GPCRs by stimulating numerous signaling pathways through modulation of G proteins activity [10].
The adhesion G protein-coupled receptor F5 (ADGRF5; also known as a G protein-coupled receptor 16, i.e., GPR116) is a member of family VI adhesion GPCRs, which contain immunoglobulin-like and immunoglobulin I-set domains as well as sperm protein, enterokinase, and agrin domain in the extracellular fragment [9]. ADGRF5 is essential in lung surfactant homeostasis. Specifically, it regulates surfactant lipid and protein accumulation in the alveolar space leading to labored breathing, which is directly associated with reduced lifespan [11,12,13]. Other studies indicate that ADGRF5 is engaged in the immune response, adipose function, glucose intolerance, and insulin resistance development, as well as angiogenesis [14,15,16]. Moreover, ADGRF5 affects the development and progression of breast and lung cancers as well as CRC [17,18,19,20,21,22,23]. Nevertheless, only limited efforts have been made to understand the roles of ADGRF5 in the neoplastic transformation of colon and CRC progression. Using Gene Expression Omnibus (GEO) and The Cancer Genome Atlas (TCGA) datasets, we studied ADGRF5 expression patterns and the association between ADGRF5 expression signature and immune cell infiltration as well as signaling pathways related to neoplastic transformation of colon and CRC progression.

2. Materials and Methods

2.1. Datasets and Patient Characteristics

The datasets from GEO (accession number: GSE21510, GSE32323, and GSE117606) were used to evaluate the expression of ADGRF5 in the colon of controls and CRC patients. The level of ADGRF5 expression in three GEO datasets was calculated using the z-score method independently in GSE21510, GSE32323, and GSE117606 datasets based on log2-transformed values. In total, 129 subjects (control, n = 25; CRC, n = 104) for GSE21510, 34 subjects (control, n = 17; CRC, n = 17) for GSE32323 and 139 subjects (control, n = 65; CRC, n = 74) for GSE117606 were enrolled in the study. The dataset and corresponding clinical characteristics of CRC patients were obtained from TCGA, Firehose Legacy from cBioPortal for Cancer Genomic [24,25]. In total, 382 subjects were employed in the study. Microarray gene expression data described as an RNA Seq v2 mRNA median z-score were filtered for missing values and used in the analysis of ADGRF5 expression pattern and survival analysis of patients with CRC.

2.2. Correlation Analysis

Positive and negative correlations between the expression of ADGRF5 and the other genes were estimated using the co-expression tool in cBioPortal for the Cancer Genomic and TCGA, Firehose Legacy dataset. Genes correlated positively with ADGRF5 expression and characterized by Spearman value higher or equal to 0.50 were employed in further analysis. The top 1000 genes negatively correlated with the expression of ADGRF5 were used in subsequent analysis. To note, genes negatively correlated with the expression of ADGRF5 were characterized by an R-value of the correlation co-efficiency significantly lower than 0.50, and for this reason, the top 1000 genes negatively correlated with the expression of ADGRF5 in the colon of CRC patients was obtained.

2.3. Pathway Enrichment Analysis

Pathway enrichment analyses were performed using selected genes correlated with the expression of ADGRF5, which were identified in the TCGA, Firehose Legacy dataset. Positively and negatively correlated genes with ADGRF5 expression patterns were classified into signaling pathways using Database for Annotation, Visualization, and Integrated Discovery (DAVID) functional annotation analysis [26,27]. Gene lists included positively and negatively correlated genes with ADGRF5 expression and were uploaded separately using the official gene symbol with limited species to Homo sapiens in the background. The Kyoto Encyclopedia of Genes and Genomes (KEGG) pathway was used to evaluate signaling pathways based on the most correlated genes with the expression of ADGRF5 documented in TCGA, Firehose Legacy dataset.

2.4. Gene Expression Profiling

Gene expression data for 55 genes that positively correlated and 86 genes negatively correlated with the expression of ADGRF5 were ranked according to ADGRF5 expression signature in the colon of CRC patients derived from TCGA, Firehose Legacy dataset. Hierarchical clustering was performed in Cluster 3.0 using average linkage. Java TreeView 3.0 were used for the visualization of genes correlated with the expression of ADGRF5 belonging to the most significant signaling pathways.

2.5. Survival Analysis

The association of ADGRF5 expression signature with the probability of overall survival (OS) and disease-free survival (DFS) was assessed by examining the difference in survival between patients with high and low ADGRF5 expressions. The high expressions are above the upper tertile, and the low expressions are below the lower tertile. The Kaplan-Meier method was used to estimate OS and DFS probability, and the Log-rank test was used to compare the OS or DFS probabilities between the patient groups.

2.6. Immune Cell Infiltration Analysis

TIMER 2.0 was used to study the correlation between the expression of ADGRF5 and immune cell infiltration in patients with CRC [28,29,30]. Systematic analysis of tumor-infiltrating immune cells was limited to the TIMER algorithm and immune cell types with a p-value < 0.05.

2.7. Statistical Analysis

Descriptive statistics were used to summarize the associations of ADGRF5 expression with the clinical characteristics of patients with CRC. Median ± interquartile range and mean ± standard deviation (SD) of ADGRF5 expression were used to estimate the ADGRF5 expression in the GEO and TCGA datasets, respectively. A Non-parametric Mann-Whitney U test was used to detect the difference of each variable. The Spearman correlation coefficient was used to identify genes whose expression was associated with that of the ADGRF5 expression signature. All the analyses were performed using GraphPad Prism 5.0 and R software.

3. Results

3.1. ADGRF5 Is Overexpressed in the Colon of Patients with Colorectal Cancer

The ADGRF5 expression pattern was estimated using GSE21510, GSE32323, and GSE117606 datasets obtained from GEO, and the expression of ADGRF5 was evaluated in each dataset independently. As shown in Figure 1A–C, a statistically significant higher copy number of the ADGRF5 gene in the colon of CRC patients compared to controls (p < 0.05 for GSE32323; p < 0.001 for GSE21510 and GSE117606) was documented.

3.2. ADGRF5 Expression Is Related to Clinical Characterization of Patients with Colorectal Cancer

In order to further explore the significance of ADGRF5 expression signature in the colon of CRC patients, we assembled a large collection of CRC patients using the Firehose Legacy dataset available at TCGA. The data from the dataset for ADGRF5 expression and corresponding clinical characterization of CRC patients were used. The results are shown in Table 1. The expression of ADGRF5 tended to be higher in the colon of black or African American patients with CRC (p = 0.058) compared to white patients with CRC. We found an increased expression of ADGRF5 in CRC patients with a mucinous type of colon adenocarcinoma compared to colon adenocarcinoma (p < 0.01). ADGRF5 expression changes were documented only in CRC patients with tumors localized in the colon but not in the rectum. Moreover, in the colon of patients with CRC with more advanced stages, classified as III and IV stage, the expression of ADGRF5 was higher than in patients with CRC stages corresponding to I and II stage (p < 0.05). Analysis of ADGRF5 expression in CRC patients according to tumor-node-metastasis (TNM) staging system revealed higher expression of ADGRF5 when the extent of the tumors was classified as a T3 and T4 compared to the tumors described as a T1 and T2 (p < 0.01). Significantly higher copy numbers of the ADGRF5 gene (p < 0.05) were found in CRC patients with nearby lymph nodes affected by tumor cells (N1/2) in relation to CRC patients, which were characterized by a lack of tumor cells in the nearby lymph nodes (N0). Moreover, we did not identify statistically significant differences in the expression of ADGRF5 according to gender, age, race, or histological diagnosis for rectum in patients with CRC. Collectively, these results indicate that ADGRF5 participates in the progression of CRC.

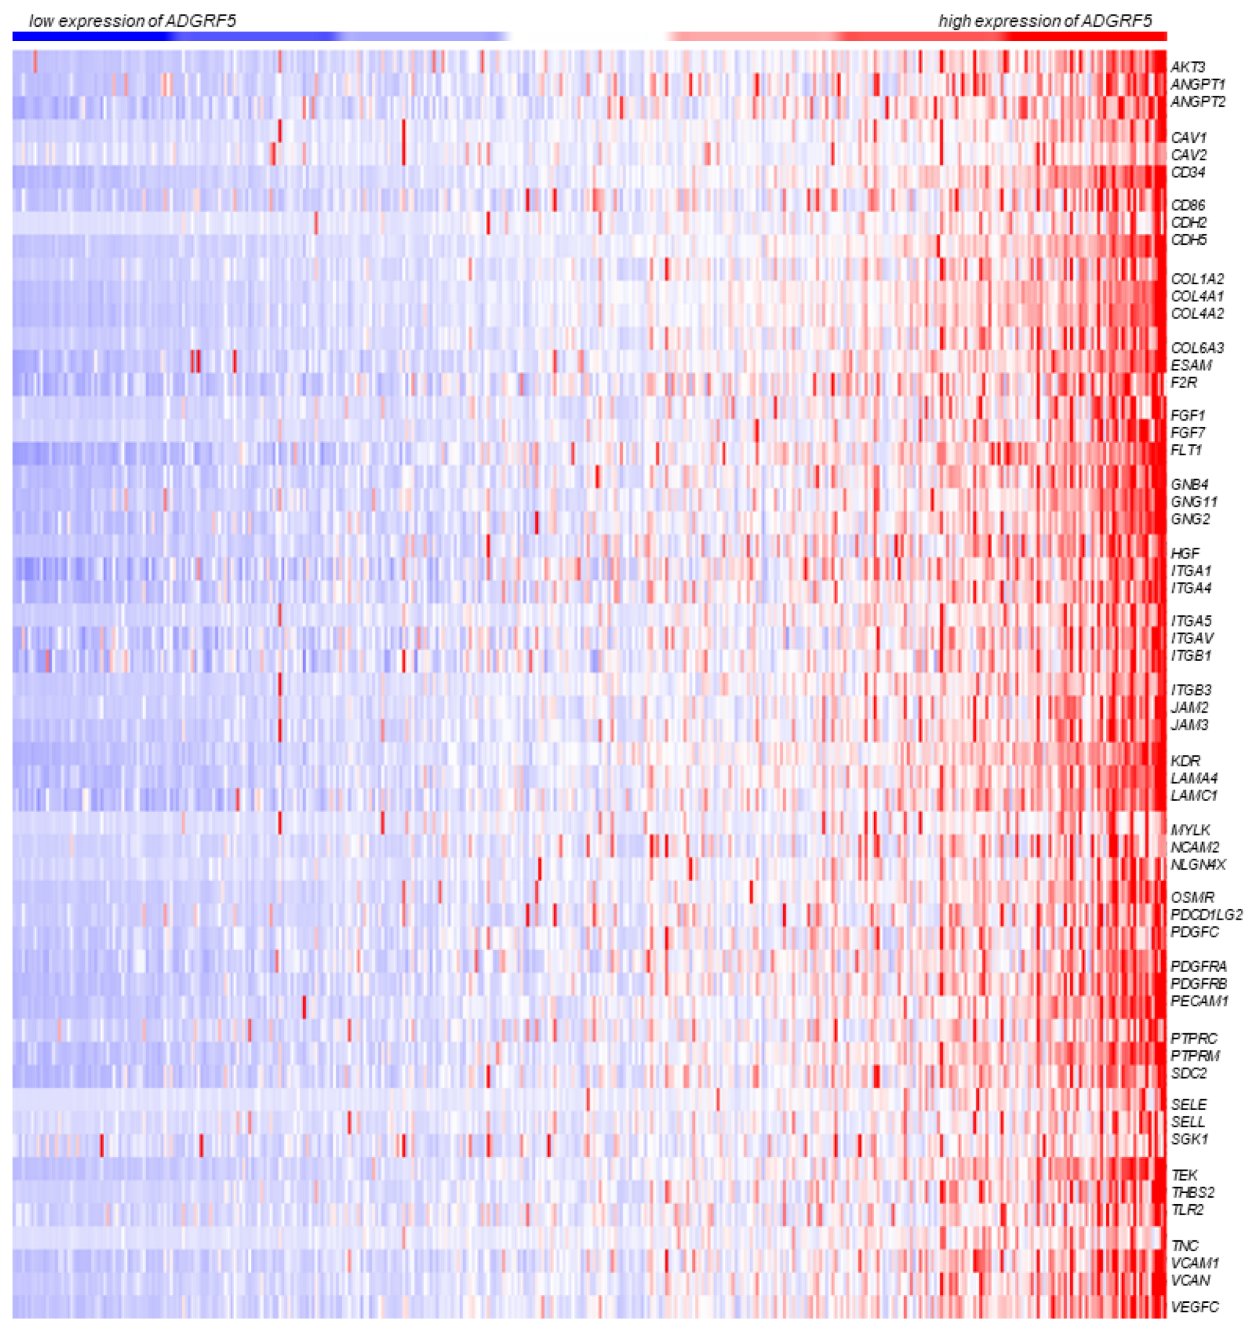
3.3. ADGRF5 Expression Is Positively Correlated with Genes Participating in Cell Adhesion and Metastatic Pathways in Colorectal Cancer

We next performed correlation analysis using the above-mentioned dataset provided by TCGA, and we identified numerous genes positively correlated with the expression of ADGRF5 in the colon of CRC patients. We found 500 genes positively correlated with the expression of ADGRF5 and characterized by Spearman R-value higher or equal to 0.50 in the TCGA, Firehose Legacy dataset.
To further explore the functional significance of the 500 genes identified, we performed signaling pathway analyses using DAVID functional annotation and KEGG pathway analysis tools. The genes identified were significantly enriched in PI3K/Akt (hsa04151), focal adhesion (hsa04510), and cell adhesion molecules (hsa04514) signaling pathways (Figure 2). The symbol, ID, and description of genes representing PI3K/Akt, focal adhesion and cell adhesion molecules signaling pathways, and R-value of the correlation co-efficiency are presented in Table 2, Table 3 and Table 4, respectively.
In the PI3K/Akt signaling pathway we found genes such as serine/threonine kinase 3, i.e., AKT3, angiopoietin (ANGPT) 1 and 2, collagen type I α2 chain (COL1A1), collagen type III α1 chain (COL3A1), collagen type IV type α1 (COL4A1) and collagen type IV α2 chain (COL4A2), collagen type V α1 chain (COL5A1), collagen type V α2 chain (COL5A2) and collagen type V α3 chain (COL5A3), collagen type VI α3 chain (COL6A3), collagen type XI α1 chain (COL11A1), collagen type XXIV α1 chain (COL24A1), coagulation factor II thrombin receptor (F2R), fibroblast growth factor (FGF) 1 and 7, FMS-related receptor tyrosine kinase 1 (FLT1), G protein subunit β4 (GNB4), G protein subunit γ (GNG) 2 and 11, hepatocyte growth factor (HGF), integrin subunit α (ITGA) 1, 4, 5, and V, integrin subunit β (ITGB) 1 and 3, kinase insert domain receptor (KDR), laminin subunit α4 (LAMA4), laminin subunit γ1 (LAMC1), oncostatin M receptor (OSMR), platelet-derived growth factor C (PDGFC), platelet-derived growth factor receptor α (PDGFRA), and β (PDGFRB), serum/glucocorticoid regulated kinase 1 (SGK1), TEK receptor tyrosine kinase (TEK), thrombospondin 2 (THBS2), tenascin C (TNC), Toll-like receptor 2 (TLR2), and vascular endothelial growth factor C (VEGFC).
In the colons of CRC patients, we found genes such as AKT3, caveolin (CAV) 1 and 2, COL1A2, COL3A1, COL4A1, COL4A2, COL5A1, COL5A2, COL5A3, COL6A3, COL11A1, COL24A1, FLT1, HGF, ITGA1, ITGA4, ITGA5, ITGAV, ITGB1, ITGB3, KDR, LAMA4, LAMC1, myosin light chain kinase (MYLK), PDGFC, PDGFRA, PDGFRB, THBS2, TNC and VEGFC which are characterized by a positive correlation with ADGRF5 expression pattern, and participate in focal adhesion signaling pathway (Table 3).
In the cell adhesion molecules signaling pathway, we identified numerous genes positively correlated with ADGRF5 expression signature such as CD34 (CD34) and CD86 (CD86) molecules, cadherin (CDH) 2 and 5, endothelial cell adhesion molecule (ESAM), ITGA4, ITGAV, ITGB1, junctional adhesion molecule (JAM) 2 and 3, neural cell adhesion molecule 2 (NCAM2), neuroligin 4 X-linked (NLGN4X), programmed cell death 1 ligand 2 (PDCD1LG2), platelet and endothelial cell adhesion molecule 1 (PECAM1), protein tyrosine phosphatase receptor (PTPR) type C and M, syndecan 2 (SDC2), selectin (SEL) E and L, vascular cell adhesion molecule 1 (VCAM1) and versican (VCAN) (Table 4).
Subsequently, we next performed expression profiling of 55 genes participating in PI3K/Akt, focal adhesion, and cell adhesion molecules signaling pathways according to ADGRF5 expression ranked from low to high expression of ADGRF5. As shown in Figure 3, the expression pattern of genes representing the above-mentioned signaling pathways was similar to the expression profile of ADGRF5 in the colon of CRC patients (Figure 3).

3.4. ADGRF5 Expression Is Negatively Correlated with Genes Participate in Ribosome Pathway in Colorectal Cancer

DAVID functional annotation analysis and KEGG pathway analysis revealed that the top 1000 genes negatively correlated with the expression of ADGRF5 are involved in various signaling pathways, including ribosome (hsa03010), which was the most significant signaling pathway (adjusted p < 0.00001) associated with the expression signature of ADGRF5 in CRC patients. The symbol and description of genes enriched in ribosome signaling pathways and the R-value of the correlation co-efficiency are presented in Table 5. In the ribosome signaling pathway, we identified negatively correlated genes such as FAU ubiquitin-like and ribosomal protein S30 fusion (FAU), mitochondrial ribosomal protein L (MRPL) 1, 2, 3, 4, 11, 12, 14, 15, 16, 17, 20, 21, 22, 23, 24, 27, 32, 34 and 36, mitochondrial ribosomal protein S (MRPS) 2, 5, 9, 12, 15, 16, 17 and 18A, ribosomal protein L (RPL) 3, 5, 6, 7A, 8, 11, 12, 13, 14, 15, 18, 18A, 19, 23, 23A, 24, 27, 27A, 28, 29, 31, 32, 34, 35, 35A, 36, 37, 37A, 38 and 39, ribosomal protein lateral stalk subunit p (RPLP) 0, 1 and 2, ribosomal protein S (RPS) 2, 3, 4X, 6, 7, 8, 9, 10, 11, 13, 14, 15, 15A, 16, 17, 18, 19, 21, 23, 24, 25, 27A, 29 and A, as well as ubiquitin A-52 residue ribosomal protein fusion product 1 (UBA52).
Next, we ranked the expression of 86 genes in the ribosome signaling pathway according to the expression pattern of ADGRF5 in the colon of patients with CRC. As shown in Figure 4, lower expression of ADGRF5 was associated with higher expression of genes participating in the ribosome signaling pathway, and conversely, higher expression of ADGRF5 was associated with lower expression of genes regulating ribosome. Nevertheless, with weak correlation co-efficiency for genes related to ribosome signaling pathway, the expression pattern of genes negatively correlated with the expression of ADGRF5 is not so pronounced as in the case of genes positively correlated with ADGRF5 expression signature.

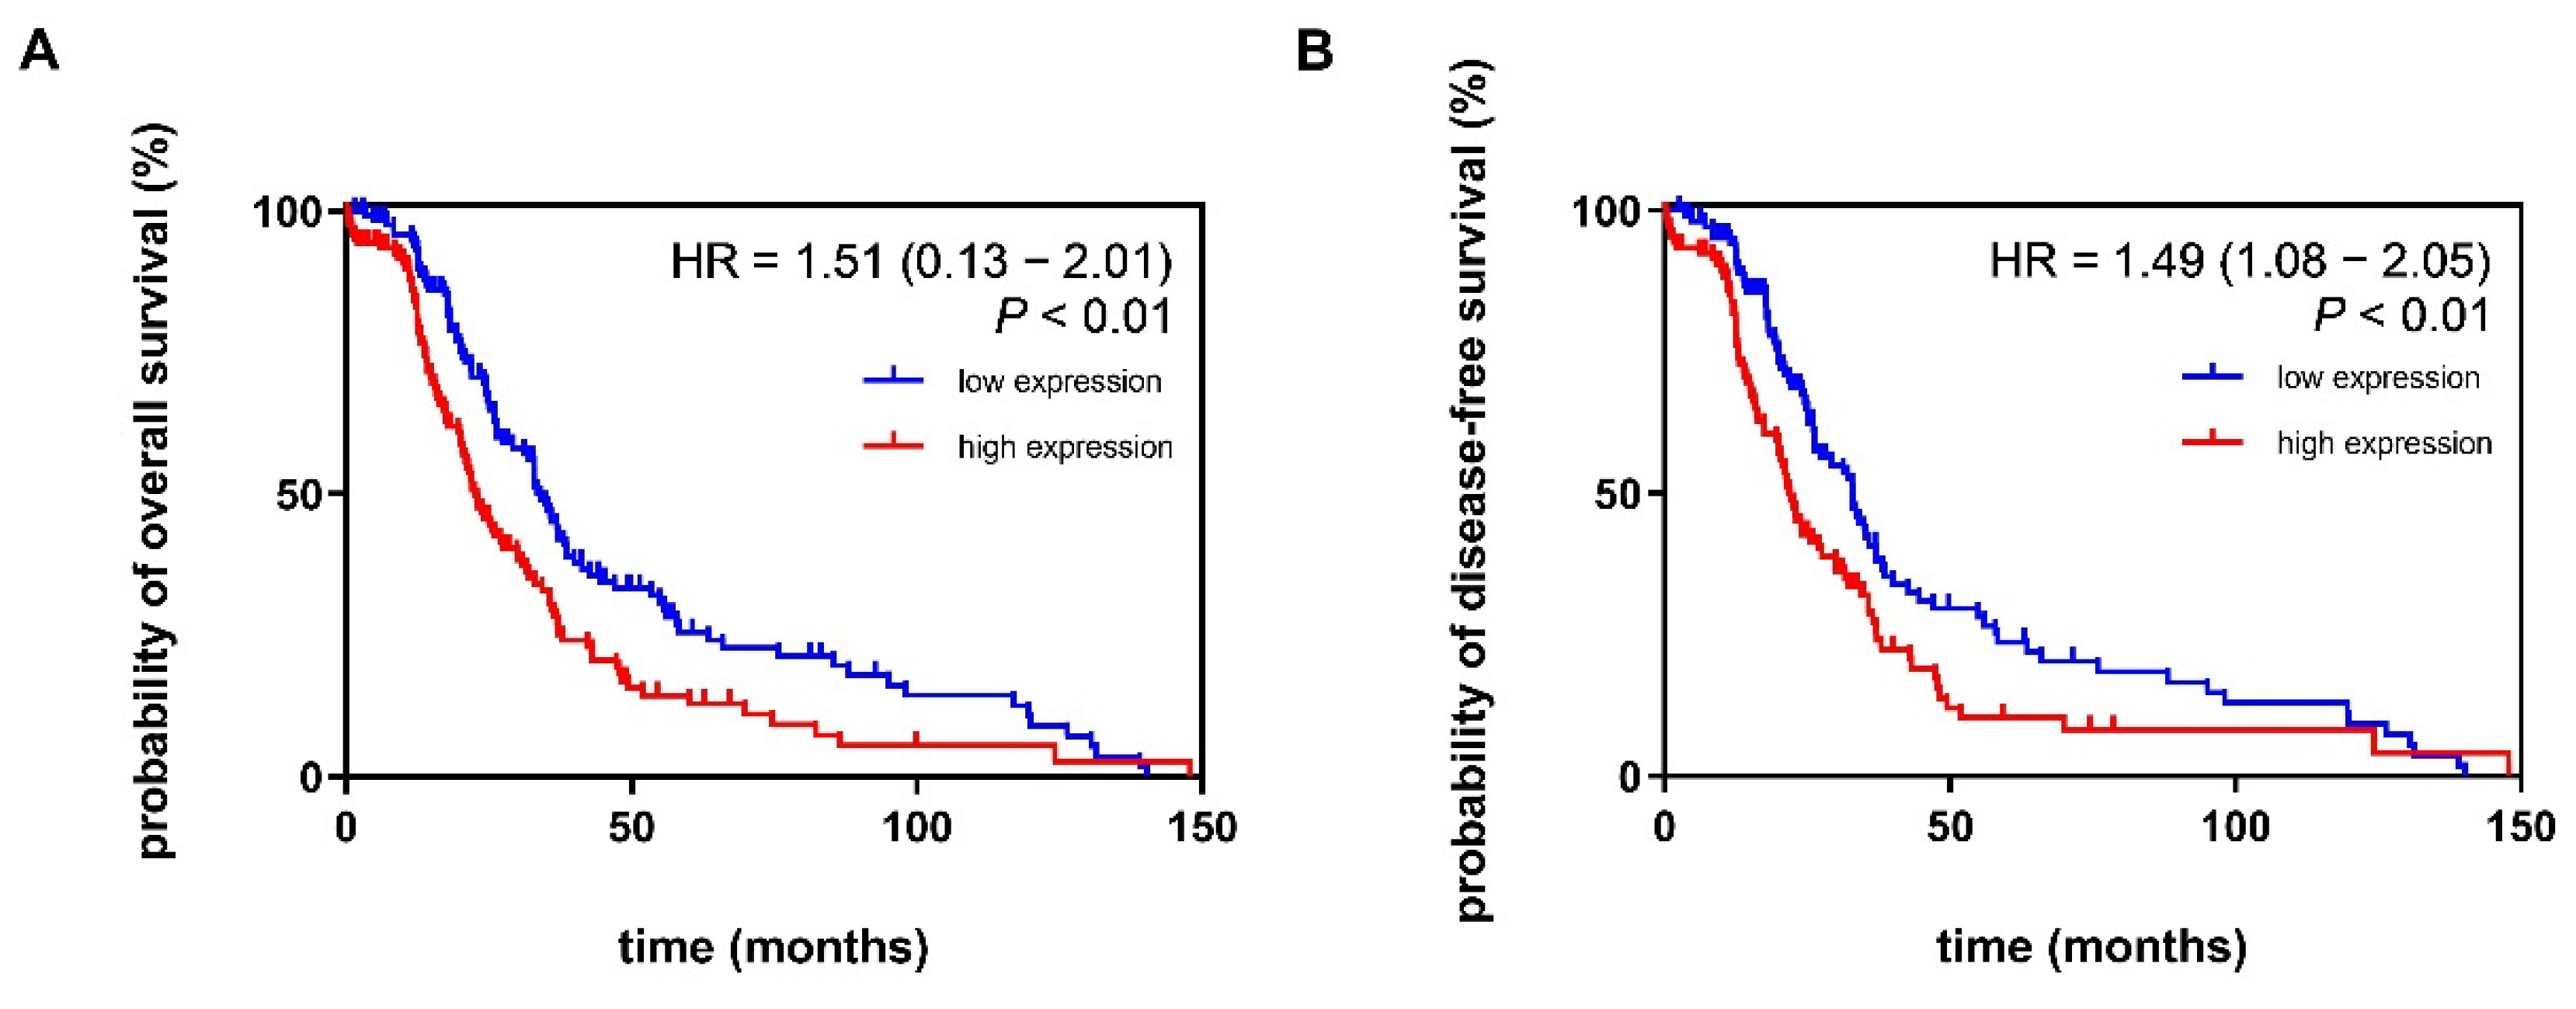
3.5. Increased Expression Pattern of ADGRF5 in the Colon of Patients with CRC Is Associated with Poor Probability of Overall Survival and Disease-Free Survival

We investigated the association of ADGRF5 expression signature with CRC patient survival using data obtained from the TCGA, Firehose Legacy dataset. We found that the expression of ADGRF5 in the colon of CRC patients was associated with the probability of both OS and DFS. As shown in Figure 5A,B, higher expression of ADGRF5 was accompanied by a worse probability of OS and DFS in CRC patients, which was confirmed by HR = 1.51 (p < 0.01) and HR = 1.49 (p < 0.01) for CRC patients, respectively. To note, CRC patients with higher expression of ADGRF5 were characterized by a median survival time of 34 months for OS and 32 months for DFS when compared to CRC patients with lower expression of ADGRF5 whose median survival time was evaluated as 22 months for both OS and DFS.

3.6. Expression Pattern of ADGRF5 Is Correlated with the Levels of Tumor-Infiltrating Immune Cells in the Colon of Patients with CRC

Finally, we evaluated the association between ADGRF5 expression and the level of immune cell infiltration in the colon of CRC patients using TIMER 2.0. Among distinct types of immune cells, the levels of dendritic cells (R = 0.62), macrophages (R = 0.56), neutrophils (R = 0.54), and CD4+ (R = 0.39), as well as CD8+ (R = 0.23) T cells infiltration were positively correlated (p < 0.05) with the expression of ADGRF5 in the colon of patients with adenocarcinoma (Figure 6A). On the other hand, the level of B cells infiltration was negatively correlated (R = −0.12, p < 0.05) with the expression of ADGRF5 in the colon of patients with adenocarcinoma (Figure 6A). As shown in Figure 6B, the levels of dendritic cells (R = 0.61), macrophages (R = 0.56), neutrophils (R = 0.55), CD8+ (R = 0.32), and CD4+ (R = 0.31) T cells, as well as B cells (R = 0.10) infiltration, were positively correlated (p < 0.05) with the expression of ADGRF5 in the rectum of patients with adenocarcinoma.

4. Discussion

According to The Human Protein Atlas, ADGRF5 is widely expressed in many types of human tissues, which suggests that signaling pathways mediated by ADGRF5 may be involved in the regulation of both physiological and pathophysiological conditions. Accumulating evidence indicates that ADGRF5 is a crucial member of adhesion GPCRs that mediate numerous processes such as proliferation, apoptosis, and migration, as well as invasion in the progression of some cancer types [17,18,19,20,21,22,23]. In fact, Tang et al. identified that ADGRF5 acts as a critical regulator of breast cancer metastasis. An increased ADGRF5 expression is associated with breast cancer progression and recurrence and poor prognosis of patients with breast cancer [18]. It should also be noted that the significance of ADGRF5 in breast cancer was evaluated in vitro and in vivo, and both approaches confirmed that ADGRF5 depletion in breast cancer cells was related to the reduced ability of breast cancer cells to migrate and invade [18].
Here, by employing three independent GEO datasets, we demonstrated that ADGRF5 is overexpressed in the colon of patients with CRC when compared to controls. In addition, the analysis of the ADGRF5 expression signature in the TCGA, Firehose Legacy dataset revealed a stage-dependent increase of ADGRF5 expression in CRC patients, and ADGRF5 expression patterns were associated with the progression of CRC. Yang et al. linked the deregulation of ADGRF5 expression to the differentiation stage and distant metastasis in CRC [19]. In our study, we demonstrated that the ADGRF5 expression pattern is associated not only with the CRC stage but also with lymph node metastasis, suggesting that ADGRF5 may be involved in the regulation of epithelial-mesenchymal transition of CRC cells. In addition, we found an increased expression of ADGRF5 in patients with a mucinous type of colon adenocarcinoma compared to colon adenocarcinoma. Colon mucinous adenocarcinoma is manifested by the presence of abundant mucous secretion comprising at least 50% of the tumor volume [31]. Mucin 2 and 5AC are two major types of mucins that are involved in the development of colon mucinous adenocarcinoma. However, the mechanisms by which both mucins regulate CRC progression are poorly understood. Clinically, colon mucinous adenocarcinoma is associated with worse clinical characteristics and worse prognosis compared to patients with colon adenocarcinoma [32,33]. Collectively, our findings suggest that CRC progression co-exists with ADGRF5 overexpression in the colon of CRC patients, suggesting the roles of ADGRF5 in the development and progression of CRC.
Little is known about the possible mechanisms responsible for the induction of ADGRF5 expression in cancer. Among several post-transcriptional mechanisms, RNA interference seems to be involved in the regulation of ADGRF5 gene expression in CRC. Studies by Wang et al. demonstrated that ADGRF5 is a direct target for miR-511-5p [21]. Functionally, miR-511-5p mediates neoplastic transformation and progression of lung squamous cell carcinoma and CRC, as well as playing a role in the regulation of immune response by monocytes [21,34,35]. In CRC, miR-511-5p acts as a tumor suppressor microRNA, and the expression of miR-511-5p is reduced in both CRC tissues and cell lines compared to the controls. Moreover, miR-511-5p expression is inversely correlated with the differentiation of CRC and TNM stages of CRC patients. Furthermore, survival analysis revealed that CRC patients with low expression of miR-511-5p are characterized by a poor probability of OS and DFS [21]. It was estimated that the 3′UTR region of the ADGRF5 mRNA sequence contains the binding site for miR-511-5p and ADGRF5-miR-511-5p interaction seems to be responsible for modulation of proliferation, apoptosis, and invasion of CRC cells. In vitro studies on HCT116 and LOVO cells conducted by Yang et al. also noted that silencing of the ADGRF5 gene was accompanied by the reduced ability of CRC cells to proliferate and invade [19]. Above mentioned processes seem to be mediated by the regulation of both Akt and extracellular signal-regulated kinase (ERK) activity. In fact, in vitro analysis using CRC cells and siRNA against ADGRF5 documented that the silencing of ADGRF5 led to a reduction of CDH2, Snail family zinc finger transcriptional factor, phospho-Akt, and phospho-ERK 1/2 protein level suggesting that its role in the progression of CRC [19].
The main hallmark of cancer progression is epithelial-mesenchymal transmission underlying cancer cells’ migratory and invasive capabilities. Accumulating evidence indicates that numerous signaling pathways participate in epithelial-mesenchymal transmissions, such as TGF-β, receptor tyrosine kinase, extracellular matrix, or PI3K/Akt, among others [36]. Our study documented a strong positive correlation between ADGRF5 expression pattern and expression of a number of genes involved in PI3K/Akt, focal adhesion, and cell adhesion molecules signaling pathways. Then PI3K/Akt signaling pathway is a major effector of epithelial-mesenchymal transmission and immunosuppression, and according to numerous reports, the action of the PI3K/Akt signaling pathway in cancers is multidirectional. In CRC, the hyperactivated PI3K/Akt signaling pathway positively regulates transcription mediated by NF-κB and β-catenin, which in turn are responsible for the pro-tumorigenic and invasive capacity of cancer cells [4,37,38]. It has to be highlighted that ADGRF5 may mediate the pro-tumorigenic action of the PI3K/Akt pathway through G protein activity regulation. The previous findings by Tang et al. documented that ADGRF5 affects signaling pathways responsible for breast cancer progression coupling to Gαq [18]. On the contrary, the PI3K/Akt signaling pathway plays a role in the negative regulation of the CDH1 gene encoding E-cadherin, which is a crucial regulator of cell adhesion and tight junctions and serves as a marker of epithelial phenotype cells [39,40]. In fact, mesenchymal-type cancer cells have low expression of epithelial markers like CDH1 and high expression of mesenchymal markers such as CDH2 gene encoding N-cadherin, fibronectin, and vimentin, among others. Additionally, invasive cancer cells are characterized by a lack of polarization and decreased cell adhesion, as well as disturbed cell-cell and cell-matrix interactions [39]. Cadherins, caveolins, collagens, integrins, junctional adhesion molecules, laminins, and selectins all maintain proper cell function and physiological morphology of cells. Observational studies documented aberrant expression of CAV1, COL1A2, COL3A1, COL5A2, COL6A3, COL11A1, ITGA1, ITGA5, ITGB1, LAMA4, JAM2, JAM3, and VCAM1 in CRC, among others [41,42,43,44,45,46,47,48,49,50,51,52,53]. Numerous of the above-mentioned genes represent focal adhesion regulators and extracellular matrix/receptor interaction signaling molecules. The expression of these genes was positively correlated with the expression of ADGRF5 signature in the colon of patients with CRC in our studies (refer to Table 2, Table 3 and Table 4). Our results suggest that ADGRF5 may participate in cell junction machinery and may be involved in epithelial-mesenchymal transmission during the development of CRC. Nevertheless, further studies employing in vitro and in vivo approaches are required to dissect the mechanism by which ADGRF5 contributes to the change of epithelial to mesenchymal phenotype of cells during CRC progression.
In the colon of patients with CRC, we identified a negative correlation between ADGRF5 expression and the expression of 86 genes of the ribosome signaling pathway. It should also be noted that the R-value describing the Spearman correlation between ribosomal genes was lower than for genes positively correlated with ADGRF5 expression signature, and weak to moderate association between ADGRF5 expression pattern and ribosomal genes expression was documented. Nevertheless, in CRC, alteration of various ribosomal genes is recognized, which indicates that ribosomal stress contributes to CRC development and progression. Indeed, ribosomal protein genes contribute to processes such as proliferation, apoptosis, hypoxia, glycolysis, and cell cycle regulation during neoplastic transformation of the colon, and their action seems to be associated, for instance, with the formation of ribosomal subunits or rRNA processing [54,55,56,57].
Finally, using Kaplan-Meier survival curves, we analyzed the clinical significance of ADGRF5 expression signature in patients with CRC and showed that CRC patients with increased expression of ADGRF5 in the colon had an inferior probability of OS and DFS compared to CRC patients with reduced ADGRF5 expression in the colon. The results from survival and pathway enrichment analyses indicate that ADGRF5 may modulate CRC progression in patients promoting pro-metastatic pathways. Additionally, our analyses document the link between ADGRF5 expression and the levels of tumor-infiltrating immune cells in the colon and rectum of patients with adenocarcinomas. The levels of immune cell infiltration and composition of immune cells in the tumor microenvironment are crucial for patients’ survival and cancer prognosis. However, conflicting results regarding the tumor-infiltrating cells seem directly related to tumor microenvironment plasticity, which is continuously changing in response to signals from surrounding tissues. Nevertheless, accumulating evidence highlighted the crucial role of T cells, neutrophils, and macrophages, as well as dendritic cells, in the development and progression of CRC. Wang et al. found that the levels of T cells may predict the treatment efficiency and OS as well as progression-free survival in CRC patients [58]. On the contrary, fibroblasts, macrophages, and neutrophils may support tumor growth and the invasion ability of cancer cells. For instance, neutrophils are one of the major sources of matrix metallopeptidase 9, which promotes extracellular matrix remodeling and angiogenesis [59,60]. Furthermore, macrophages also affect the above-mentioned processes, as evidenced by their role in the regulation of proteins related to epithelial-mesenchymal transition [61]. In our study, dendritic cells showed the strongest correlation with the expression of ADGRF5 among all the tested types of immune cells. Strikingly, studies by Sandel et al. showed that tumor-infiltrating dendritic cells affected local tumor cell and immune cell interactions, and their levels were associated with prognosis in CRC patients [62]. The link between ADGRF5 and inflammation was pointed out in the study performed by Kubo et al. [63]. Our evidence from immune cell infiltration analysis in the colon of CRC patients supports previous findings about ADGRF5 function in immunity. Moreover, correlation analysis indicated that ADGRF5 expression is associated with genes related to immune response, such as TLR2, which plays a fundamental role in the activation of innate immune response, among others [64].
Nevertheless, the role of ADGRF5 in both immunomodulation and neoplastic transformation of the colon remains elusive. Thus, the results of our comprehensive in silico study provide a basis for further investigation of the roles of ADGRF5 in CRC and other tumors.

5. Conclusions

In this study, we identified that ADGRF5 is overexpressed in the colons of patients with CRC, and ADGRF5 expression patterns are associated with the disease stage. Moreover, patients with high expression of ADGRF5 are characterized by a shorter probability of overall and disease-free survival. Our results suggest that ADGRF5 may play a role in epithelial-mesenchymal transmission and may be responsible for the modulation of cell adhesion and metastatic pathways during the neoplastic transformation of the colon, and CRC progression. Further studies on identifying ADGRF5-mediated pathways are warranted to develop a better understanding of the roles of ADGRF5 in the development and progression of CRC.

Author Contributions

Conceptualization, D.J.; methodology, formal analysis, investigation and data curation, H.K., K.M.-W. and D.J.; writing—original draft preparation, D.J.; writing—review and editing, H.K., J.F., K.M.-W. and D.J.; visualization, H.K., K.M.-W. and D.J.; supervision, project administration and funding acquisition, D.J. All authors have read and agreed to the published version of the manuscript.

Funding

This work was supported by grants (2019/32/C/NZ5/00064 to D.J.) from the National Science Centre, Poland; the University of New Mexico Comprehensive Cancer Center Support Grant (Biostatistics Shared Resource, NCI P30CA118100) and NIH National Cancer Institute (NCI) grant R01 CA237165 (to K.M-W.). D.J. was supported by the Foundation for Polish Science (FNP, START 30.2021).

Institutional Review Board Statement

Not applicable.

Informed Consent Statement

Not applicable.

Data Availability Statement

Data is contained within the article.

Acknowledgments

The results shown here are in part based upon data generated by the TCGA Research Network: https://www.cancer.gov/tcga (accessed on 1 September 2022).

Conflicts of Interest

The authors declare no conflict of interest. The funders had no role in the design of the study; in the collection, analyses, or interpretation of data; in the writing of the manuscript, or in the decision to publish the results.

References

  1. Lao, V.V.; Grady, W.M. Epigenetics and colorectal cancer. Nat. Rev. Gastroenterol. Hepatol. 2011, 8, 686–700. [Google Scholar] [CrossRef] [Green Version]
  2. Dekker, E.; Tanis, P.J.; Vleugels, J.L.A.; Kasi, P.M.; Wallace, M.B. Colorectal cancer. Lancet 2019, 394, 1467–1480. [Google Scholar] [CrossRef]
  3. Nishihara, H.; Hwang, M.; Kizaka-Kondoh, S.; Eckmann, L.; Insel, P.A. Cyclic AMP promotes cAMP-responsive element-binding protein-dependent induction of cellular inhibitor of apoptosis protein-2 and suppresses apoptosis of colon cancer cells through ERK1/2 and p38 MAPK. J. Biol. Chem. 2004, 279, 26176–26183. [Google Scholar] [CrossRef] [Green Version]
  4. Agarwal, A.; Das, K.; Lerner, N.; Sathe, S.; Cicek, M.; Casey, G.; Sizemore, N. The AKT/I kappa B kinase pathway promotes angiogenic/metastatic gene expression in colorectal cancer by activating nuclear factor-kappa B and beta-catenin. Oncogene 2005, 24, 1021–1031. [Google Scholar] [CrossRef] [Green Version]
  5. Silva, A.L.; Dawson, S.N.; Arends, M.J.; Guttula, K.; Hall, N.; Cameron, E.A.; Huang, T.H.; Brenton, J.D.; Tavaré, S.; Bienz, M.; et al. Boosting Wnt activity during colorectal cancer progression through selective hypermethylation of Wnt signaling antagonists. BMC Cancer 2014, 14, 891. [Google Scholar] [CrossRef] [PubMed] [Green Version]
  6. Voorneveld, P.W.; Kodach, L.L.; Jacobs, R.J.; Liv, N.; Zonnevylle, A.C.; Hoogenboom, J.P.; Biemond, I.; Verspaget, H.W.; Hommes, D.W.; de Rooij, K.; et al. Loss of SMAD4 alters BMP signaling to promote colorectal cancer cell metastasis via activation of Rho and ROCK. Gastroenterology 2014, 147, 196–208.e13. [Google Scholar] [CrossRef] [PubMed]
  7. Fazio, C.; Piazzi, G.; Vitaglione, P.; Fogliano, V.; Munarini, A.; Prossomariti, A.; Milazzo, M.; D’Angelo, L.; Napolitano, M.; Chieco, P.; et al. Inflammation increases NOTCH1 activity via MMP9 and is counteracted by Eicosapentaenoic Acid-free fatty acid in colon cancer cells. Sci. Rep. 2016, 6, 20670. [Google Scholar] [CrossRef] [PubMed] [Green Version]
  8. Dozois, E.J.; Boardman, L.A.; Suwanthanma, W.; Limburg, P.J.; Cima, R.R.; Bakken, J.L.; Vierkant, R.A.; Aakre, J.A.; Larson, D.W. Young-onset colorectal cancer in patients with no known genetic predisposition: Can we increase early recognition and improve outcome? Medicine 2008, 87, 259–263. [Google Scholar] [CrossRef] [PubMed] [Green Version]
  9. Hamann, J.; Aust, G.; Araç, D.; Engel, F.B.; Formstone, C.; Fredriksson, R.; Hall, R.A.; Harty, B.L.; Kirchhoff, C.; Knapp, B.; et al. International Union of Basic and Clinical Pharmacology. XCIV. Adhesion G protein-coupled receptors. Pharmacol. Rev. 2015, 67, 338–367. [Google Scholar] [CrossRef] [PubMed]
  10. Vizurraga, A.; Adhikari, R.; Yeung, J.; Yu, M.; Tall, G.G. Mechanisms of adhesion G protein-coupled receptor activation. J. Biol. Chem. 2020, 295, 14065–14083. [Google Scholar] [CrossRef]
  11. Bridges, J.P.; Ludwig, M.G.; Mueller, M.; Kinzel, B.; Sato, A.; Xu, Y.; Whitsett, J.A.; Ikegami, M. Orphan G protein-coupled receptor GPR116 regulates pulmonary surfactant pool size. Am. J. Respir. Cell Mol. Biol. 2013, 49, 348–357. [Google Scholar] [CrossRef] [Green Version]
  12. Fukuzawa, T.; Ishida, J.; Kato, A.; Ichinose, T.; Ariestanti, D.M.; Takahashi, T.; Ito, K.; Abe, J.; Suzuki, T.; Wakana, S.; et al. Lung surfactant levels are regulated by Ig-Hepta/GPR116 by monitoring surfactant protein D. PLoS ONE. 2013, 8, e69451. [Google Scholar] [CrossRef] [Green Version]
  13. Yang, M.Y.; Hilton, M.B.; Seaman, S.; Haines, D.C.; Nagashima, K.; Burks, C.M.; Tessarollo, L.; Ivanova, P.T.; Brown, H.A.; Umstead, T.M.; et al. Essential regulation of lung surfactant homeostasis by the orphan G protein-coupled receptor GPR116. Cell Rep. 2013, 3, 1457–1464. [Google Scholar] [CrossRef] [Green Version]
  14. Nie, T.; Hui, X.; Gao, X.; Li, K.; Lin, W.; Xiang, X.; Ding, M.; Kuang, Y.; Xu, A.; Fei, J.; et al. Adipose tissue deletion of Gpr116 impairs insulin sensitivity through modulation of adipose function. FEBS Lett. 2012, 586, 3618–3625. [Google Scholar] [CrossRef] [Green Version]
  15. Niaudet, C.; Hofmann, J.J.; Mäe, M.A.; Jung, B.; Gaengel, K.; Vanlandewijck, M.; Ekvärn, E.; Salvado, M.D.; Mehlem, A.; Al Sayegh, S.; et al. Gpr116 receptor regulates distinctive functions in pneumocytes and vascular endothelium. PLoS ONE 2015, 10, e0137949. [Google Scholar] [CrossRef]
  16. Ariestanti, D.M.; Ando, H.; Hirose, S.; Nakamura, N. Targeted disruption of Ig-Hepta/Gpr116 causes emphysema-like symptoms that are associated with alveolar macrophage activation. J. Biol. Chem. 2015, 290, 11032–11040. [Google Scholar] [CrossRef] [Green Version]
  17. Davidson, B.; Stavnes, H.T.; Risberg, B.; Nesland, J.M.; Wohlschlaeger, J.; Yang, Y.; Shih, I.M.; Wang, T.L. Gene expression signatures differentiate adenocarcinoma of lung and breast origin in effusions. Hum. Pathol. 2012, 43, 684–694. [Google Scholar] [CrossRef]
  18. Tang, X.; Jin, R.; Qu, G.; Wang, X.; Li, Z.; Yuan, Z.; Zhao, C.; Siwko, S.; Shi, T.; Wang, P.; et al. GPR116, an adhesion G-protein-coupled receptor, promotes breast cancer metastasis via the Gαq-p63RhoGEF-Rho GTPase pathway. Cancer Res. 2013, 73, 6206–6218. [Google Scholar] [CrossRef] [Green Version]
  19. Yang, L.; Lin, X.L.; Liang, W.; Fu, S.W.; Lin, W.F.; Tian, X.Q.; Gao, Y.J.; Chen, H.Y.; Dai, J.; Ge, Z.Z. High expression of GPR116 indicates poor survival outcome and promotes tumor progression in colorectal carcinoma. Oncotarget 2017, 8, 47943–47956. [Google Scholar] [CrossRef] [Green Version]
  20. Wuensch, T.; Wizenty, J.; Quint, J.; Spitz, W.; Bosma, M.; Becker, O.; Adler, A.; Veltzke-Schlieker, W.; Stockmann, M.; Weiss, S.; et al. Expression analysis of Fibronectin Type III Domain-Containing (FNDC) genes in inflammatory bowel disease and colorectal cancer. Gastroenterol. Res. Pract. 2019, 2019, 3784172. [Google Scholar] [CrossRef]
  21. Wang, C.; Fan, H.Q.; Zhang, Y.W. MiR-511-5p functions as a tumor suppressor and a predictive of prognosis in colorectal cancer by directly targeting GPR116. Eur Rev. Med. Pharmacol. Sci. 2019, 23, 6119–6130. [Google Scholar] [CrossRef] [PubMed]
  22. Muthiah, I.; Rajendran, K.; Dhanaraj, P.; Vallinayagam, S. In silico structure prediction, molecular docking and dynamic simulation studies on G Protein-Coupled Receptor 116: A novel insight into breast cancer therapy. J. Biomol. Struct. Dyn. 2020, 1, 9. [Google Scholar] [CrossRef] [PubMed]
  23. Muthiah, I.; Rajendran, K.; Dhanaraj, P. In silico molecular docking and physicochemical property studies on effective phytochemicals targeting GPR116 for breast cancer treatment. Mol. Cell Biochem. 2021, 476, 883–896. [Google Scholar] [CrossRef] [PubMed]
  24. Cerami, E.; Gao, J.; Dogrusoz, U.; Gross, B.E.; Sumer, S.O.; Aksoy, B.A.; Jacobsen, A.; Byrne, C.J.; Heuer, M.L.; Larsson, E.; et al. The cBio cancer genomics portal: An open platform for exploring multidimensional cancer genomics data. Cancer Discov. 2012, 2, 401–404. [Google Scholar] [CrossRef] [PubMed] [Green Version]
  25. Gao, J.; Aksoy, B.A.; Dogrusoz, U.; Dresdner, G.; Gross, B.; Sumer, S.O.; Sun, Y.; Jacobsen, A.; Sinha, R.; Larsson, E.; et al. Integrative analysis of complex cancer genomics and clinical profiles using the cBioPortal. Sci. Signal. 2013, 6, pl1. [Google Scholar] [CrossRef] [Green Version]
  26. Huang, D.W.; Sherman, B.T.; Lempicki, R.A. Systematic and integrative analysis of large gene lists using DAVID bioinformatics resources. Nat. Protoc. 2009, 4, 44–57. [Google Scholar] [CrossRef]
  27. Huang, D.W.; Sherman, B.T.; Lempicki, R.A. Bioinformatics enrichment tools: Paths toward the comprehensive functional analysis of large gene lists. Nucleic Acids Res. 2009, 37, 1–13. [Google Scholar] [CrossRef] [Green Version]
  28. Li, B.; Seversion, E.; Pignon, J.-C.; Zhao, H.; Li, T.; Novak, J.; Jiang, P.; Shen, H.; Aster, J.C.; Rodig, S.; et al. Comprehensive analyses of tumor immunity: Implications for cancer immunotherapy. Genome Biol. 2016, 17, 174. [Google Scholar] [CrossRef] [Green Version]
  29. Li, T.; Fan, J.; Wang, B.; Traugh, N.; Chen, Q.; Liu, J.S.; Li, B.; Liu, X.S. TIMER: A web server for comprehensive analysis of tumor-infiltrating immune cells. Cancer Res. 2017, 77, 108–110. [Google Scholar] [CrossRef]
  30. Li, T.; Fu, J.; Zeng, Z.; Cohen, D.; Li, J.; Chen, Q.; Li, B.; Liu, X.S. TIMER2.0 for analysis of tumor-infiltrating immune cells. Nucleic Acids Res. 2020, 48, 509–514. [Google Scholar] [CrossRef]
  31. Bosman, F.T.; Carneiro, F.; Hruban, R.H.; Theise, N.D. WHO Classification of Tumours of the Digestive System, 4th ed.; International Agency for Research on Cancer: Lyon, France, 2010; Volume 3.
  32. Numata, M.; Shiozawa, M.; Watanabe, T.; Tamagawa, H.; Yamamoto, N.; Morinaga, S.; Watanabe, K.; Godai, T.; Oshima, T.; Fujii, S.; et al. The clinicopathological features of colorectal mucinous adenocarcinoma and a therapeutic strategy for the disease. World J. Surg. Oncol. 2012, 10, 109. [Google Scholar] [CrossRef] [PubMed] [Green Version]
  33. Park, J.S.; Huh, J.W.; Park, Y.A.; Cho, Y.B.; Yun, S.H.; Kim, H.C.; Lee, W.Y.; Chun, H.K. Prognostic comparison between mucinous and nonmucinous adenocarcinoma in colorectal cancer. Medicine 2015, 94, e658. [Google Scholar] [CrossRef]
  34. Curtale, G.; Renzi, T.A.; Drufuca, L.; Rubino, M.; Locati, M. Glucocorticoids downregulate TLR4 signaling activity via its direct targeting by miR-511-5p. Eur. J. Immunol. 2017, 47, 2080–2089. [Google Scholar] [CrossRef] [Green Version]
  35. Chen, J.; Liu, A.; Wang, Z.; Wang, B.; Chai, X.; Lu, W.; Cao, T.; Li, R.; Wu, M.; Lu, Z.; et al. LINC00173.v1 promotes angiogenesis and progression of lung squamous cell carcinoma by sponging miR-511-5p to regulate VEGFA expression. Mol. Cancer 2020, 19, 98. [Google Scholar] [CrossRef]
  36. Gonzalez, D.M.; Medici, D. Signaling mechanisms of the epithelial-mesenchymal transition. Sci. Signal. 2014, 7, re8. [Google Scholar] [CrossRef] [Green Version]
  37. Johnson, S.M.; Gulhati, P.; Rampy, B.A.; Han, Y.; Rychahou, P.G.; Doan, H.Q.; Weiss, H.L.; Evers, B.M. Novel expression patterns of PI3K/Akt/mTOR signaling pathway components in colorectal cancer. J. Am. Coll. Surg. 2010, 210, 776–778. [Google Scholar] [CrossRef] [Green Version]
  38. Suman, S.; Kurisetty, V.; Das, T.P.; Vadodkar, A.; Ramos, G.; Lakshmanaswamy, R.; Damodaran, C. Activation of AKT signaling promotes epithelial-mesenchymal transition and tumor growth in colorectal cancer cells. Mol. Carcinog. 2014, 53 (Suppl. S1), E151–E160. [Google Scholar] [CrossRef]
  39. Grille, S.J.; Bellacosa, A.; Upson, J.; Klein-Szanto, A.J.; van Roy, F.; Lee-Kwon, W.; Donowitz, M.; Tsichlis, P.N.; Larue, L. The protein kinase Akt induces epithelial mesenchymal transition and promotes enhanced motility and invasiveness of squamous cell carcinoma lines. Cancer Res. 2003, 63, 2172–2178. [Google Scholar]
  40. Petrova, Y.I.; Schecterson, L.; Gumbiner, B.M. Roles for E-cadherin cell surface regulation in cancer. Mol. Biol. Cell 2016, 27, 3233–3244. [Google Scholar] [CrossRef]
  41. Fischer, H.; Stenling, R.; Rubio, C.; Lindblom, A. Colorectal carcinogenesis is associated with stromal expression of COL11A1 and COL5A2. Carcinogenesis 2001, 22, 875–878. [Google Scholar] [CrossRef] [Green Version]
  42. Fischer, H.; Salahshor, S.; Stenling, R.; Björk, J.; Lindmark, G.; Iselius, L.; Rubio, C.; Lindblom, A. COL11A1 in FAP polyps and in sporadic colorectal tumors. BMC Cancer 2001, 1, 17. [Google Scholar] [CrossRef] [PubMed]
  43. Boudjadi, S.; Carrier, J.C.; Beaulieu, J.F. Integrin α1 subunit is up-regulated in colorectal cancer. Biomark. Res. 2013, 1, 16. [Google Scholar] [CrossRef] [PubMed] [Green Version]
  44. Oh, B.Y.; Kim, K.H.; Chung, S.S.; Hong, K.S.; Lee, R.A. Role of β1-integrin in colorectal cancer: Case-control study. Ann. Coloproctol. 2014, 30, 61–70. [Google Scholar] [CrossRef] [Green Version]
  45. Zhao, Z.; Han, F.H.; Yang, S.B.; Hua, L.X.; Wu, J.H.; Zhan, W.H. Loss of stromal caveolin-1 expression in colorectal cancer predicts poor survival. World J. Gastroenterol. 2015, 21, 1140–1147. [Google Scholar] [CrossRef] [PubMed]
  46. Wang, X.Q.; Tang, Z.X.; Yu, D.; Cui, S.J.; Jiang, Y.H.; Zhang, Q.; Wang, J.; Yang, P.Y.; Liu, F. Epithelial but not stromal expression of collagen alpha-1(III) is a diagnostic and prognostic indicator of colorectal carcinoma. Oncotarget 2016, 7, 8823–8838. [Google Scholar] [CrossRef] [Green Version]
  47. Zhao, H.; Yu, H.; Martin, T.A.; Zhang, Y.; Chen, G.; Jiang, W.G. Effect of junctional adhesion molecule-2 expression on cell growth, invasion and migration in human colorectal cancer. Int. J. Oncol. 2016, 48, 929–936. [Google Scholar] [CrossRef] [Green Version]
  48. Yu, Y.; Liu, D.; Liu, Z.; Li, S.; Ge, Y.; Sun, W.; Liu, B. The inhibitory effects of COL1A2 on colorectal cancer cell proliferation, migration, and invasion. J. Cancer 2018, 9, 2953–2962. [Google Scholar] [CrossRef]
  49. Galatenko, V.V.; Maltseva, D.V.; Galatenko, A.V.; Rodin, S.; Tonevitsky, A.G. Cumulative prognostic power of laminin genes in colorectal cancer. BMC Med. Genom. 2018, 11 (Suppl. S1), 9. [Google Scholar] [CrossRef] [Green Version]
  50. Liu, W.; Li, L.; Ye, H.; Tao, H.; He, H. Role of COL6A3 in colorectal cancer. Oncol. Rep. 2018, 39, 2527–2536. [Google Scholar] [CrossRef]
  51. Lu, L.; Xie, R.; Wei, R.; Cai, C.; Bi, D.; Yin, D.; Liu, H.; Zheng, J.; Zhang, Y.; Song, F.; et al. Integrin α5 subunit is required for the tumor supportive role of fibroblasts in colorectal adenocarcinoma and serves as a potential stroma prognostic marker. Mol. Oncol. 2019, 13, 2697–2714. [Google Scholar] [CrossRef] [Green Version]
  52. Zhou, D.; Tang, W.; Zhang, Y.; An, H.X. JAM3 functions as a novel tumor suppressor and is inactivated by DNA methylation in colorectal cancer. Cancer Manag. Res. 2019, 11, 2457–2470. [Google Scholar] [CrossRef]
  53. Zhang, D.; Bi, J.; Liang, Q.; Wang, S.; Zhang, L.; Han, F.; Li, S.; Qiu, B.; Fan, X.; Chen, W.; et al. VCAM1 promotes tumor cell invasion and metastasis by inducing EMT and transendothelial migration in colorectal cancer. Front. Oncol. 2020, 10, 1066. [Google Scholar] [CrossRef]
  54. Wang, Y.; Sui, J.; Li, X.; Cao, F.; He, J.; Yang, B.; Zhu, X.; Sun, Y.; Pu, Y.D. RPS24 knockdown inhibits colorectal cancer cell migration and proliferation in vitro. Gene 2015, 571, 286–291. [Google Scholar] [CrossRef]
  55. Yu, C.; Hong, H.; Zhang, S.; Zong, Y.; Ma, J.; Lu, A.; Sun, J.; Zheng, M. Identification of key genes and pathways involved in microsatellite instability in colorectal cancer. Mol. Med. Rep. 2019, 19, 2065–2076. [Google Scholar] [CrossRef] [Green Version]
  56. Dong, Z.; Jiang, H.; Liang, S.; Wang, Y.; Jiang, W.; Zhu, C. Ribosomal Protein L15 is involved in Colon Carcinogenesis. Int. J. Med. Sci. 2019, 16, 1132–1141. [Google Scholar] [CrossRef] [Green Version]
  57. Zou, D.; Zhang, H.; Ke, J.; Li, J.; Zhu, Y.; Gong, Y.; Yang, Y.; Tian, J.; Zhang, Y.; Peng, X.; et al. Three functional variants were identified to affect RPS24 expression and significantly associated with risk of colorectal cancer. Arch. Toxicol. 2020, 94, 295–303. [Google Scholar] [CrossRef]
  58. Wang, Y.; Dong, J.; Quan, Q.; Liu, S.; Chen, X.; Cai, X.; Qiu, H.; Zhang, B.; Guo, G. Immune cell infiltration of the primary tumor microenvironment predicted the treatment outcome of chemotherapy with or without bevacizumab in metastatic colorectal cancer patients. Front. Oncol. 2021, 10, 581051. [Google Scholar] [CrossRef]
  59. Christoffersson, G.; Vågesjö, E.; Vandooren, J.; Lidén, M.; Massena, S.; Reinert, R.B.; Brissova, M.; Powers, A.C.; Opdenakker, G.; Phillipson, M. VEGF-A recruits a proangiogenic MMP-9-delivering neutrophil subset that induces angiogenesis in transplanted hypoxic tissue. Blood 2012, 120, 4653–4662. [Google Scholar] [CrossRef]
  60. Winkler, J.; Abisoye-Ogunniyan, A.; Metcalf, K.J.; Werb, Z. Concepts of extracellular matrix remodelling in tumour progression and metastasis. Nat. Commun. 2020, 11, 5120. [Google Scholar] [CrossRef]
  61. Vinnakota, K.; Zhang, Y.; Selvanesan, B.C.; Topi, G.; Salim, T.; Sand-Dejmek, J.; Jönsson, G.; Sjölander, A. M2-like macrophages induce colon cancer cell invasion via matrix metalloproteinases. J. Cell. Physiol. 2017, 232, 3468–3480. [Google Scholar] [CrossRef]
  62. Sandel, M.H.; Dadabayev, A.R.; Menon, A.G.; Morreau, H.; Melief, C.J.; Offringa, R.; van der Burg, S.H.; Janssen-van Rhijn, C.M.; Ensink, N.G.; Tollenaar, R.A.; et al. Prognostic value of tumor-infiltrating dendritic cells in colorectal cancer: Role of maturation status and intratumoral localization. Clin. Cancer Res. 2005, 11, 2576–2582. [Google Scholar] [CrossRef] [PubMed]
  63. Kubo, F.; Ariestanti, D.M.; Oki, S.; Fukuzawa, T.; Demizu, R.; Sato, T.; Sabirin, R.M.; Hirose, S.; Nakamura, N. Loss of the adhesion G-protein coupled receptor ADGRF5 in mice induces airway inflammation and the expression of CCL2 in lung endothelial cells. Respir. Res. 2019, 20, 11. [Google Scholar] [CrossRef] [PubMed] [Green Version]
  64. Oliveira-Nascimento, L.; Massari, P.; Wetzler, L.M. The role of TLR2 in infection and immunity. Front. Immunol. 2012, 3, 79. [Google Scholar] [CrossRef] [PubMed]
Figure 1. ADGRF5 expression pattern in the colon of controls and CRC patients derived from GSE21510 ((A); control, n = 25; CRC, n = 104), GSE32323 ((B); control, n = 17; CRC, n = 17), and GSE117606 ((C); control, n = 65; CRC, n = 74) datasets. Data are presented as medians with interquartile range; * p < 0.05, *** p < 0.001.
Cells 11 03876 g001
Figure 2. Scheme representing the number of genes positively correlated with ADGRF5 expression pattern in the colon of CRC patients and genes correlated with ADGRF5 expression pattern involved in the signaling pathways.
Cells 11 03876 g002
Figure 3. The heatmaps representing the expression of ADGRF5 and genes belonging to PI3K/Akt (hsa04151), focal adhesion (hsa04510), and cell adhesion molecules (hsa04514) signaling pathways determined in the colon of CRC patients derived from TCGA, Firehose Legacy dataset.
Cells 11 03876 g003
Figure 4. The heatmaps representing the expression of ADGRF5 and genes belonging to the ribosome (hsa03010) signaling pathways determined in the colon of CRC patients derived from the TCGA, Firehose Legacy dataset.
Cells 11 03876 g004
Figure 5. (A) Probability of overall survival and (B) disease-free survival of patients with low (blue) and high (red) expression of ADGRF5 in the colon of patients with CRC.
Cells 11 03876 g005
Figure 6. Correlation between ADGRF5 expression and the level of immune cell infiltration in colon (A) and rectal adenocarcinoma (B).
Cells 11 03876 g006
Table 1. ADGRF5 expression pattern in the colon of colorectal cancer patients in relation to clinical characteristics.
Characteristic of Patients
with Colorectal Cancer
ADGRF5 Expressionp-ValueNumber of Subjects
Sex
Men−0.0406 ± 0.779ns207
Women0.0470 ± 1.226169
Age
Below the age of 500.1844 ± 1.140ns57
Above the age of 50−0.0343 ± 0.976319
Race
Black or African American0.1247 ± 1.804ns60
White−0.0109 ± 0.770270
Site of tumor
Colon−0.0428 ± 1.033*283
Rectum0.1219 ± 0.91391
Histological diagnosis—colon
Colon adenocarcinoma−0.1569 ± 0.612**242
Colon mucinous adenocarcinoma0.7217 ± 2.23338
Histological diagnosis—rectum
Rectal adenocarcinoma0.0855 ± 0.736ns86
Rectal mucinous adenocarcinoma0.748 ± 2.5965
Stage
I/II−0.0861 ± 1.041*191
III/IV0.0762 ± 0.905166
TNM—tumor
1/2−0.2936 ± 0.525**67
3/40.0644 ± 1.074307
TNM—node
0−0.0999 ± 1.011*205
1/20.1131 ± 0.994168
TNM—metastasis
0−0.0513 ± 0.788ns256
10.1005 ± 0.75350
Values of ADGRF5 expression are presented as a means of z-scores ± SD; ns—not significant, * p < 0.05, ** p < 0.01.
Table 2. Genes positively correlated with ADGRF5 expression in the colon of colorectal cancer patients belonging to the PI3K/Akt signaling pathway—hsa04151.
Gene SymbolGene IDGene DescriptionSpearman Correlation
AKT310000Serine/threonine kinase 30.80
ANGPT1284Angiopoietin 10.66
ANGPT2285Angiopoietin 20.74
COL1A21278Collagen type I α2 chain0.71
COL4A11282Collagen type IV α1 chain0.92
COL4A21284Collagen type IV α2 chain0.89
COL6A31293Collagen type VI α3 chain0.78
F2R2149Coagulation factor II thrombin receptor0.72
FGF12246Fibroblast growth factor 10.70
FGF72252Fibroblast growth factor 70.71
FLT12321FMS-related receptor tyrosine kinase 10.81
GNB459345G protein subunit β40.78
GNG254331G protein subunit γ20.75
GNG112791G protein subunit γ110.76
HGF3082Hepatocyte growth factor0.72
ITGA13672Integrin subunit α10.71
ITGA43676Integrin subunit α40.74
ITGA53678Integrin subunit α50.79
ITGAV3685Integrin subunit αV0.63
ITGB13688Integrin subunit β10.61
ITGB33690Integrin subunit β30.83
KDR3791Kinase insert domain receptor0.88
LAMA43910Laminin subunit α40.83
LAMC13915Laminin subunit γ10.74
OSMR9180Oncostatin M receptor0.81
PDGFC56034Platelet-derived growth factor C0.65
PDGFRA5156Platelet-derived growth factor receptor α0.69
PDGFRB5159Platelet-derived growth factor receptor β0.80
SGK16446Serum/glucocorticoid regulated kinase 10.50
TEK7010TEK receptor tyrosine kinase0.85
THBS27058Thrombospondin 20.68
TLR27097Toll-like receptor 20.59
TNC3371Tenascin C0.71
VEGFC7424Vascular endothelial growth factor C0.78
Table 3. Genes positively correlated with ADGRF5 expression in the colon of colorectal cancer patients belonging to focal adhesion signaling pathway—hsa04510.
Gene SymbolGene IDGene DescriptionSpearman Correlation
AKT310000Serine/threonine kinase 30.80
CAV1857Caveolin 10.78
CAV2858Caveolin 20.58
COL1A21278Collagen type I α2 chain0.71
COL4A11282Collagen type IV α1 chain0.92
COL4A21284Collagen type IV α2 chain0.89
COL6A31293Collagen type VI α3 chain0.78
FLT12321FMS-related receptor tyrosine kinase 10.81
HGF3082Hepatocyte growth factor0.72
ITGA13672Integrin subunit α10.71
ITGA43676Integrin subunit α40.74
ITGA53678Integrin subunit α50.79
ITGAV3685Integrin subunit αV0.63
ITGB13688Integrin subunit β10.61
ITGB33690Integrin subunit β30.83
KDR3791Kinase insert domain receptor0.88
LAMA43910Laminin subunit α40.83
LAMC13915Laminin subunit γ10.74
MYLK4638Myosin light chain kinase0.68
PDGFC56034Platelet-derived growth factor C0.65
PDGFRA5156Platelet-derived growth factor receptor α0.69
PDGFRB5159Platelet-derived growth factor receptor β0.80
THBS27058Thrombospondin 20.68
TNC3371Tenascin C0.71
VEGFC7424Vascular endothelial growth factor C0.78
Table 4. Genes positively correlated with ADGRF5 expression in the colon of colorectal cancer patients belonging to cell adhesion molecules signaling pathway—hsa04514.
Gene SymbolGene IDGene DescriptionSpearman Correlation
CD34947CD34 molecule0.90
CD86942CD86 molecule0.65
CDH21000Cadherin 20.63
CDH51003Cadherin 50.92
ESAM90952Endothelial cell adhesion molecule0.81
ITGA43676Integrin subunit α40.74
ITGAV3685Integrin subunit αV0.63
ITGB13688Integrin subunit β10.61
JAM258494Junctional adhesion molecule 20.74
JAM383700Junctional adhesion molecule 30.79
NCAM24685Neural cell adhesion molecule 20.57
NLGN4X57502Neuroligin 4 X-linked0.70
PDCD1LG280380Programmed cell death 1 ligand 20.67
PECAM15175Platelet and endothelial cell adhesion molecule 10.83
PTPRC5788Protein tyrosine phosphatase receptor type C0.59
PTPRM5797Protein tyrosine phosphatase receptor type M0.83
SDC26383Syndecan 20.72
SELE6401Selectin E0.70
SELL6402Selectin L0.59
VCAM17412Vascular cell adhesion molecule 10.74
VCAN1462Versican0.77
Table 5. Genes negatively correlated with ADGRF5 expression in the colon of colorectal cancer patients belonging to ribosome signaling pathway—hsa03010.
Gene
Symbol
Gene IDGene DescriptionSpearman Correlation
FAU2197FAU ubiquitin-like and ribosomal protein S30 fusion−0.36
MRPL165008Mitochondrial ribosomal protein L1−0.37
MRPL251069Mitochondrial ribosomal protein L2−0.30
MRPL311222Mitochondrial ribosomal protein L3−0.30
MRPL451073Mitochondrial ribosomal protein L4−0.37
MRPL1165003Mitochondrial ribosomal protein L11−0.39
MRPL126182Mitochondrial ribosomal protein L12−0.44
MRPL1464928Mitochondrial ribosomal protein L14−0.38
MRPL1529088Mitochondrial ribosomal protein L15−0.29
MRPL1654948Mitochondrial ribosomal protein L16−0.35
MRPL1763875Mitochondrial ribosomal protein L17−0.37
MRPL2055052Mitochondrial ribosomal protein L20−0.36
MRPL21219927Mitochondrial ribosomal protein L21−0.38
MRPL2229093Mitochondrial ribosomal protein L22−0.39
MRPL236150Mitochondrial ribosomal protein L23−0.38
MRPL2429093Mitochondrial ribosomal protein L24−0.41
MRPL2751264Mitochondrial ribosomal protein L27−0.47
MRPL3264983Mitochondrial ribosomal protein L32−0.34
MRPL3464981Mitochondrial ribosomal protein L34−0.36
MRPL3664979Mitochondrial ribosomal protein L36−0.38
MRPS251116Mitochondrial ribosomal protein S2−0.37
MRPS564969Mitochondrial ribosomal protein S5−0.33
MRPS964965Mitochondrial ribosomal protein S9−0.35
MRPS126183Mitochondrial ribosomal protein S12−0.41
MRPS1564960Mitochondrial ribosomal protein S15−0.37
MRPS1651021Mitochondrial ribosomal protein S16−0.40
MRPS1751373Mitochondrial ribosomal protein S17−0.36
MRPS18A55168Mitochondrial ribosomal protein S18A−0.29
RPL36122Ribosomal protein L3−0.29
RPL56125Ribosomal protein L5−0.31
RPL66128Ribosomal protein L6−0.33
RPL7A6130Ribosomal protein L7a−0.35
RPL86132Ribosomal protein L8−0.30
RPL116135Ribosomal protein L11−0.33
RPL126136Ribosomal protein L12−0.37
RPL136137Ribosomal protein L13−0.40
RPL149045Ribosomal protein L14−0.41
RPL156138Ribosomal protein L15−0.34
RPL186141Ribosomal protein L18−0.42
RPL18A6142Ribosomal protein L18a−0.29
RPL196143Ribosomal protein L19−0.38
RPL239349Ribosomal protein L23−0.31
RPL23A6147Ribosomal protein L23a−0.33
RPL246152Ribosomal protein L24−0.43
RPL276155Ribosomal protein L27−0.37
RPL27A6157Ribosomal protein L27A−0.37
RPL286158Ribosomal protein L28−0.35
RPL296159Ribosomal protein L29−0.42
RPL316160Ribosomal protein L31−0.33
RPL326161Ribosomal protein L32−0.42
RPL346164Ribosomal protein L34−0.34
RPL3511224Ribosomal protein L35−0.39
RPL35A6165Ribosomal protein L35A−0.38
RPL3625873Ribosomal protein L36−0.43
RPL376167Ribosomal protein L37−0.31
RPL37A6173Ribosomal protein L37a−0.37
RPL386169Ribosomal protein L38−0.39
RPL396170Ribosomal protein L39−0.36
RPLP06175Ribosomal protein lateral stalk subunit P0−0.39
RPLP16176Ribosomal protein lateral stalk subunit P1−0.36
RPLP26181Ribosomal protein lateral stalk subunit P2−0.44
RPS26187Ribosomal protein S2−0.42
RPS36188Ribosomal protein S3−0.34
RPS4X6191Ribosomal protein S4X−0.31
RPS66194Ribosomal protein S6−0.29
RPS76201Ribosomal protein S7−0.35
RPS86202Ribosomal protein S8−0.38
RPS96203Ribosomal protein S9−0.35
RPS106204Ribosomal protein S10−0.34
RPS116205Ribosomal protein S11−0.35
RPS136207Ribosomal protein S13−0.38
RPS146208Ribosomal protein S14−0.40
RPS156209Ribosomal protein S15−0.39
RPS15A6210Ribosomal protein S15A−0.31
RPS166217Ribosomal protein S16−0.39
RPS176218Ribosomal protein S17−0.30
RPS186222Ribosomal protein S18−0.34
RPS196223Ribosomal protein S19−0.34
RPS216227Ribosomal protein S21−0.29
RPS236228Ribosomal protein S23−0.30
RPS246229Ribosomal protein S24−0.31
RPS256230Ribosomal protein S25−0.33
RPS27A6233Ribosomal protein S27A−0.33
RPS296235Ribosomal protein S29−0.31
RPSA3921Ribosomal protein SA−0.36
Publisher’s Note: MDPI stays neutral with regard to jurisdictional claims in published maps and institutional affiliations.

