

Microglial Dynamics Modulate Vestibular Compensation in a Rodent Model of Vestibulopathy and Condition the Expression of Plasticity Mechanisms in the Deafferented Vestibular Nuclei

 , , , and
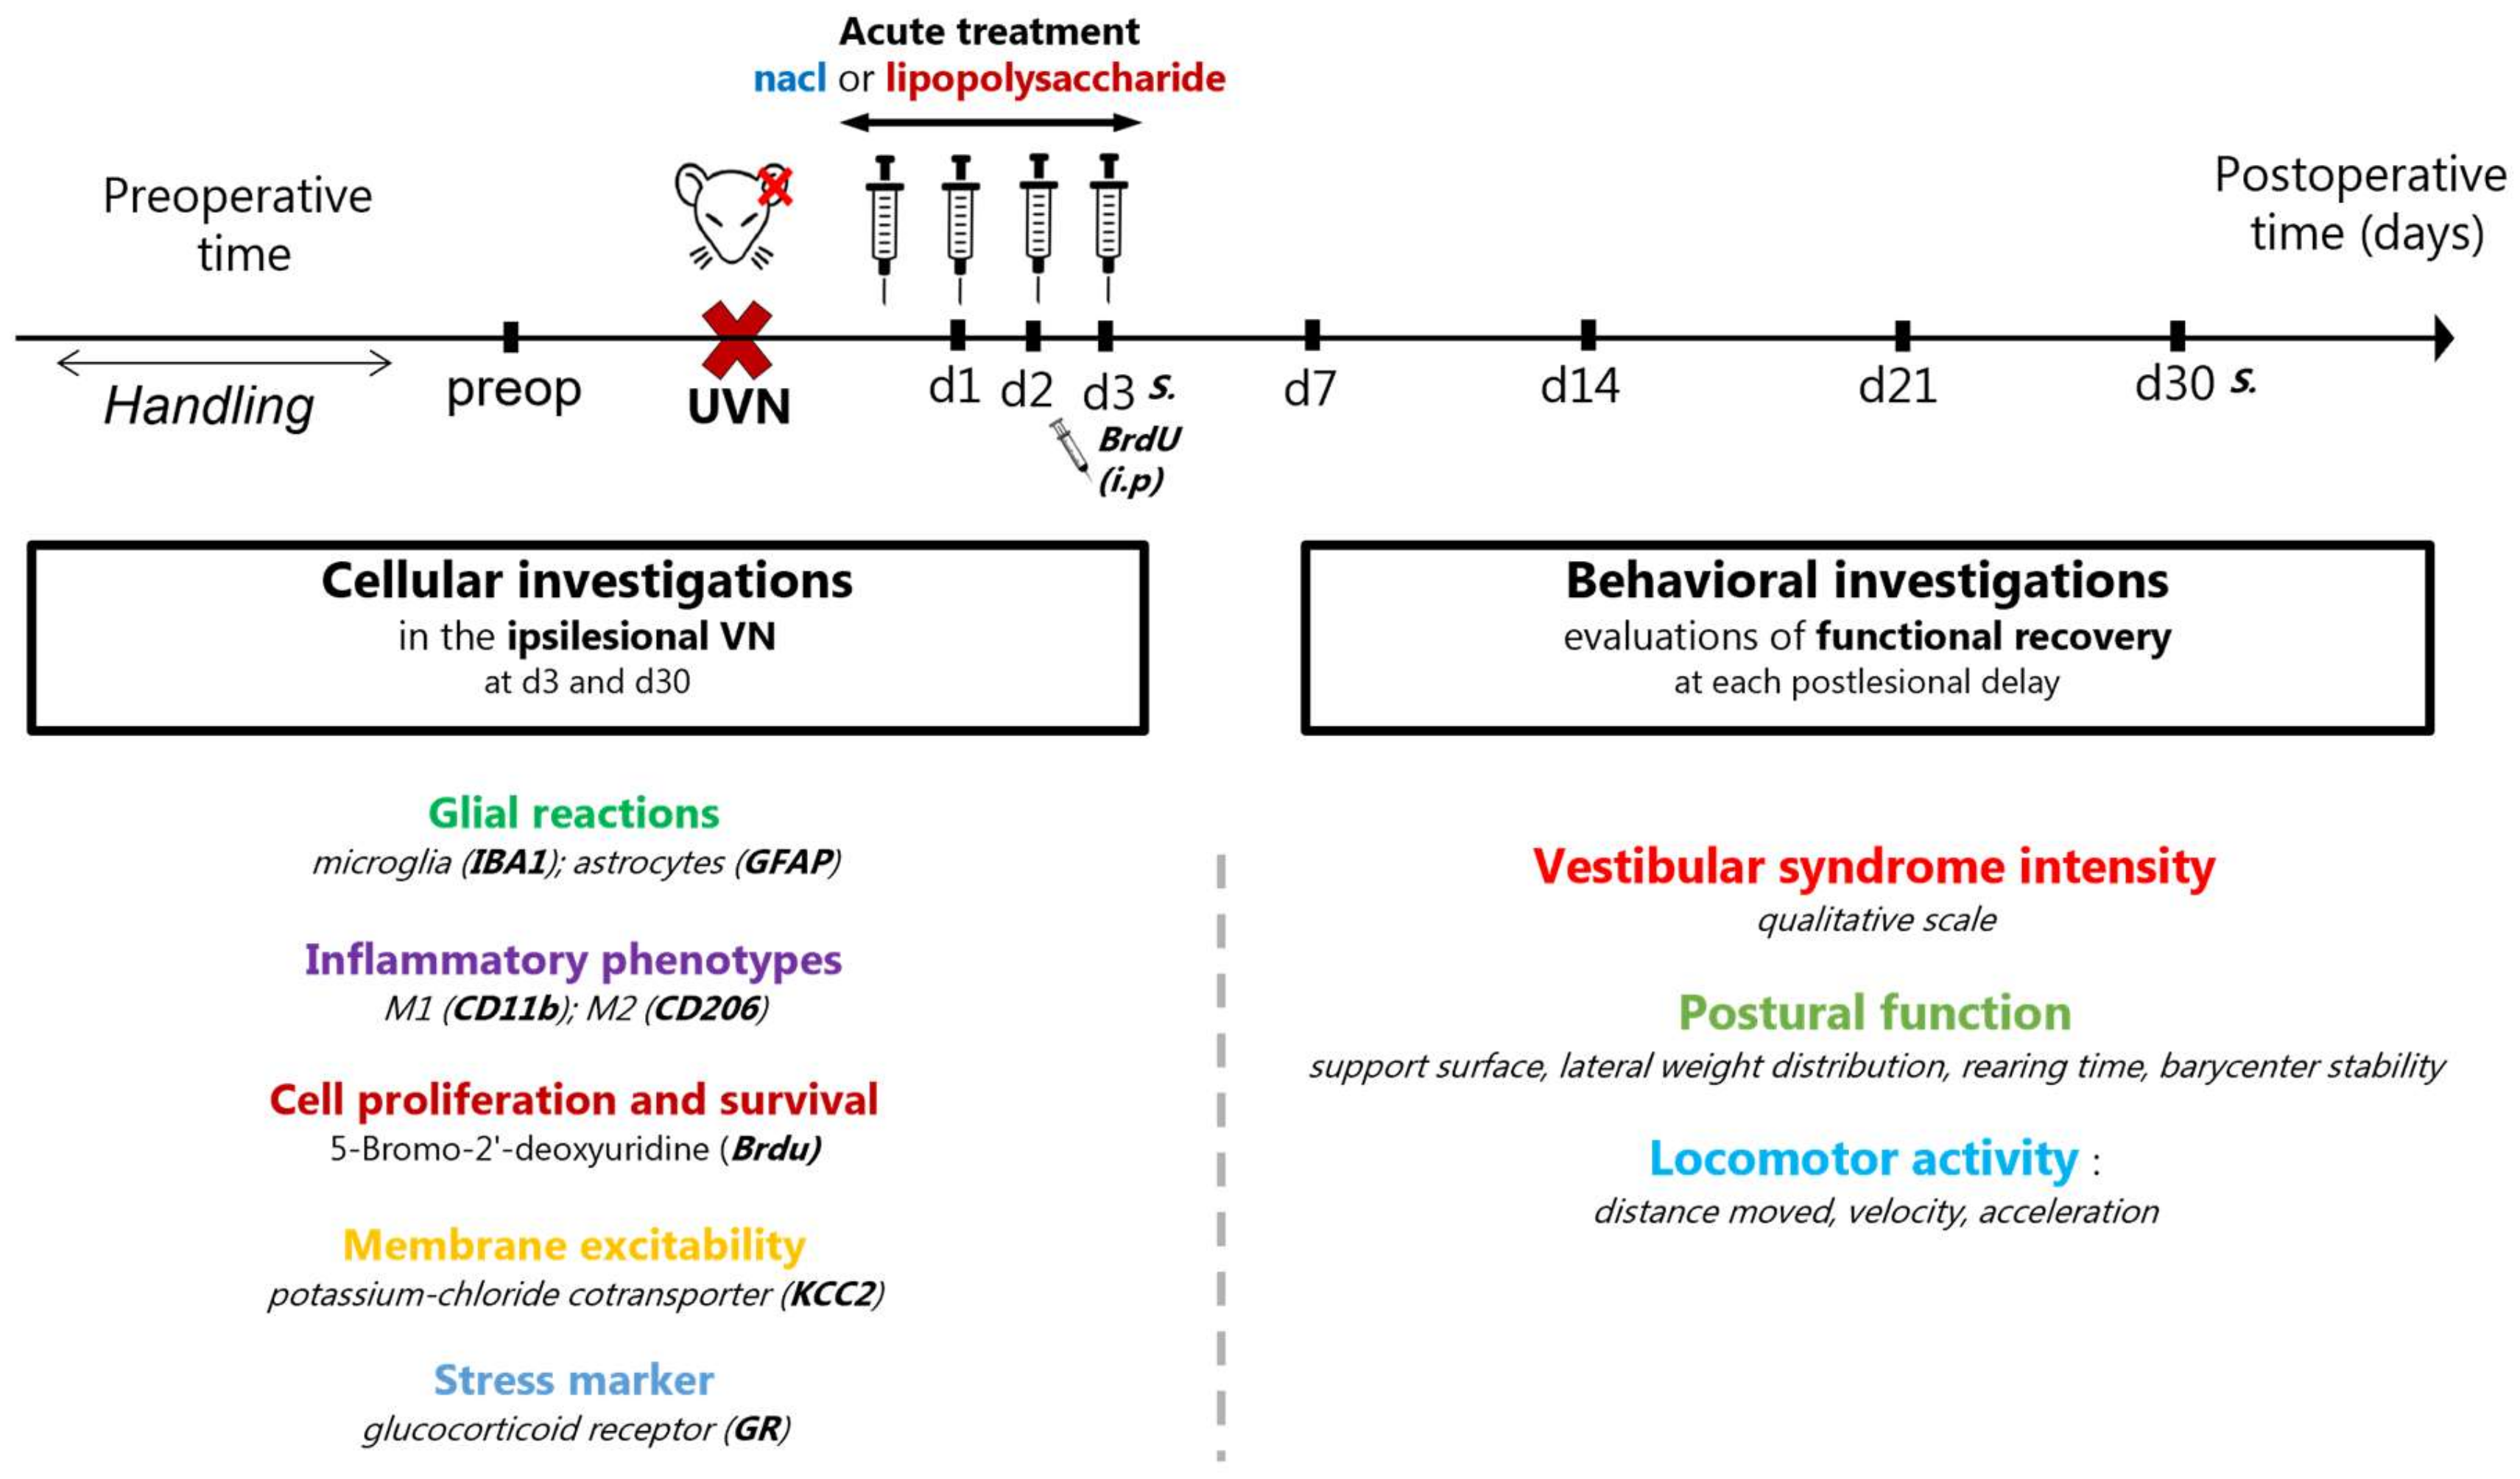
Abstract
1. Introduction
2. Materials and Methods
2.1. Animals & Ethical Statements
2.2. Study Design
2.3. Unilateral Vestibular Neurectomy (UVN)
2.4. Pharmacological Treatments
2.5. Cellular Investigations
2.5.1. Tissue Preparation
2.5.2. Immunohistochemistry
2.5.3. Cell-Counting Methods and Quantification of KCC2 Immunoreactivity
2.6. Behavioral Investigations
2.6.1. Qualitative Evaluation of the Vestibular Syndrome
2.6.2. Support Surface Measurement after Tail-Lift Reflex (TLR)
2.6.3. Assessment of Postural Function Using Dynamic Weight Bearing (DWB2®)
2.6.4. Assessment of Locomotor Activity in the Open Field
2.7. Statistical Analysis
3. Results
3.1. Cellular Results
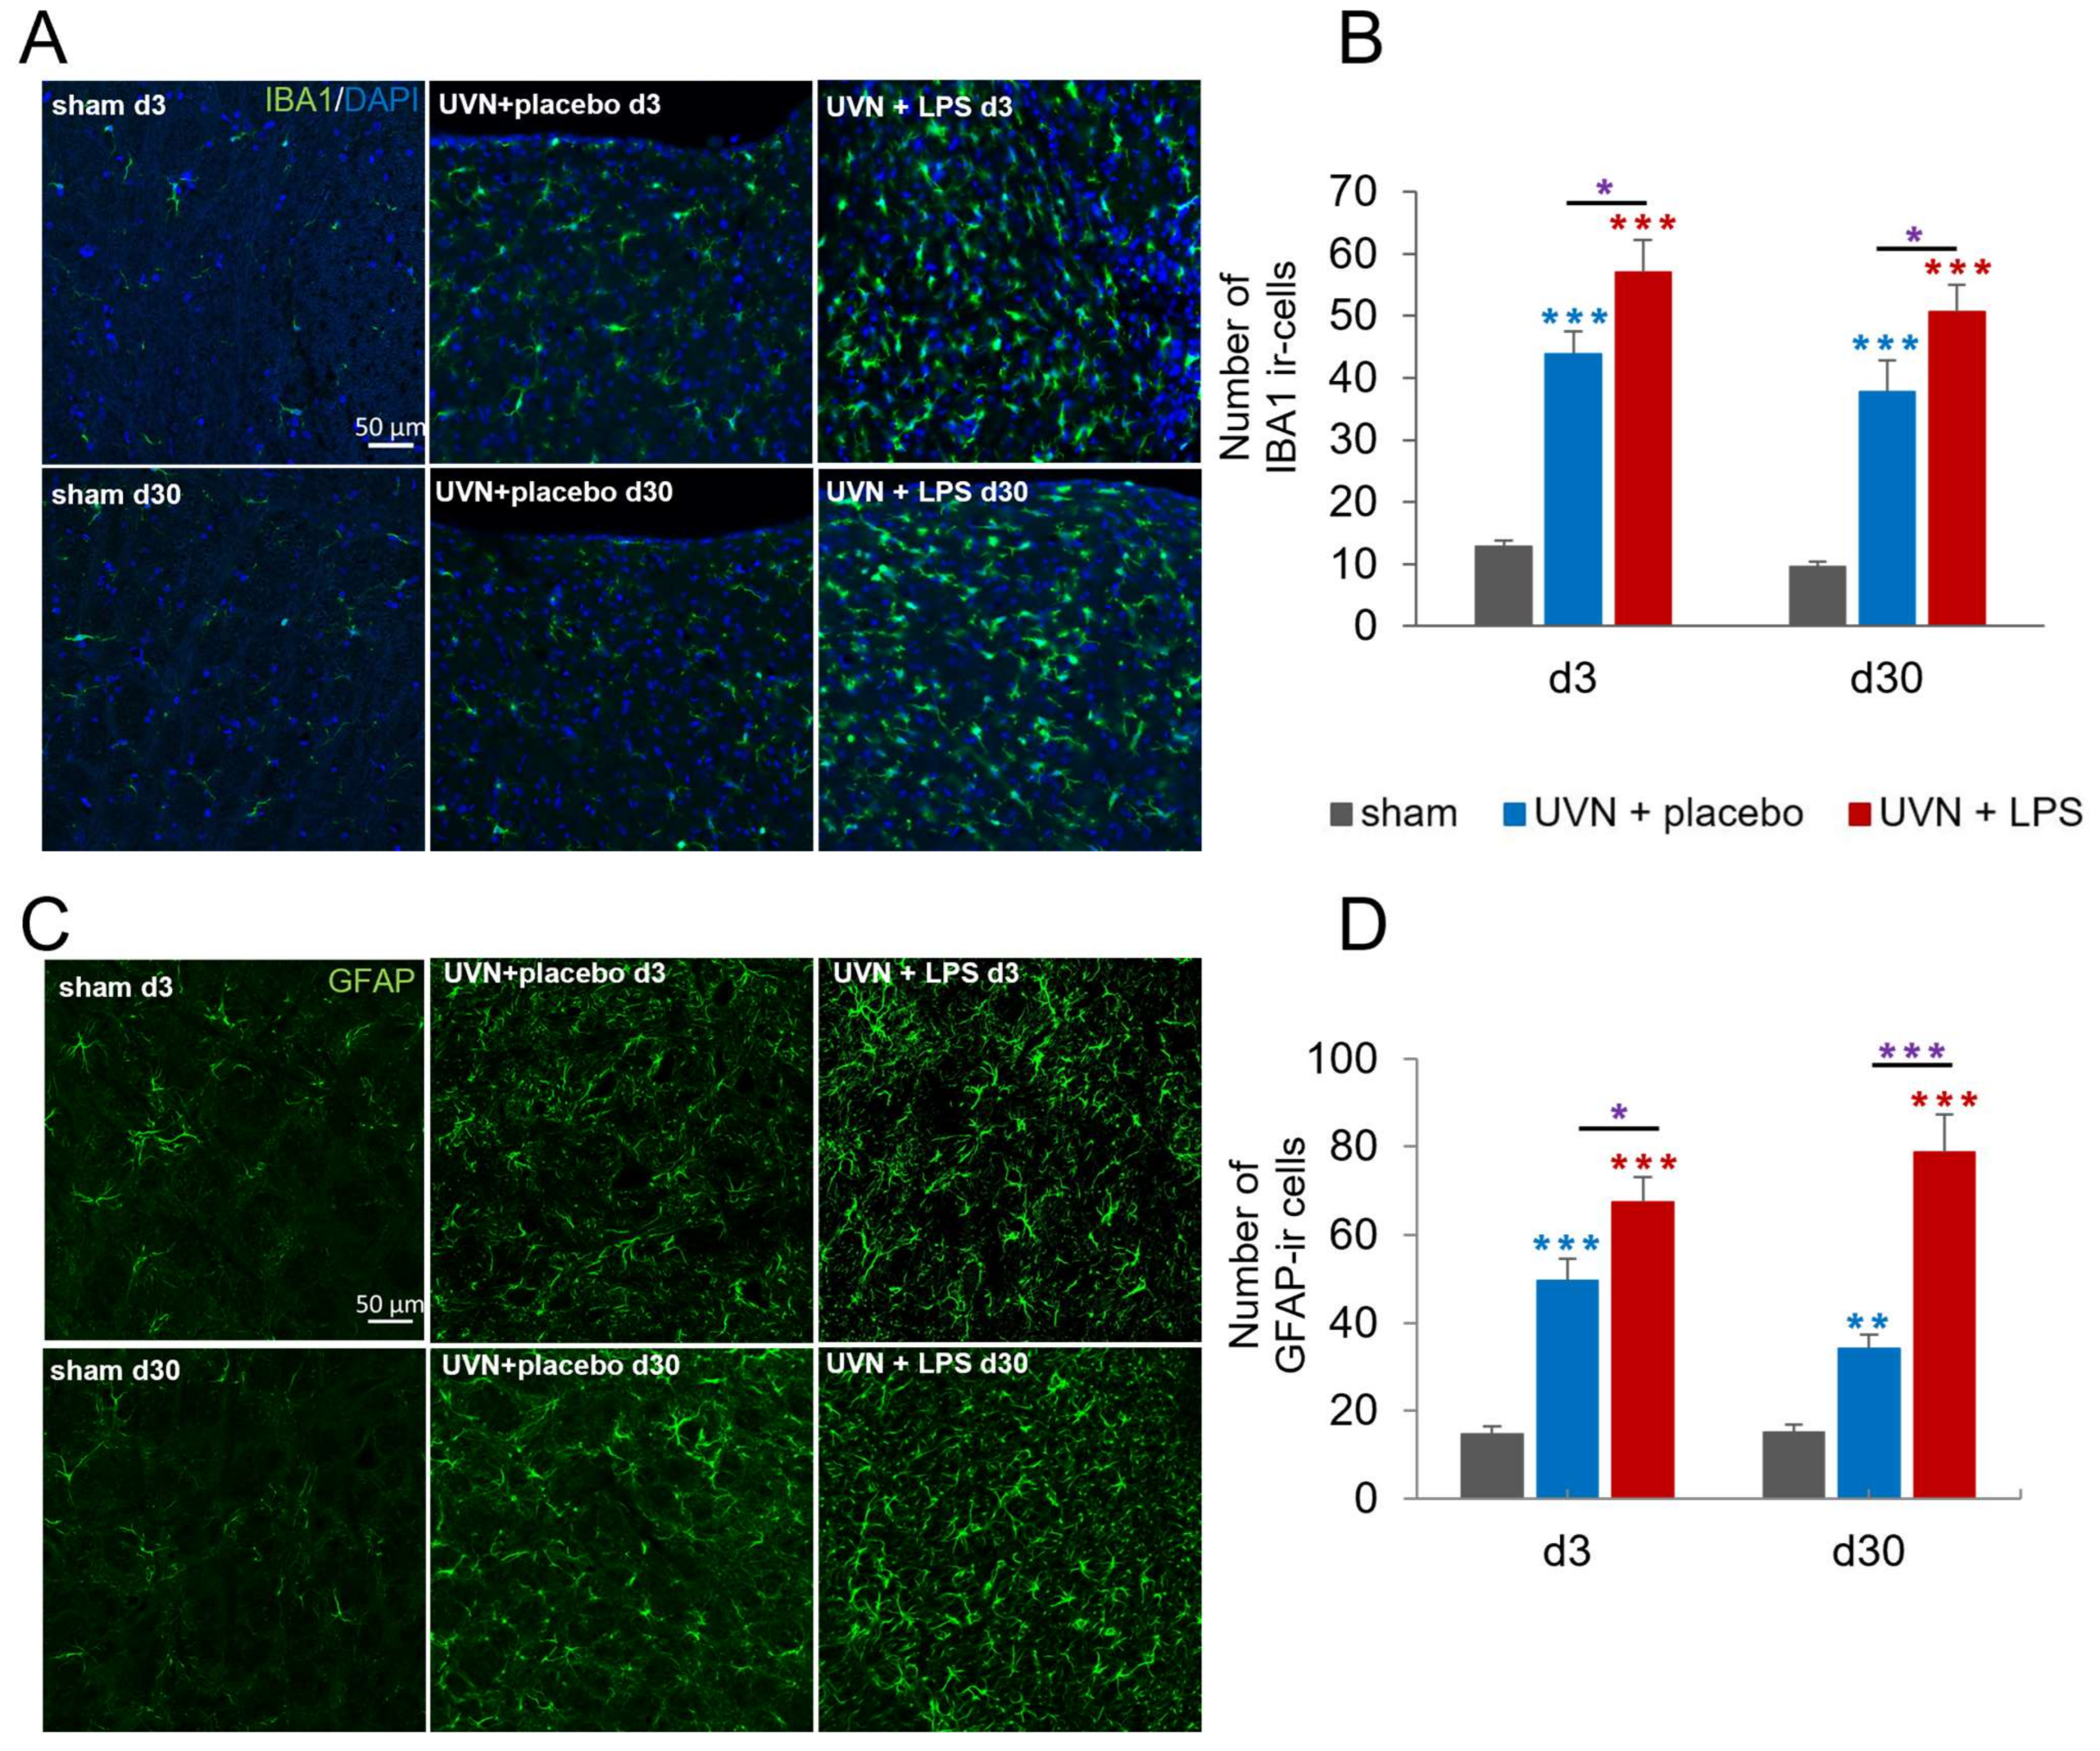
3.1.1. Acute LPS Treatment Significantly Increases Glial Reactions in the Deafferented Medial Vestibular Nuclei (MVN)
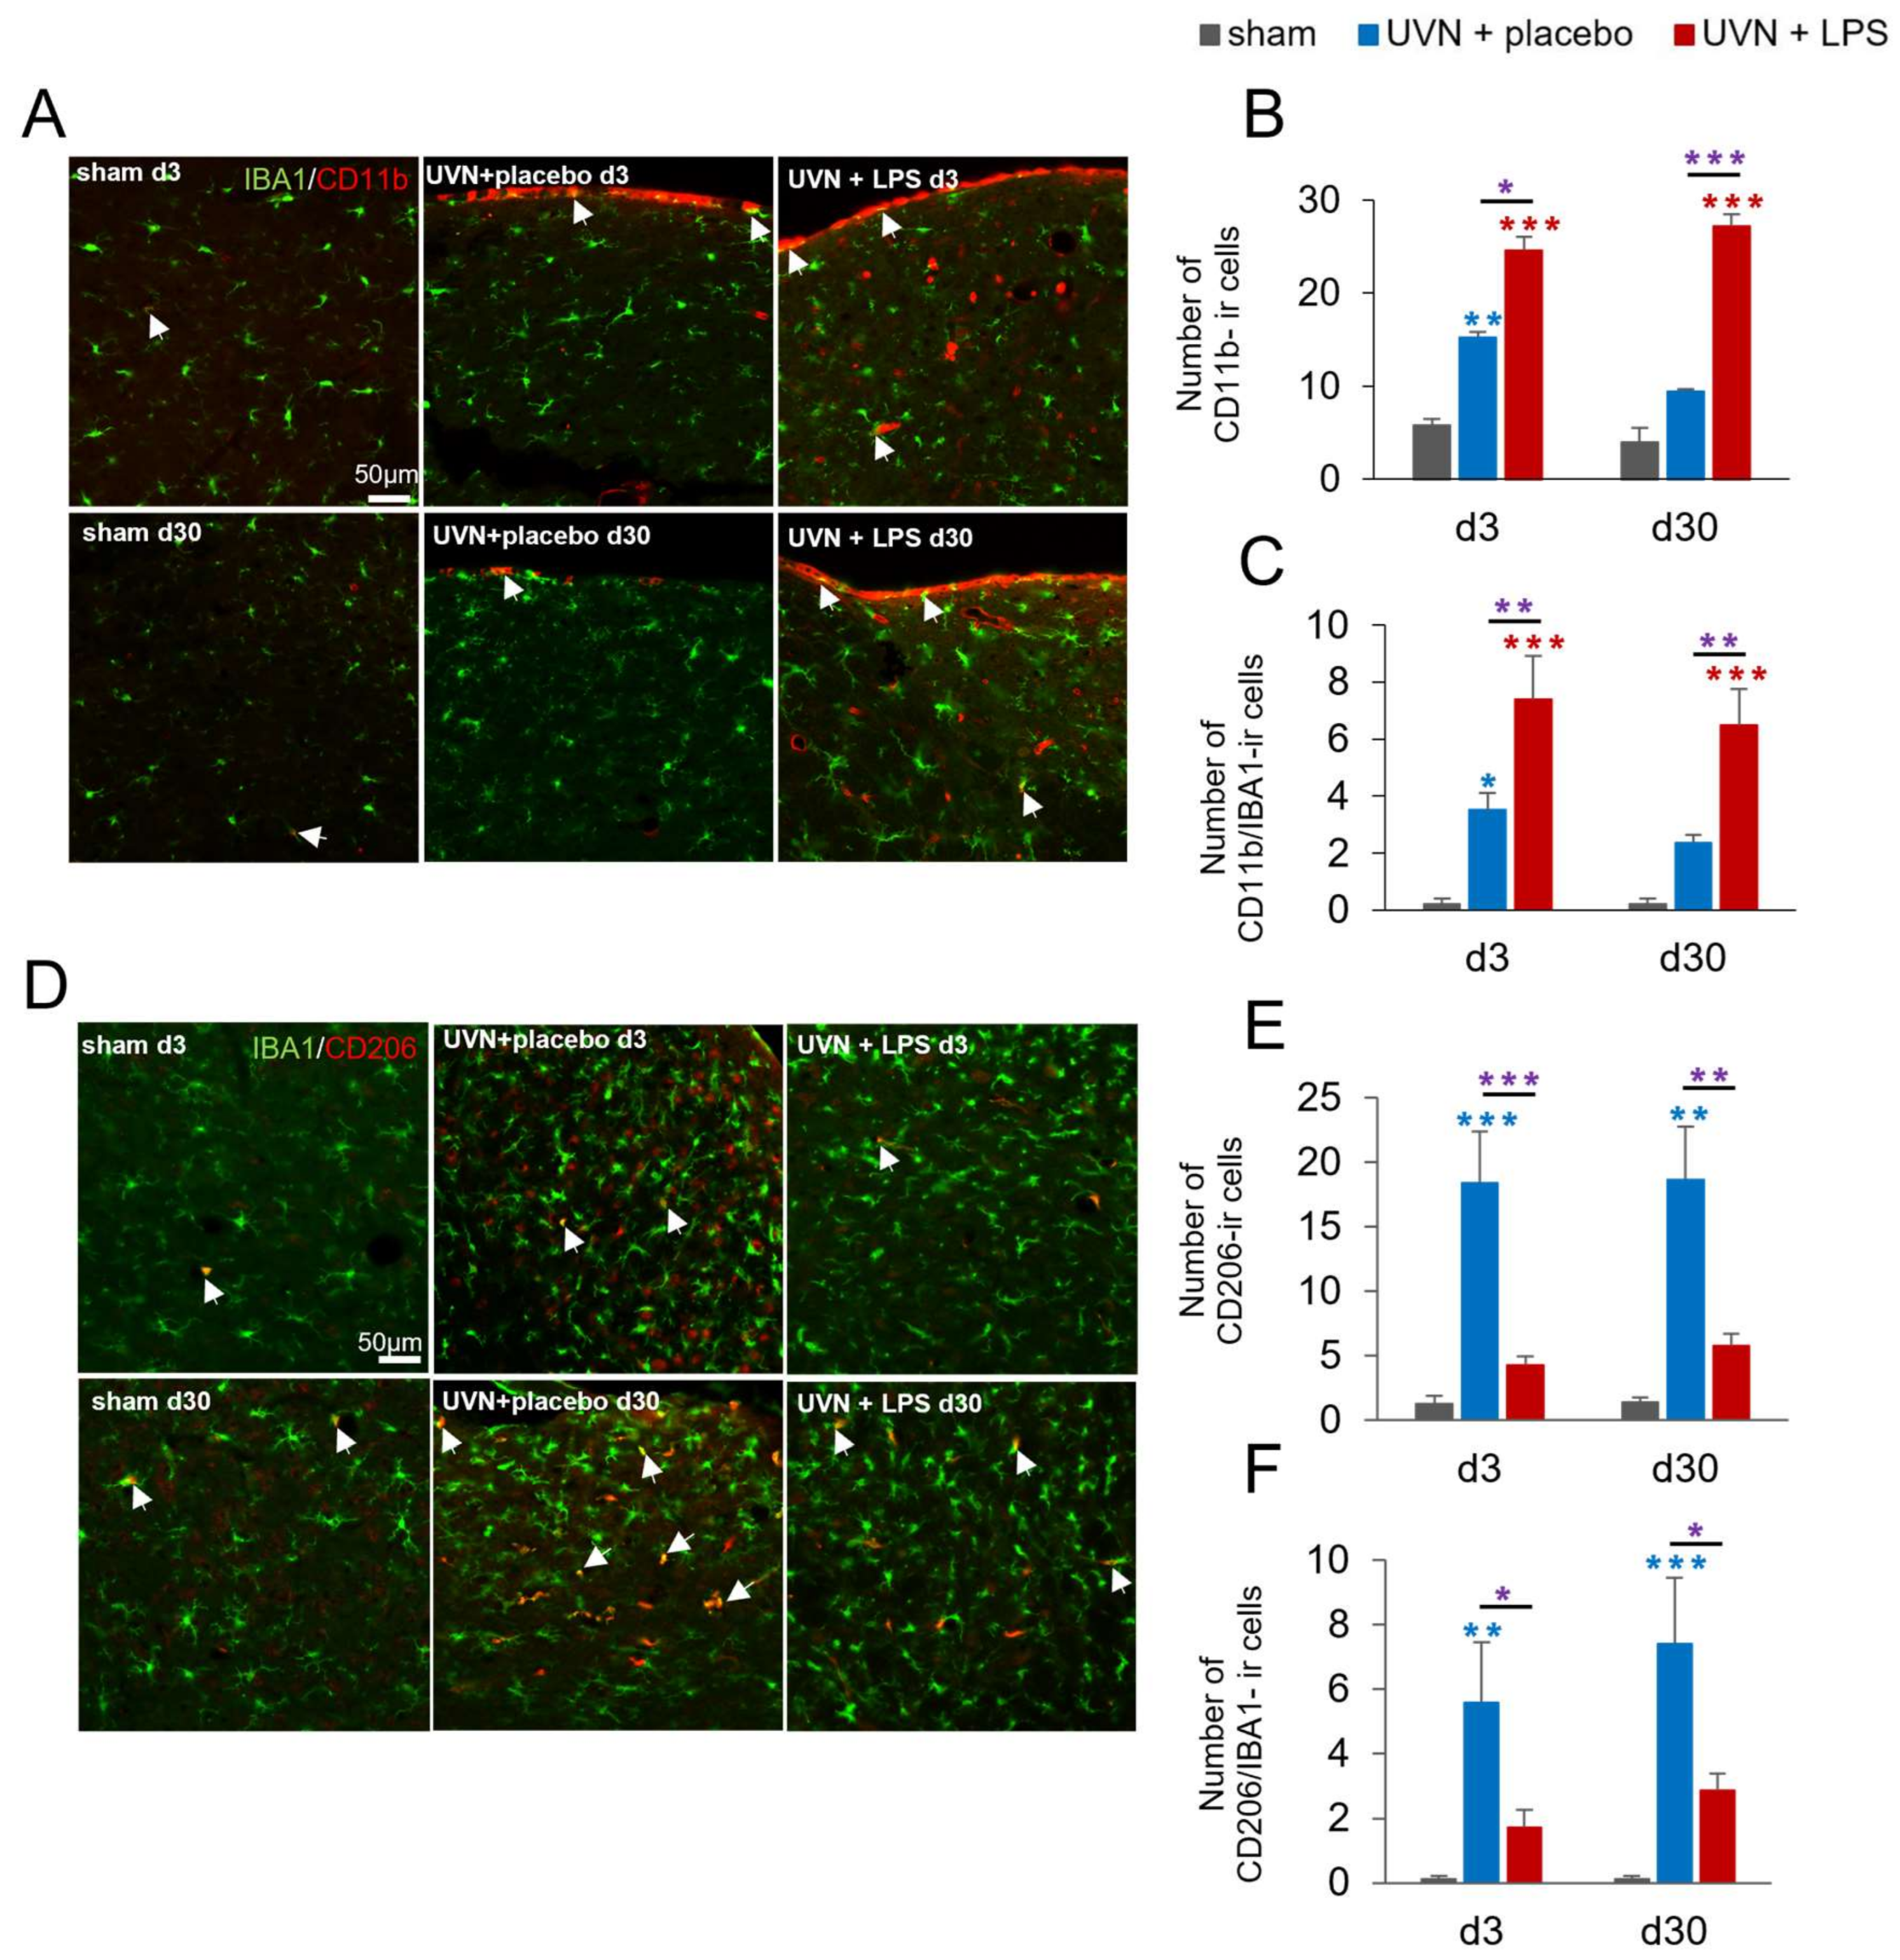
3.1.2. M1 and M2 Expressions Are Induced in the Deafferented MVNs after UVN and Modulated by Acute LPS Treatment
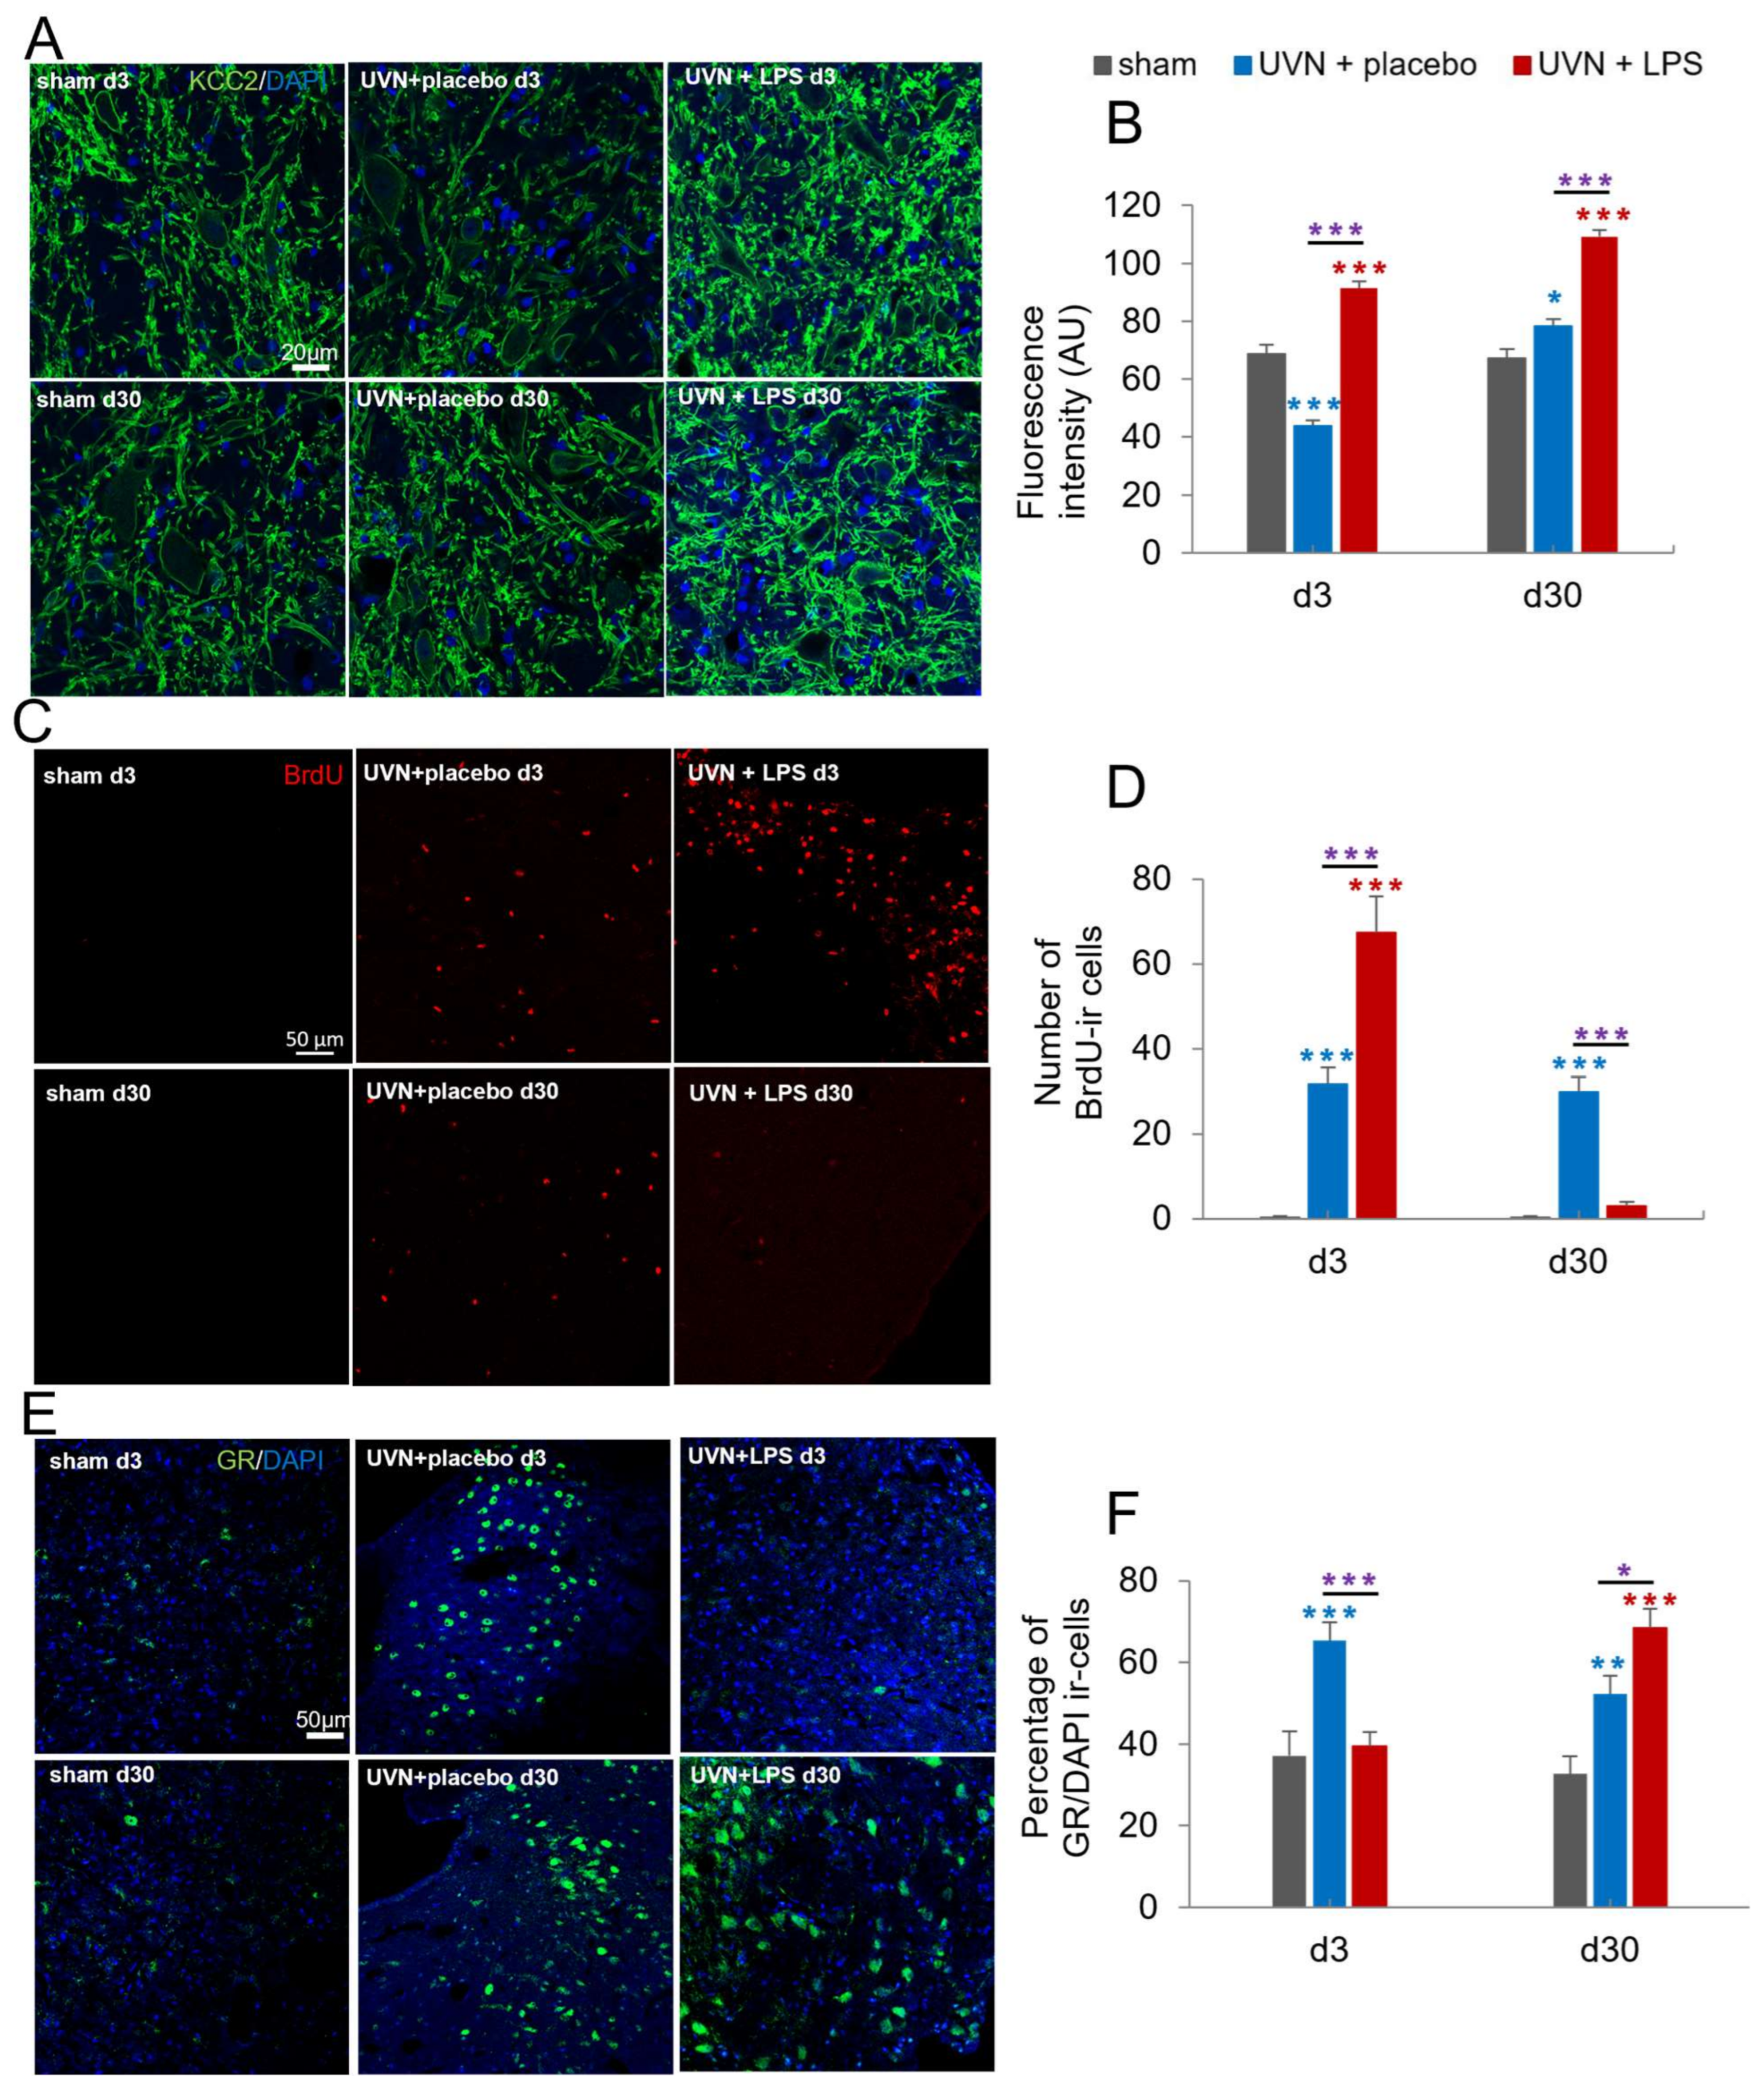
3.1.3. Acute LPS Treatment Significantly Increases KCC2 Expression in the Lateral VNs
3.1.4. Acute LPS Treatment Increases Cell Proliferation but Alters the Survival of New Cells in the Deafferented MVNs
3.1.5. Acute LPS Treatment Significantly Alters GR Dynamics over Time in the Deafferented MVNs
3.2. Behavioral Results
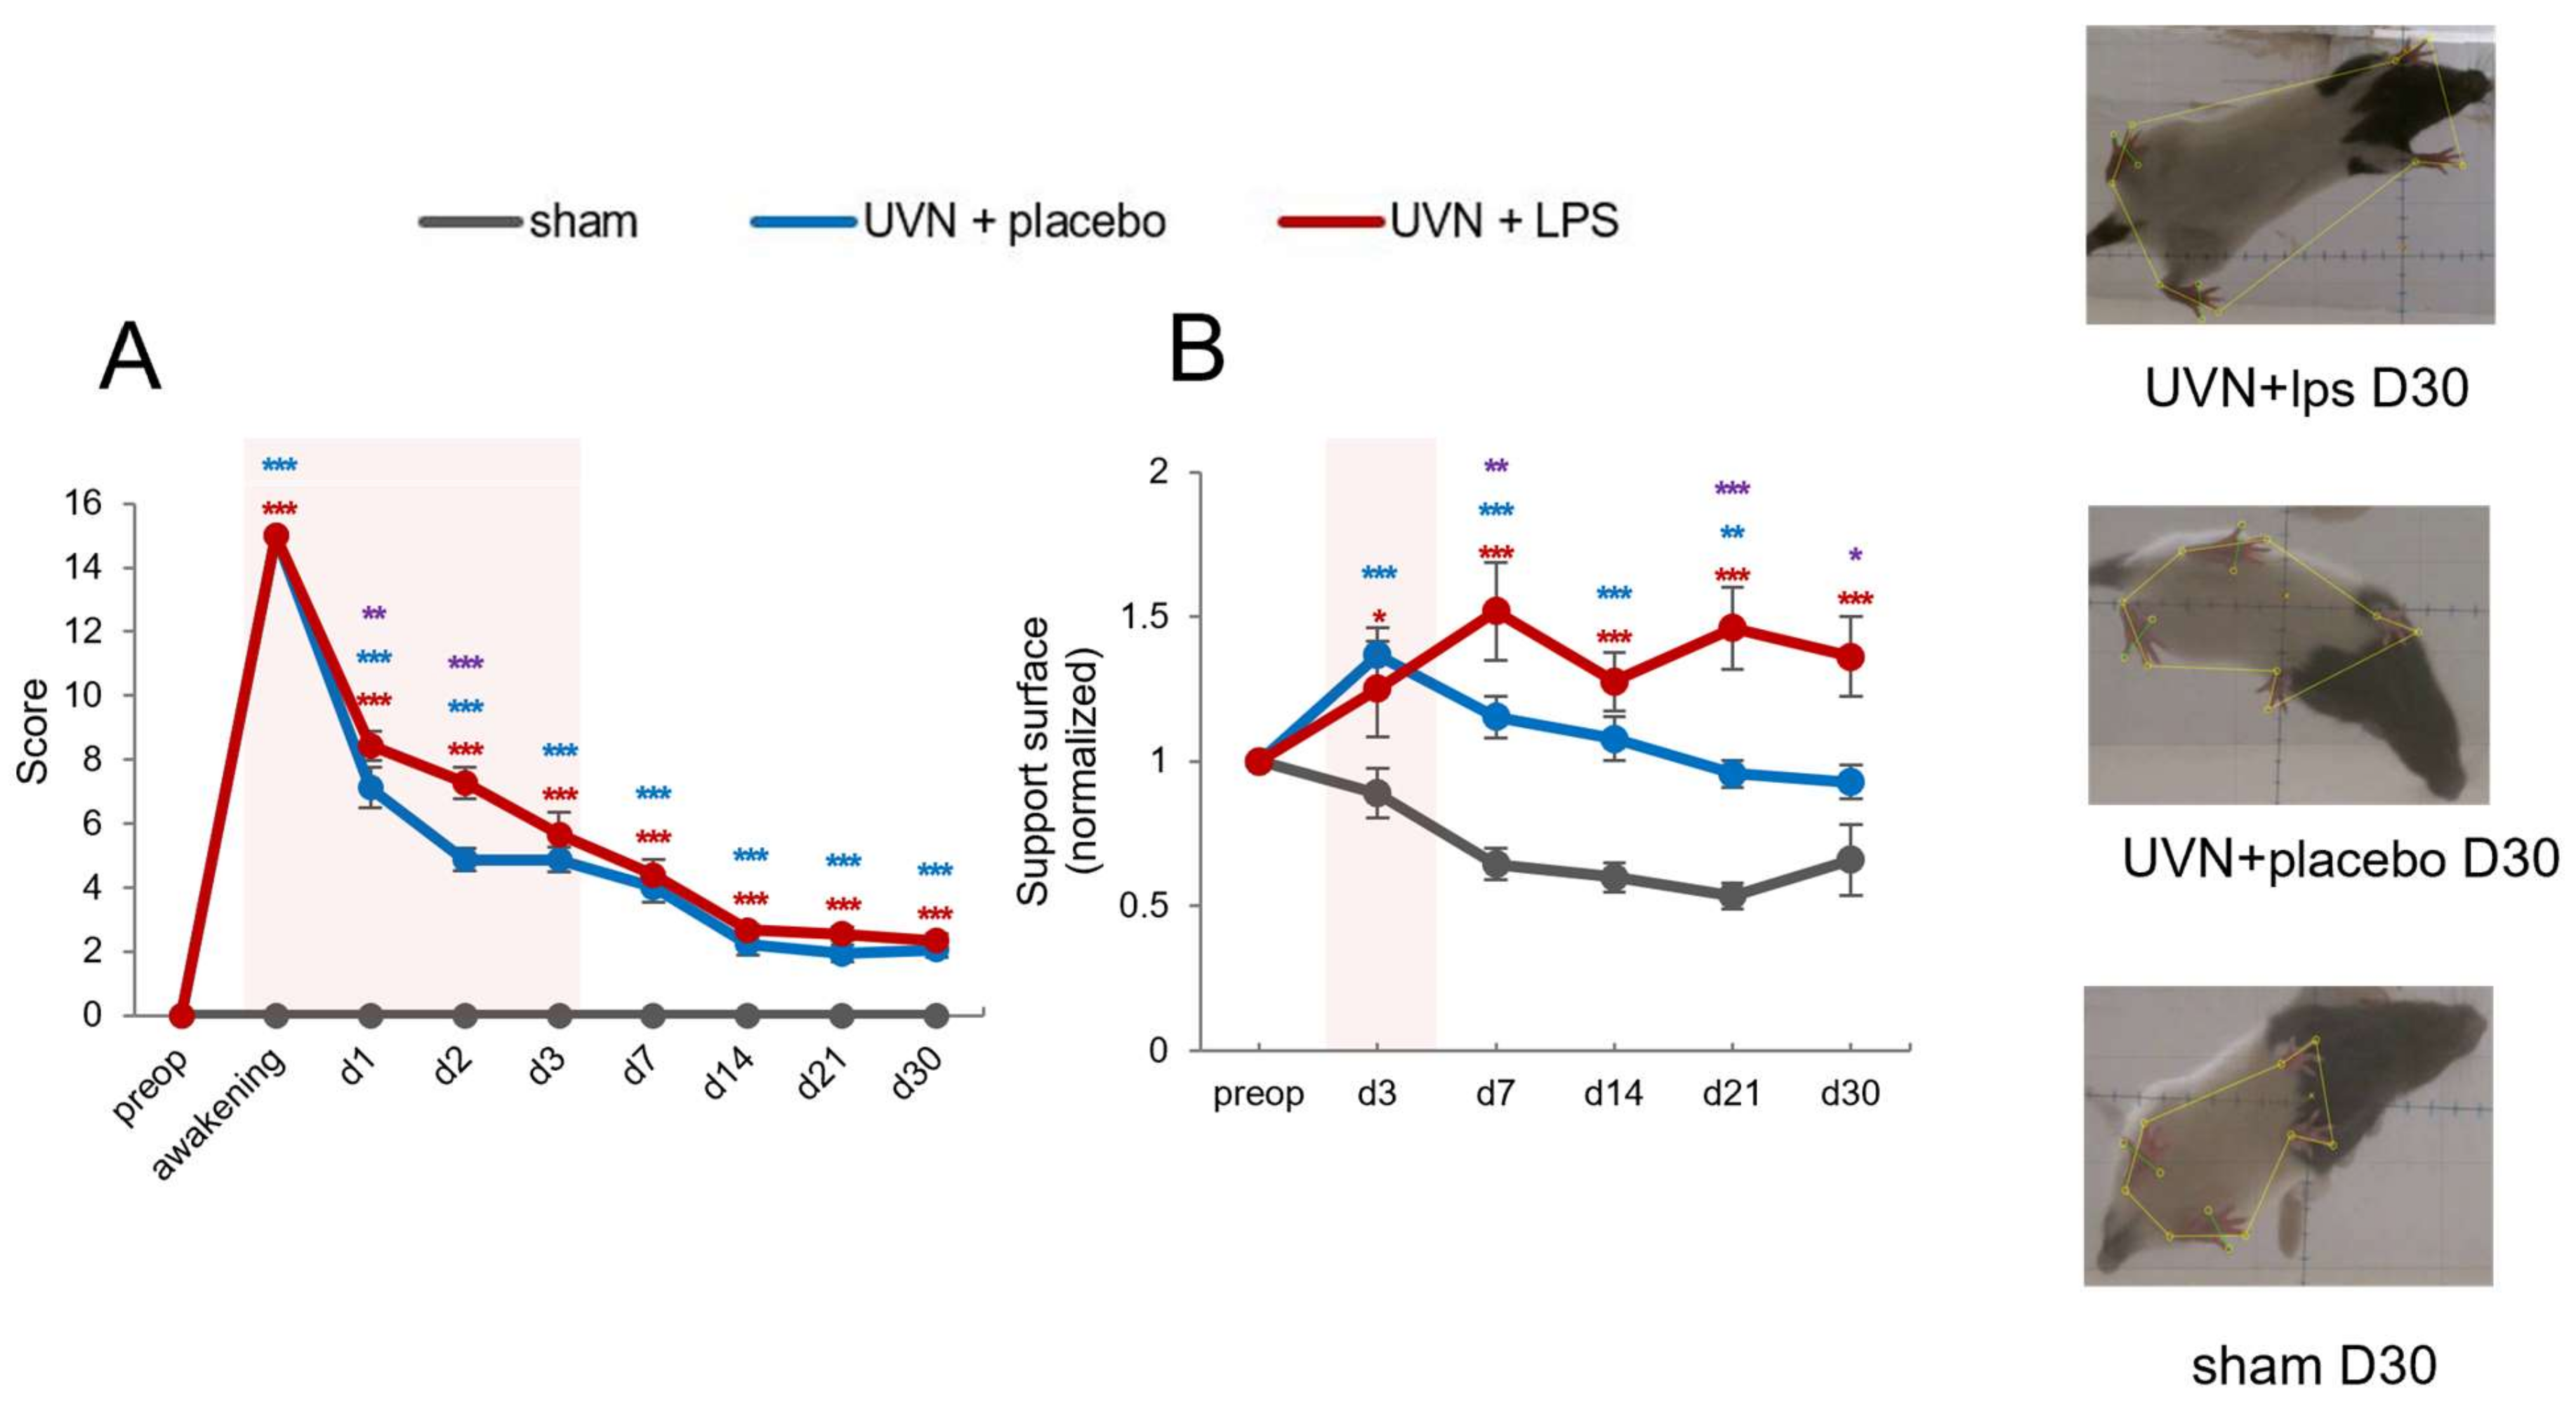
3.2.1. Acute LPS Treatment Significantly Increases Vestibular Syndrome Intensity during the Acute Phase
3.2.2. Acute LPS Treatment Significantly Increases Support Surface Measured after Vestibulospinal Reflex
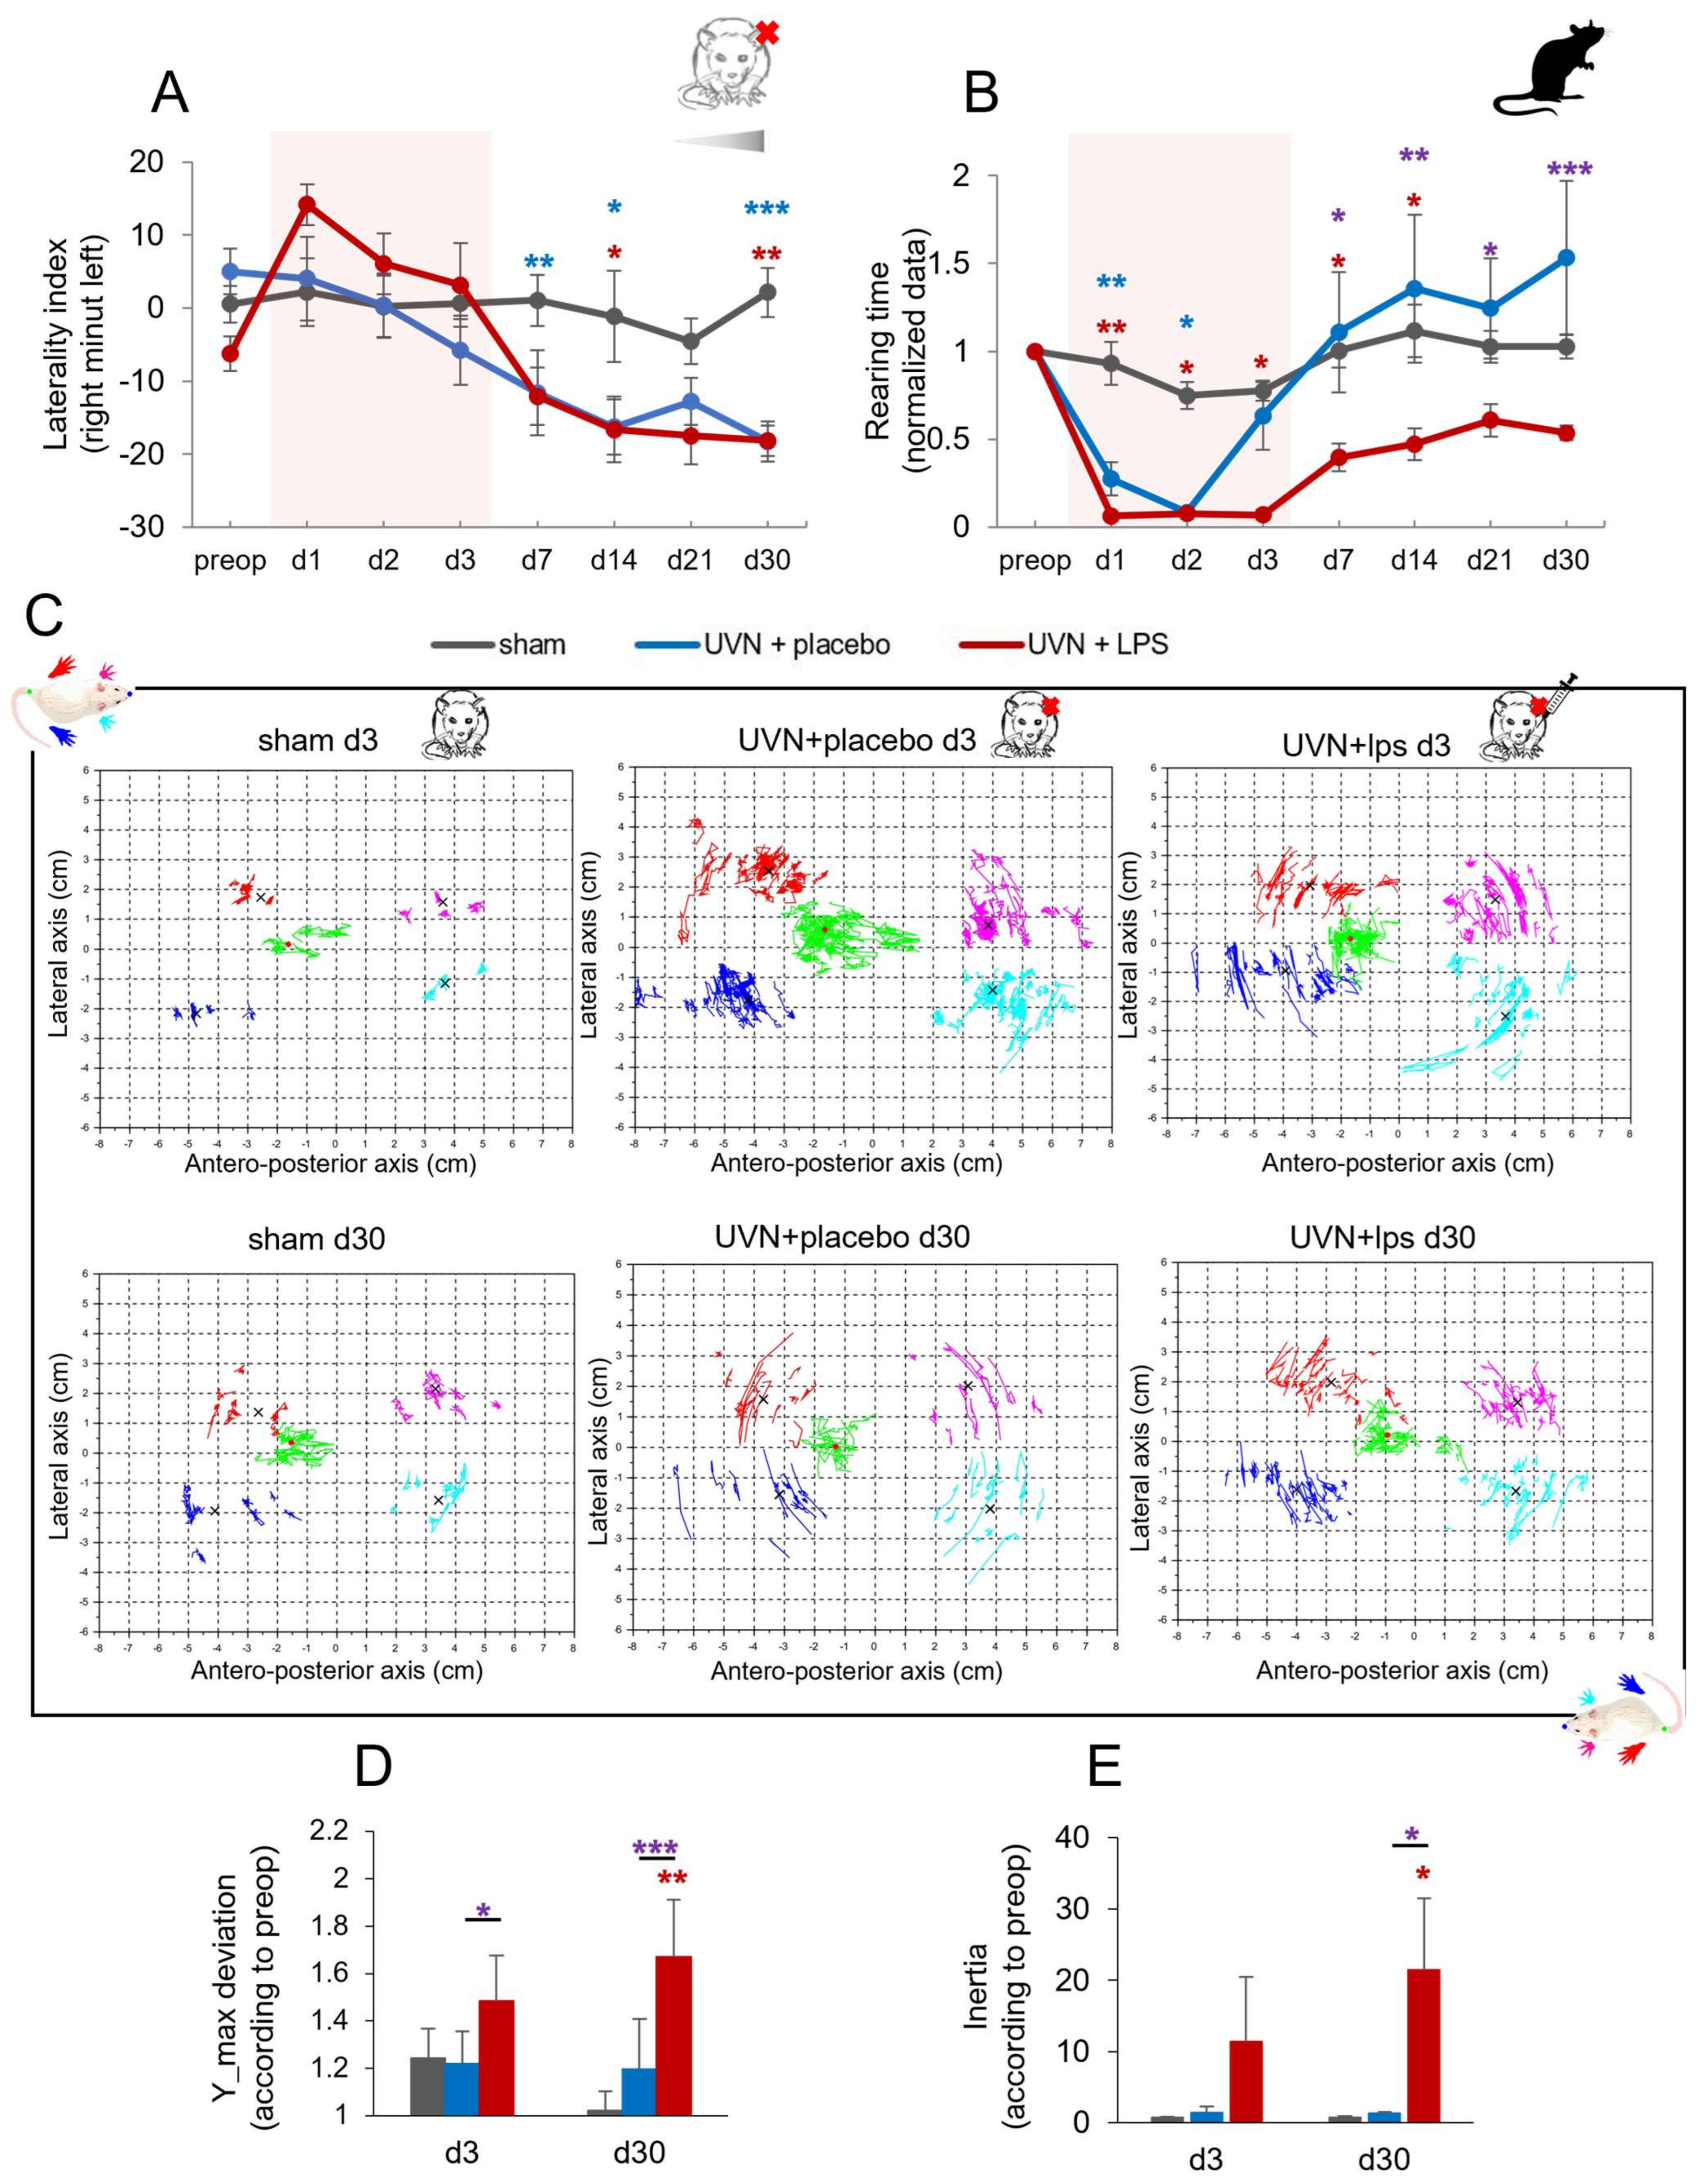
3.2.3. Effect of Acute LPS Treatment on Postural Function
Weight Distribution along the Lateral Axis
Rearing Time
Barycenter Posturographic Analysis
Barycenter Maximum Lateral Deviation
Barycenter Inertia
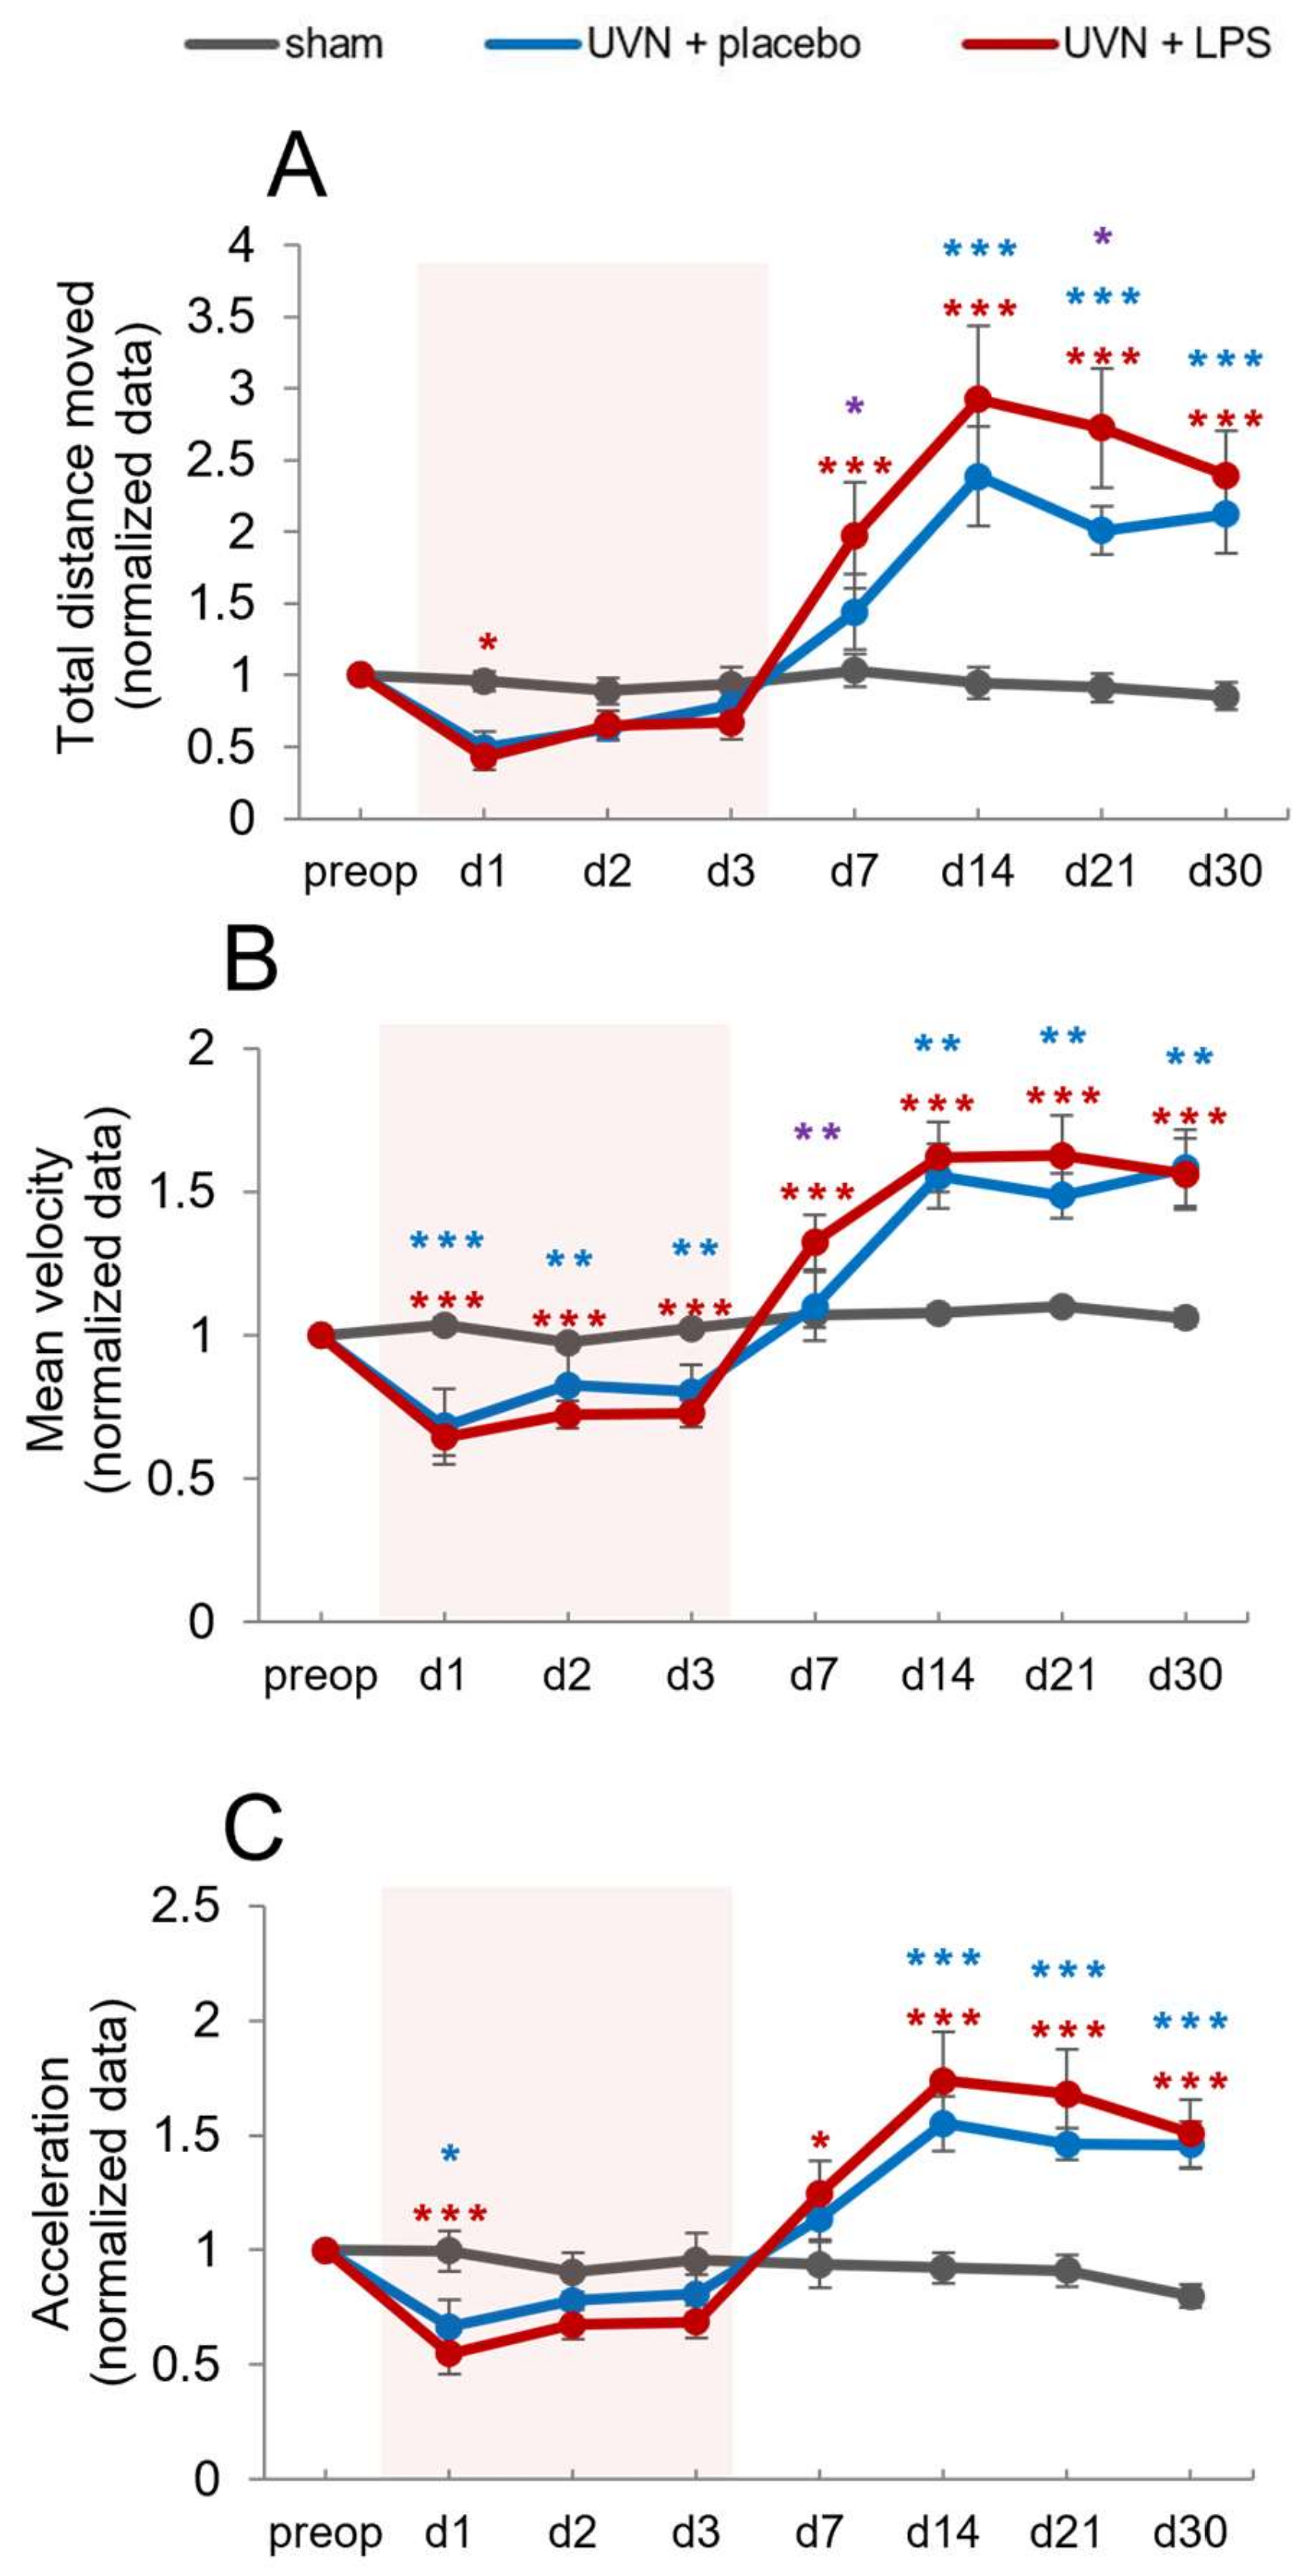
3.2.4. Effect of Acute LPS Treatment on Locomotion
Total Distance Traveled
Mean Velocity
Mean Acceleration
4. Discussion
4.1. Microglial Dynamics following UVN and Impact of the Acute LPS-Treatment
4.2. M1 and M2 Phenotypes as Regulators of the Plasticity in the Deafferented VN
4.2.1. Reactive Astrocytes Are Regulated by the Inflammatory State of the Deafferented VNs
4.2.2. Neurogliogenesis Is Modulated by M1/M2 Polarization in the Deafferented VNs
4.2.3. KCC2 Expression Is Modulated by the Inflammatory Response following UVN
4.2.4. Stress Response Is Related to the Inflammatory State of the Deafferented Vestibular Environment following UVN
4.3. Modulation of the Inflammatory State in the Deafferented VNs Interferes with Functional Recovery
4.4. Therapeutic Perspectives
Author Contributions
Funding
Institutional Review Board Statement
Informed Consent Statement
Data Availability Statement
Acknowledgments
Conflicts of Interest
References
- Bronstein, A.M.; Dieterich, M. Long-term clinical outcome in vestibular neuritis. Curr. Opin. Neurol. 2019, 32, 174–180. [Google Scholar] [CrossRef] [PubMed]
- Curthoys, I.S.; Halmagyi, G.M. Vestibular Compensation: A Review of the Oculomotor, Neural, and Clinical Consequences of Unilateral Vestibular Loss. J. Vestib. Res. 1995, 5, 67–107. [Google Scholar] [CrossRef] [PubMed]
- Uffer, D.S.; Hegemann, S.C. About the pathophysiology of acute unilateral vestibular deficit—vestibular neuritis (VN) or peripheral vestibulopathy (PVP)? J. Vestib. Res. 2016, 26, 311–317. [Google Scholar] [CrossRef] [PubMed]
- Dutia, M.B. Mechanisms of vestibular compensation: Recent advances. Curr. Opin. Otolaryngol. Head Neck Surg. 2010, 18, 420–424. [Google Scholar] [CrossRef] [PubMed]
- McCabe, B.F.; Ryu, J.H. Experiments on vestibular compensation. Laryngoscope 1969, 79, 1728–1736. [Google Scholar] [CrossRef]
- Precht, W.; Shimazu, H.; Markham, C.H. A mechanism of central compensation of vestibular function following hemilabyrinthectomy. J. Neurophysiol. 1966, 29, 996–1010. [Google Scholar] [CrossRef]
- Lacour, M.; Helmchen, C.; Vidal, P.-P. Vestibular compensation: The neuro-otologist’s best friend. J. Neurol. 2016, 263, 54–64. [Google Scholar] [CrossRef]
- Lacour, M.; Tighilet, B. Plastic events in the vestibular nuclei during vestibular compensation: The brain orchestration of a “deafferentation” code. Restor. Neurol. Neurosci. 2010, 28, 19–35. [Google Scholar] [CrossRef]
- Tighilet, B.; Chabbert, C. Adult neurogenesis promotes balance recovery after vestibular loss. Prog. Neurobiol. 2019, 174, 28–35. [Google Scholar] [CrossRef]
- Torres, A.C.; Vidal, P.; de Waele, C. Evidence for a microglial reaction within the vestibular and cochlear nuclei following inner ear lesion in the rat. Neuroscience 1999, 92, 1475–1490. [Google Scholar] [CrossRef]
- El Mahmoudi, N.; Rastoldo, G.; Marouane, E.; Péricat, D.; Watabe, I.; Tonetto, A.; Hautefort, C.; Chabbert, C.; Sargolini, F.; Tighilet, B. Breaking a dogma: Acute anti-inflammatory treatment alters both post-lesional functional recovery and endogenous adaptive plasticity mechanisms in a rodent model of acute peripheral vestibulopathy. J. Neuroinflamm. 2021, 18, 183. [Google Scholar] [CrossRef] [PubMed]
- Rastoldo, G.; El Mahmoudi, N.; Marouane, E.; Pericat, D.; Watabe, I.; Toneto, A.; López-Juárez, A.; Chabbert, C.; Tighilet, B. Adult and endemic neurogenesis in the vestibular nuclei after unilateral vestibular neurectomy. Prog. Neurobiol. 2020, 196, 101899. [Google Scholar] [CrossRef] [PubMed]
- Waele, C.; Torres, A.C.; Josset, P.; Vidal, P.P. Evidence for Reactive Astrocytes in Rat Vestibular and Cochlear Nuclei following Unilateral Inner Ear Lesion. Eur. J. Neurosci. 1996, 8, 2006–2018. [Google Scholar] [CrossRef] [PubMed]
- Zwergal, A.; Günther, L.; Brendel, M.; Beck, R.; Lindner, S.; Xiong, G.; Eilles, E.; Unterrainer, M.; Albert, N.L.; Becker-Bense, S.; et al. In Vivo Imaging of Glial Activation after Unilateral Labyrinthectomy in the Rat: A [18F]GE180-PET Study. Front. Neurol. 2017, 8, 665. [Google Scholar] [CrossRef] [PubMed]
- Liberge, M.; Manrique, C.; Bernard-Demanze, L.; Lacour, M. Changes in TNFa, NF B and MnSOD Protein in the Vestibular Nuclei after Unilateral Vestibular Deafferentation. J. Neuroinflamma. 2010, 16. [Google Scholar]
- Dutheil, S.; Lacour, M.; Tighilet, B. Neurogenic Potential of the Vestibular Nuclei and Behavioural Recovery Time Course in the Adult Cat Are Governed by the Nature of the Vestibular Damage. PLoS ONE 2011, 6, e22262. [Google Scholar] [CrossRef]
- Saman, Y.; Bamiou, R.-E.; Gleeson, M.; Dutia, M.B. Interactions between Stress and Vestibular Compensation—A Review. Front. Neurol. 2012, 3, 116. [Google Scholar] [CrossRef]
- Tighilet, B.; Manrique, C.; Lacour, M. Stress axis plasticity during vestibular compensation in the adult cat. Neuroscience 2009, 160, 716–730. [Google Scholar] [CrossRef]
- Fishman, J.M.; Burgess, C.; Waddell, A. Corticosteroids for the treatment of idiopathic acute vestibular dysfunction (vestibular neuritis). Cochrane Database Syst. Rev. 2011, CD008607. [Google Scholar] [CrossRef]
- Goudakos, J.K.; Markou, K.D.; Franco-Vidal, V.; Vital, V.; Tsaligopoulos, M.; Darrouzet, V. Corticosteroids in the Treatment of Vestibular Neuritis: A Systematic Review and Meta-Analysis. Otol. Neurotol. 2010, 31, 7. [Google Scholar] [CrossRef]
- Yoo, M.H.; Yang, C.J.; Kim, S.A.; Park, M.J.; Ahn, J.H.; Chung, J.W.; Park, H.J. Efficacy of steroid therapy based on symptomatic and functional improvement in patients with vestibular neuritis: A prospective randomized controlled trial. Eur. Arch. Oto-Rhino-Laryngol. 2017, 274, 2443–2451. [Google Scholar] [CrossRef] [PubMed]
- Botelho, R.V.; Daniel, J.W.; Boulosa, J.L.R.; Colli, B.O.; Farias, R.D.L.; Moraes, O.J.S.; Pimenta, W.E., Jr.; Ribeiro, C.H.; Ribeiro, F.R.B.; Taricco, M.A.; et al. Efetividade da metilprednisolona na fase aguda do trauma raquimedular: Revisão sistemática dos ensaios clínicos randomizados. Rev. Da Assoc. Médica Bras. 2009, 55, 729–737. [Google Scholar] [CrossRef] [PubMed][Green Version]
- Evaniew, N.; Belley-Côté, E.P.; Fallah, N.; Noonan, V.K.; Rivers, C.S.; Dvorak, M.F. Methylprednisolone for the Treatment of Patients with Acute Spinal Cord Injuries: A Systematic Review and Meta-Analysis. J. Neurotrauma 2016, 33, 468–481. [Google Scholar] [CrossRef] [PubMed]
- Hurlbert, R.J. Methylprednisolone for acute spinal cord injury: An inappropriate standard of care. J. Neurosurg. Spine 2000, 93, 1–7. [Google Scholar] [CrossRef] [PubMed]
- Russo, M.V.; McGavern, D.B. Inflammatory neuroprotection following traumatic brain injury. Science 2016, 353, 783–785. [Google Scholar] [CrossRef] [PubMed]
- Chen, X.; Zhang, K.-L.; Yang, S.-Y.; Dong, J.-F.; Zhang, J.-N. Glucocorticoids Aggravate Retrograde Memory Deficiency Associated with Traumatic Brain Injury in Rats. J. Neurotrauma 2009, 26, 253–260. [Google Scholar] [CrossRef] [PubMed]
- Haghighi, S.S.; Agrawal, S.K.; Surdell, D.; Plambeck, R.; Johnson, G.C.; Walker, A. Effects of methylprednisolone and MK-801 on functional recovery after experimental chronic spinal cord injury. Spinal Cord 2000, 38, 733–740. [Google Scholar] [CrossRef] [PubMed]
- Lankhorst, A.J.; ter Laak, M.P.; Hamers, F.P.; Gispen, W.H. Combined treatment with αMSH and methylprednisolone fails to improve functional recovery after spinal injury in the rat. Brain Res. 2000, 859, 334–340. [Google Scholar] [CrossRef]
- Pereira, J.E.; Costa, L.M.; Cabrita, A.M.; Couto, P.A.; Filipe, V.M.; Magalhães, L.G.; Fornaro, M.; Di Scipio, F.; Geuna, S.; Maurício, A.C.; et al. Methylprednisolone fails to improve functional and histological outcome following spinal cord injury in rats. Exp. Neurol. 2009, 220, 71–81. [Google Scholar] [CrossRef]
- Weaver, L.C.; Gris, D.; Saville, L.R.; Oatway, M.A.; Chen, Y.; Marsh, D.R.; Hamilton, E.F.; Dekaban, G.A. Methylprednisolone Causes Minimal Improvement after Spinal Cord Injury in Rats, Contrasting with Benefits of an Anti-Integrin Treatment. J. Neurotrauma 2005, 22, 1375–1387. [Google Scholar] [CrossRef]
- Zhang, B.; Chen, X.; Lin, Y.; Tan, T.; Yang, Z.; Dayao, C.; Liu, L.; Jiang, R.; Zhang, J. Impairment of synaptic plasticity in hippocampus is exacerbated by methylprednisolone in a rat model of traumatic brain injury. Brain Res. 2011, 1382, 165–172. [Google Scholar] [CrossRef] [PubMed]
- Sochocka, M.; Diniz, B.S.; Leszek, J. Inflammatory Response in the CNS: Friend or Foe? Mol. Neurobiol. 2017, 54, 8071–8089. [Google Scholar] [CrossRef] [PubMed]
- Lucas, S.-M.; Rothwell, N.J.; Gibson, R.M. The role of inflammation in CNS injury and disease. J. Cereb. Blood Flow Metab. 2006, 147, S232–S240. [Google Scholar] [CrossRef] [PubMed]
- Stephenson, J.; Nutma, E.; Van Der Valk, P.; Amor, S. Inflammation in CNS neurodegenerative diseases. Immunology 2018, 154, 204–219. [Google Scholar] [CrossRef] [PubMed]
- Li, Q.; Barres, B.A. Microglia and macrophages in brain homeostasis and disease. Nat. Rev. Immunol. 2017, 18, 225–242. [Google Scholar] [CrossRef] [PubMed]
- Renaud, J.; Thérien, H.-M.; Plouffe, M.; Martinoli, M.-G. La neuro-inflammation. Med. Sci. 2015, 31, 979–988. [Google Scholar] [CrossRef][Green Version]
- Cherry, J.D.; Olschowka, J.A.; O’Banion, M.K. Neuroinflammation and M2 microglia: The good, the bad, and the inflamed. J. Neuroinflamm. 2014, 11, 98. [Google Scholar] [CrossRef]
- Jurga, A.M.; Paleczna, M.; Kuter, K.Z. Overview of General and Discriminating Markers of Differential Microglia Phenotypes. Front. Cell. Neurosci. 2020, 14, 198. [Google Scholar] [CrossRef]
- Nimmerjahn, A.; Kirchhoff, F.; Helmchen, F. Resting Microglial Cells Are Highly Dynamic Surveillants of Brain Parenchyma in Vivo. Science 2005, 308, 1314–1318. [Google Scholar] [CrossRef]
- Liddelow, S.A.; Guttenplan, K.A.; Clarke, L.E.; Bennett, F.C.; Bohlen, C.J.; Schirmer, L.; Bennett, M.L.; Münch, A.E.; Chung, W.-S.; Peterson, T.C.; et al. Neurotoxic reactive astrocytes are induced by activated microglia. Nature 2017, 541, 481–487. [Google Scholar] [CrossRef]
- Song, G.J.; Suk, K. Pharmacological Modulation of Functional Phenotypes of Microglia in Neurodegenerative Diseases. Front. Aging Neurosci. 2017, 9, 139. [Google Scholar] [CrossRef] [PubMed]
- Loane, D.J.; Kumar, A. Microglia in the TBI brain: The good, the bad, and the dysregulated. Exp. Neurol. 2016, 275 Pt 3, 316–327. [Google Scholar] [CrossRef]
- David, S.; Kroner, A. Repertoire of microglial and macrophage responses after spinal cord injury. Nat. Rev. Neurosci. 2011, 12, 388–399. [Google Scholar] [CrossRef] [PubMed]
- Cunha, C.; Gomes, C.; Vaz, A.R.; Brites, D. Exploring New Inflammatory Biomarkers and Pathways during LPS-Induced M1 Polarization. Mediat. Inflamm. 2016, 2016, 6986175. [Google Scholar] [CrossRef] [PubMed]
- Li, Z.; Ma, L.; Kulesskaya, N.; Voikar, V.; Tian, L. Microglia are polarized to M1 type in high-anxiety inbred mice in response to lipopolysaccharide challenge. Brain, Behav. Immun. 2014, 38, 237–248. [Google Scholar] [CrossRef]
- Bossù, P.; Cutuli, D.; Palladino, I.; Caporali, P.; Angelucci, F.; Laricchiuta, D.; Gelfo, F.; De Bartolo, P.; Caltagirone, C.; Petrosini, L. A single intraperitoneal injection of endotoxin in rats induces long-lasting modifications in behavior and brain protein levels of TNF-α and IL-18. J. Neuroinflamm. 2012, 9, 101. [Google Scholar] [CrossRef]
- Fu, H.Q.; Yang, T.; Xiao, W.; Fan, L.; Wu, Y.; Terrando, N.; Wang, T.L. Prolonged Neuroinflammation after Lipopolysaccharide Exposure in Aged Rats. PLoS ONE 2014, 9, e106331. [Google Scholar] [CrossRef]
- Ling, Y.; Wang, J.; Yu, S.; Li, W.; Lu, H. The Protective Effect of Low Dose of Lipopolysaccharide Pretreatment on Endotoxin-Induced Uveitis in Rats Is Associated with Downregulation of CSF-1 and Upregulation of LRR-1. J. Immunol. Res. 2020, 2020, 9314756. [Google Scholar] [CrossRef]
- Wang, D.; Liu, Y.; Zhao, Y.-R.; Zhou, J.-L. Low dose of lipopolysaccharide pretreatment can alleviate the inflammatory response in wound infection mouse model. Chin. J. Traumatol. 2016, 19, 193–198. [Google Scholar] [CrossRef]
- Péricat, D.; Farina, A.; Agavnian-Couquiaud, E.; Chabbert, C.; Tighilet, B. Complete and irreversible unilateral vestibular loss: A novel rat model of vestibular pathology. J. Neurosci. Methods 2017, 283, 83–91. [Google Scholar] [CrossRef]
- Bison, S.; Carboni, L.; Arban, R.; Bate, S.T.; Gerrard, P.A.; Razzoli, M. Differential behavioral, physiological, and hormonal sensitivity to LPS challenge in rats. Int. J. Interf. Cytokine Mediat. Res. 2008, 1, 1–13. [Google Scholar] [CrossRef]
- Dutheil, S.; Watabe, I.; Sadlaoud, K.; Tonetto, A.; Tighilet, B. BDNF Signaling Promotes Vestibular Compensation by Increasing Neurogenesis and Remodeling the Expression of Potassium-Chloride Cotransporter KCC2 and GABAAReceptor in the Vestibular Nuclei. J. Neurosci. 2016, 36, 6199–6212. [Google Scholar] [CrossRef] [PubMed]
- Dutheil, S.; Brezun, J.M.; Leonard, J.; Lacour, M.; Tighilet, B. Neurogenesis and astrogenesis contribution to recovery of vestibular functions in the adult cat following unilateral vestibular neurectomy: Cellular and behavioral evidence. Neuroscience 2009, 164, 1444–1456. [Google Scholar] [CrossRef] [PubMed]
- Paxinos, G.; Watson, C. The Rat Brain in Stereotaxic Coordinates; Elsevier: Amsterdam, The Netherlands; Boston, MA, USA, 2009; ISBN 978-0-12-374876-8. [Google Scholar]
- Schindelin, J.; Arganda-Carreras, I.; Frise, E.; Kaynig, V.; Longair, M.; Pietzsch, T.; Preibisch, S.; Rueden, C.; Saalfeld, S.; Schmid, B.; et al. Fiji: An open-source platform for biological-image analysis. Nat. Methods 2012, 9, 676–682. [Google Scholar] [CrossRef] [PubMed]
- Kino, T.; Chrousos, G.P. Glucocorticoid Effects on Gene Expression. In Techniques in the Behavioral and Neural Sciences; Elsevier: Amsterdam, The Netherlands, 2005; Volume 15, pp. 295–311. ISBN 978-0-444-51173-7. [Google Scholar]
- Saaltink, D.-J.; Vreugdenhil, E. Stress, glucocorticoid receptors, and adult neurogenesis: A balance between excitation and inhibition? Experientia 2014, 71, 2499–2515. [Google Scholar] [CrossRef]
- Tighilet, B.; Dutheil, S.; Siponen, M.I.; Noreña, A.J. Reactive Neurogenesis and Down-Regulation of the Potassium-Chloride Cotransporter KCC2 in the Cochlear Nuclei after Cochlear Deafferentation. Front. Pharmacol. 2016, 7, 281. [Google Scholar] [CrossRef]
- Deliagina, T.G.; Popova, L.B.; Grant, G. The role of tonic vestibular input for postural control in rats. Arch. Ital. Biol. 1997, 135, 239–261. [Google Scholar]
- McCall, A.A.; Miller, D.M.; Yates, B.J. Descending Influences on Vestibulospinal and Vestibulosympathetic Reflexes. Front. Neurol. 2017, 8, 112. [Google Scholar] [CrossRef]
- Marouane, E.; Rastoldo, G.; El Mahmoudi, N.; Péricat, D.; Chabbert, C.; Artzner, V.; Tighilet, B. Identification of New Biomarkers of Posturo-Locomotor Instability in a Rodent Model of Vestibular Pathology. Front. Neurol. 2020, 11, 230. [Google Scholar] [CrossRef]
- Tighilet, B.; Leonard, J.; Bernard-Demanze, L.; Lacour, M. Comparative analysis of pharmacological treatments with N-acetyl-dl-leucine (Tanganil) and its two isomers (N-acetyl-L-leucine and N-acetyl-D-leucine) on vestibular compensation: Behavioral investigation in the cat. Eur. J. Pharmacol. 2015, 769, 342–349. [Google Scholar] [CrossRef] [PubMed]
- Martins-Lopes, V.; Bellmunt, A.; Greguske, E.A.; Maroto, A.F.; Boadas-Vaello, P.; Llorens, J. Quantitative Assessment of Anti-Gravity Reflexes to Evaluate Vestibular Dysfunction in Rats. J. Assoc. Res. Otolaryngol. 2019, 20, 553–563. [Google Scholar] [CrossRef] [PubMed]
- Cassel, R.; Bordiga, P.; Pericat, D.; Hautefort, C.; Tighilet, B.; Chabbert, C. New mouse model for inducing and evaluating unilateral vestibular deafferentation syndrome. J. Neurosci. Methods 2018, 293, 128–135. [Google Scholar] [CrossRef] [PubMed]
- Grosch, M.; Lindner, M.; Bartenstein, P.; Brandt, T.; Dieterich, M.; Ziegler, S.; Zwergal, A. Dynamic whole-brain metabolic connectivity during vestibular compensation in the rat. NeuroImage 2020, 226, 117588. [Google Scholar] [CrossRef] [PubMed]
- Tighilet, B.; Péricat, D.; Frelat, A.; Cazals, Y.; Rastoldo, G.; Boyer, F.; Dumas, O.; Chabbert, C. Adjustment of the dynamic weight distribution as a sensitive parameter for diagnosis of postural alteration in a rodent model of vestibular deficit. PLoS ONE 2017, 12, e0187472. [Google Scholar] [CrossRef] [PubMed]
- Facchini, J.; Rastoldo, G.; Xerri, C.; Péricat, D.; El Ahmadi, A.; Tighilet, B.; Zennou-Azogui, Y. Unilateral vestibular neurectomy induces a remodeling of somatosensory cortical maps. Prog. Neurobiol. 2021, 205, 102119. [Google Scholar] [CrossRef]
- Rastoldo, G.; Marouane, E.; El Mahmoudi, N.; Péricat, D.; Bourdet, A.; Timon-David, E.; Dumas, O.; Chabbert, C.; Tighilet, B. Quantitative Evaluation of a New Posturo-Locomotor Phenotype in a Rodent Model of Acute Unilateral Vestibulopathy. Front. Neurol. 2020, 11, 505. [Google Scholar] [CrossRef]
- Espinosa-Garcia, C.; Sayeed, I.; Yousuf, S.; Atif, F.; Sergeeva, E.G.; Neigh, G.N.; Stein, D.G. Stress primes microglial polarization after global ischemia: Therapeutic potential of progesterone. Brain, Behav. Immun. 2017, 66, 177–192. [Google Scholar] [CrossRef]
- Michels, M.; Abatti, M.R.; Ávila, P.; Vieira, A.; Borges, H.; Junior, C.C.; Wendhausen, D.; Gasparotto, J.; Ribeiro, C.T.; Moreira, J.C.F.; et al. Characterization and modulation of microglial phenotypes in an animal model of severe sepsis. J. Cell. Mol. Med. 2019, 24, 88–97. [Google Scholar] [CrossRef]
- Rivera, C.; Voipio, J.; Thomas-Crusells, J.; Li, H.; Emri, Z.; Sipilä, S.; Payne, J.A.; Minichiello, L.; Saarma, M.; Kaila, K. Mechanism of Activity-Dependent Downregulation of the Neuron-Specific K-Cl Cotransporter KCC2. J. Neurosci. 2004, 24, 4683–4691. [Google Scholar] [CrossRef]
- Tighilet, B.; Brezun, J.M.; Dit Duflo Sylvie, G.; Gaubert, C.; Lacour, M. New neurons in the vestibular nuclei complex after unilateral vestibular neurectomy in the adult cat. Eur. J. Neurosci. 2007, 25, 47–58. [Google Scholar] [CrossRef] [PubMed]
- Tighilet, B.; Trottier, S.; Mourre, C.; Lacour, M. Changes in the histaminergic system during vestibular compensation in the cat. J. Physiol. 2006, 573, 723–739. [Google Scholar] [CrossRef] [PubMed]
- Marouane, E.; El Mahmoudi, N.; Rastoldo, G.; Péricat, D.; Watabe, I.; Lapôtre, A.; Tonetto, A.; Xavier, F.; Dumas, O.; Chabbert, C.; et al. Sensorimotor Rehabilitation Promotes Vestibular Compensation in a Rodent Model of Acute Peripheral Vestibulopathy by Promoting Microgliogenesis in the Deafferented Vestibular Nuclei. Cells 2021, 10, 3377. [Google Scholar] [CrossRef] [PubMed]
- Allum, J.H.; Shepard, N.T. An Overview of the Clinical Use of Dynamic Posturography in the Differential Diagnosis of Bal-ance Disorders. J. Vestib. Res. 1999, 9, 223–252. [Google Scholar] [CrossRef] [PubMed]
- Young, L.R.; Bernard-Demanze, L.; Dumitrescu, M.; Magnan, J.; Borel, L.; Lacour, M. Postural performance of vestibular loss patients under increased postural threat1. J. Vestib. Res. 2012, 22, 129–138. [Google Scholar] [CrossRef]
- Orihuela, R.; McPherson, C.A.; Harry, G.J. Microglial M1/M2 polarization and metabolic states. J. Cereb. Blood Flow Metab. 2015, 173, 649–665. [Google Scholar] [CrossRef]
- Ito, D.; Tanaka, K.; Suzuki, S.; Dembo, T.; Fukuuchi, Y. Enhanced Expression of Iba1, Ionized Calcium-Binding Adapter Molecule 1, After Transient Focal Cerebral Ischemia In Rat Brain. Stroke 2001, 32, 1208–1215. [Google Scholar] [CrossRef]
- Ransohoff, R.M. A polarizing question: Do M1 and M2 microglia exist? Nat. Neurosci. 2016, 19, 987–991. [Google Scholar] [CrossRef]
- Rahimian, R.; Wakid, M.; O’Leary, L.A.; Mechawar, N. The emerging tale of microglia in psychiatric disorders. Neurosci. Biobehav. Rev. 2021, 131, 1–29. [Google Scholar] [CrossRef]
- Rahimian, R.; Belliveau, C.; Chen, R.; Mechawar, N. Microglial Inflammatory-Metabolic Pathways and Their Potential Therapeutic Implication in Major Depressive Disorder. Front. Psychiatry 2022, 13, 1237. [Google Scholar] [CrossRef]
- Gregersen, R.; Lambertsen, K.; Finsen, B. Microglia and Macrophages Are the Major Source of Tumor Necrosis Factor in Permanent Middle Cerebral Artery Occlusion in Mice. J. Cereb. Blood Flow Metab. 2000, 20, 53–65. [Google Scholar] [CrossRef] [PubMed]
- Block, M.L.; Zecca, L.; Hong, J.-S. Microglia-mediated neurotoxicity: Uncovering the molecular mechanisms. Nat. Rev. Neurosci. 2007, 8, 57–69. [Google Scholar] [CrossRef]
- Gazi, U.; Martinez-Pomares, L. Influence of the mannose receptor in host immune responses. Immunobiology 2009, 214, 554–561. [Google Scholar] [CrossRef] [PubMed]
- Lee, S.J.; Evers, S.; Roeder, D.; Parlow, A.F.; Risteli, J.; Risteli, L.; Lee, Y.C.; Feizi, T.; Langen, H.; Nussenzweig, M.C. Mannose Receptor-Mediated Regulation of Serum Glycoprotein Homeostasis. Science 2002, 295, 1898–1901. [Google Scholar] [CrossRef] [PubMed]
- Gonzalez-Zulueta, M.; Ensz, L.M.; Mukhina, G.; Lebovitz, R.M.; Zwacka, R.M.; Engelhardt, J.F.; Oberley, L.W.; Dawson, V.L.; Dawson, T.M. Manganese Superoxide Dismutase Protects nNOS Neurons from NMDA and Nitric Oxide-Mediated Neurotoxicity. J. Neurosci. 1998, 18, 2040–2055. [Google Scholar] [CrossRef]
- Keller, J.; Kindy, M.S.; Holtsberg, F.W.; Clair, D.K.S.; Yen, H.-C.; Germeyer, A.; Steiner, S.M.; Bruce-Keller, A.J.; Hutchins, J.B.; Mattson, M.P. Mitochondrial Manganese Superoxide Dismutase Prevents Neural Apoptosis and Reduces Ischemic Brain Injury: Suppression of Peroxynitrite Production, Lipid Peroxidation, and Mitochondrial Dysfunction. J. Neurosci. 1998, 18, 687–697. [Google Scholar] [CrossRef]
- Ezanoni, I.; Egranucci, F. Role of CD14 in host protection against infections and in metabolism regulation. Front. Cell. Infect. Microbiol. 2013, 3, 32. [Google Scholar] [CrossRef]
- Nordgreen, J.; Munsterhjelm, C.; Aae, F.; Popova, A.; Boysen, P.; Ranheim, B.; Heinonen, M.; Raszplewicz, J.; Piepponen, P.; Lervik, A.; et al. The effect of lipopolysaccharide (LPS) on inflammatory markers in blood and brain and on behavior in individually-housed pigs. Physiol. Behav. 2018, 195, 98–111. [Google Scholar] [CrossRef]
- Banks, W.A.; Robinson, S.M. Minimal penetration of lipopolysaccharide across the murine blood–brain barrier. Brain Behav. Immun. 2010, 24, 102–109. [Google Scholar] [CrossRef]
- Singh, A.; Jiang, Y. How does peripheral lipopolysaccharide induce gene expression in the brain of rats? Toxicology 2004, 201, 197–207. [Google Scholar] [CrossRef]
- Vargas-Caraveo, A.; Sayd, A.; Maus, S.R.; Caso, J.; Madrigal, J.; García-Bueno, B.; Leza, J.C. Lipopolysaccharide enters the rat brain by a lipoprotein-mediated transport mechanism in physiological conditions. Sci. Rep. 2017, 7, 13113. [Google Scholar] [CrossRef] [PubMed]
- Zhao, J.; Bi, W.; Xiao, S.; Lan, X.; Cheng, X.; Zhang, J.; Lu, D.; Wei, W.; Wang, Y.; Li, H.; et al. Neuroinflammation induced by lipopolysaccharide causes cognitive impairment in mice. Sci. Rep. 2019, 9, 5790. [Google Scholar] [CrossRef] [PubMed]
- Korzhevskii, D.E.; Kirik, O.V. Brain Microglia and Microglial Markers. Neurosci. Behav. Physiol. 2016, 46, 284–290. [Google Scholar] [CrossRef]
- Matsumoto, H.; Kumon, Y.; Watanabe, H.; Ohnishi, T.; Shudou, M.; Ii, C.; Takahashi, H.; Imai, Y.; Tanaka, J. Antibodies to CD11b, CD68, and lectin label neutrophils rather than microglia in traumatic and ischemic brain lesions. J. Neurosci. Res. 2007, 85, 994–1009. [Google Scholar] [CrossRef] [PubMed]
- Burudi, E.; Riese, S.; Stahl, P.D. Identification and functional characterization of the mannose receptor in astrocytes. Glia 1998, 25, 44–55. [Google Scholar] [CrossRef]
- Colombo, E.; Farina, C. Astrocytes: Key Regulators of Neuroinflammation. Trends Immunol. 2016, 37, 608–620. [Google Scholar] [CrossRef]
- Eng, L.F.; Ghirnikar, R.S. GFAP and Astrogliosis. Brain Pathol. 1994, 4, 229–237. [Google Scholar] [CrossRef]
- Liu, W.; Tang, Y.; Feng, J. Cross talk between activation of microglia and astrocytes in pathological conditions in the central nervous system. Life Sci. 2011, 89, 141–146. [Google Scholar] [CrossRef]
- Morizawa, Y.M.; Hirayama, Y.; Ohno, N.; Shibata, S.; Shigetomi, E.; Sui, Y.; Nabekura, J.; Sato, K.; Okajima, F.; Takebayashi, H.; et al. Reactive astrocytes function as phagocytes after brain ischemia via ABCA1-mediated pathway. Nat. Commun. 2017, 8, 28. [Google Scholar] [CrossRef]
- Shinozaki, Y.; Shibata, K.; Yoshida, K.; Shigetomi, E.; Gachet, C.; Ikenaka, K.; Tanaka, K.F.; Koizumi, S. Transformation of Astrocytes to a Neuroprotective Phenotype by Microglia via P2Y1 Receptor Downregulation. Cell Rep. 2017, 19, 1151–1164. [Google Scholar] [CrossRef]
- Li, T.; Chen, X.; Zhang, C.; Zhang, Y.; Yao, W. An update on reactive astrocytes in chronic pain. J. Neuroinflamm. 2019, 16, 140. [Google Scholar] [CrossRef] [PubMed]
- Ming, G.-L.; Song, H. ADULT NEUROGENESIS IN THE MAMMALIAN CENTRAL NERVOUS SYSTEM. Annu. Rev. Neurosci. 2005, 28, 223–250. [Google Scholar] [CrossRef] [PubMed]
- Borsini, A.; Zunszain, P.A.; Thuret, S.; Pariante, C.M. The role of inflammatory cytokines as key modulators of neurogenesis. Trends Neurosci. 2015, 38, 145–157. [Google Scholar] [CrossRef] [PubMed]
- Widera, D.; Mikenberg, I.; Elvers, M.; Kaltschmidt, C.; Kaltschmidt, B. Tumor necrosis factor α triggers proliferation of adult neural stem cells via IKK/NF-κB signaling. BMC Neurosci. 2006, 7, 64. [Google Scholar] [CrossRef]
- Hu, X.; Leak, R.K.; Shi, Y.; Suenaga, J.; Gao, Y.; Zheng, P.; Chen, J. Microglial and macrophage polarization—New prospects for brain repair. Nat. Rev. Neurol. 2015, 11, 56–64. [Google Scholar] [CrossRef]
- Zhang, L.; Zhang, J.; You, Z. Switching of the Microglial Activation Phenotype Is a Possible Treatment for Depression Disorder. Front. Cell. Neurosci. 2018, 12, 306. [Google Scholar] [CrossRef]
- Yuan, J.; Ge, H.; Liu, W.; Zhu, H.; Chen, Y.; Zhang, X.; Yang, Y.; Yin, Y.; Chen, W.; Wu, W.; et al. M2 microglia promotes neurogenesis and oligodendrogenesis from neural stem/progenitor cells via the PPARγ signaling pathway. Oncotarget 2017, 8, 19855–19865. [Google Scholar] [CrossRef]
- Ekdahl, C.T.; Claasen, J.-H.; Bonde, S.; Kokaia, Z.; Lindvall, O. Inflammation is detrimental for neurogenesis in adult brain. Proc. Natl. Acad. Sci. USA 2003, 100, 13632–13637. [Google Scholar] [CrossRef]
- Burke, N.; Kerr, D.M.; Moriarty, O.; Finn, D.; Roche, M. Minocycline modulates neuropathic pain behaviour and cortical M1–M2 microglial gene expression in a rat model of depression. Brain Behav. Immun. 2014, 42, 147–156. [Google Scholar] [CrossRef]
- Miao, H.; Li, R.; Han, C.; Lu, X.; Zhang, H. Minocycline promotes posthemorrhagic neurogenesis via M2 microglia polarization via upregulation of the TrkB/BDNF pathway in rats. J. Neurophysiol. 2018, 120, 1307–1317. [Google Scholar] [CrossRef]
- Coull, J.A.M.; Boudreau, D.; Bachand, K.; Prescott, S.A.; Nault, F.; Sík, A.; De Koninck, P.; De Koninck, Y. Trans-synaptic shift in anion gradient in spinal lamina I neurons as a mechanism of neuropathic pain. Nature 2003, 424, 938–942. [Google Scholar] [CrossRef] [PubMed]
- Darlington, C.L.; Smith, P.F. Molecular mechanisms of recovery from vestibular damage in mammals: Recent advances. Prog. Neurobiol. 2000, 62, 313–325. [Google Scholar] [CrossRef]
- Smith, P.F.; Curthoys, I.S. Mechanisms of recovery following unilateral labyrinthectomy: A review. Brain Res. Rev. 1989, 14, 155–180. [Google Scholar] [CrossRef]
- Bos, R.; Sadlaoud, K.; Boulenguez, P.; Buttigieg, D.; Liabeuf, S.; Brocard, C.; Haase, G.; Bras, H.; Vinay, L. Activation of 5-HT2A receptors upregulates the function of the neuronal K-Cl cotransporter KCC2. Proc. Natl. Acad. Sci. USA 2012, 110, 348–353. [Google Scholar] [CrossRef] [PubMed]
- Goulton, C.S.; Watanabe, M.; Cheung, D.L.; Wang, K.W.; Oba, T.; Khoshaba, A.; Lai, D.; Inada, H.; Eto, K.; Nakamura, K.; et al. Conditional Upregulation of KCC2 Selectively Enhances Neuronal Inhibition during Seizures. bioRxiv 2018, 253831. [Google Scholar] [CrossRef]
- Moore, Y.E.; Deeb, T.Z.; Chadchankar, H.; Brandon, N.J.; Moss, S.J. Potentiating KCC2 activity is sufficient to limit the onset and severity of seizures. Proc. Natl. Acad. Sci. USA 2018, 115, 10166–10171. [Google Scholar] [CrossRef]
- Coull, J.A.M.; Beggs, S.; Boudreau, D.; Boivin, D.; Tsuda, M.; Inoue, K.; Gravel, C.; Salter, M.W.; De Koninck, Y. BDNF from microglia causes the shift in neuronal anion gradient underlying neuropathic pain. Nature 2005, 438, 1017–1021. [Google Scholar] [CrossRef]
- Ferrini, F.; De Koninck, Y. Microglia Control Neuronal Network Excitability via BDNF Signalling. Neural Plast. 2013, 2013, 429815. [Google Scholar] [CrossRef]
- Rivera, C.; Li, H.; Thomas-Crusells, J.; Lahtinen, H.; Viitanen, T.; Nanobashvili, A.; Kokaia, Z.; Airaksinen, M.S.; Voipio, J.; Kaila, K.; et al. BDNF-induced TrkB activation down-regulates the K+–Cl− cotransporter KCC2 and impairs neuronal Cl− extrusion. J. Cell Biol. 2002, 159, 747–752. [Google Scholar] [CrossRef]
- Matrisciano, F.; Nasca, C.; Molinaro, G.; Riozzi, B.; Scaccianoce, S.; Raggi, M.; Mercolini, L.; Biagioni, F.; Mathè, A.; Sanna, E.; et al. Enhanced expression of the neuronal K+/Cl− cotransporter, KCC2, in spontaneously depressed Flinders Sensitive Line rats. Brain Res. 2010, 1325, 112–120. [Google Scholar] [CrossRef]
- Karlócai, M.R.; Wittner, L.; Tóth, K.; Maglóczky, Z.; Katarova, Z.; Rásonyi, G.; Erőss, L.; Czirják, S.; Halász, P.; Szabó, G.; et al. Enhanced expression of potassium-chloride cotransporter KCC2 in human temporal lobe epilepsy. Anat. Embryol. 2015, 221, 3601–3615. [Google Scholar] [CrossRef] [PubMed]
- Galic, M.A.; Riazi, K.; Pittman, Q.J. Cytokines and brain excitability. Front. Neuroendocr. 2012, 33, 116–125. [Google Scholar] [CrossRef] [PubMed]
- Cameron, S.A.; Dutia, M.B. Lesion-induced plasticity in rat vestibular nucleus neurones dependent on glucocorticoid receptor activation. J. Physiol. 1999, 518, 151–158. [Google Scholar] [CrossRef] [PubMed]
- Numakawa, T.; Kumamaru, E.; Adachi, N.; Yagasaki, Y.; Izumi, A.; Kunugi, H. Glucocorticoid receptor interaction with TrkB promotes BDNF-triggered PLC-γ signaling for glutamate release via a glutamate transporter. Proc. Natl. Acad. Sci. USA 2009, 106, 647–652. [Google Scholar] [CrossRef]
- Park, M.-J.; Yeo, H.-L.; You, M.-J.; Kim, B.; Kwon, M.-S. PSPersistent glucocorticoid receptor activation reduces M2-like microglia phenotypes without inflammatory signaling. Int. J. Neuropsychopharmacol. 2016, 19, 75–76. [Google Scholar] [CrossRef]
- Dutheil, S.; Escoffier, G.; Gharbi, A.; Watabe, I.; Tighilet, B. GABAA Receptor Agonist and Antagonist Alter Vestibular Compensation and Different Steps of Reactive Neurogenesis in Deafferented Vestibular Nuclei of Adult Cats. J. Neurosci. 2013, 33, 15555–15566. [Google Scholar] [CrossRef]
- Zwergal, A.; Schlichtiger, J.; Xiong, G.; Beck, R.; Günther, L.; Schniepp, R.; Schöberl, F.; Jahn, K.; Brandt, T.; Strupp, M.; et al. Sequential [18F]FDG µPET whole-brain imaging of central vestibular compensation: A model of deafferentation-induced brain plasticity. Anat. Embryol. 2014, 221, 159–170. [Google Scholar] [CrossRef]
- Rastoldo, G.; Marouane, E.; El-Mahmoudi, N.; Péricat, D.; Watabe, I.; Lapotre, A.; Tonetto, A.; López-Juárez, A.; El-Ahmadi, A.; Caron, P.; et al. L-Thyroxine Improves Vestibular Compensation in a Rat Model of Acute Peripheral Vestibulopathy: Cellular and Behavioral Aspects. Cells 2022, 11, 684. [Google Scholar] [CrossRef]
- Kassner, S.S.; Schöttler, S.; Bonaterra, G.A.; Stern-Straeter, J.; Hormann, K.; Kinscherf, R.; Gössler, U.R. Proinflammatory Activation of Peripheral Blood Mononuclear Cells in Patients with Vestibular Neuritis. Audiol. Neurotol. 2010, 16, 242–247. [Google Scholar] [CrossRef]
- Anson, E.; Jeka, J. Perspectives on Aging Vestibular Function. Front. Neurol. 2016, 6, 269. [Google Scholar] [CrossRef]
- Brosel, S.; Laub, C.; Averdam, A.; Bender, A.; Elstner, M. Molecular aging of the mammalian vestibular system. Ageing Res. Rev. 2016, 26, 72–80. [Google Scholar] [CrossRef] [PubMed]
- Cassel, R.; Wiener-Vacher, S.; El Ahmadi, A.; Tighilet, B.; Chabbert, C. Reduced Balance Restoration Capacities Following Unilateral Vestibular Insult in Elderly Mice. Front. Neurol. 2018, 9, 462. [Google Scholar] [CrossRef] [PubMed]
- Filippodragoa, F.; Lucianonardoa, L.; Liboriorampellob, L.; Roccoraffaeleb, R. Vestibular compensation in aged rats with unilateral labyrinthectomy treated with dopaminergic drugs. Pharmacol. Res. 1996, 33, 135–140. [Google Scholar] [CrossRef]
- Rampello, L.; Drago, F. Nicergoline facilitates vestibular compensation in aged male rats with unilateral labyrinthectomy. Neurosci. Lett. 1999, 267, 93–96. [Google Scholar] [CrossRef]
- Scheltinga, A.; Honegger, F.; Timmermans, D.P.H.; Allum, J.H.J. The Effect of Age on Improvements in Vestibulo-Ocular Reflexes and Balance Control after Acute Unilateral Peripheral Vestibular Loss. Front. Neurol. 2016, 7, 18. [Google Scholar] [CrossRef][Green Version]
- Spittau, B. Aging Microglia—Phenotypes, Functions and Implications for Age-Related Neurodegenerative Diseases. Front. Aging Neurosci. 2017, 9, 194. [Google Scholar] [CrossRef]
- Fenn, A.M.; Henry, C.J.; Huang, Y.; Dugan, A.; Godbout, J.P. Lipopolysaccharide-induced interleukin (IL)-4 receptor-α expression and corresponding sensitivity to the M2 promoting effects of IL-4 are impaired in microglia of aged mice. Brain Behav. Immun. 2011, 26, 766–777. [Google Scholar] [CrossRef]
- Yao, K.; Zhao, Y.-F. Aging modulates microglia phenotypes in neuroinflammation of MPTP-PD mice. Exp. Gerontol. 2018, 111, 86–93. [Google Scholar] [CrossRef]


Publisher’s Note: MDPI stays neutral with regard to jurisdictional claims in published maps and institutional affiliations. |
© 2022 by the authors. Licensee MDPI, Basel, Switzerland. This article is an open access article distributed under the terms and conditions of the Creative Commons Attribution (CC BY) license (https://creativecommons.org/licenses/by/4.0/).
Share and Cite
El Mahmoudi, N.; Marouane, E.; Rastoldo, G.; Pericat, D.; Watabe, I.; Lapotre, A.; Tonetto, A.; Chabbert, C.; Tighilet, B. Microglial Dynamics Modulate Vestibular Compensation in a Rodent Model of Vestibulopathy and Condition the Expression of Plasticity Mechanisms in the Deafferented Vestibular Nuclei. Cells 2022, 11, 2693. https://doi.org/10.3390/cells11172693
El Mahmoudi N, Marouane E, Rastoldo G, Pericat D, Watabe I, Lapotre A, Tonetto A, Chabbert C, Tighilet B. Microglial Dynamics Modulate Vestibular Compensation in a Rodent Model of Vestibulopathy and Condition the Expression of Plasticity Mechanisms in the Deafferented Vestibular Nuclei. Cells. 2022; 11(17):2693. https://doi.org/10.3390/cells11172693
Chicago/Turabian StyleEl Mahmoudi, Nada, Emna Marouane, Guillaume Rastoldo, David Pericat, Isabelle Watabe, Agnes Lapotre, Alain Tonetto, Christian Chabbert, and Brahim Tighilet. 2022. "Microglial Dynamics Modulate Vestibular Compensation in a Rodent Model of Vestibulopathy and Condition the Expression of Plasticity Mechanisms in the Deafferented Vestibular Nuclei" Cells 11, no. 17: 2693. https://doi.org/10.3390/cells11172693
APA StyleEl Mahmoudi, N., Marouane, E., Rastoldo, G., Pericat, D., Watabe, I., Lapotre, A., Tonetto, A., Chabbert, C., & Tighilet, B. (2022). Microglial Dynamics Modulate Vestibular Compensation in a Rodent Model of Vestibulopathy and Condition the Expression of Plasticity Mechanisms in the Deafferented Vestibular Nuclei. Cells, 11(17), 2693. https://doi.org/10.3390/cells11172693