
Structural Entities Associated with Different Lipid Phases of Plant Thylakoid Membranes—Selective Susceptibilities to Different Lipases and Proteases

 , , , , ,
  , , , ,
Abstract
1. Introduction
2. Materials and Methods
2.1. Isolation of Thylakoid Membranes
2.2. Isolation of Plastoglobuli
2.3. Enzymatic Treatments
2.4. 31P-NMR Measurements
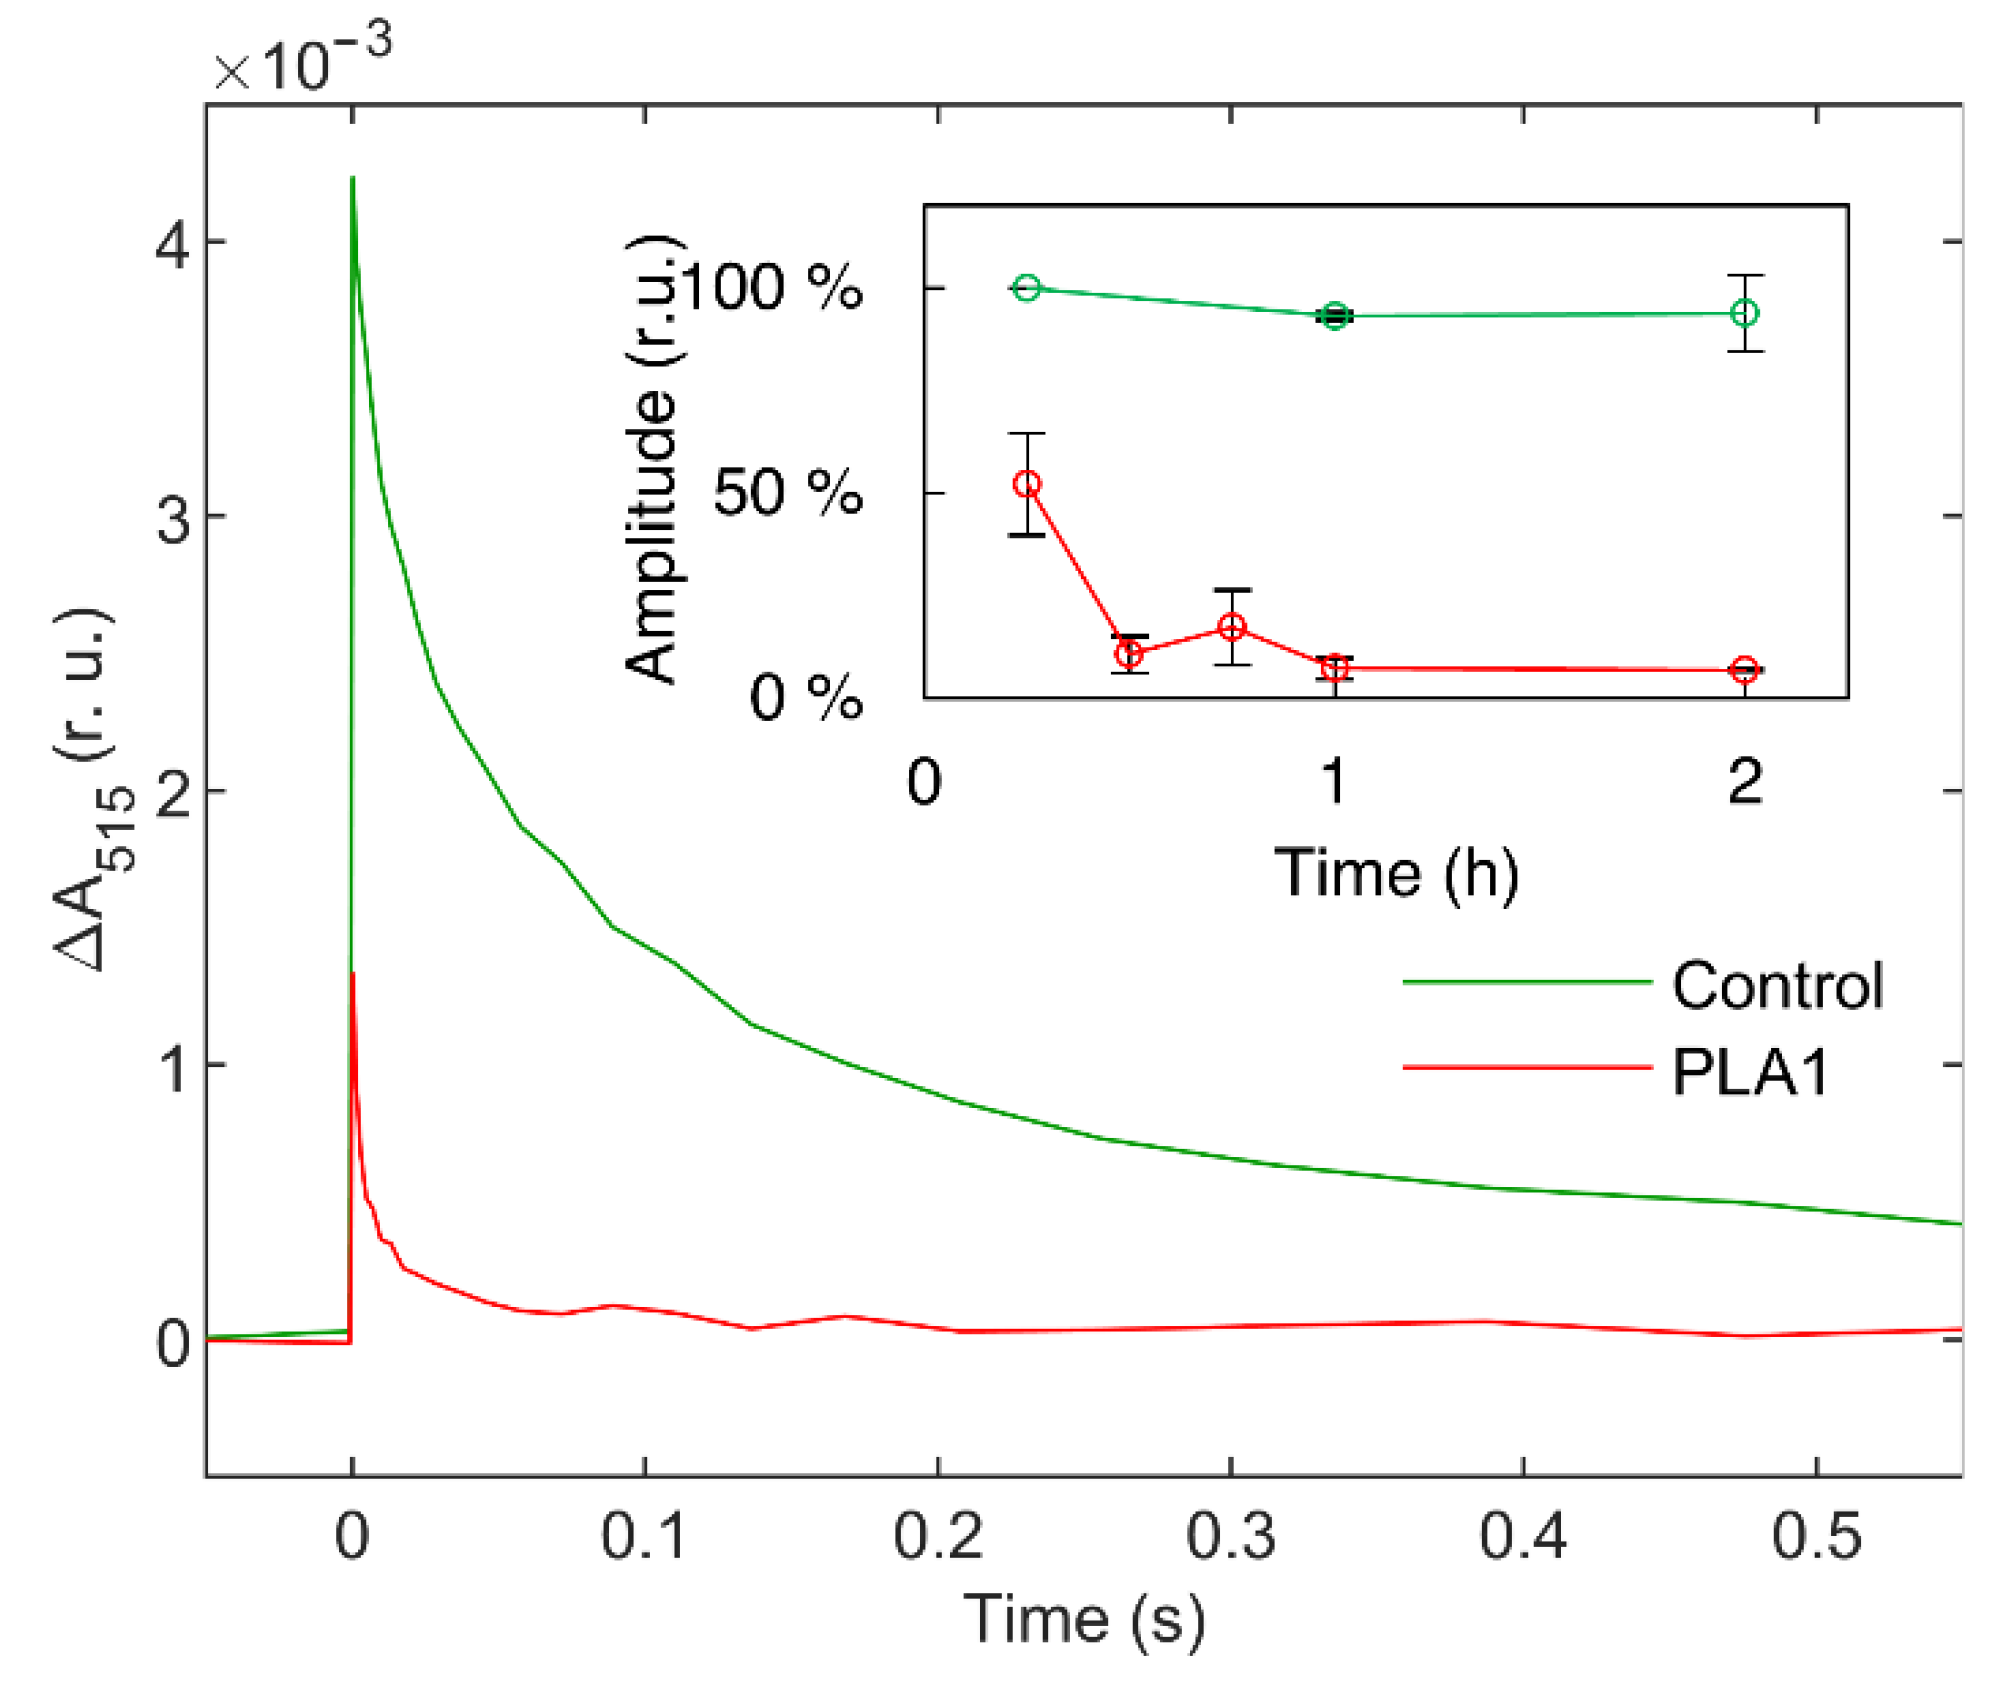
2.5. Electrochromic Shift Absorbance Transients (ΔA515)
2.6. Circular-Dichroism Spectroscopy
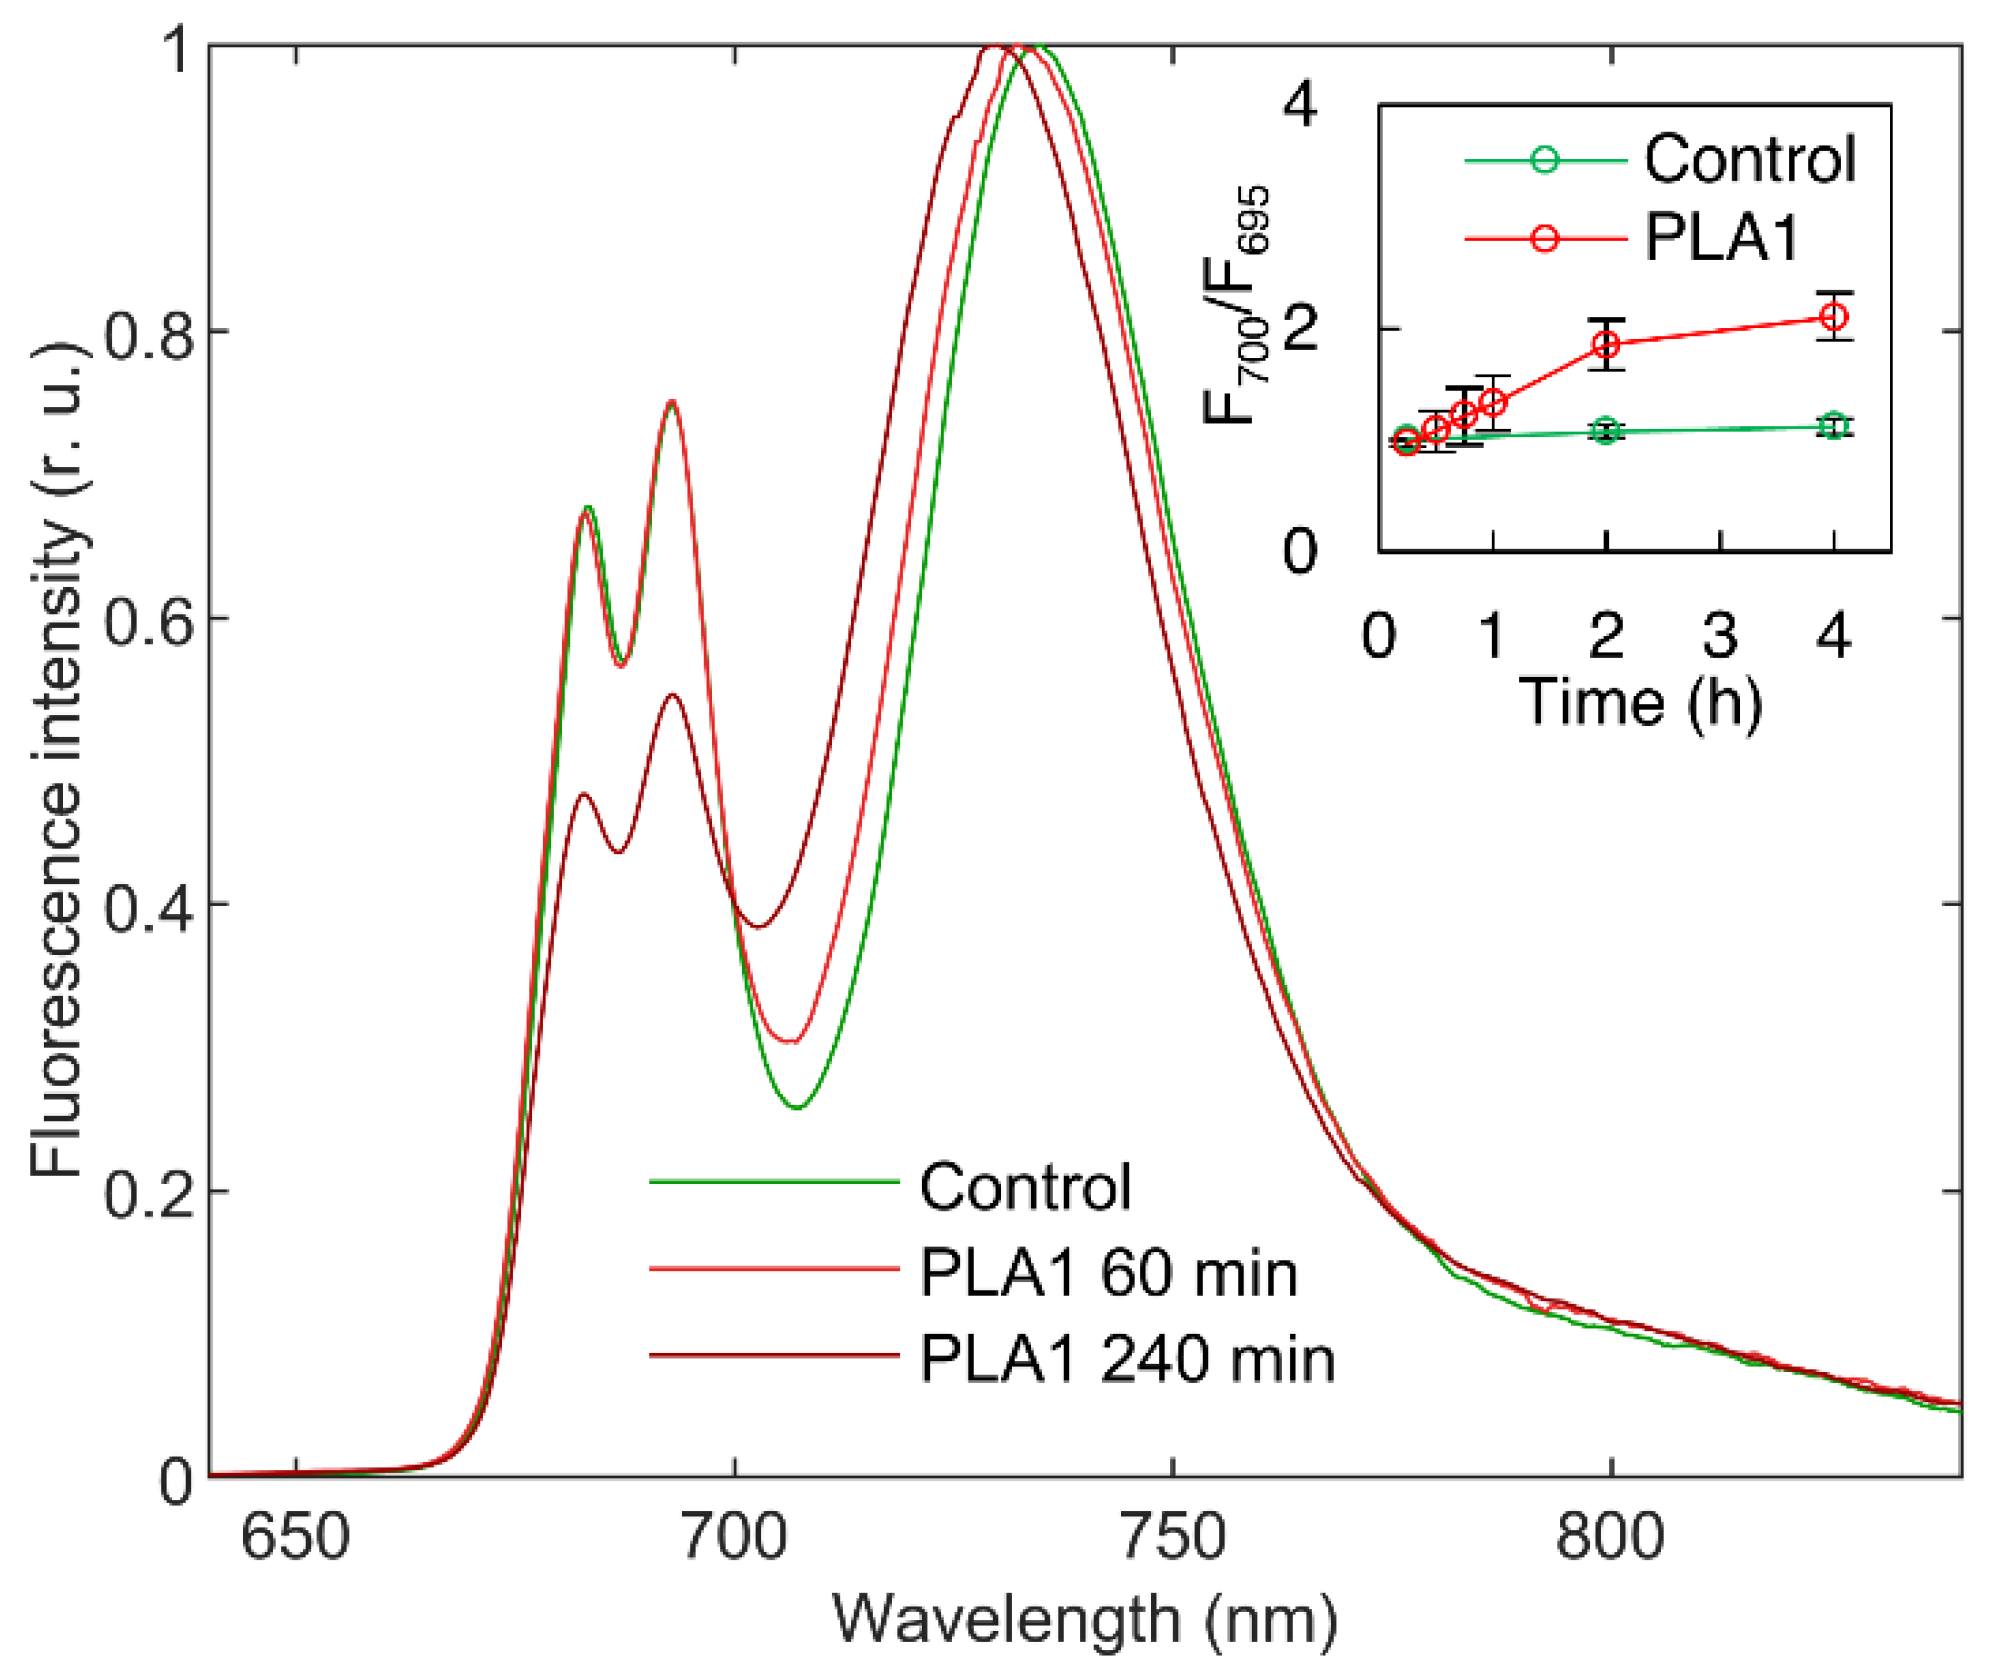
2.7. Chl-a Fluorescence Spectroscopy at 77 K
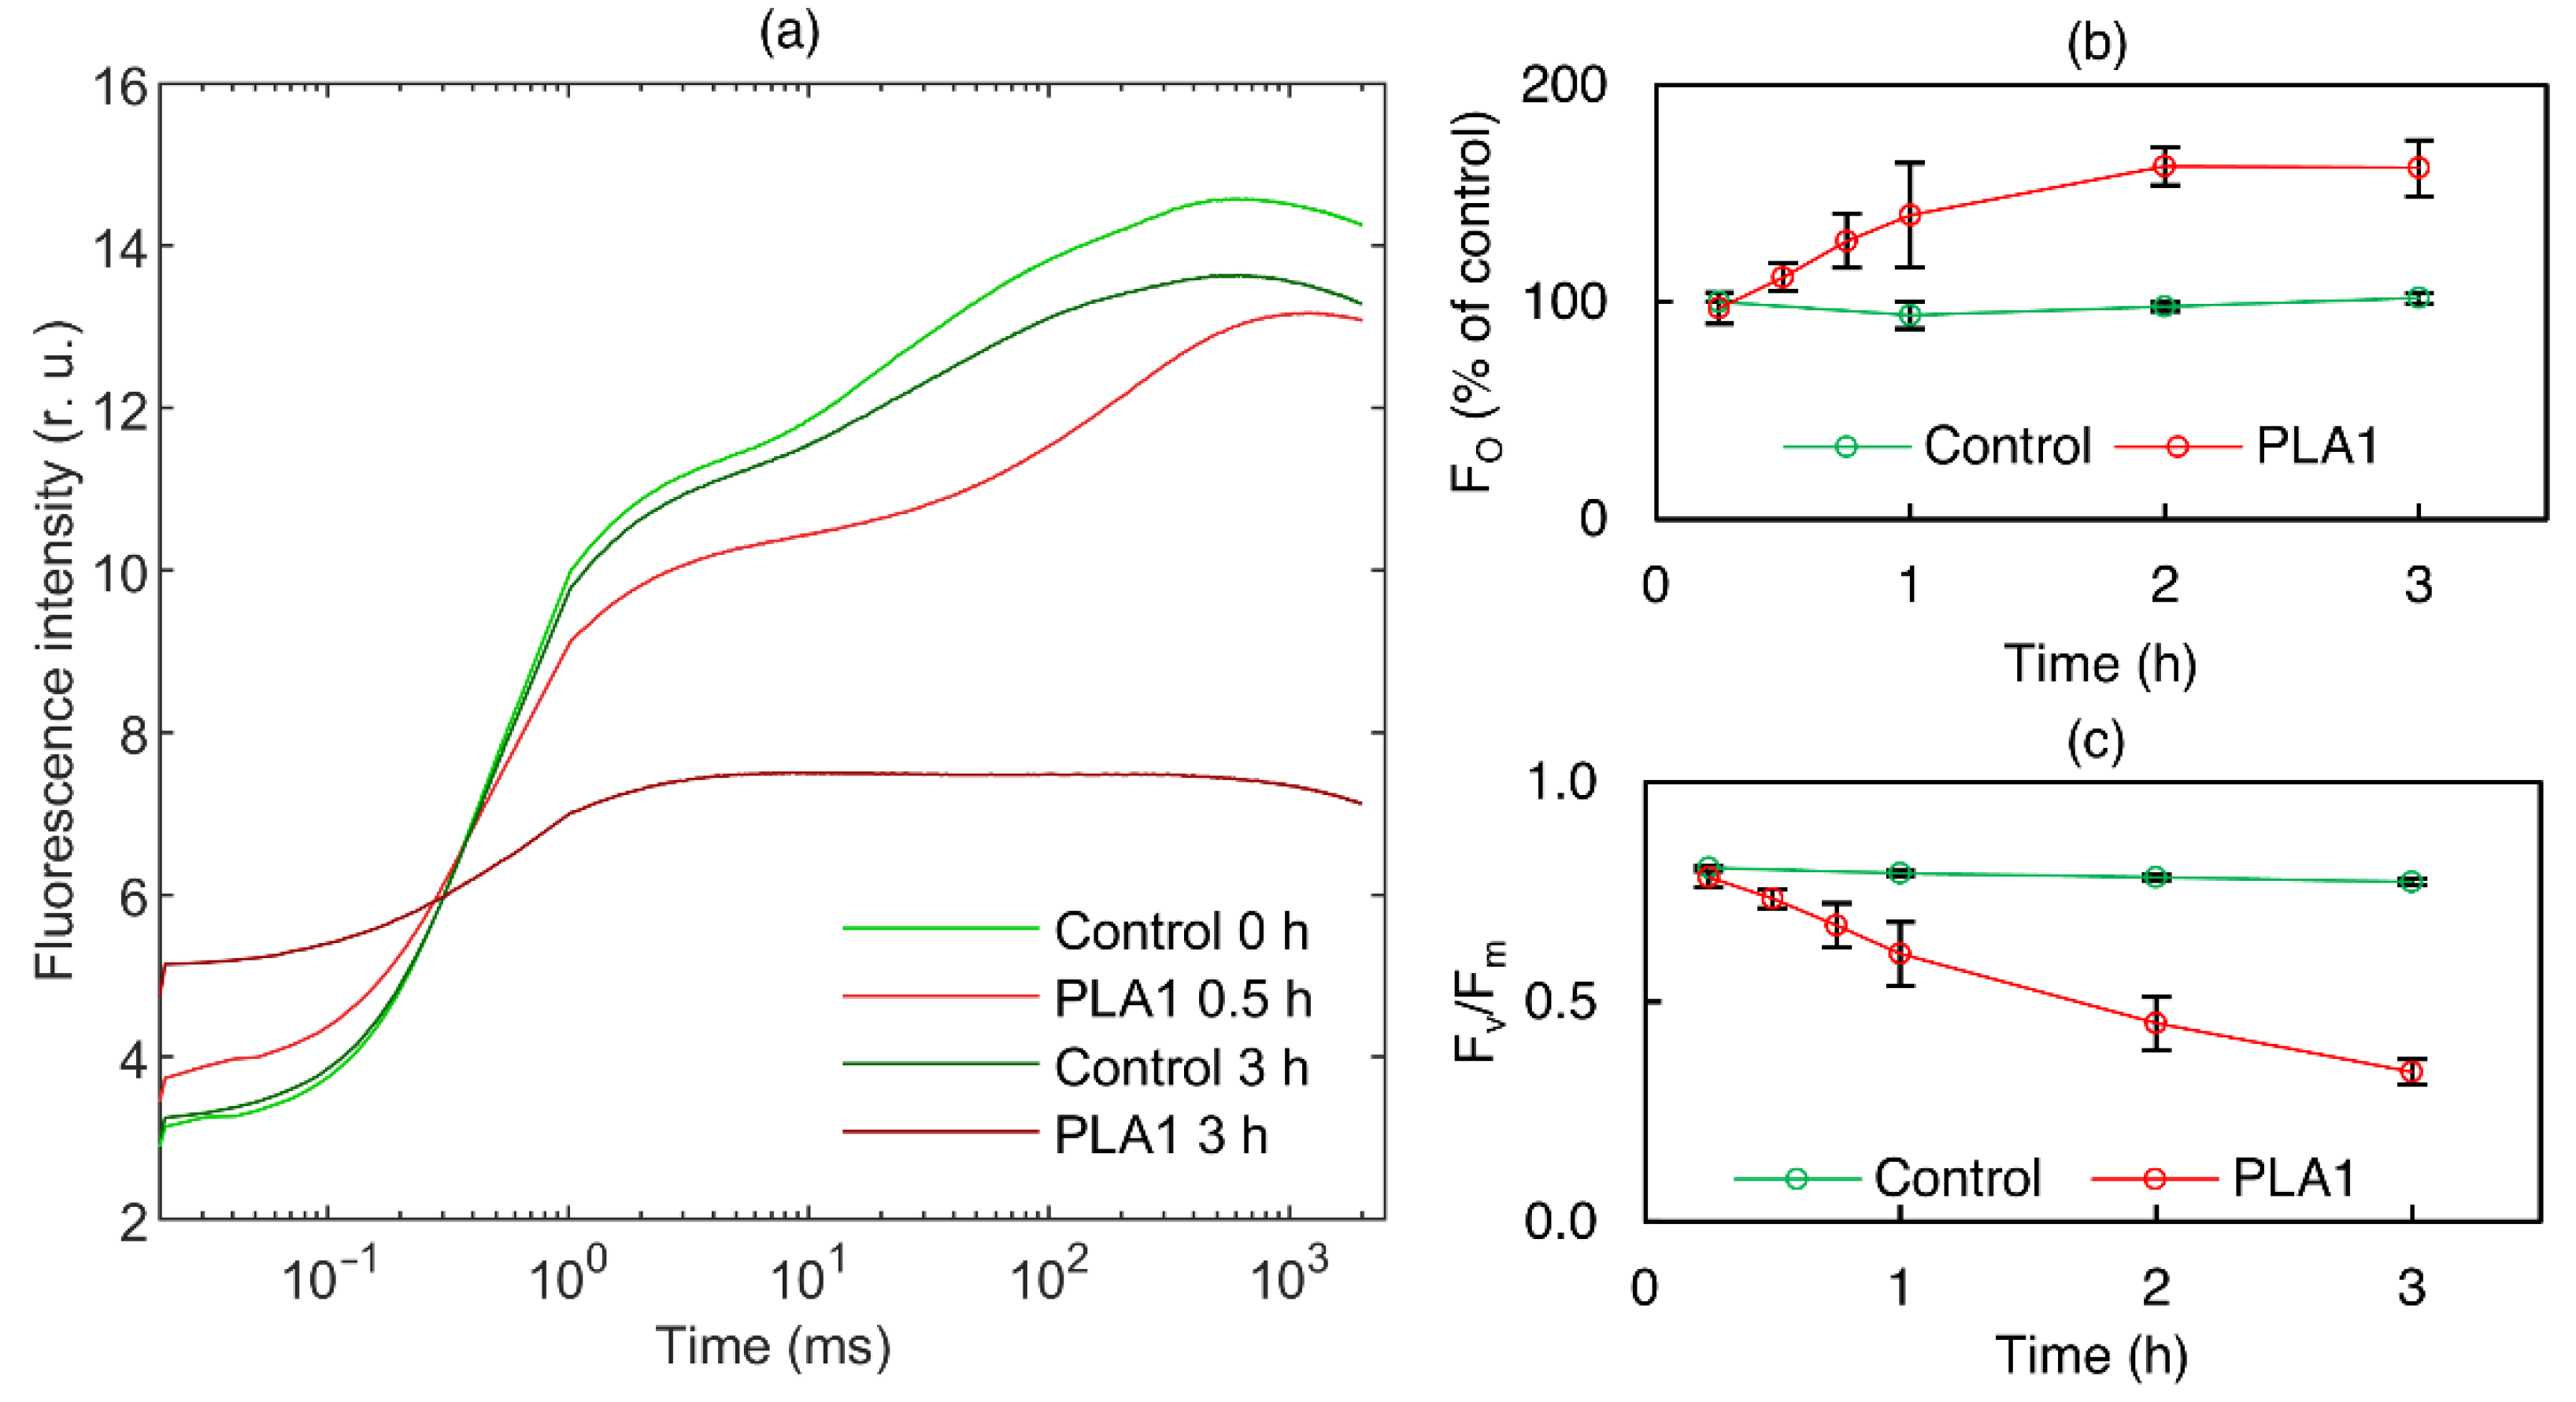
2.8. Fast Chl-a Fluorescence (OJIP) Transients
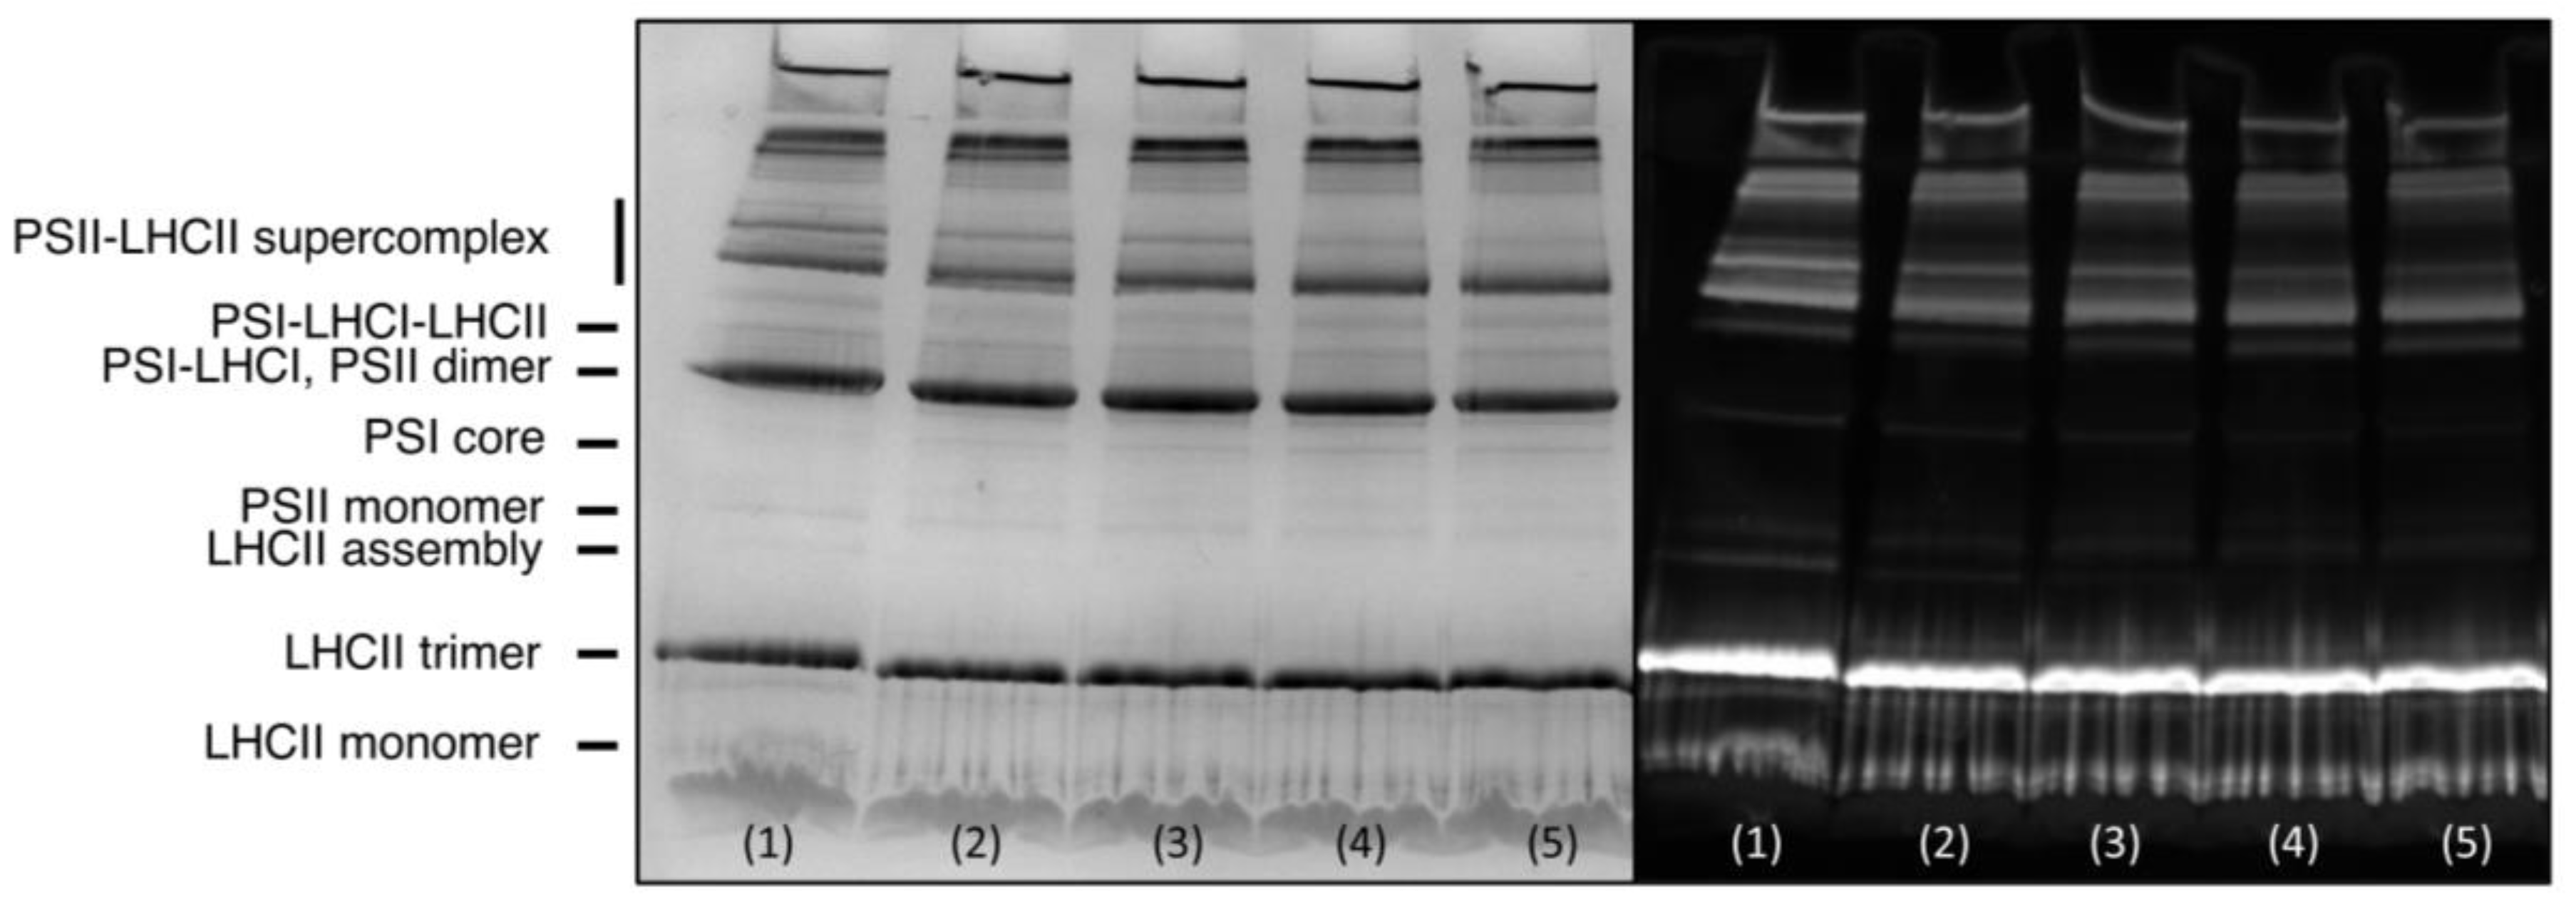
2.9. CN-PAGE
3. Results and Discussion
3.1. Effects of Lipases
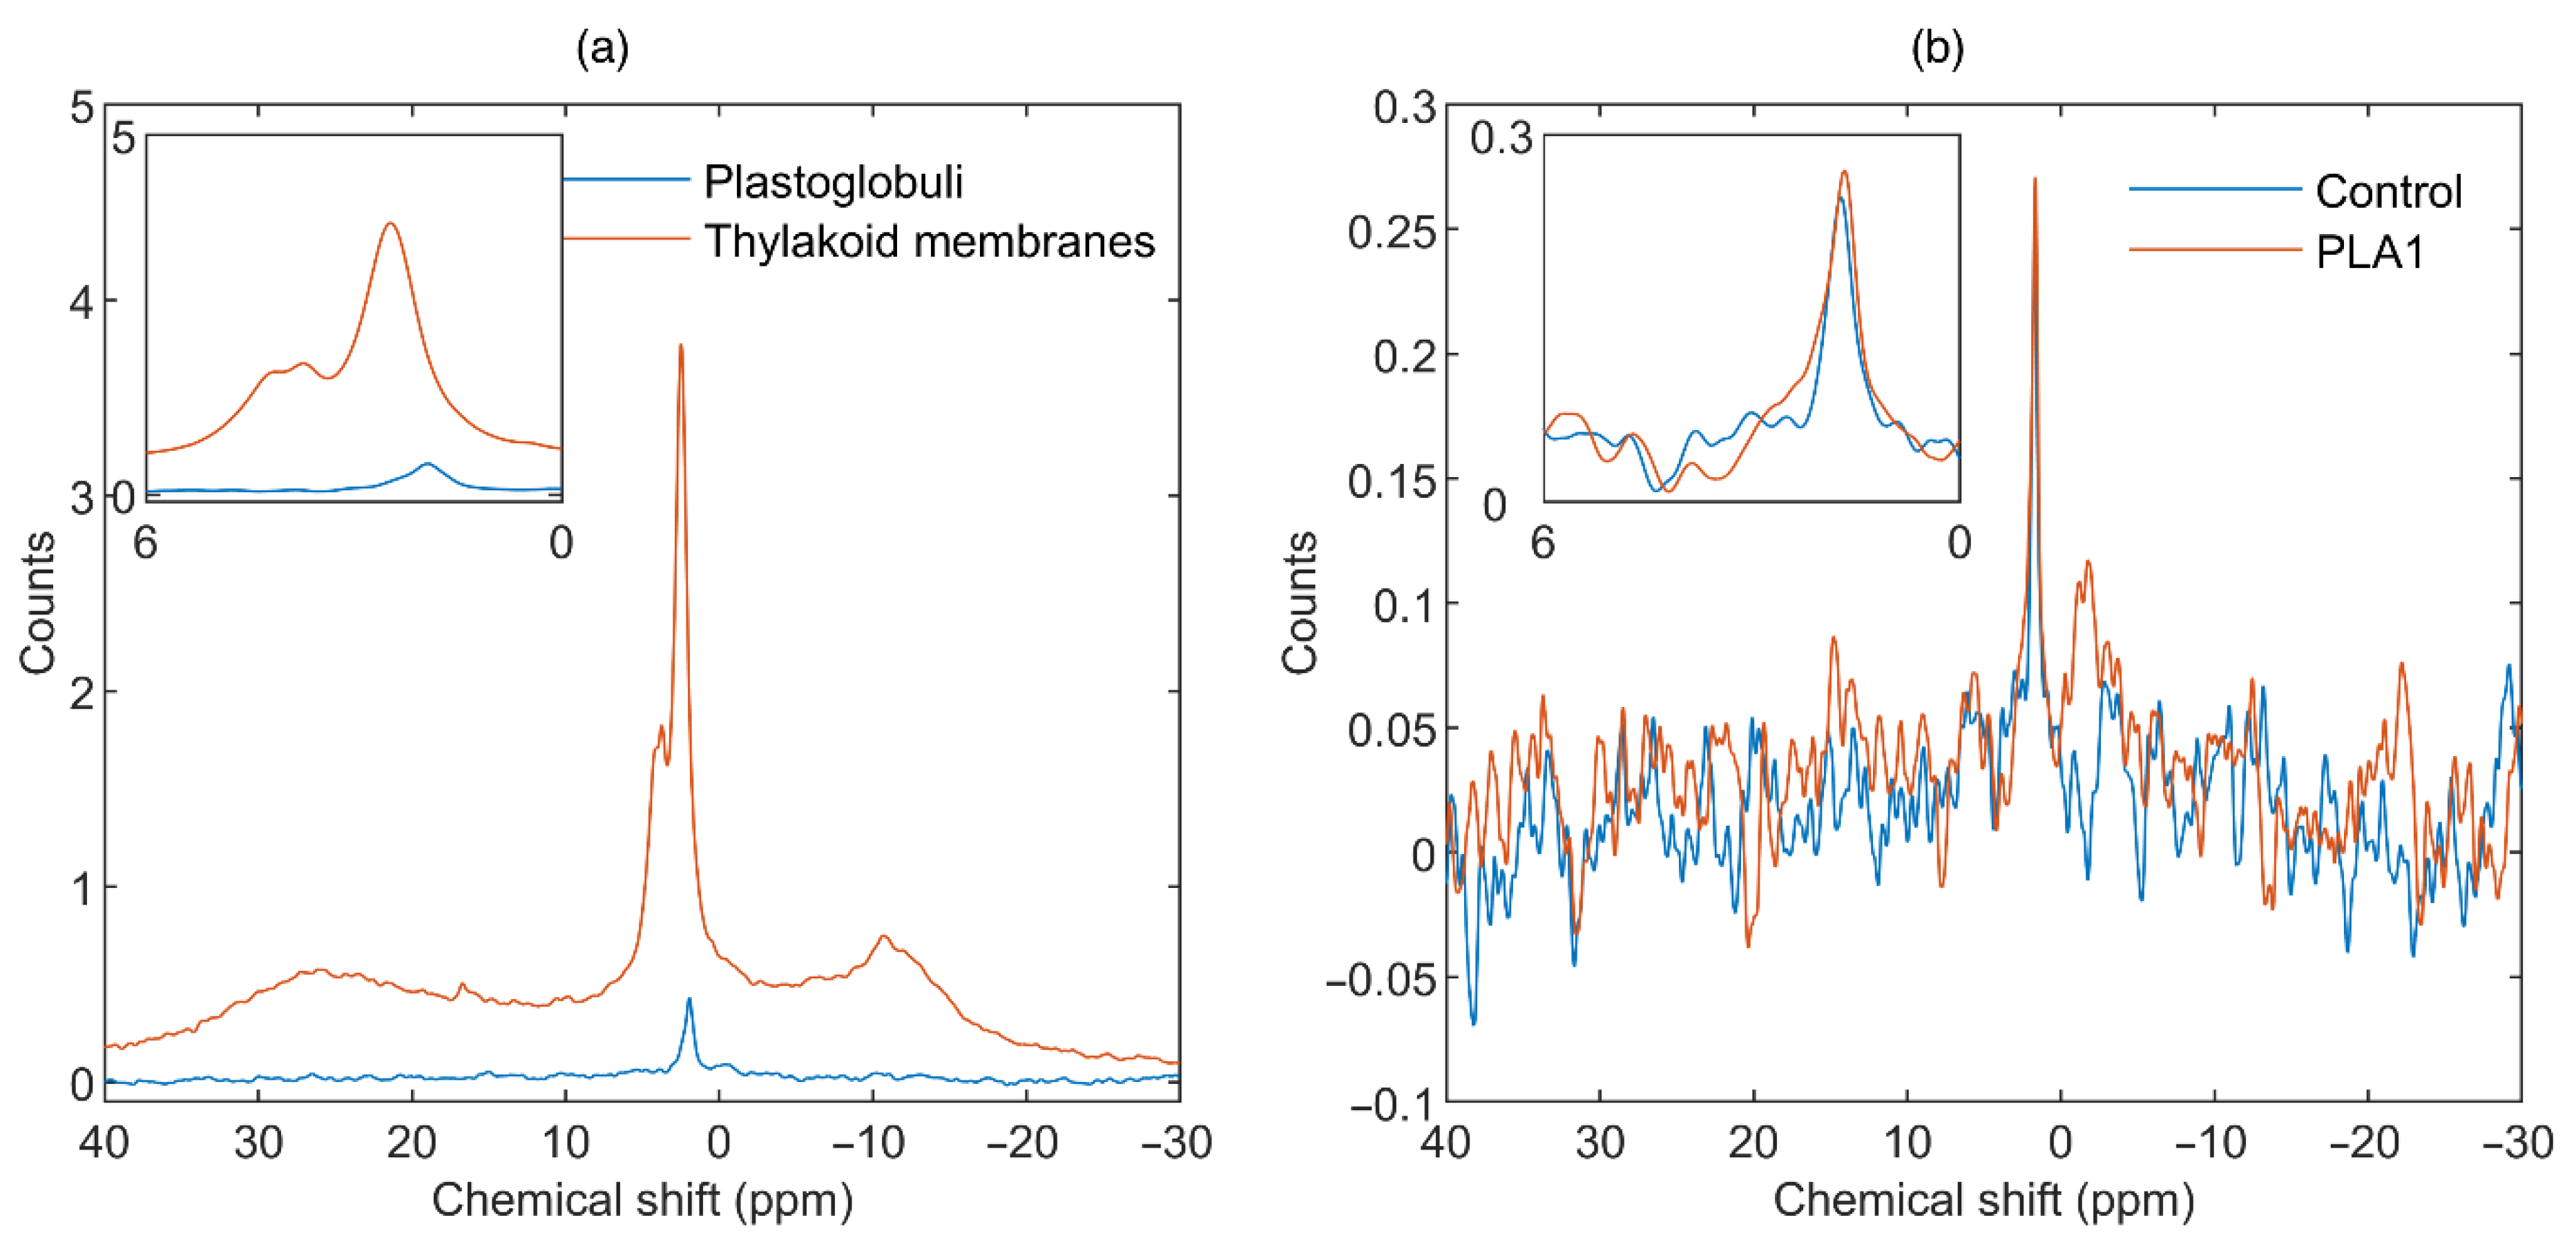
3.1.1. Phospholipase A1
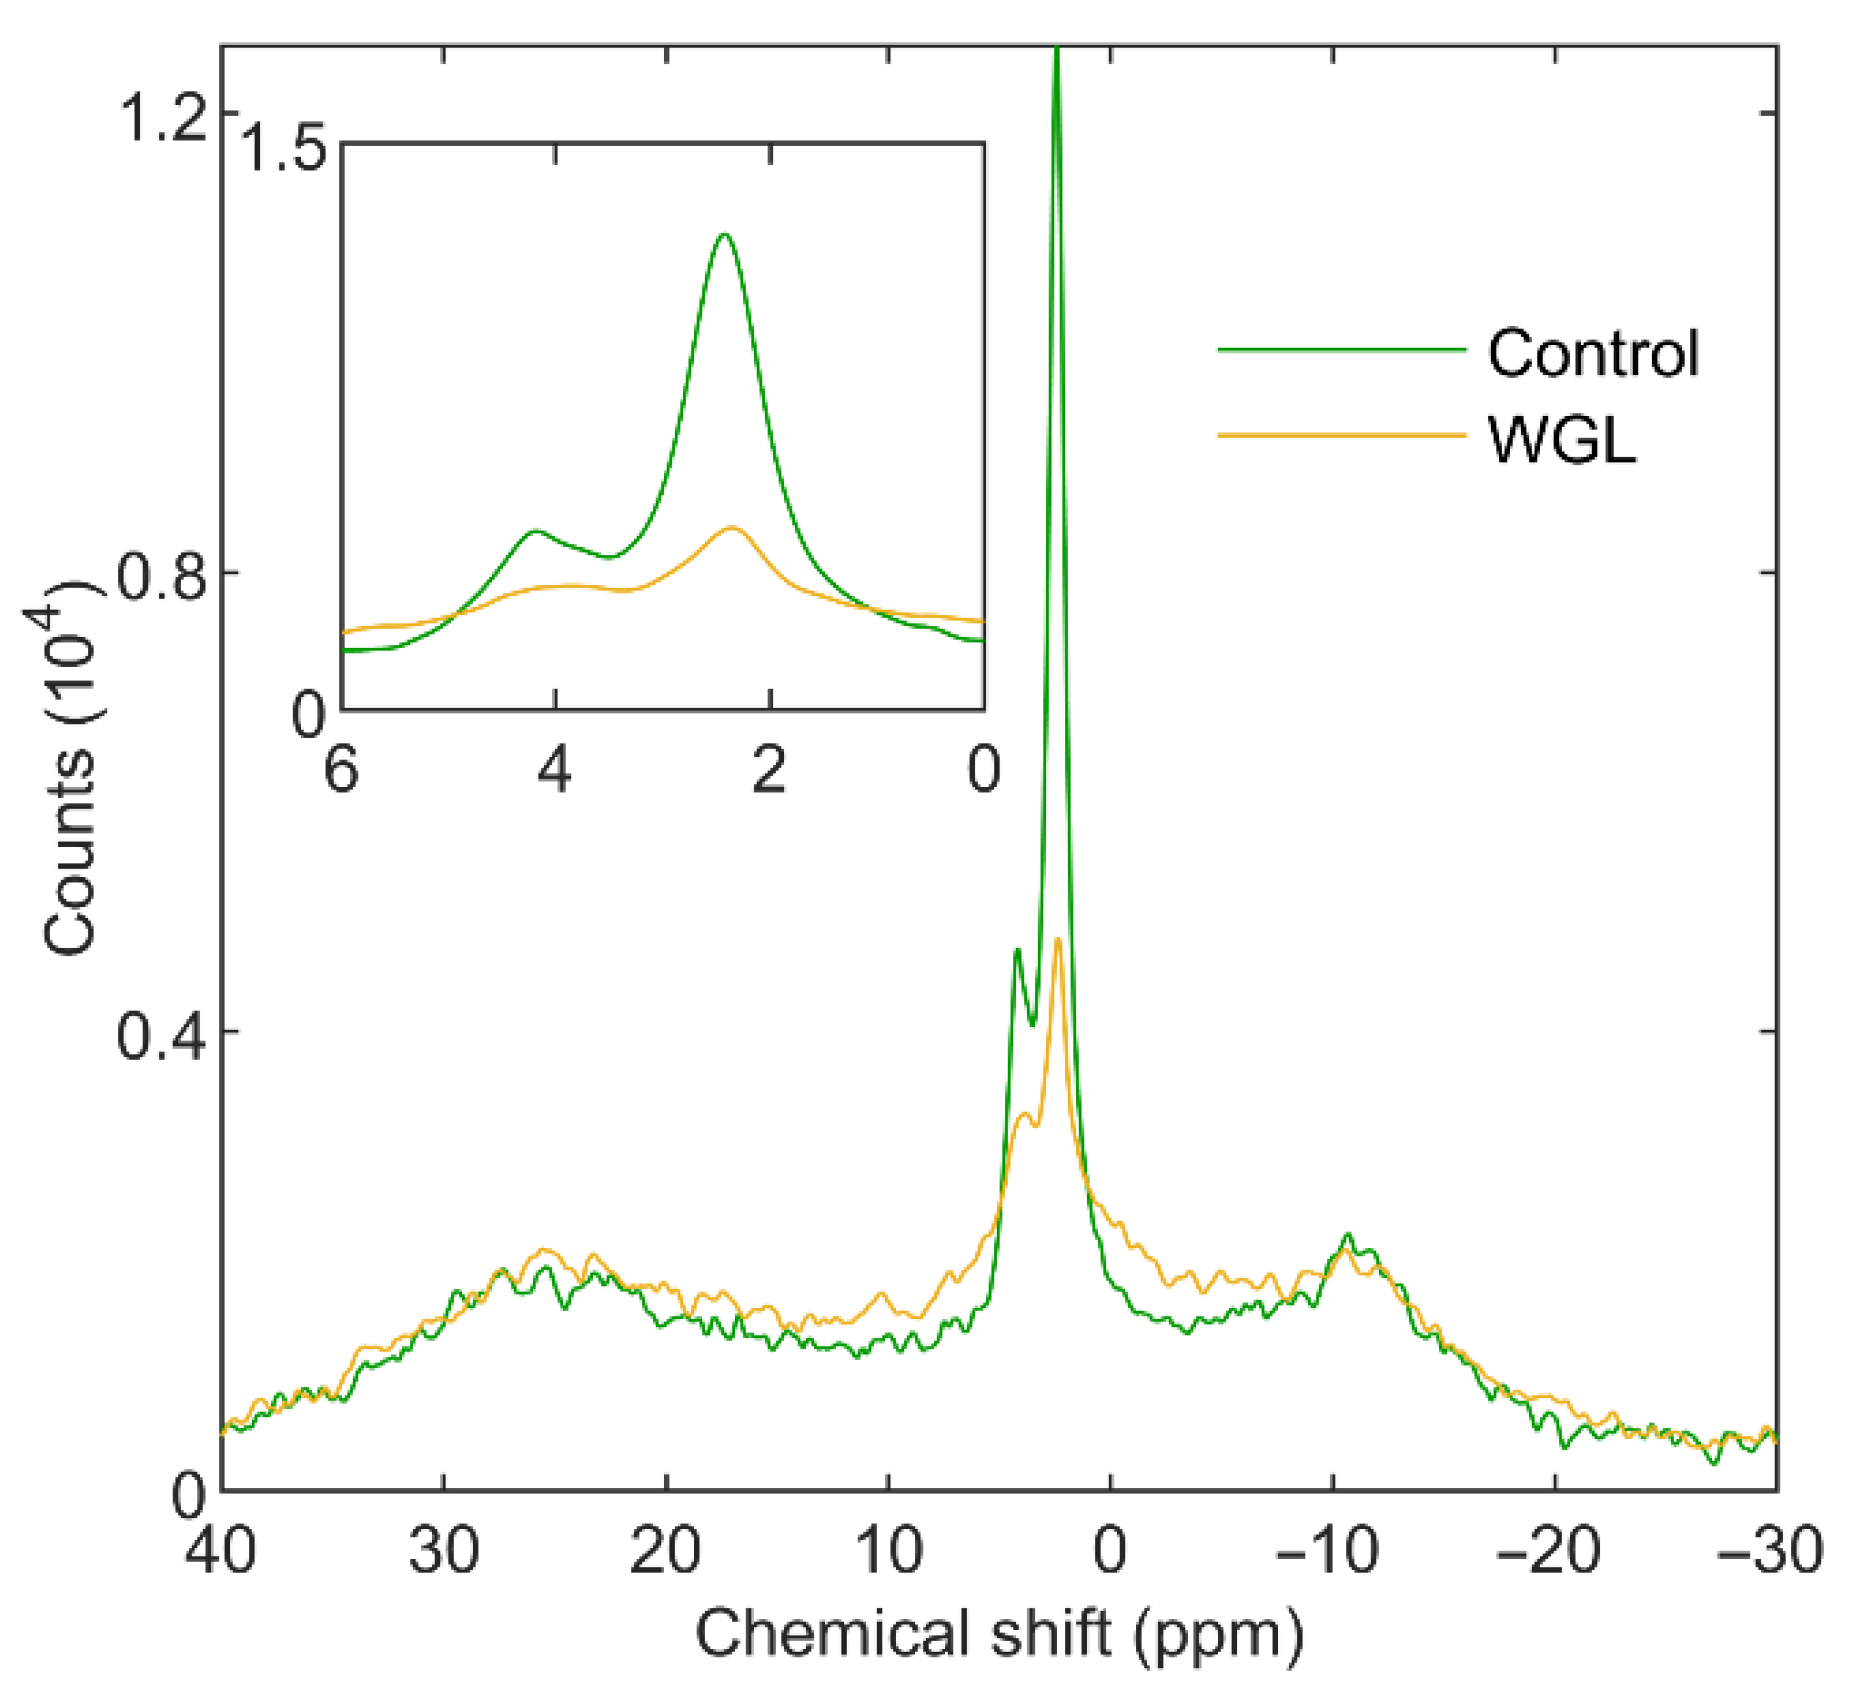
3.1.2. Wheat-Germ Lipase
3.2. Contributions from Plastoglobuli
3.3. Effects of Proteases
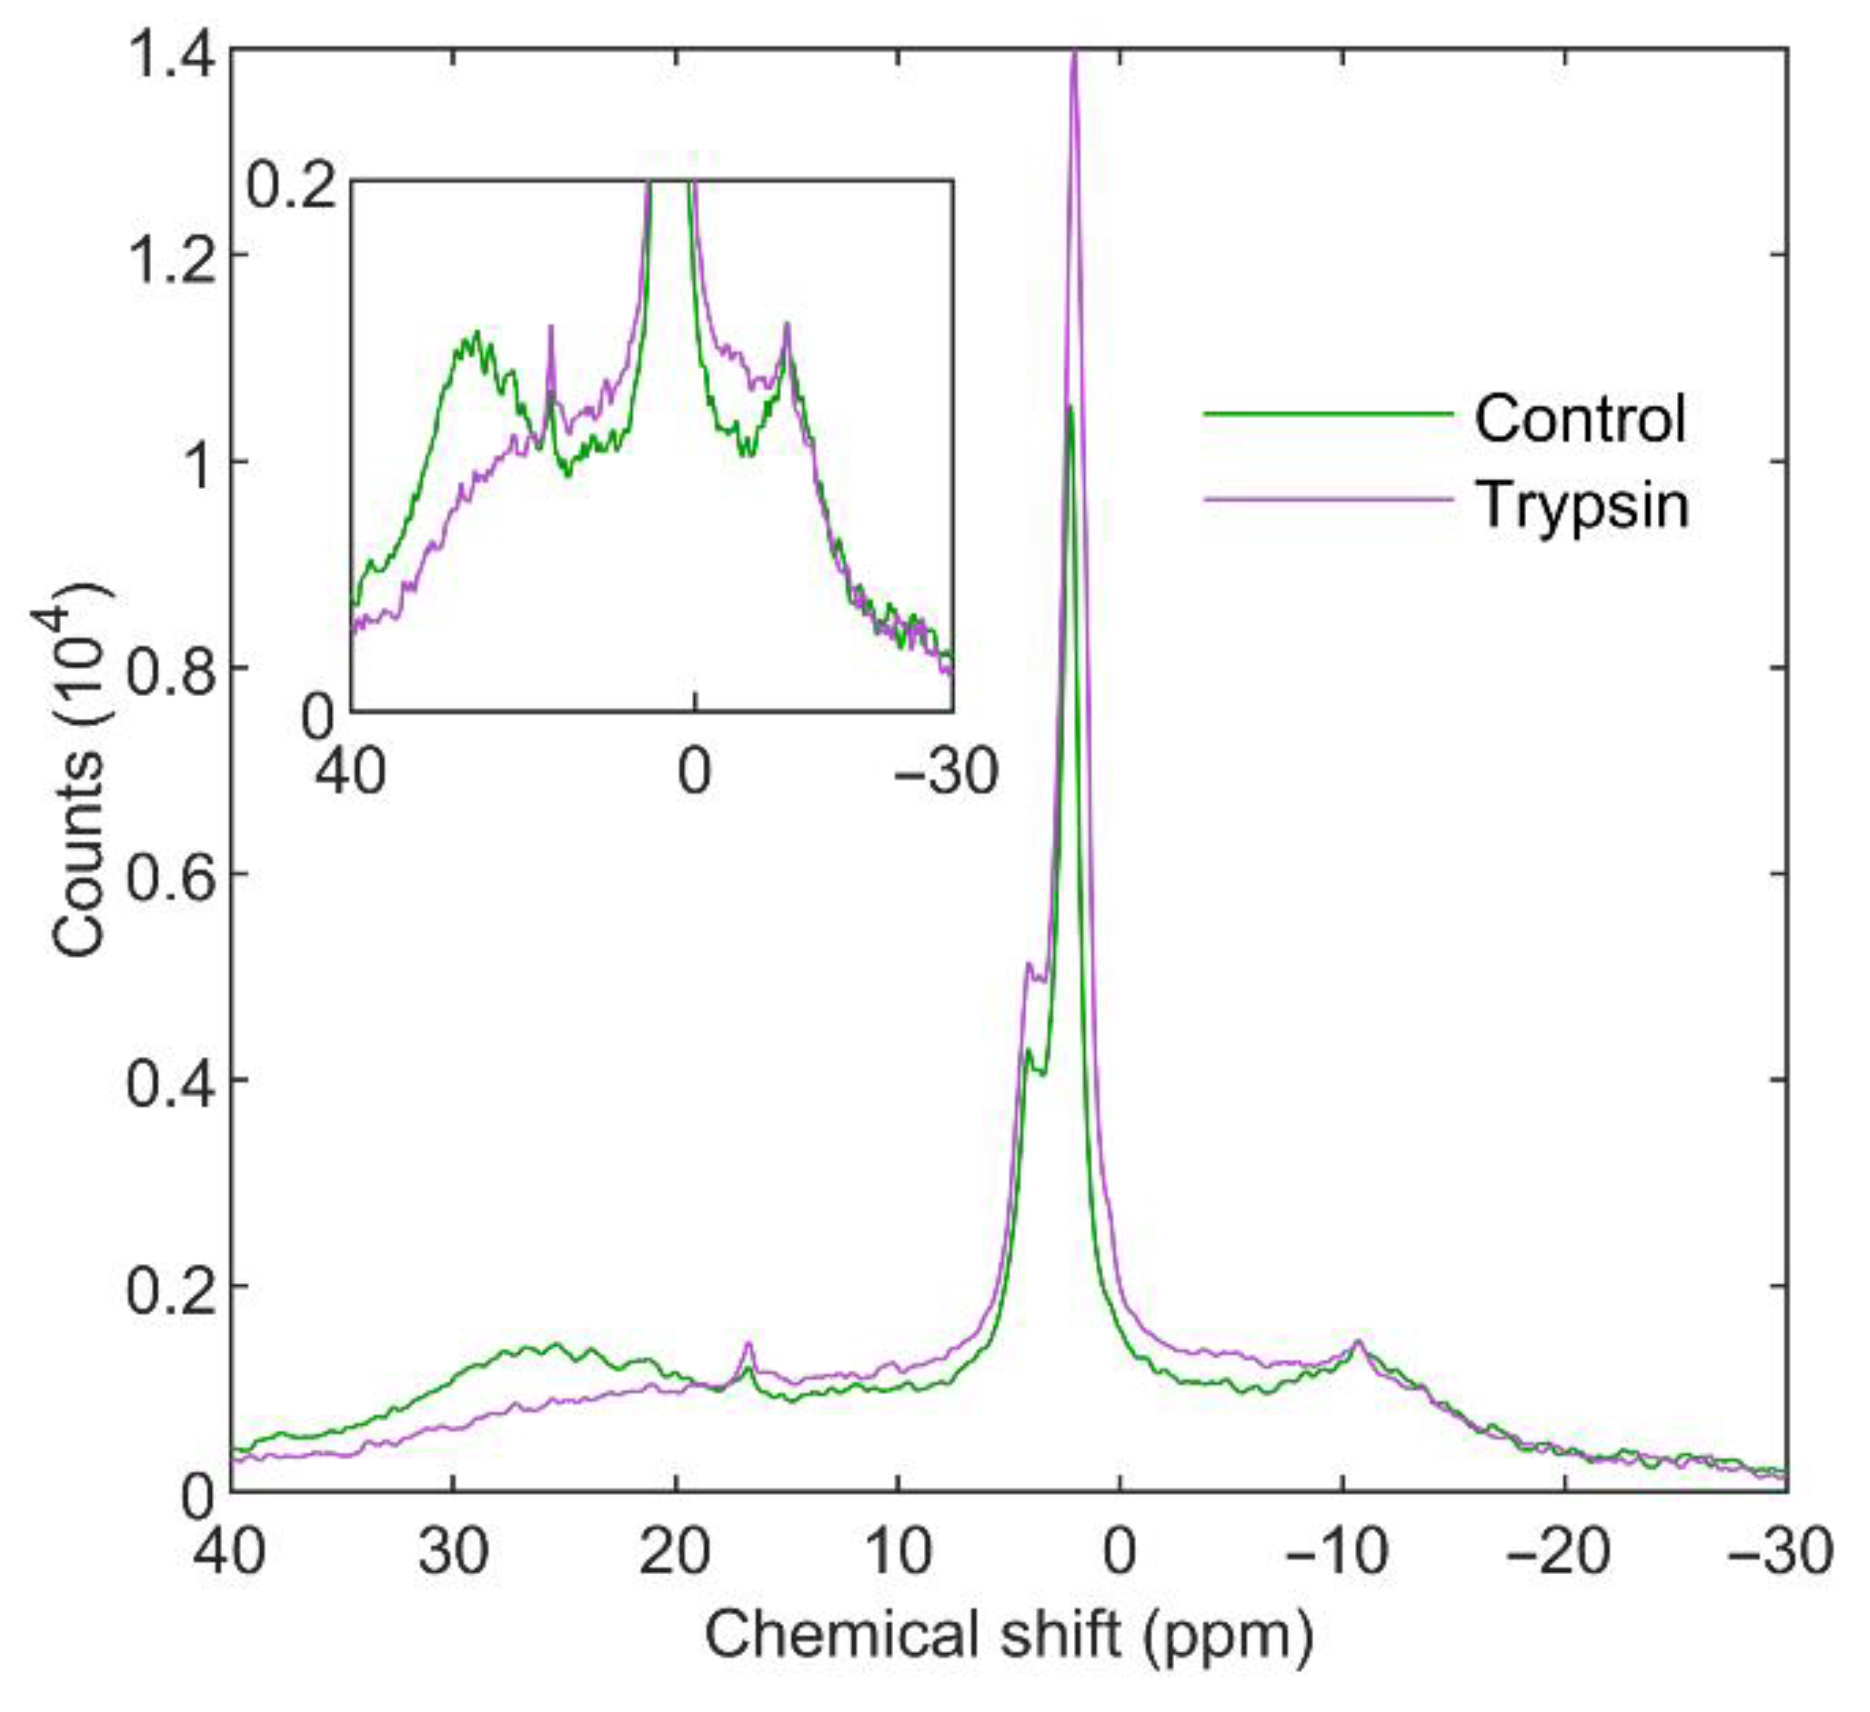
3.3.1. Trypsin
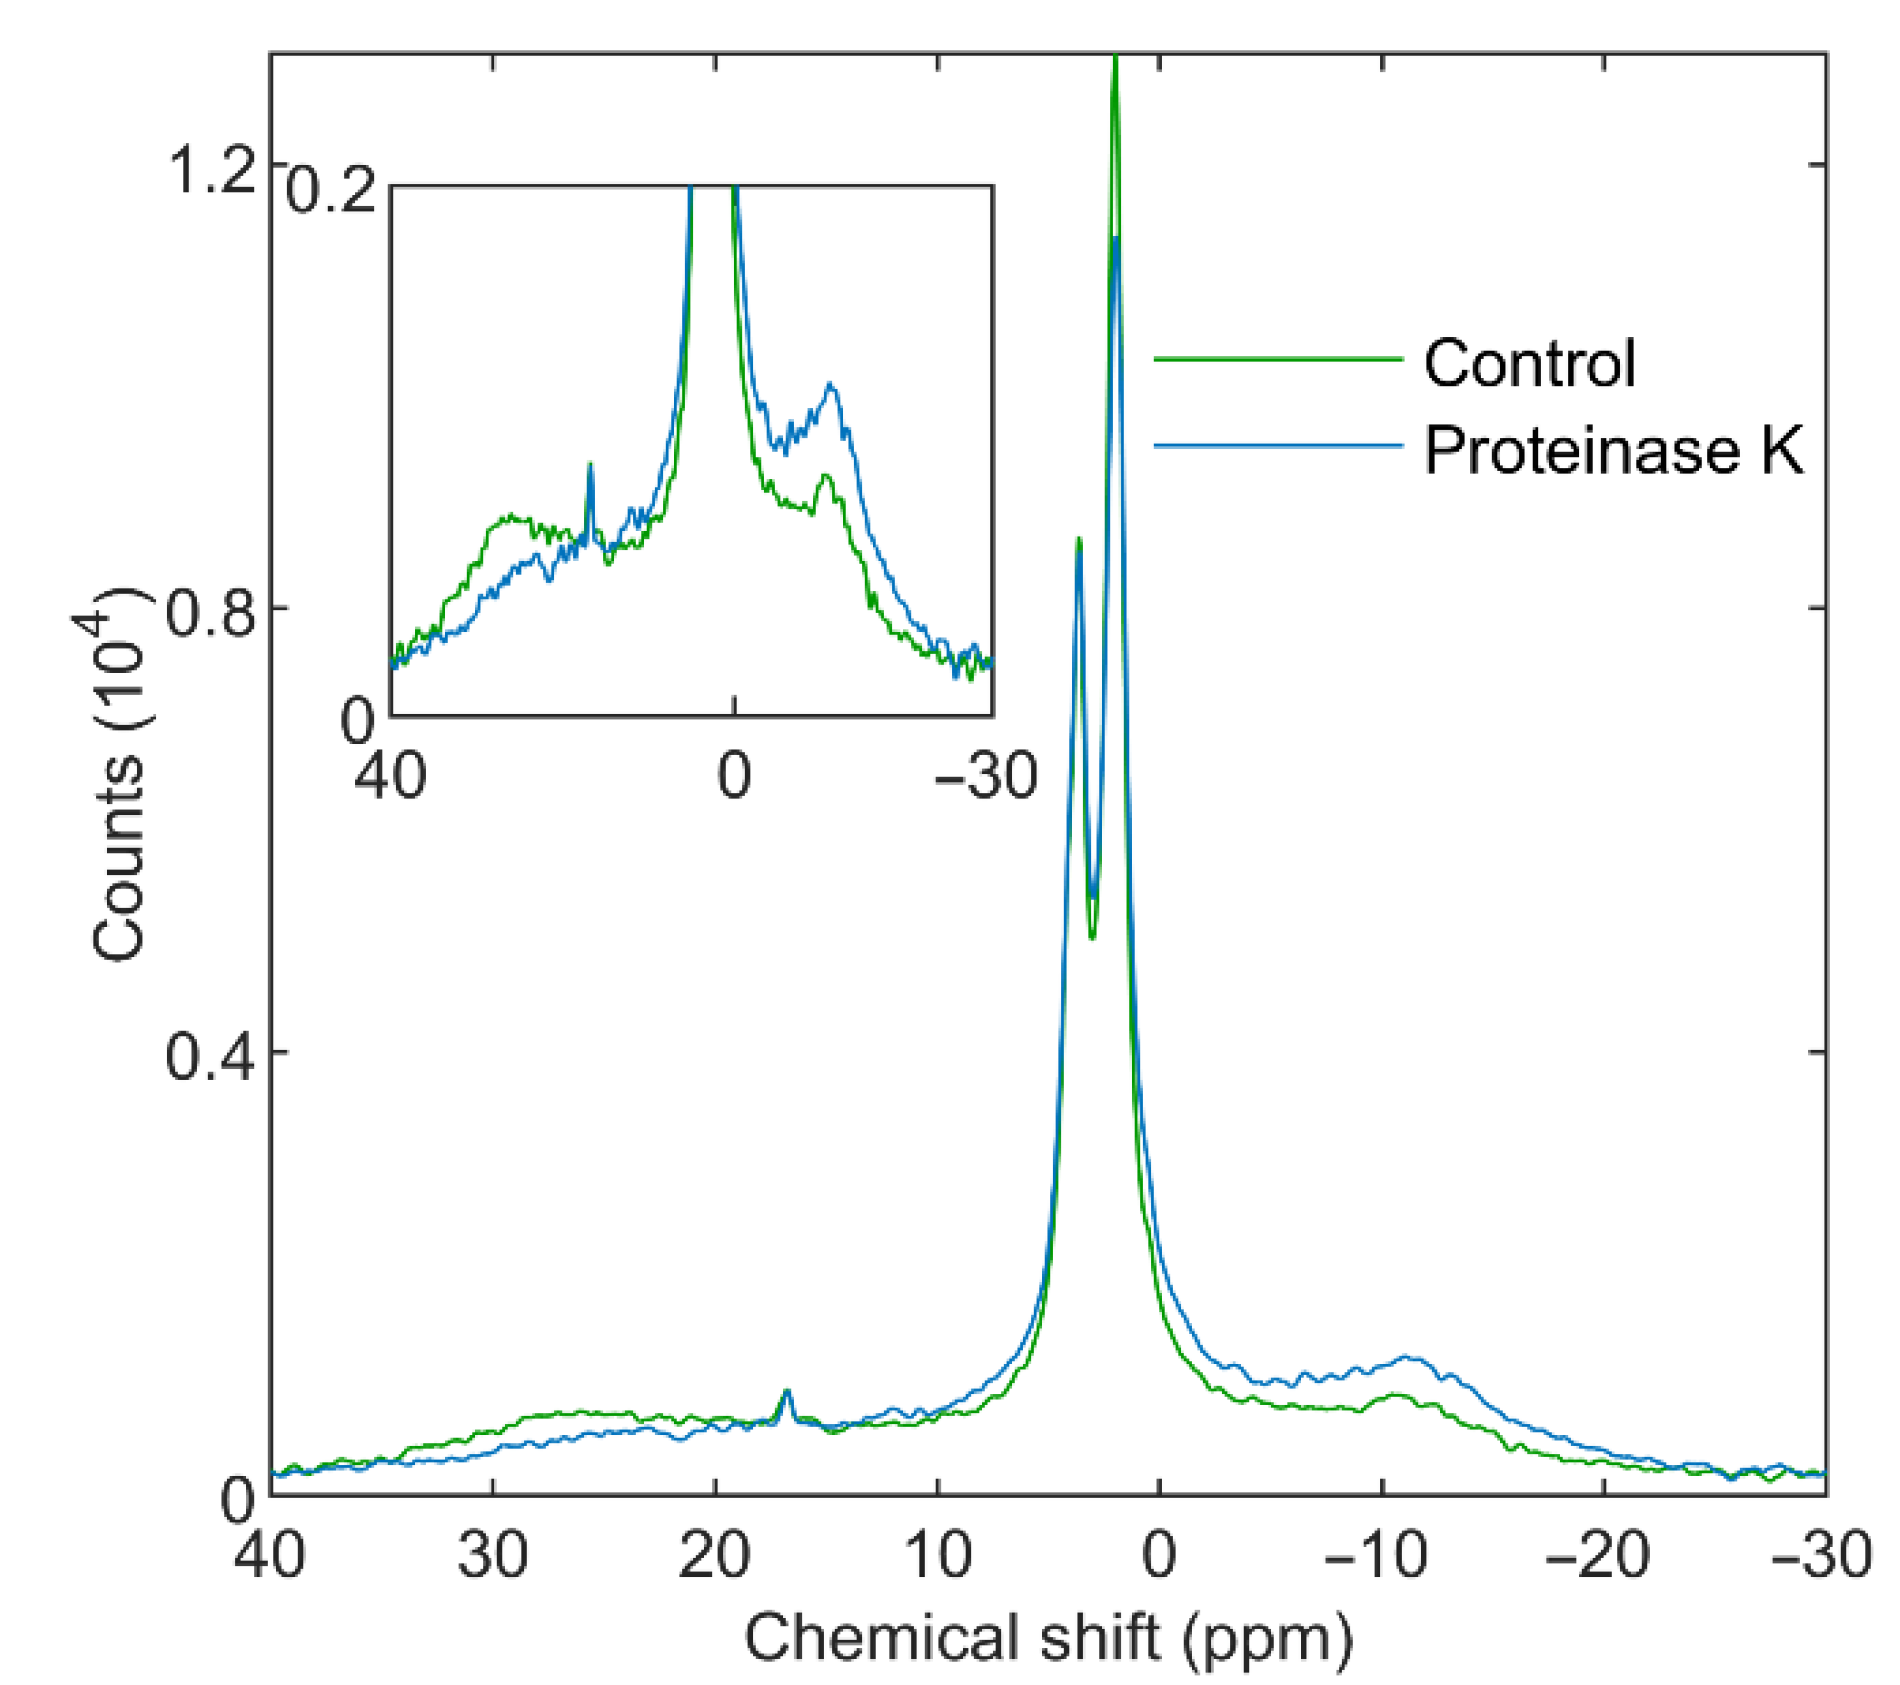
3.3.2. Proteinase K
4. Conclusions
Supplementary Materials
Author Contributions
Funding
Institutional Review Board Statement
Informed Consent Statement
Data Availability Statement
Acknowledgments
Conflicts of Interest
References
- Mustárdy, L.; Garab, G. Granum revisited. A three-dimensional model—Where things fall into place. Trends Plant Sci. 2003, 8, 117–122. [Google Scholar] [CrossRef]
- Bussi, Y.; Shimoni, E.; Weiner, A.; Kapon, R.; Charuvi, D.; Nevo, R.; Efrati, E.; Reich, Z. Fundamental helical geometry consolidates the plant photosynthetic membrane. Proc. Natl. Acad. Sci. USA 2019, 116, 22366–22375. [Google Scholar] [CrossRef]
- Goss, R.; Latowski, D. Lipid Dependence of Xanthophyll Cycling in Higher Plants and Algae. Front. Plant Sci. 2020, 11, 455. [Google Scholar] [CrossRef] [PubMed]
- Malnoë, A.; Schultink, A.; Shahrasbi, S.; Rumeau, D.; Havaux, M.; Niyogi, K.K. The Plastid Lipocalin LCNP Is Required for Sustained Photoprotective Energy Dissipation in Arabidopsis. Plant Cell 2018, 30, 196–208. [Google Scholar] [CrossRef] [PubMed]
- Kirchhoff, H.; Hall, C.; Wood, M.; Herbstová, M.; Tsabari, O.; Nevo, R.; Charuvi, D.; Shimoni, E.; Reich, Z. Dynamic control of protein diffusion within the granal thylakoid lumen. Proc. Natl. Acad. Sci. USA 2011, 108, 20248–20253. [Google Scholar] [CrossRef]
- Gollan, P.J.; Trotta, A.; Bajwa, A.A.; Mancini, I.; Aro, E.-M. Characterization of the Free and Membrane-Associated Fractions of the Thylakoid Lumen Proteome in Arabidopsis thaliana. Int. J. Mol. Sci. 2021, 22, 8126. [Google Scholar] [CrossRef]
- Mitchell, P. Chemiosmotic coupling in oxidative and photosynthetic phosphorylation. Biol. Rev. Camb. Philos. Soc. 1966, 41, 445–502. [Google Scholar] [CrossRef]
- Páli, T.; Garab, G.; Horváth, L.I.; Kóta, Z. Functional significance of the lipid-protein interface in photosynthetic membranes. Cell Mol. Life Sci. 2003, 60, 1591–1606. [Google Scholar] [CrossRef]
- Singer, S.J.; Nicolson, G.L. The Fluid Mosaic Model of the Structure of Cell Membranes. Science 1972, 175, 720–731. [Google Scholar] [CrossRef]
- Williams, W.P. The Physical Properties of Thylakoid Membrane Lipids and Their Relation to Photosynthesis. In Lipids in Photosynthesis: Structure, Function and Genetics; Siegenthaler, P.A., Murata, N., Eds.; Springer: Dordrecht, The Netherlands, 1998; pp. 103–118. [Google Scholar] [CrossRef]
- Israelachvili, J.N. Interactions of Biological Membranes and Structures. In Intermolecular and Surface Forces, 3rd ed.; Israelachvili, J.N., Ed.; Academic Press: San Diego, CA, USA, 2011; pp. 577–616. [Google Scholar] [CrossRef]
- Douce, R.; Joyard, J. Biosynthesis of Thylakoid Membrane Lipids. In Oxygenic Photosynthesis: The Light Reactions; Ort, D.R., Yocum, C.F., Heichel, I.F., Eds.; Springer: Dordrecht, The Netherlands, 1996; pp. 69–101. [Google Scholar] [CrossRef]
- Harwood, J.L. Involvement of Chloroplast Lipids in the Reaction of Plants Submitted to Stress. In Lipids in Photosynthesis: Structure, Function and Genetics; Siegenthaler, P.A., Murata, N., Eds.; Springer: Dordrecht, The Netherlands, 1998; pp. 287–302. [Google Scholar] [CrossRef]
- Boudière, L.; Michaud, M.; Petroutsos, D.; Rébeillé, F.; Falconet, D.; Bastien, O.; Roy, S.; Finazzi, G.; Rolland, N.; Jouhet, J.; et al. Glycerolipids in photosynthesis: Composition, synthesis and trafficking. Biochim. Biophys. Acta 2014, 1837, 470–480. [Google Scholar] [CrossRef]
- van Eerden, F.J.; de Jong, D.H.; de Vries, A.H.; Wassenaar, T.A.; Marrink, S.J. Characterization of thylakoid lipid membranes from cyanobacteria and higher plants by molecular dynamics simulations. Biochim Biophys Acta 2015, 1848, 1319–1330. [Google Scholar] [CrossRef]
- Demé, B.; Cataye, C.; Block, M.A.; Maréchal, E.; Jouhet, J. Contribution of galactoglycerolipids to the 3-dimensional architecture of thylakoids. FASEB J. 2014, 28, 3373–3383. [Google Scholar] [CrossRef]
- Krumova, S.B.; Dijkema, C.; de Waard, P.; Van As, H.; Garab, G.; van Amerongen, H. Phase behaviour of phosphatidylglycerol in spinach thylakoid membranes as revealed by P-31-NMR. Biochim. Biophys. Acta 2008, 1778, 997–1003. [Google Scholar] [CrossRef]
- Krumova, S.B.; Koehorst, R.B.M.; Bóta, A.; Páli, T.; van Hoek, A.; Garab, G.; van Amerongen, H. Temperature dependence of the lipid packing in thylakoid membranes studied by time- and spectrally resolved fluorescence of Merocyanine 540. Biochim. Biophys. Acta 2008, 1778, 2823–2833. [Google Scholar] [CrossRef]
- Garab, G.; Ughy, B.; de Waard, P.; Akhtar, P.; Javornik, U.; Kotakis, C.; Šket, P.; Karlický, V.; Materová, Z.; Špunda, V.; et al. Lipid polymorphism in chloroplast thylakoid membranes—As revealed by P-31-NMR and timeresolved merocyanine fluorescence spectroscopy. Sci. Rep. 2017, 7, 13343. [Google Scholar] [CrossRef]
- Gasanov, S.E.; Kim, A.A.; Yaguzhinsky, L.S.; Dagda, R.K. Non-bilayer structures in mitochondrial membranes regulate ATP synthase activity. Biochim. Biophys. Acta 2018, 1860, 586–599. [Google Scholar] [CrossRef]
- Garab, G.; Yaguzhinsky, L.S.; Dlouhý, O.; Nesterov, S.V.; Špunda, V.; Gasanoff, E.S. Structural and functional roles of non-bilayer lipid phases of chloroplast thylakoid membranes and mitochondrial inner membranes. Prog. Lipid Res. 2022, 86, 101163. [Google Scholar] [CrossRef]
- Nicolson, G.L. The Fluid-Mosaic Model of Membrane Structure: Still relevant to understanding the structure, function and dynamics of biological membranes after more than 40 years. Biochim. Biophys. Acta 2014, 1838, 1451–1466. [Google Scholar] [CrossRef]
- van den Brink-van der Laan, E.; Killian, J.A.; de Kruijff, B. Nonbilayer lipids affect peripheral and integral membrane proteins via changes in the lateral pressure profile. Biochim. Biophys. Acta 2004, 1666, 275–288. [Google Scholar] [CrossRef]
- Epand, R.M. Lipid polymorphism and protein-lipid interactions. Biochim. Biophys. Acta 1998, 1376, 353–368. [Google Scholar] [CrossRef]
- de Kruijff, B. Biomembranes-Lipids beyond the bilayer. Nature 1997, 386, 129–130. [Google Scholar] [CrossRef] [PubMed]
- Brown, M.F. Curvature Forces in Membrane Lipid-Protein Interactions. Biochemistry 2012, 51, 9782–9795. [Google Scholar] [CrossRef] [PubMed]
- Bagatolli, L.A.; Ipsen, J.H.; Simonsen, A.C.; Mouritsen, O.G. An outlook on organization of lipids in membranes: Searching for a realistic connection with the organization of biological membranes. Prog. Lipid Res. 2010, 49, 378–389. [Google Scholar] [CrossRef] [PubMed]
- Seiwert, D.; Witt, H.; Janshoff, A.; Paulsen, H. The non-bilayer lipid MGDG stabilizes the major light-harvesting complex (LHCII) against unfolding. Sci. Rep. 2017, 7, 5158. [Google Scholar] [CrossRef]
- Tietz, S.; Leuenberger, M.; Höhner, R.; Olson, A.H.; Fleming, G.R.; Kirchhoff, H. A proteoliposome-based system reveals how lipids control photosynthetic light harvesting. J. Biol. Chem. 2020, 295, 1857–1866. [Google Scholar] [CrossRef]
- Bozelli, J.C.; Aulakh, S.S.; Epand, R.M. Membrane shape as determinant of protein properties. Biophys. Chem. 2021, 273, 106587. [Google Scholar] [CrossRef]
- Dlouhý, O.; Kurasová, I.; Karlický, V.; Javornik, U.; Šket, P.; Petrova, N.Z.; Krumova, S.B.; Plavec, J.; Ughy, B.; Špunda, V.; et al. Modulation of non-bilayer lipid phases and the structure and functions of thylakoid membranes: Effects on the water-soluble enzyme violaxanthin de-epoxidase. Sci. Rep. 2020, 10, 11959. [Google Scholar] [CrossRef]
- Garab, G.; Lohner, K.; Laggner, P.; Farkas, T. Self-regulation of the lipid content of membranes by non-bilayer lipids: A hypothesis. Trends Plant Sci. 2000, 5, 489–494. [Google Scholar] [CrossRef]
- Garab, G.; Ughy, B.; Goss, R. Role of MGDG and Non-bilayer Lipid Phases in the Structure and Dynamics of Chloroplast Thylakoid Membranes. Subcell. Biochem. 2016, 86, 127–157. [Google Scholar] [CrossRef]
- Rottet, S.; Besagni, C.; Kessler, F. The role of plastoglobules in thylakoid lipid remodeling during plant development. Biochim. Biophys. Acta 2015, 1847, 889–899. [Google Scholar] [CrossRef]
- Kirchhoff, H. Chloroplast ultrastructure in plants. New Phytol. 2019, 223, 565–574. [Google Scholar] [CrossRef]
- Kotakis, C.; Akhtar, P.; Zsiros, O.; Garab, G.; Lambrev, P.H. Increased thermal stability of photosystem II and the macro-organization of thylakoid membranes, induced by co-solutes, associated with changes in the lipid-phase behaviour of thylakoid membranes. Photosynthetica 2018, 56, 254–264. [Google Scholar] [CrossRef]
- Ughy, B.; Karlický, V.; Dlouhý, O.; Javornik, U.; Materová, Z.; Zsiros, O.; Šket, P.; Plavec, J.; Špunda, V.; Garab, G. Lipid-polymorphism of plant thylakoid membranes. Enhanced non-bilayer lipid phases associated with increased membrane permeability. Physiol. Plant 2019, 166, 278–287. [Google Scholar] [CrossRef]
- Dlouhý, O.; Javornik, U.; Zsiros, O.; Šket, P.; Karlický, V.; Špunda, V.; Plavec, J.; Garab, G. Lipid Polymorphism of the Subchloroplast—Granum and Stroma Thylakoid Membrane—Particles. I. 31P-NMR Spectroscopy. Cells 2021, 10, 2354. [Google Scholar] [CrossRef]
- Dlouhý, O.; Karlický, V.; Arshad, R.; Zsiros, O.; Domonkos, I.; Kurasová, I.; Wacha, A.F.; Morosinotto, T.; Bóta, A.; Kouřil, R.; et al. Lipid Polymorphism of the Subchloroplast—Granum and Stroma Thylakoid Membrane–Particles. II. Structure and Functions. Cells 2021, 10, 2363. [Google Scholar] [CrossRef]
- Latowski, D.; Akerlund, H.E.; Strzalka, K. Violaxanthin de-epoxidase, the xanthophyll cycle enzyme, requires lipid inverted hexagonal structures for its activity. Biochemistry 2004, 43, 4417–4420. [Google Scholar] [CrossRef]
- Semenova, G.A. The Relationship between the Transformation of Thylakoid Acyl Lipids and the Formation of Tubular Lipid Aggregates Visible on Fracture Faces. J. Plant Physiol. 1999, 155, 669–677. [Google Scholar] [CrossRef]
- Kirchhoff, H.; Haase, W.; Wegner, S.; Danielsson, R.; Ackermann, R.; Albertsson, P.A. Low-light-induced formation of semicrystalline photosystem II arrays in higher plant chloroplast. Biochemistry 2007, 46, 11169–11176. [Google Scholar] [CrossRef]
- Porra, R.J.; Thompson, W.A.; Kriedemann, P.E. Determination of accurate extinction coefficients and simultaneous equations for assaying chlorophylls a and b extracted with four different solvents: Verification of the concentration of chlorophyll standards by atomic absorption spectroscopy. Biochim. Biophys. Acta 1989, 975, 384–394. [Google Scholar] [CrossRef]
- Besagni, C.; Piller, L.E.; Bréhélin, C. Preparation of plastoglobules from Arabidopsis plastids for proteomic analysis and other studies. Methods Mol. Biol. 2011, 775, 223–239. [Google Scholar] [CrossRef]
- Massiot, D.; Fayon, F.; Capron, M.; King, I.; Le Calvé, S.; Alonso, B.; Durand, J.-O.; Bujoli, B.; Gan, Z.; Hoatson, G. Modelling one- and two-dimensional solid-state NMR spectra. Magn. Reson. Chem. 2002, 40, 70–76. [Google Scholar] [CrossRef]
- Cullis, P.R.; de Kruijff, B. Lipid polymorphism and the functional roles of lipids in biological membranes. Biochim. Biophys. Acta 1979, 559, 399–420. [Google Scholar] [CrossRef]
- Watts, A. NMR of Lipids. In Encyclopedia of Biophysics; Roberts, G.C.K., Ed.; Springer: Berlin/Heidelberg, Germany, 2013; pp. 1727–1738. [Google Scholar] [CrossRef]
- Karlický, V.; Kurasová, I.; Ptáčková, B.; Večeřová, K.; Urban, O.; Špunda, V. Enhanced thermal stability of the thylakoid membranes from spruce. A comparison with selected angiosperms. Photosynth. Res. 2016, 130, 357–371. [Google Scholar] [CrossRef]
- Karlický, V.; Kmecová Materová, Z.; Kurasová, I.; Nezval, J.; Štroch, M.; Garab, G.; Špunda, V. Accumulation of geranylgeranylated chlorophylls in the pigment-protein complexes of Arabidopsis thaliana acclimated to green light: Effects on the organization of light-harvesting complex II and photosystem II functions. Photosynth. Res. 2021, 149, 233–252. [Google Scholar] [CrossRef] [PubMed]
- Järvi, S.; Gollan, P.J.; Aro, E.M. Understanding the roles of the thylakoid lumen in photosynthesis regulation. Front. Plant Sci. 2013, 4, 434. [Google Scholar] [CrossRef] [PubMed]
- Djordjevic, J. Role of Phospholipases in Fungal Fitness, Pathogenicity, and Drug Development—Lessons from Cryptococcus Neoformans. Front. Microbiol. 2010, 1, 125. [Google Scholar] [CrossRef]
- Kublicki, M.; Koszelewski, D.; Brodzka, A.; Ostaszewski, R. Wheat germ lipase: Isolation, purification and applications. Crit. Rev. Biotechnol. 2022, 42, 184–200. [Google Scholar] [CrossRef]
- Kobayashi, K.; Endo, K.; Wada, H. Specific Distribution of Phosphatidylglycerol to Photosystem Complexes in the Thylakoid Membrane. Front. Plant Sci. 2017, 8, 1991. [Google Scholar] [CrossRef]
- Scholes, G.D.; Fleming, G.R.; Olaya-Castro, A.; van Grondelle, R. Lessons from nature about solar light harvesting. Nat. Chem. 2011, 3, 763–774. [Google Scholar] [CrossRef]
- Suga, M.; Qin, X.; Kuang, T.; Shen, J.R. Structure and energy transfer pathways of the plant photosystem I-LHCI supercomplex. Curr. Opin. Struct. Biol. 2016, 39, 46–53. [Google Scholar] [CrossRef]
- Umena, Y.; Kawakami, K.; Shen, J.-R.; Kamiya, N. Crystal structure of oxygen-evolving photosystem II at a resolution of 1.9 Å. Nature 2011, 473, 55–60. [Google Scholar] [CrossRef]
- Caspy, I.; Nelson, N. Structure of the plant photosystem I. Biochem. Soc. Trans. 2018, 46, 285–294. [Google Scholar] [CrossRef]
- Yamamoto, Y.; Kai, S.; Ohnishi, A.; Tsumura, N.; Ishikawa, T.; Hori, H.; Morita, N.; Ishikawa, Y. Quality Control of PSII: Behavior of PSII in the Highly Crowded Grana Thylakoids Under Excessive Light. Plant Cell Physiol. 2014, 55, 1206–1215. [Google Scholar] [CrossRef]
- Nussberger, S.; Dekker, J.P.; Kühlbrandt, W.; van Bolhuis, B.M.; van Grondelle, R.; van Amerongen, H. Spectroscopic characterization of three different monomeric forms of the main chlorophyll a/b binding protein from chloroplast membranes. Biochemistry 1994, 33, 14775–14783. [Google Scholar] [CrossRef]
- Sozer, O.; Kis, M.; Gombos, Z.; Ughy, B. Proteins, glycerolipids and carotenoids in the functional photosystem II architecture. Front. Biosci. 2011, 16, 619–643. [Google Scholar] [CrossRef][Green Version]
- Sipka, G.; Magyar, M.; Mezzetti, A.; Akhtar, P.; Zhu, Q.; Xiao, Y.; Han, G.; Santabarbara, S.; Shen, J.-R.; Lambrev, P.H.; et al. Light-adapted charge-separated state of photosystem II: Structural and functional dynamics of the closed reaction center. Plant Cell 2021, 33, 1286–1302. [Google Scholar] [CrossRef]
- Droppa, M.; Horváth, G.; Hideg, E.; Farkas, T. The role of phospholipids in regulating photosynthetic electron transport activities: Treatment of thylakoids with phospholipase C. Photosynth. Res. 1995, 46, 287–293. [Google Scholar] [CrossRef]
- Leng, J.; Sakurai, I.; Wada, H.; Shen, J.R. Effects of phospholipase and lipase treatments on photosystem II core dimer from a thermophilic cyanobacterium. Photosynth. Res. 2008, 98, 469–478. [Google Scholar] [CrossRef]
- Kruse, O.; Hankamer, B.; Konczak, C.; Gerle, C.; Morris, E.; Radunz, A.; Schmid, G.H.; Barber, J. Phosphatidylglycerol Is Involved in the Dimerization of Photosystem II *. J. Biol. Chem. 2000, 275, 6509–6514. [Google Scholar] [CrossRef]
- Garab, G. Hierarchical organization and structural flexibility of thylakoid membranes. Biochim. Biophys. Acta 2014, 1837, 481–494. [Google Scholar] [CrossRef]
- Lambrev, P.H.; Akhtar, P. Macroorganisation and flexibility of thylakoid membranes. Biochem. J. 2019, 476, 2981–3018. [Google Scholar] [CrossRef]
- Simidjiev, I.; Barzda, V.; Mustárdy, L.; Garab, G. Isolation of Lamellar Aggregates of the Light-Harvesting Chlorophyll a/b Protein Complex of Photosystem II with Long-Range Chiral Order and Structural Flexibility. Anal. Biochem. 1997, 250, 169–175. [Google Scholar] [CrossRef]
- Armbruster, U.; Labs, M.; Pribil, M.; Viola, S.; Xu, W.; Scharfenberg, M.; Hertle, A.P.; Rojahn, U.; Jensen, P.E.; Rappaport, F.; et al. Arabidopsis CURVATURE THYLAKOID1 proteins modify thylakoid architecture by inducing membrane curvature. Plant Cell 2013, 25, 2661–2678. [Google Scholar] [CrossRef]
- Seddon, J.M.; Templer, R.H. Polymorphism of Lipid-Water Systems. In Handbook of Biological Physics; Lipowsky, R., Sackmann, E., Eds.; Elsevier: Amsterdam, The Netherlands, 1995; Volume 1, pp. 97–160. [Google Scholar]
- Chernomordik, L. Non-bilayer lipids and biological fusion intermediates. Chem. Phys. Lipids 1996, 81, 203–213. [Google Scholar] [CrossRef]
- Blumenthal, R.; Clague, M.J.; Durell, S.R.; Epand, R.M. Membrane fusion. Chem. Rev. 2003, 103, 53–69. [Google Scholar] [CrossRef]
- Grzyb, J.; Latowski, D.; Strzałka, K. Lipocalins—A family portrait. J. Plant Physiol. 2006, 163, 895–915. [Google Scholar] [CrossRef]
- van Wijk, K.J.; Kessler, F. Plastoglobuli: Plastid Microcompartments with Integrated Functions in Metabolism, Plastid Developmental Transitions, and Environmental Adaptation. Annu. Rev. Plant Biol. 2017, 68, 253–289. [Google Scholar] [CrossRef] [PubMed]
- Garab, G.; Kieleczawa, J.; Sutherland, J.C.; Bustamante, C.; Hind, G. Organization of pigment-protein complexes into macrodomains in the thylakoid membranes of wild-type and chlorophyll fo-less mutant of barley as revealed by circular dichroism. Photochem. Photobiol. 1991, 54, 273–281. [Google Scholar] [CrossRef]
- Albanese, P.; Tamara, S.; Saracco, G.; Scheltema, R.A.; Pagliano, C. How paired PSII–LHCII supercomplexes mediate the stacking of plant thylakoid membranes unveiled by structural mass-spectrometry. Nature Commun. 2020, 11, 1361. [Google Scholar] [CrossRef]
- Jia, H.; Liggins, J.R.; Chow, W.S. Entropy and biological systems: Experimentally-investigated entropy-driven stacking of plant photosynthetic membranes. Sci. Rep. 2014, 4, 4142. [Google Scholar] [CrossRef]
- Paliwal, R.; Singhal, G.S. Fluorescence polarization of trypsin digested photosystem II membranes. Photosynth. Res. 1987, 12, 83–90. [Google Scholar] [CrossRef] [PubMed]
- Karnauchov, I.; Herrmann, R.G.; Klösgen, R.B. Transmembrane topology of the Rieske Fe/S protein of the cytochrome b6/f complex from spinach chloroplasts. FEBS Lett. 1997, 408, 206–210. [Google Scholar] [CrossRef]
- Lensch, M.; Herrmann, R.G.; Sokolenko, A. Identification and Characterization of SppA, a Novel Light-inducible Chloroplast Protease Complex Associated with Thylakoid Membranes. J. Biol. Chem. 2001, 276, 33645–33651. [Google Scholar] [CrossRef] [PubMed]
- Lennon, A.M.; Prommeenate, P.; Nixon, P.J. Location, expression and orientation of the putative chlororespiratory enzymes, Ndh and IMMUTANS, in higher-plant plastids. Planta 2003, 218, 254–260. [Google Scholar] [CrossRef]
- Jennings, R.C.; Paolo, D.G.; Flavio, M.G.; Forti, G. Effects of Trypsin and Cations on Chloroplast Membranes. Plant Physiol. 1981, 67, 212–215. [Google Scholar] [CrossRef]
- Selman, B.R.; Bannister, T.T. Trypsin inhibition of photosystem II. Biochim. Biophys. Acta (BBA) 1971, 253, 428–436. [Google Scholar] [CrossRef]
- Mazor, Y.; Borovikova, A.; Caspy, I.; Nelson, N. Structure of the plant photosystem I supercomplex at 2.6 Å resolution. Nature Plants 2017, 3, 17014. [Google Scholar] [CrossRef]
- Matthijs, H.C.; Coughlan, S.J.; Hind, G. Removal of ferredoxin:NADP+ oxidoreductase from thylakoid membranes, rebinding to depleted membranes, and identification of the binding site. J. Biol. Chem. 1986, 261, 12154–12158. [Google Scholar] [CrossRef]
- Mulo, P. Chloroplast-targeted ferredoxin-NADP+ oxidoreductase (FNR): Structure, function and location. Biochim. Biophys. Acta 2011, 1807, 927–934. [Google Scholar] [CrossRef]
- Killian, J.A.; Salemink, I.; de Planque, M.R.; Lindblom, G.; Koeppe, R.E., II; Greathouse, D.V. Induction of nonbilayer structures in diacylphosphatidylcholine model membranes by transmembrane alpha-helical peptides: Importance of hydrophobic mismatch and proposed role of tryptophans. Biochemistry 1996, 35, 1037–1045. [Google Scholar] [CrossRef]
- May, S.; Harries, D.; Ben-Shaul, A. The phase behavior of cationic lipid-DNA complexes. Biophys. J 2000, 78, 1681–1697. [Google Scholar] [CrossRef]
- Conn, C.E.; Drummond, C.J. Nanostructured bicontinuous cubic lipid self-assembly materials as matrices for protein encapsulation. Soft Matter 2013, 9, 3449–3464. [Google Scholar] [CrossRef]
- Astolfi, P.; Giorgini, E.; Perinelli, D.R.; Vita, F.; Adamo, F.C.; Logrippo, S.; Parlapiano, M.; Bonacucina, G.; Pucciarelli, S.; Francescangeli, O.; et al. Cubic and Hexagonal Mesophases for Protein Encapsulation: Structural Effects of Insulin Confinement. Langmuir 2021, 37, 10166–10176. [Google Scholar] [CrossRef]
- Brown, L.R.; Wüthrich, K. NMR and ESR studies of the interactions of cytochrome c with mixed cardiolipin-phosphatidylcholine vesicles. Biochim. Biophys. Acta 1977, 468, 389–410. [Google Scholar] [CrossRef]
- de Kruijff, B.; Cullis, P.R. Cytochrome c specifically induces non-bilayer structures in cardiolipin-containing model membranes. Biochim. Biophys. Acta 1980, 602, 477–490. [Google Scholar] [CrossRef]
- Vladimirov, G.K.; Vikulina, A.S.; Volodkin, D.; Vladimirov, Y.A. Structure of the complex of cytochrome c with cardiolipin in non-polar environment. Chem. Phys. Lipids 2018, 214, 35–45. [Google Scholar] [CrossRef]
- Schuurmans, J.J.; Veerman, E.C.I.; Francke, J.A.; Torrespereira, J.M.G.; Kraayenhof, R. Temperature-dependence of energy-transducing functions and inhibitor sensitivity in chloroplasts. Plant Physiol. 1984, 74, 170–175. [Google Scholar] [CrossRef]
- Tikhonov, A.N.; Vershubskii, A.V. Temperature-dependent regulation of electron transport and ATP synthesis in chloroplasts in vitro and in silico. Photosynth. Res. 2020, 146, 299–329. [Google Scholar] [CrossRef]


Publisher’s Note: MDPI stays neutral with regard to jurisdictional claims in published maps and institutional affiliations. |
© 2022 by the authors. Licensee MDPI, Basel, Switzerland. This article is an open access article distributed under the terms and conditions of the Creative Commons Attribution (CC BY) license (https://creativecommons.org/licenses/by/4.0/).
Share and Cite
Dlouhý, O.; Karlický, V.; Javornik, U.; Kurasová, I.; Zsiros, O.; Šket, P.; Kanna, S.D.; Böde, K.; Večeřová, K.; Urban, O.; et al. Structural Entities Associated with Different Lipid Phases of Plant Thylakoid Membranes—Selective Susceptibilities to Different Lipases and Proteases. Cells 2022, 11, 2681. https://doi.org/10.3390/cells11172681
Dlouhý O, Karlický V, Javornik U, Kurasová I, Zsiros O, Šket P, Kanna SD, Böde K, Večeřová K, Urban O, et al. Structural Entities Associated with Different Lipid Phases of Plant Thylakoid Membranes—Selective Susceptibilities to Different Lipases and Proteases. Cells. 2022; 11(17):2681. https://doi.org/10.3390/cells11172681
Chicago/Turabian StyleDlouhý, Ondřej, Václav Karlický, Uroš Javornik, Irena Kurasová, Ottó Zsiros, Primož Šket, Sai Divya Kanna, Kinga Böde, Kristýna Večeřová, Otmar Urban, and et al. 2022. "Structural Entities Associated with Different Lipid Phases of Plant Thylakoid Membranes—Selective Susceptibilities to Different Lipases and Proteases" Cells 11, no. 17: 2681. https://doi.org/10.3390/cells11172681
APA StyleDlouhý, O., Karlický, V., Javornik, U., Kurasová, I., Zsiros, O., Šket, P., Kanna, S. D., Böde, K., Večeřová, K., Urban, O., Gasanoff, E. S., Plavec, J., Špunda, V., Ughy, B., & Garab, G. (2022). Structural Entities Associated with Different Lipid Phases of Plant Thylakoid Membranes—Selective Susceptibilities to Different Lipases and Proteases. Cells, 11(17), 2681. https://doi.org/10.3390/cells11172681