Article

The Functional Role and Regulatory Mechanism of Bromodomain-Containing Protein 9 in Human Uterine Leiomyosarcoma

1
Department of Obstetrics and Gynecology, University of Chicago, Chicago, IL 60637, USA
2
Department of Biology, Yazd University, Yazd 8915818411, Iran
3
Department of Pathology, University of Chicago, Chicago, IL 60637, USA
4
Department of Molecular Medicine, Institute of Biotechnology, University of Texas Health Science Center at San Antonio, San Antonio, TX 78229, USA
*
Author to whom correspondence should be addressed.
Cells 2022, 11(14), 2160; https://doi.org/10.3390/cells11142160
Submission received: 6 June 2022 / Revised: 1 July 2022 / Accepted: 4 July 2022 / Published: 10 July 2022

Abstract

:
Uterine leiomyosarcoma (uLMS) is the most common type of uterine sarcoma associated with poor prognosis, high rates of recurrence, and metastasis. There is currently limited information about uLMS molecular mechanisms of origin and development. Bromodomain (BRD)-containing proteins are involved in many biological processes, most notably epigenetic regulation of transcription, and BRD protein dysfunction has been linked to many diseases including tumorigenesis. However, the role of BRD proteins in the pathogenesis of uLMS is unknown. Here, we show for the first time that BRD9 is aberrantly overexpressed in uLMS tissues compared to adjacent myometrium. BRD9 expression is also upregulated in uLMS cell lines compared to benign uterine fibroid and myometrium cell lines. Inhibition of BRD9 using the specific inhibitor (TP-472) suppressed uLMS cell proliferation via inducing apoptosis and cell cycle arrest. To further characterize the mechanistic basis for TP-472 inhibition of uLMS cell growth, we performed a comparative RNA-seq analysis of vehicle-treated and TP-472-treated uLMS cells (n = 4 each). Bioinformatics analysis revealed that TP-472 treatment distinctly altered the uLMS cell transcriptome. Gene set enrichment analysis identified critical pathways altered by BRD9 inhibition, including interferon-alpha response, KRAS signaling, MYC targets, TNF-a signaling via NFkB, and MTORC1 signaling. Parsimonious gene correlation network analysis identified nine enriched modules, including cell cycle and apoptosis modules. Moreover, the ENCODE Histone Modifications gene set and TargetScan microRNA analysis in Enrichr suggested that TP-472-induced BRD9 inhibition may alter the uLMS cell transcriptome by reprograming the oncogenic epigenome and inducing miRNA-mediated gene regulation. Therefore, BRD9 constitutes a specific vulnerability in malignant uLMS, and targeting non-BET BRD proteins in uLMS may provide a promising and novel strategy for treating patients with this aggressive uterine cancer.

1. Introduction

Uterine leiomyosarcoma (uLMS) is a rare uterine cancer, representing 1–2% of all uterine malignancies [1]. The annual incidence of uLMS is approximately 6 per 1,000,000 women. The 5-year survival rate for all patients ranges between 25 and 76%, while survival for women with metastatic disease at the time of initial diagnosis approaches only 10–15% [2]. Irrespective of treatment, uLMS is characterized by poor prognosis [3], and many uLMS patients exhibit resistance to currently available therapies, as evidenced by high rates of both recurrence and progression [4,5,6].
A significant body of foundational data supports a key role in epigenetic dysregulation of gene expression in oncogenesis [7,8,9,10]. For example, altered epigenetic modifications, including DNA methylation and histone modifications, as well as aberrant expression of non-coding RNAs, have been variously shown to contribute to tumor initiation and development [9,11,12,13,14,15,16,17]. Notably, as the “readers” of lysine acetylation, bromodomain (BRD)-containing proteins are responsible for transducing regulatory signals carried by acetylated lysine residues into various biological phenotypes [18]. BRD proteins can exert a wide variety of functions via multiple gene regulatory mechanisms [19] and deregulation of BRDs is involved in many diseases, including cancer [20,21,22,23,24].
Bromodomain-containing protein 9 (BRD9) is a newly identified subunit of the non-canonical barrier-to-autointegration factor (ncBAF) complex and a member of the bromodomain family IV [25]. Studies have demonstrated that BRD9 plays an oncogenic role in multiple cancer types, by regulating tumor cell growth. The connection of BRD9 with PI3K pathway [26], miR RNAs [27], and STAT5 [28] is implicated in cancer progression. However, the role and mechanism of BRDs in the pathogenesis of uLMS are unknown. Accordingly, the present study aimed to determine whether and how BRD9 contributes to aberrant uLMS cell growth, with important implications for the development of novel treatment options for this highly aggressive uterine cancer.

2. Materials and Methods

2.1. Tissues and Immunohistochemistry

The uLMS tissues (n = 9) were obtained from the University of Chicago Tissue Bank. Approval from the Institutional Review Board (#20-1820) at the University of Chicago was obtained for the retrospective chart review of uLMS patients. Informed consent was obtained from all the patients participating in the study before surgery. The cases with an initial diagnosis of uLMS at University of Chicago Hospital were reviewed (Table 1), and the diagnosis was confirmed by H&E evaluation and immunohistochemistry, when required.
The mean age of uLMS patients was 54.0 ± 6.9 years, with a range of 42 to 61 years. The clinicopathological data about the patient cohort and their uLMS samples were summarized in Table 1. The original blocks were retrieved from the tissue bank and were sectioned onto coated slides at a thickness of 5 µM. One section was stained with hematoxylin and eosin to evaluate the morphology of each spot, and the remaining slides were used for IHC analysis. Briefly, sections were deparaffinized with xylene, and rehydrated by being passed through decreasing concentrations of ethanol in water. Then, antigen retrieval and quenching of endogenous peroxidases were performed. Sections were incubated with primary antibodies (HMB45, SMA, desmin, and BRD9) (Table 2) in a humidity chamber overnight at 4 °C and developed with peroxidase labeled-dextran polymer followed by diaminobenzidine (DAKO Envision Plus System; DAKO Corporation, Carpinteria, CA, USA). Sections were counterstained with Gill’s Hematoxylin (Fisher, Pittsburgh, PA, USA). To determine the percentage of BRD9 positive cells, the samples were analyzed using the positive cell detection command on QuPath software. Different thresholds were set to categorize cells according to nuclei staining intensity: negative, weak, moderate, and strong intensity. Smooth muscle was used a positive tissue for SMA and desmin. Melanoma was used a positive control for HMB45. Human testis was used as positive control for BRD9 IHC staining.

2.2. Cells and Reagents

The leiomyosarcoma (uLMS) cell line (SK-UT1, ATCC® HTB-114TM) (ATCC, Manassas, VA, USA) was cultured and maintained in ATCC-formulated Eagle’s Minimum Essential Medium with 10% of fetal bovine serum. In addition, the uterine sarcoma cell line (MES-SA) (ATCC, Manassas, VA, USA) was cultured and maintained in McCoy’s 5A medium. The immortalized human leiomyoma cell line (HuLM) and immortalized human uterine smooth muscle (UTSM) cells were a generous gift from Professor Darlene Dixon. The HuLM and UTSM cell lines were cultured and maintained in phenol red-free, Dulbecco’s Modified Eagle Medium: Nutrient Mixture F-12. We used these cell lines covering the spectrum from normal cell line (UTSM), benign uterine tumor cell line (HuLM), and uterine malignant cell lines (uLMS) to better understand the tumor progression linking to the BRD9 dysregulation in uLMS. BRD9 inhibitor (iBRD9) TP-472 was purchased from Tocris (Cat# 6000, Minneapolis, MN, USA).

2.3. Proliferation Assay

Cell proliferation was measured using trypan blue exclusion assay; 4 × 10⁴ cells per well were seeded into 12-well tissue culture plates, treated with the iBRD9 (TP-472) at a dose range from 1–25 µM for 48 h. This assay was performed three times in triplicate.

2.4. RNA Extraction and Gene Expression

Total RNA was isolated using Trizol reagent (Invitrogen, Carlsbad, CA, USA). The concentration of total RNA was determined using NanoDrop (Thermo Scientific, Waltham, MA, USA). One microgram of total RNA from each sample was reverse transcribed to complementary DNA (cDNA) using the High-Capacity cDNA Transcription Kit (Thermo Scientific, Waltham, MA, USA). Quantitative real-time polymerase chain reaction (qRT-PCR) was performed to determine the messenger RNA (mRNA) expression of several genes listed with their primer sequences in Table 2. The real-time PCR reactions were performed using CFX96 PCR instrument using SYBR Green Supermix (Bio-Rad, Hercules, CA, USA). 18S was used as an internal control. The results are presented as relative gene expression using CFX MaestroTM. The assay was performed three times in triplicate.

2.5. Protein Extraction and Western Blot

Cells were collected and lysed in RIPA lysis buffer with protease and phosphatase inhibitor cocktail (Thermo Scientific, Waltham, MA, USA), the protein was quantified using the Bradford method (Bio-Rad Protein Assay kit). The information about primary antibodies, including antibody dilution and source of antibodies is listed in Table 2. The antigen–antibody complex was detected with Trident Femto Western HRP substrate (GeneTex, Irvine, CA, USA). Specific protein bands were visualized using ChemiDoc XRS þ molecular imager (Bio-Rad, Hercules, CA, USA).

2.6. RNA-Sequencing

To determine the mechanism underlying the inhibitory effect of BRD9 inhibition on the uLMS, the SK-UT-1 cells were treated with iBRD9 TP-472 (5 µM) for 48 h. RNA was isolated using Trizol. RNA quality and quantity were assessed using the Agilent bio-analyzer. Strand-specific RNA-SEQ libraries were prepared using a TruSEQ total RNA-SEQ library protocol (Illumina provided). Library quality and quantity were assessed using the Agilent bio-analyzer and libraries were sequenced using an Illumina NovaSEQ6000 (illumine provided reagents and protocols).

2.7. Transcriptome Profiles Analysis

2.7.1. Transcriptome Data Analysis

A variety of R packages was used for this analysis. All graphics and data wrangling were handled using the tidyverse suite of packages. All packages used are available from the Comprehensive R Archive Network (CRAN), Bioconductor.org, or Github. The reads were mapped to the human reference transcriptome using STAR, version 2.6.1d (GitHub, Inc., San Francisco, CA, USA). The quality of raw reads, as well as the results of STAR mapping, are generated using fastqc and multiqc. Raw reads were mapped to the human reference transcriptome using Salmon, version 1.4.0. After reading mapping with Salmon, (https://bioconductor.org/packages/release/bioc/html/tximport.html, accessed on 27 October 2021) was used to read Salmon outputs into the R environment. Annotation data from Gencode V34 was used to summarize data from transcript-level to gene-level.

2.7.2. Integrated Bioinformatics Analysis

For Parsimonious gene correlation network analysis (PGCNA), normalized matrix of DEGs (Adjusted p-Values < 0.05 and −1.5 > fold-change > 1.5; n = 3583) and the top 80% of the most variance genes across samples (n = 10,848) were used to network construction. The matrix was used to calculate Spearman rank correlations for all gene pairs using the Python PGCNA2 package [29]. For each gene (row) in a correlation matrix, only the three most correlated edges per gene were retained. The correlation matrices were clustered 100 times using the fast unfolding of communities in a large network’s algorithm and the best (judged by modularity score) were used for downstream analysis. Gephi package with the ForceAtlas2 layout method was used to visualize the network [30]. Enrichment analyses were performed using the Enrichr web server (https://maayanlab.cloud/Enrichr/, accessed on 10 January 2022) through enrichR package in R software [31]. Top biological process GO terms with the false discovery rate (FDR) > 0.05 were analyzed using REVIGO to summarize and find a representative subset of the terms [32]. STRING database (https://string-db.org/, accessed on 27 April 2022), which is the online search tool to protein-protein network (PPI) construction, was used to reconstruct each modules network (A combined score ≥ 0.4 of PPI pairs was considered significant), then the Cytoscape software was employed to analyze the obtained networks. In addition, the Venn diagram online tool provided by VIB and Ghent University (http://bioinformatics.psb.ugent.be/webtools/Venn/, accessed on 27 April 2022) was used to investigate the intersection of DEGs and selected modules.

2.8. Quantitative Real-Time Polymerase Chain Reaction (qRT-PCR)

Quantitative real-time PCR was performed to determine the mRNA expression of genes as described previously [33]. Primers were purchased from Integrated DNA Technologies (IDT, Coralville, IA, USA) with primer sequences shown in Table 3. An equal amount of cDNA from each sample was added to the Master mix containing appropriate primer sets and SYBR green supermix (Bio-Rad) in a 20 µL reaction volume. All samples were analyzed in triplicates. Real-time PCR analyses were performed using a Bio-Rad CFX96. Cycling conditions included denaturation at 95 °C for 2 min followed by 40 cycles of 95 °C for 5 s and 60 °C for 30 s then 65 °C for 5 s. Synthesis of a DNA product of the expected size was confirmed by melting curve analysis. Further, 18S ribosomal RNA values (internal control) were used to normalize the expression data and normalized values were used to create data graphs. Negative control has been performed by running the reaction without cDNA from Integrated DNA Technologies (IDT, Coralville, IA, USA).

2.9. Statistical Analysis

All experiments were conducted with at least three biological replicates. Comparison of two groups was carried out using Student t-test for parametric distribution and Mann–Whitney test for nonparametric distribution. Comparison of multiple groups was carried out by analysis of variance (ANOVA) followed by a post-test using Tukey for parametric distribution and Kruskal–Wallis test followed by a post-test Dunns for nonparametric distribution, using GraphPad Prism 5 Software. Data were presented as mean ± standard error (SE). In figures, ns, *, **, and *** indicate, not significant, p < 0.05, <0.01, and <0.001 respectively.

3. Results

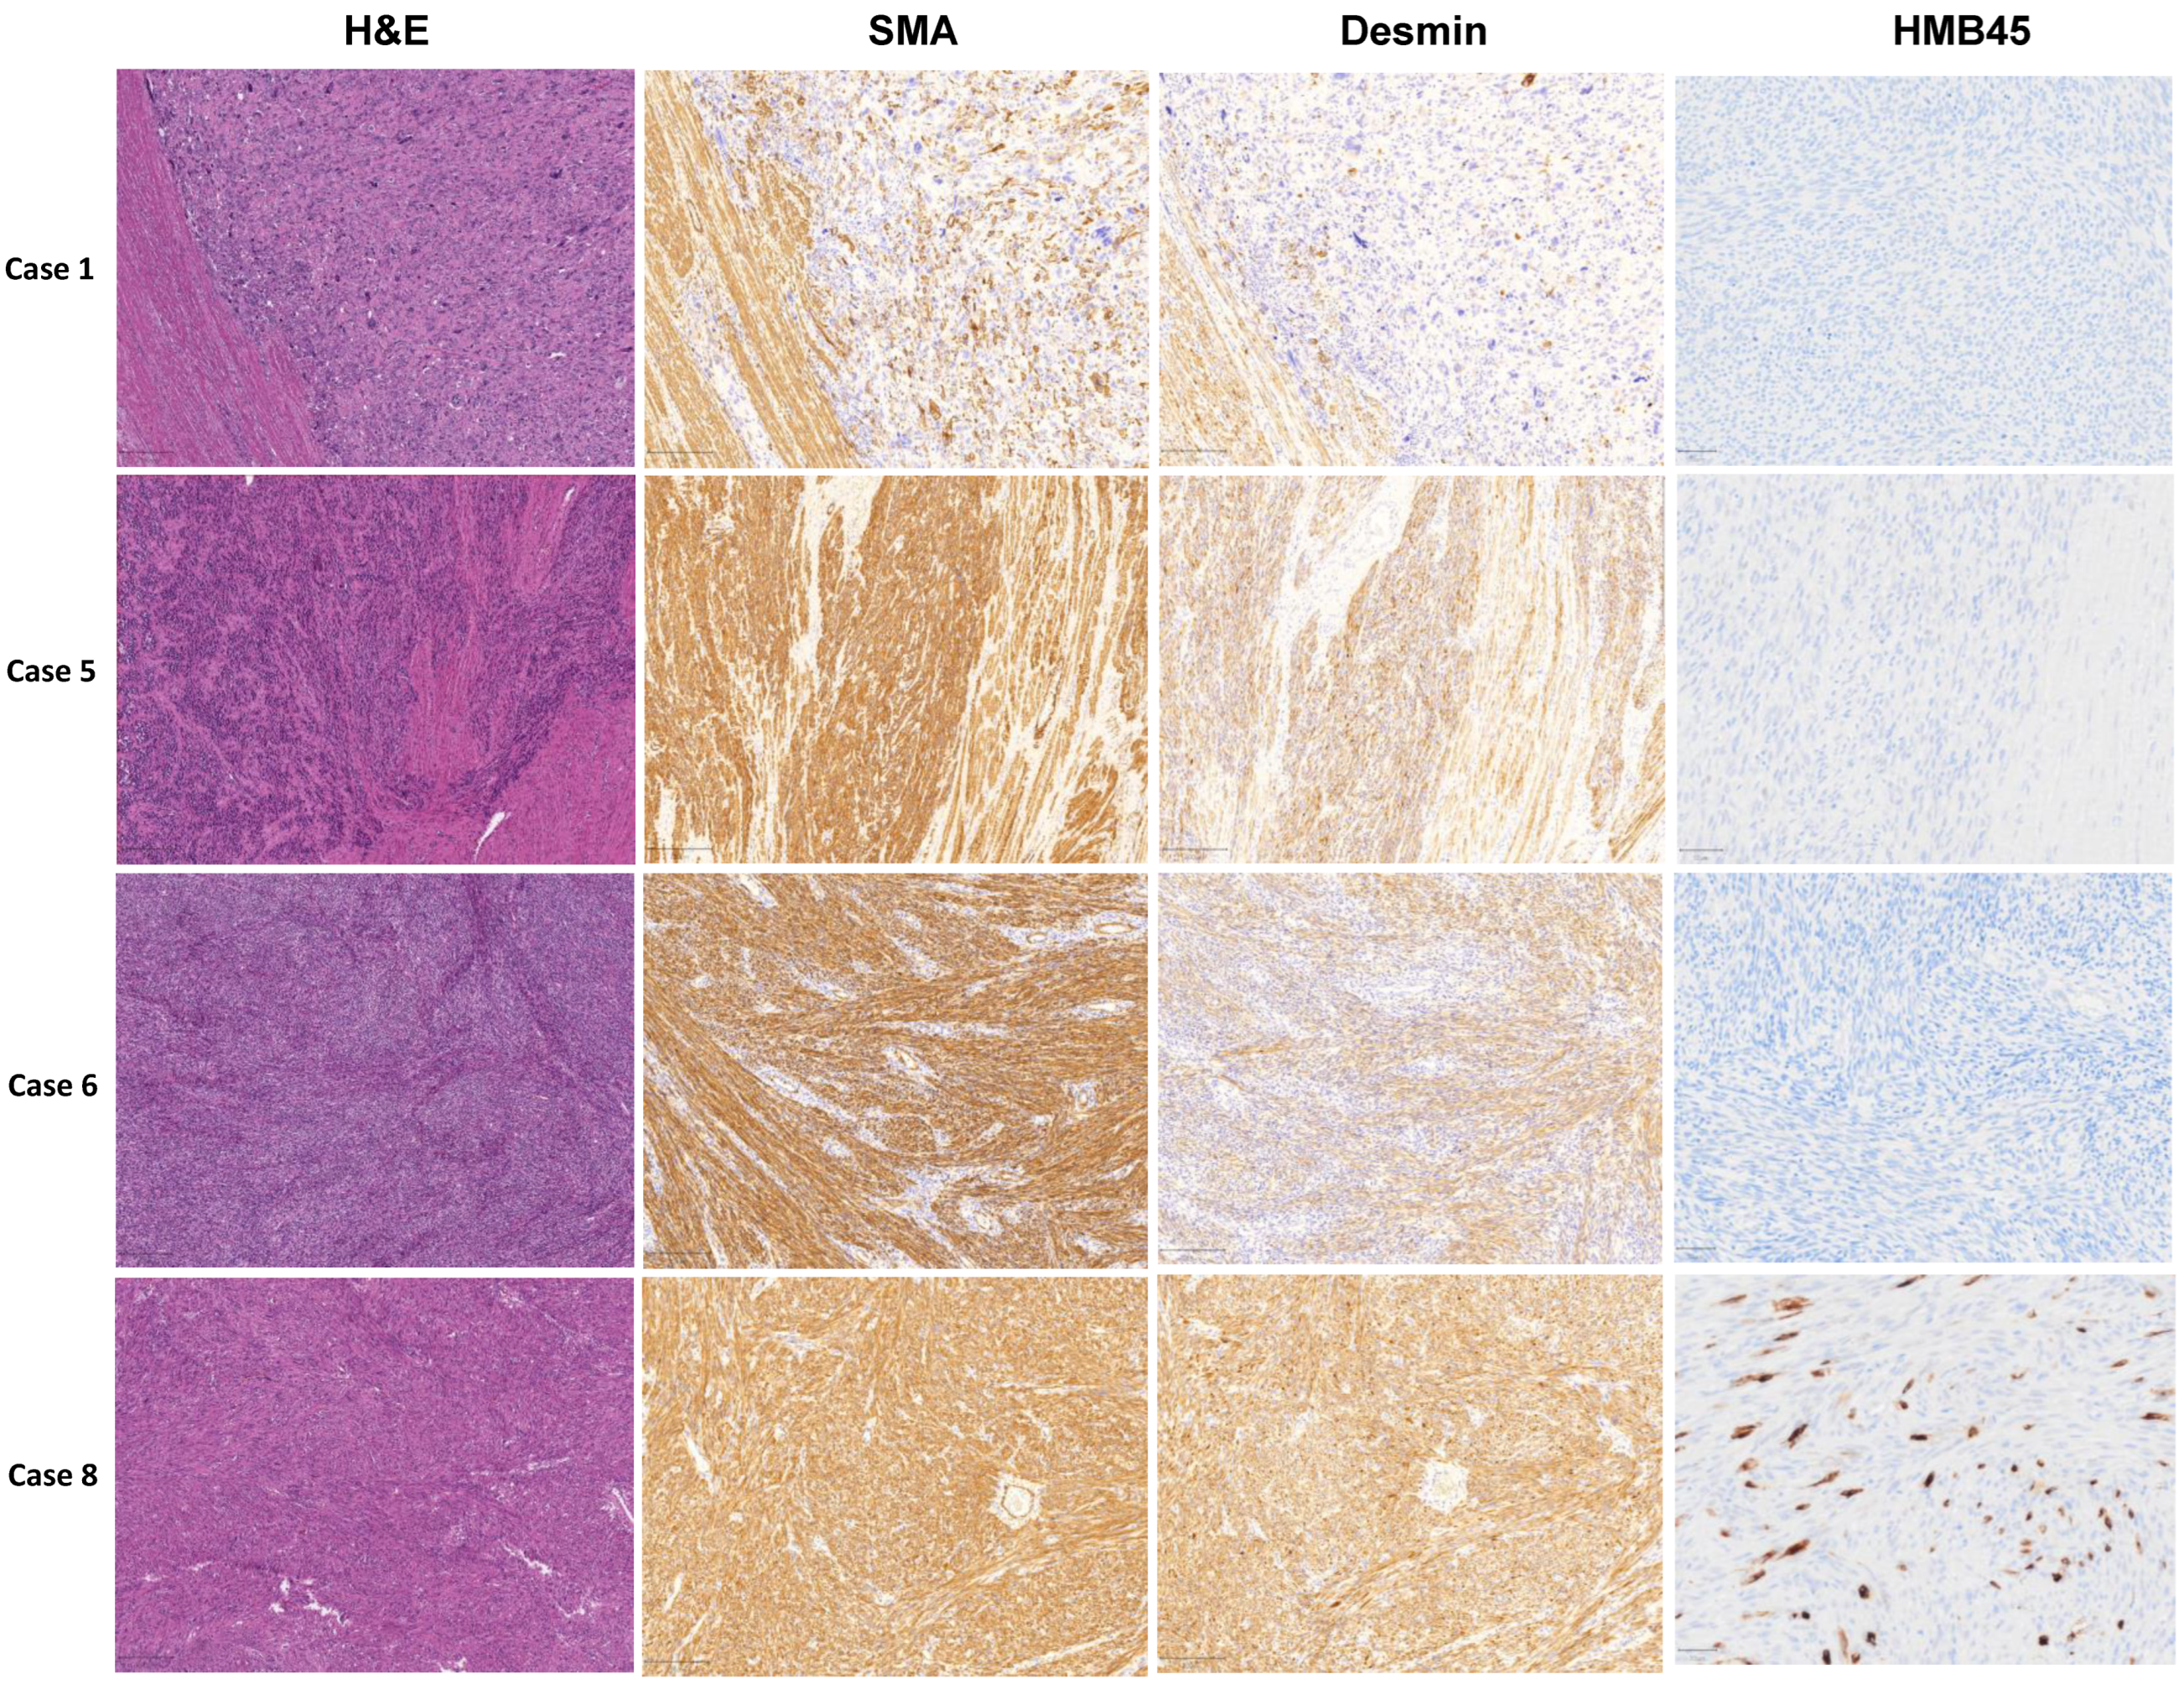
3.1. Pathological Examination

A total of nine patients with uLMS were identified. Of these, seven met the definition of conventional uLMS, while two met the definition of non-conventional uLMS resembling epithelioid uLMS and sex cord tumor. Patient information collected is shown in Table 1. The mean age of uLMS patients was 54.6 ± 7.4 years with a range of 42 to 62 years. Tumor size was 14.1 ± 7.9 cm in average (range: 2.9 cm to 27 cm). H&E staining exhibited a boundary between myometrium and uLMS (Figure 1). In cases with equivocal morphologic features, SMA, desmin, and HMB45 immunohistochemical stains were performed, confirming the diagnosis of uLMS. SMA and Desmin were all positive in 9/9 (100%) of cases by IHC analysis. For HMB45 IHC, seven and two of nine samples showed negative and positive HMB45 expression, respectively. The cases with HMB45 expression demonstrate only focal positivity and were considered insufficient to establish a diagnosis of PEComa (Figure 1, Table 1).

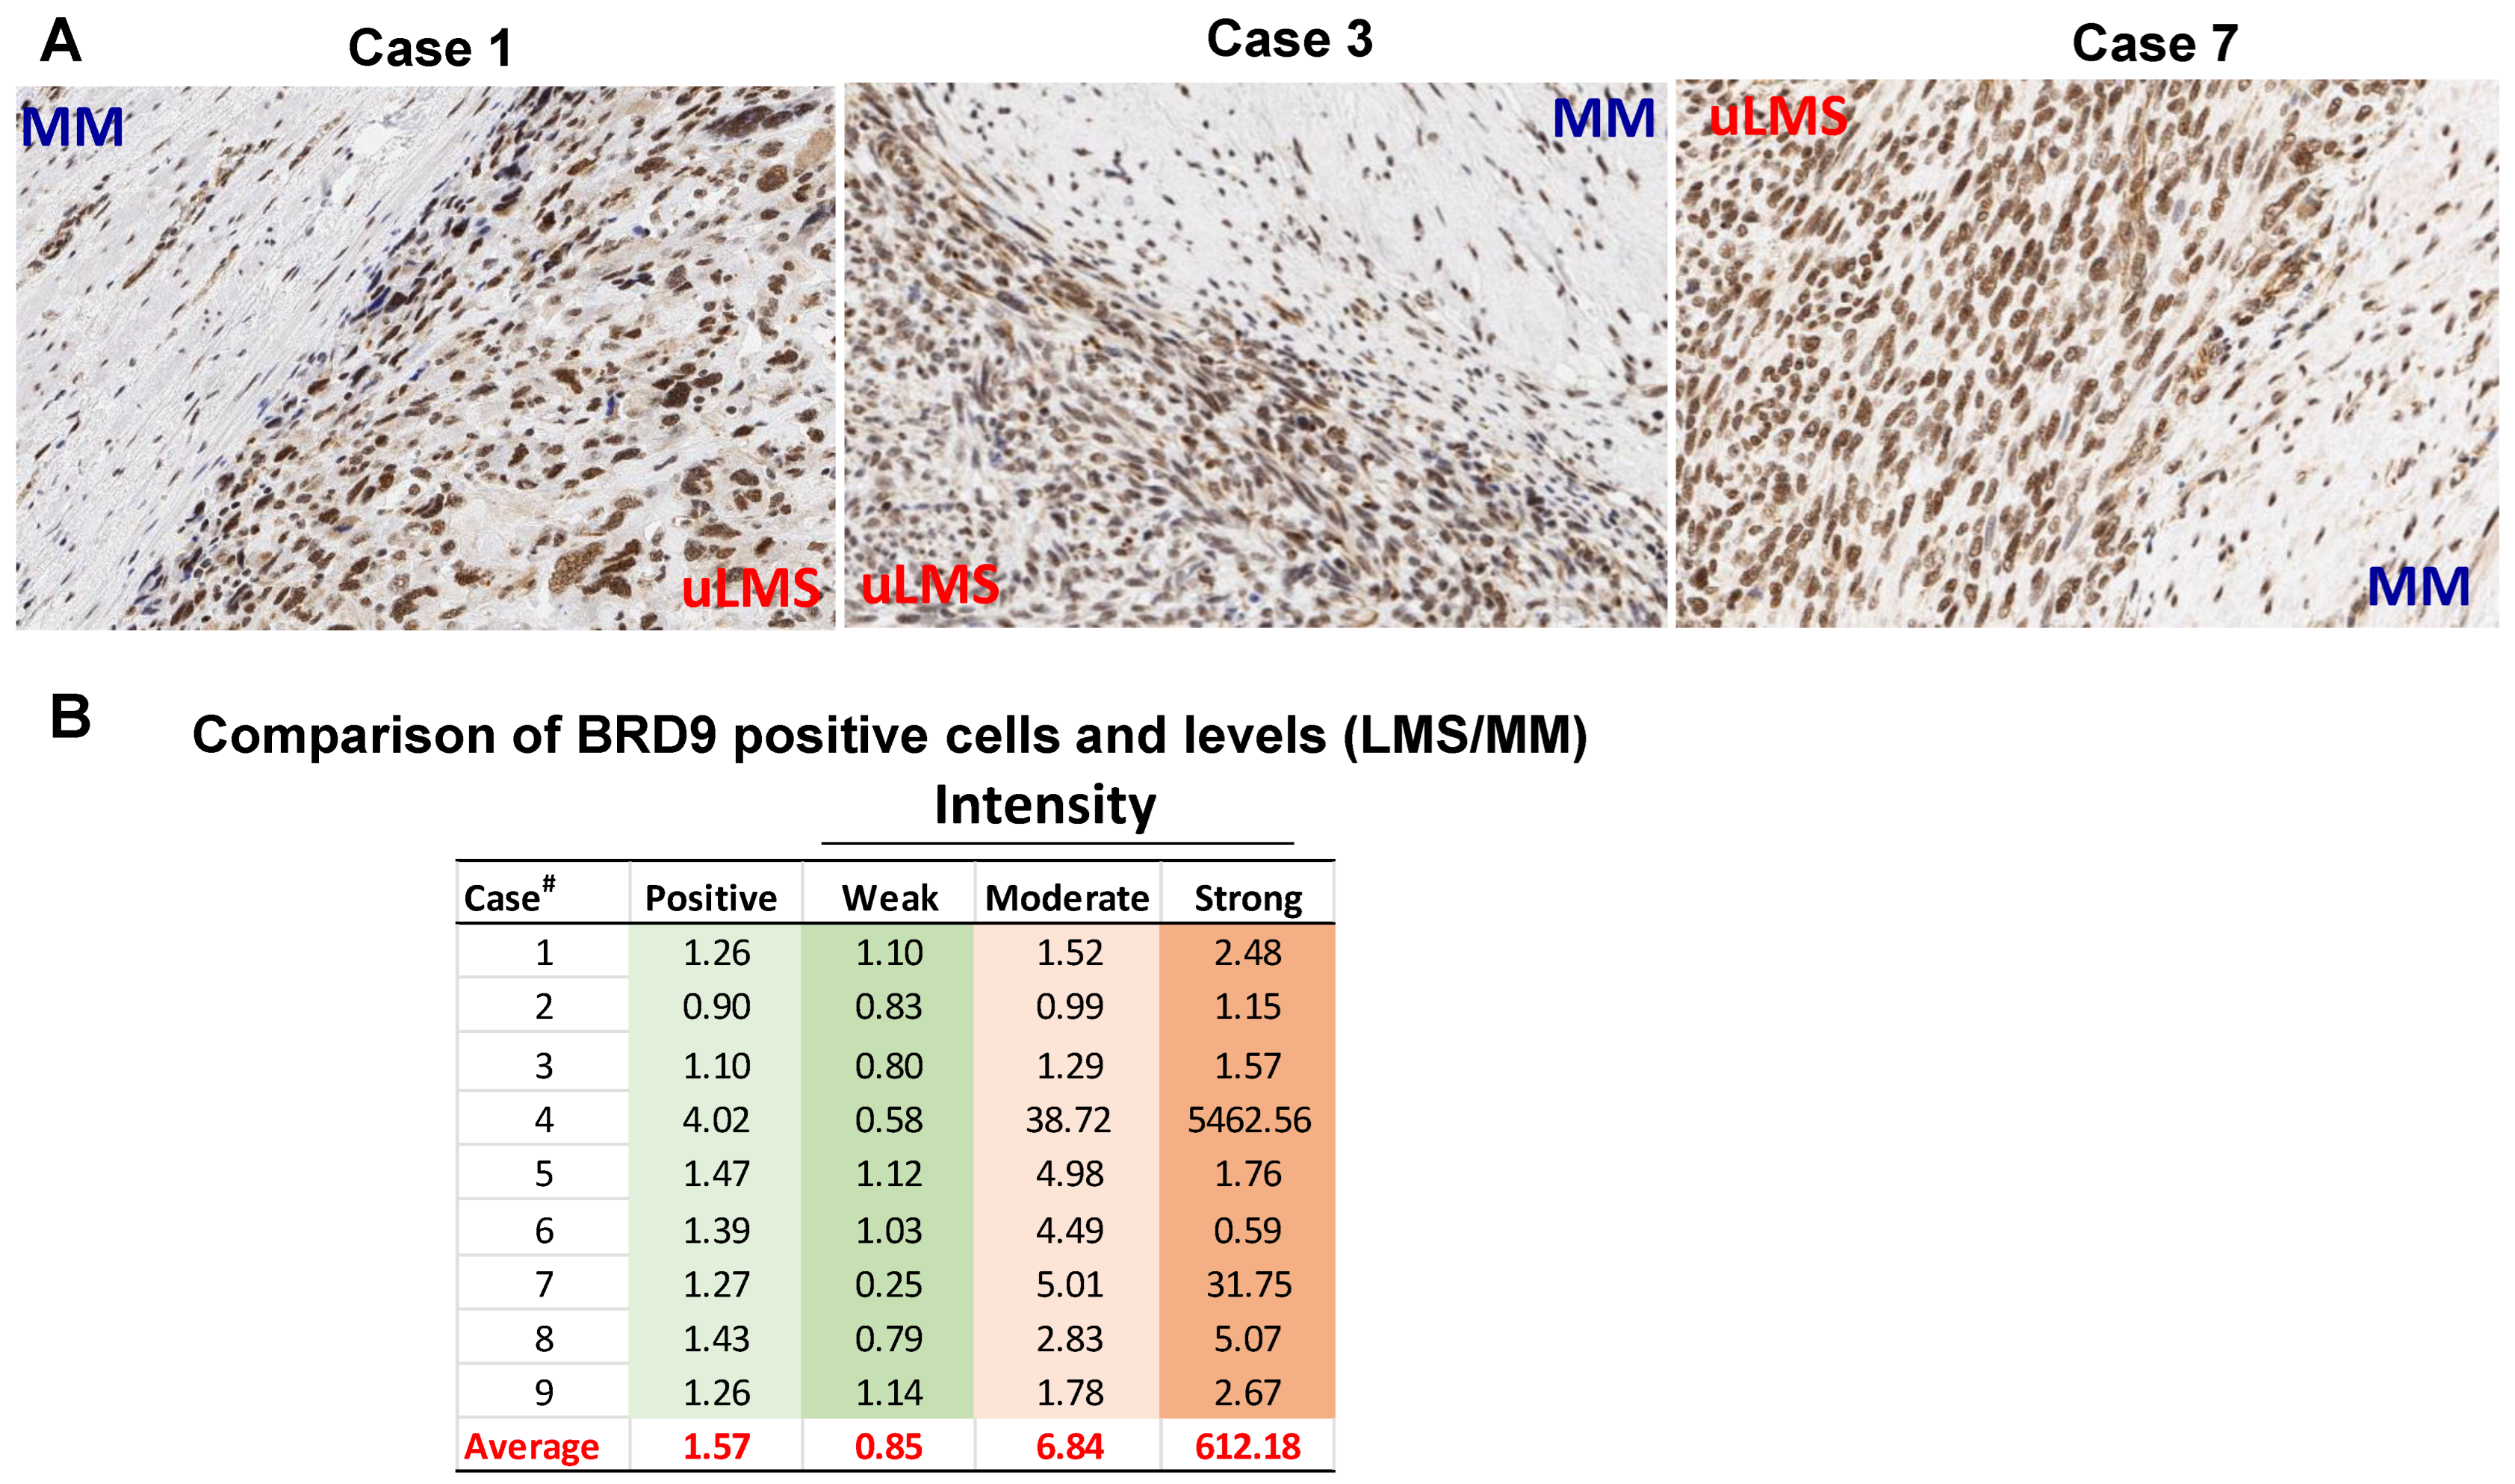
3.2. The BRD9 Expression Is Upregulated in uLMS Tissues Compared to Adjacent Myometrium from Women with uLMS

To determine whether BRD9 is dysregulated, the comparison of BRD9 positive cells and expression levels was analyzed on uLMS tissues (n = 9) and adjacent myometrium (MM+uLMS) (n = 7). We observed that among seven cases (1–7) analyzed with both myometrium and uLMS, six cases exhibited an increased percentage of BRD9 positive cells in uLMS compared to MM+uLMS. Although the percentage of cells with a weak level of BRD9 expression is increased in only three out of seven uLMS cases compared to MM+uLMS (Figure 2A,B), the percentage of cells with moderate and strong expression levels of BRD9 in uLMS is much higher than MM+uLMS (Figure 2A,B). The uLMS tissues from cases #8–9 did not have matched myometrium; therefore, we compared the BRD9 expression of cases #8–9 with the average of BRD9 expression from cases #1–7 myometrium tissues. As shown in Figure 2B, the BRD9 expression in uLMS from cases #8–9 exhibited higher expression of BRD9 compared to the BRD9 expression in the myometrium. Among nine cases analyzed, eight out of nine cases exhibited an increase in BRD9 positive cells, moderate intensity, and strong intensity cells. The average fold changes of positive cells, weak intensity, moderate intensity and strong intensity in uLMS compared to MM+uLMS are 1.57, 0.85, 6.84, and 612.18, respectively (Figure 2B).

3.3. BRD9 Levels Are Upregulated in uLMS Cell Lines

The constitutive (basal) expression levels of BRD9 in cell lines from human uterine smooth muscle (UTSM), human uterine leiomyoma (HuLM), and two different uLMS (SK-UT-1 and MES-SA) were evaluated by Western blot analysis. This analysis revealed that the expression levels of BRD9 exhibited a graded increase from normal and benign tumors to malignant uterine sarcoma cells. (Figure 3A,B).

3.4. Inhibition of BRD9 Decreased uLMS Cell Proliferation

TP-472 has been shown to inhibit BRD9 [34], therefore we selected TP-472 in our in vitro cell model to assess its effect on uLMS cell proliferation. Trypan blue exclusion assay was performed in SK-UT-1 and MES-SA cell lines treated for 48 h with TP-472 at dose ranges from 1–25 µM. The prolonged treatment (48 h) with iBRD9 (TP-472) showed a dose-dependent inhibitory effect on proliferation of both SK-UT-1 and MES-SA cells (Figure 3C,D). To determine if TP-472 treatment suppressed uLMS cell proliferation via apoptosis, the levels of BCL-2, which promotes cellular survival and inhibits the actions of pro-apoptotic proteins, were measured. As show in Figure 3E,F, TP-472 treatment significantly decreased the protein levels of BCL-2 in SK-UT-1 cells in a dose-dependent manner.

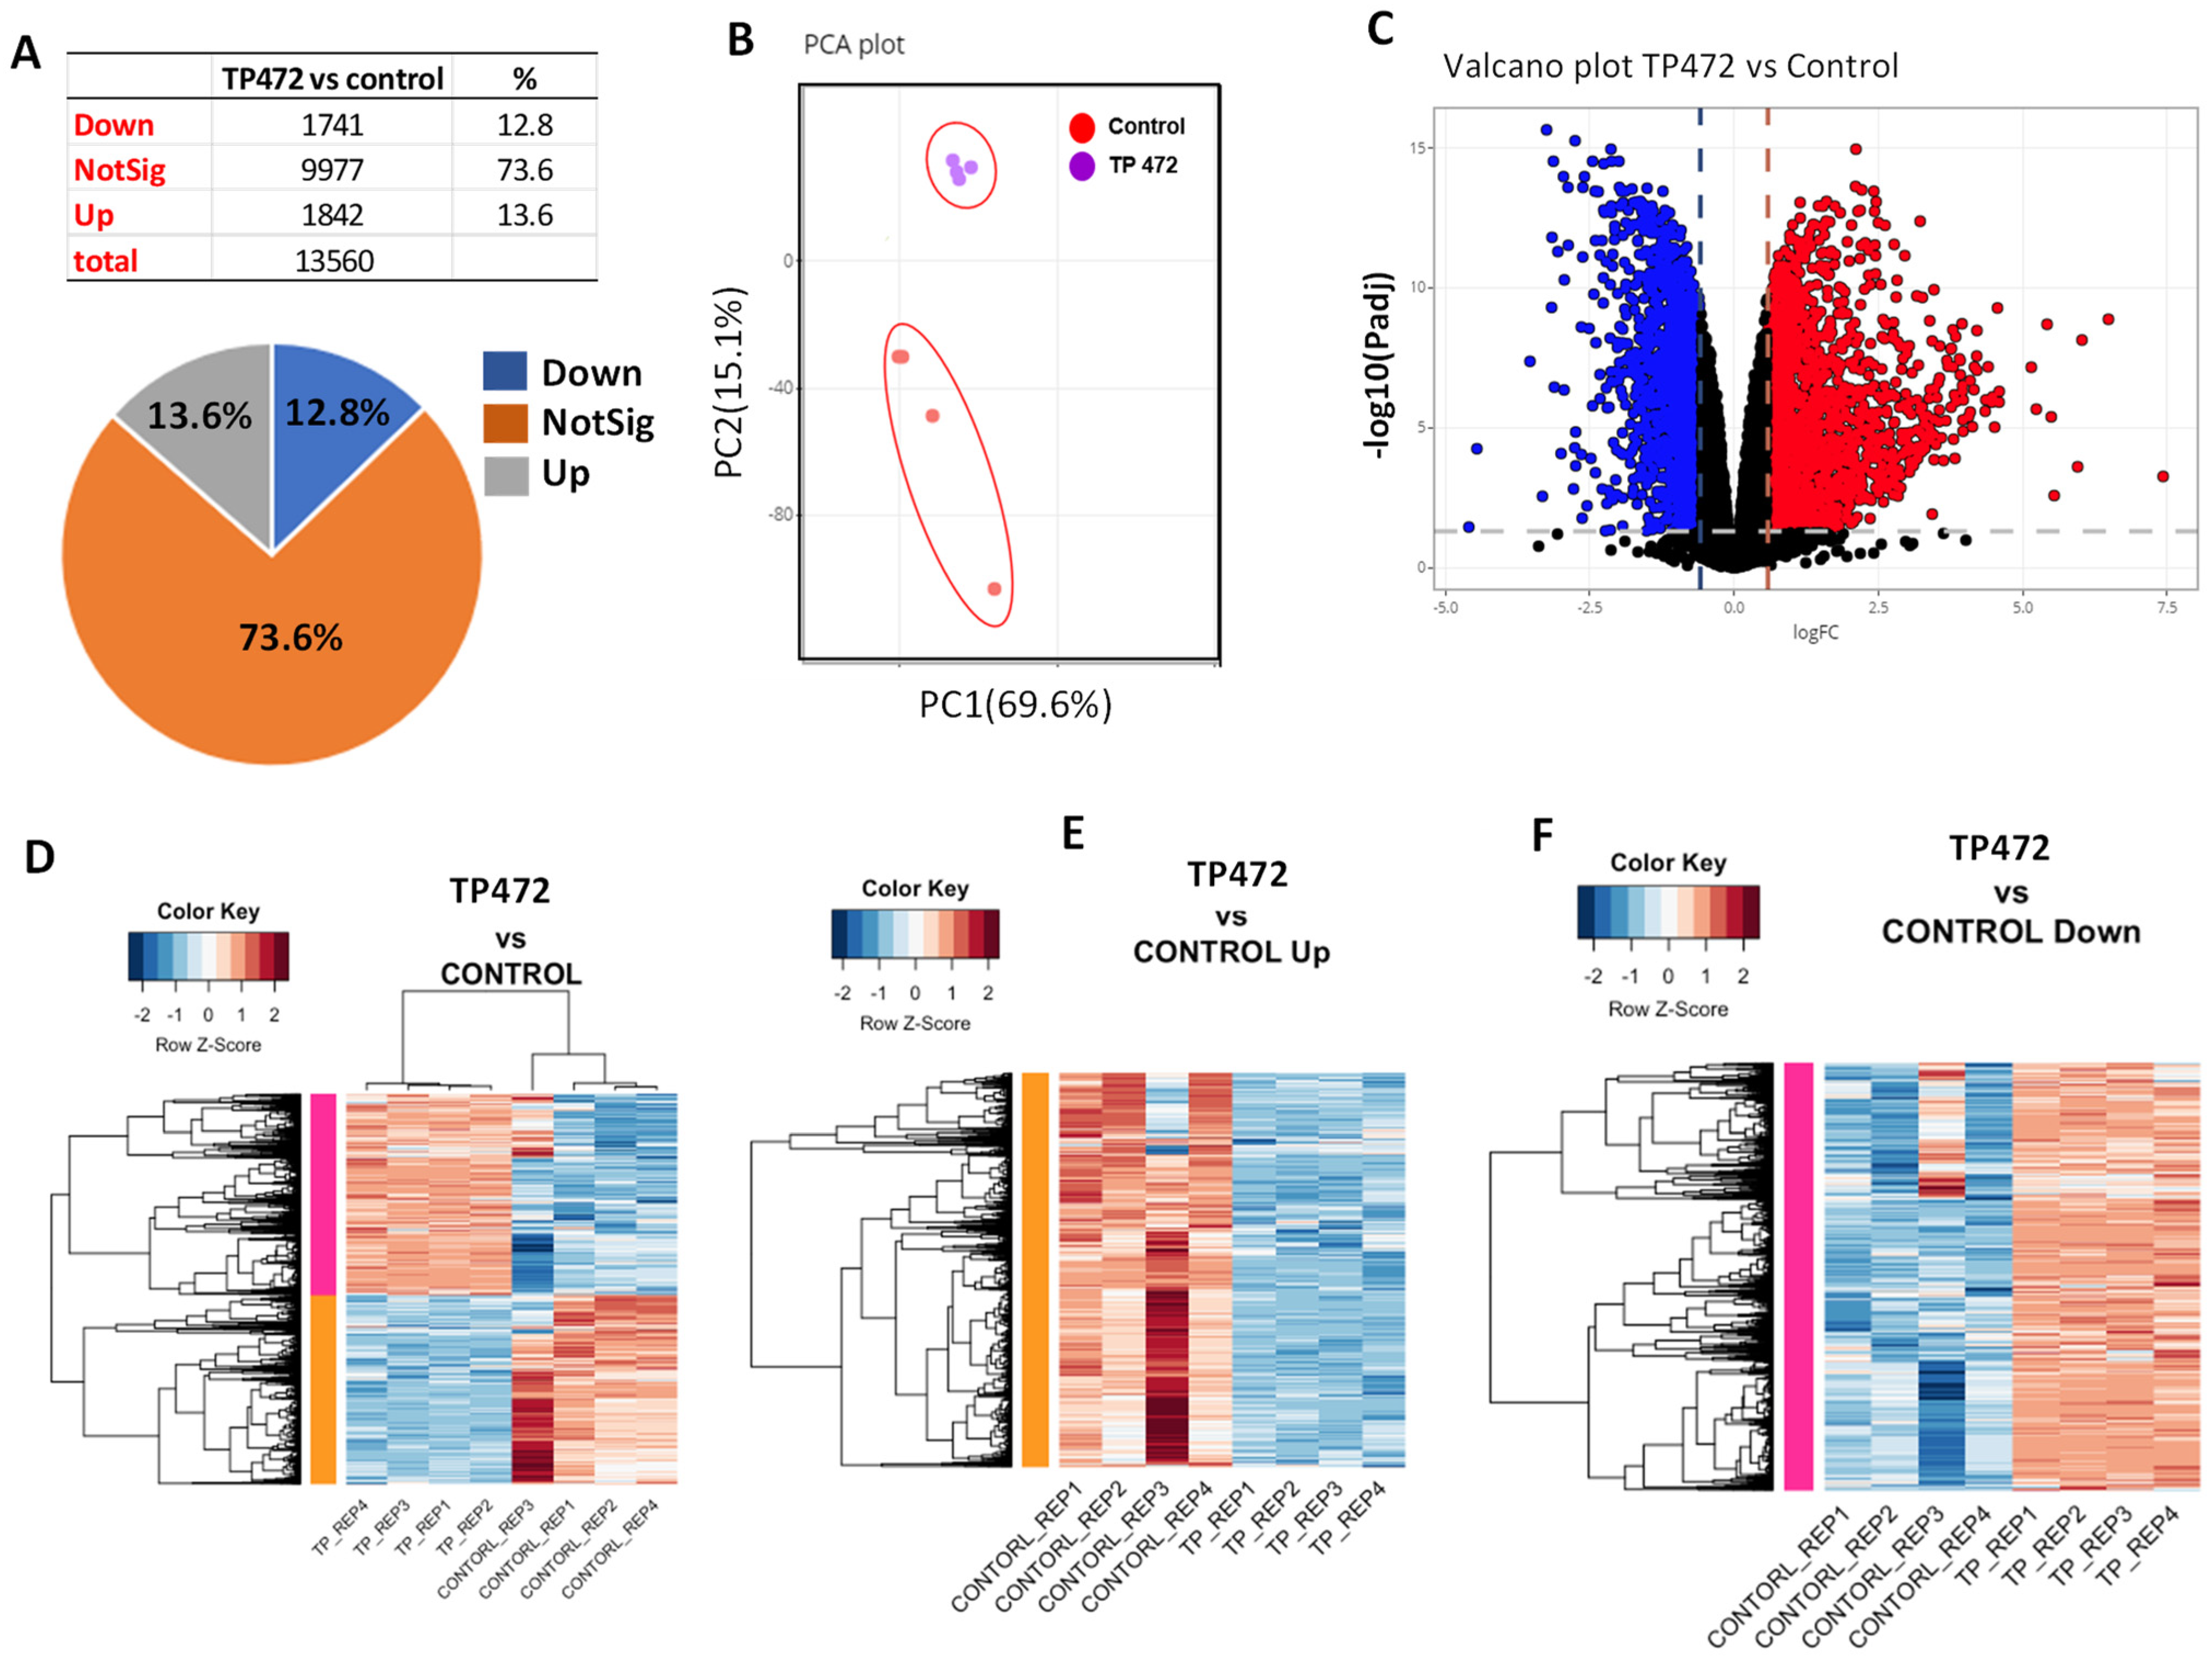
3.5. BRD9 Inhibition Causes Extensive Changes in the uLMS Cell Transcriptome

To determine the mechanistic action of TP-472 inhibition on uLMS cells, RNA-sequencing analysis was performed in control and TP-472 treated cells (n = 4 each). As shown in Figure 4A, TP-472 treatment yielded 3583 differentially expressed genes (DEGs) (1741 down, 1842 up). Principal component analysis (PCA) demonstrated that the expression pattern of the TP-472 group clustered separately from the control group (Figure 4B). Volcano plot analysis revealed the distribution of pronounced changes in response to TP-472 treatment (Figure 4C). Heatmap analysis further demonstrated a distinguished expression pattern in SK-UT-1 cells treated with TP-472 as compared to the control group (Figure 4D–F).

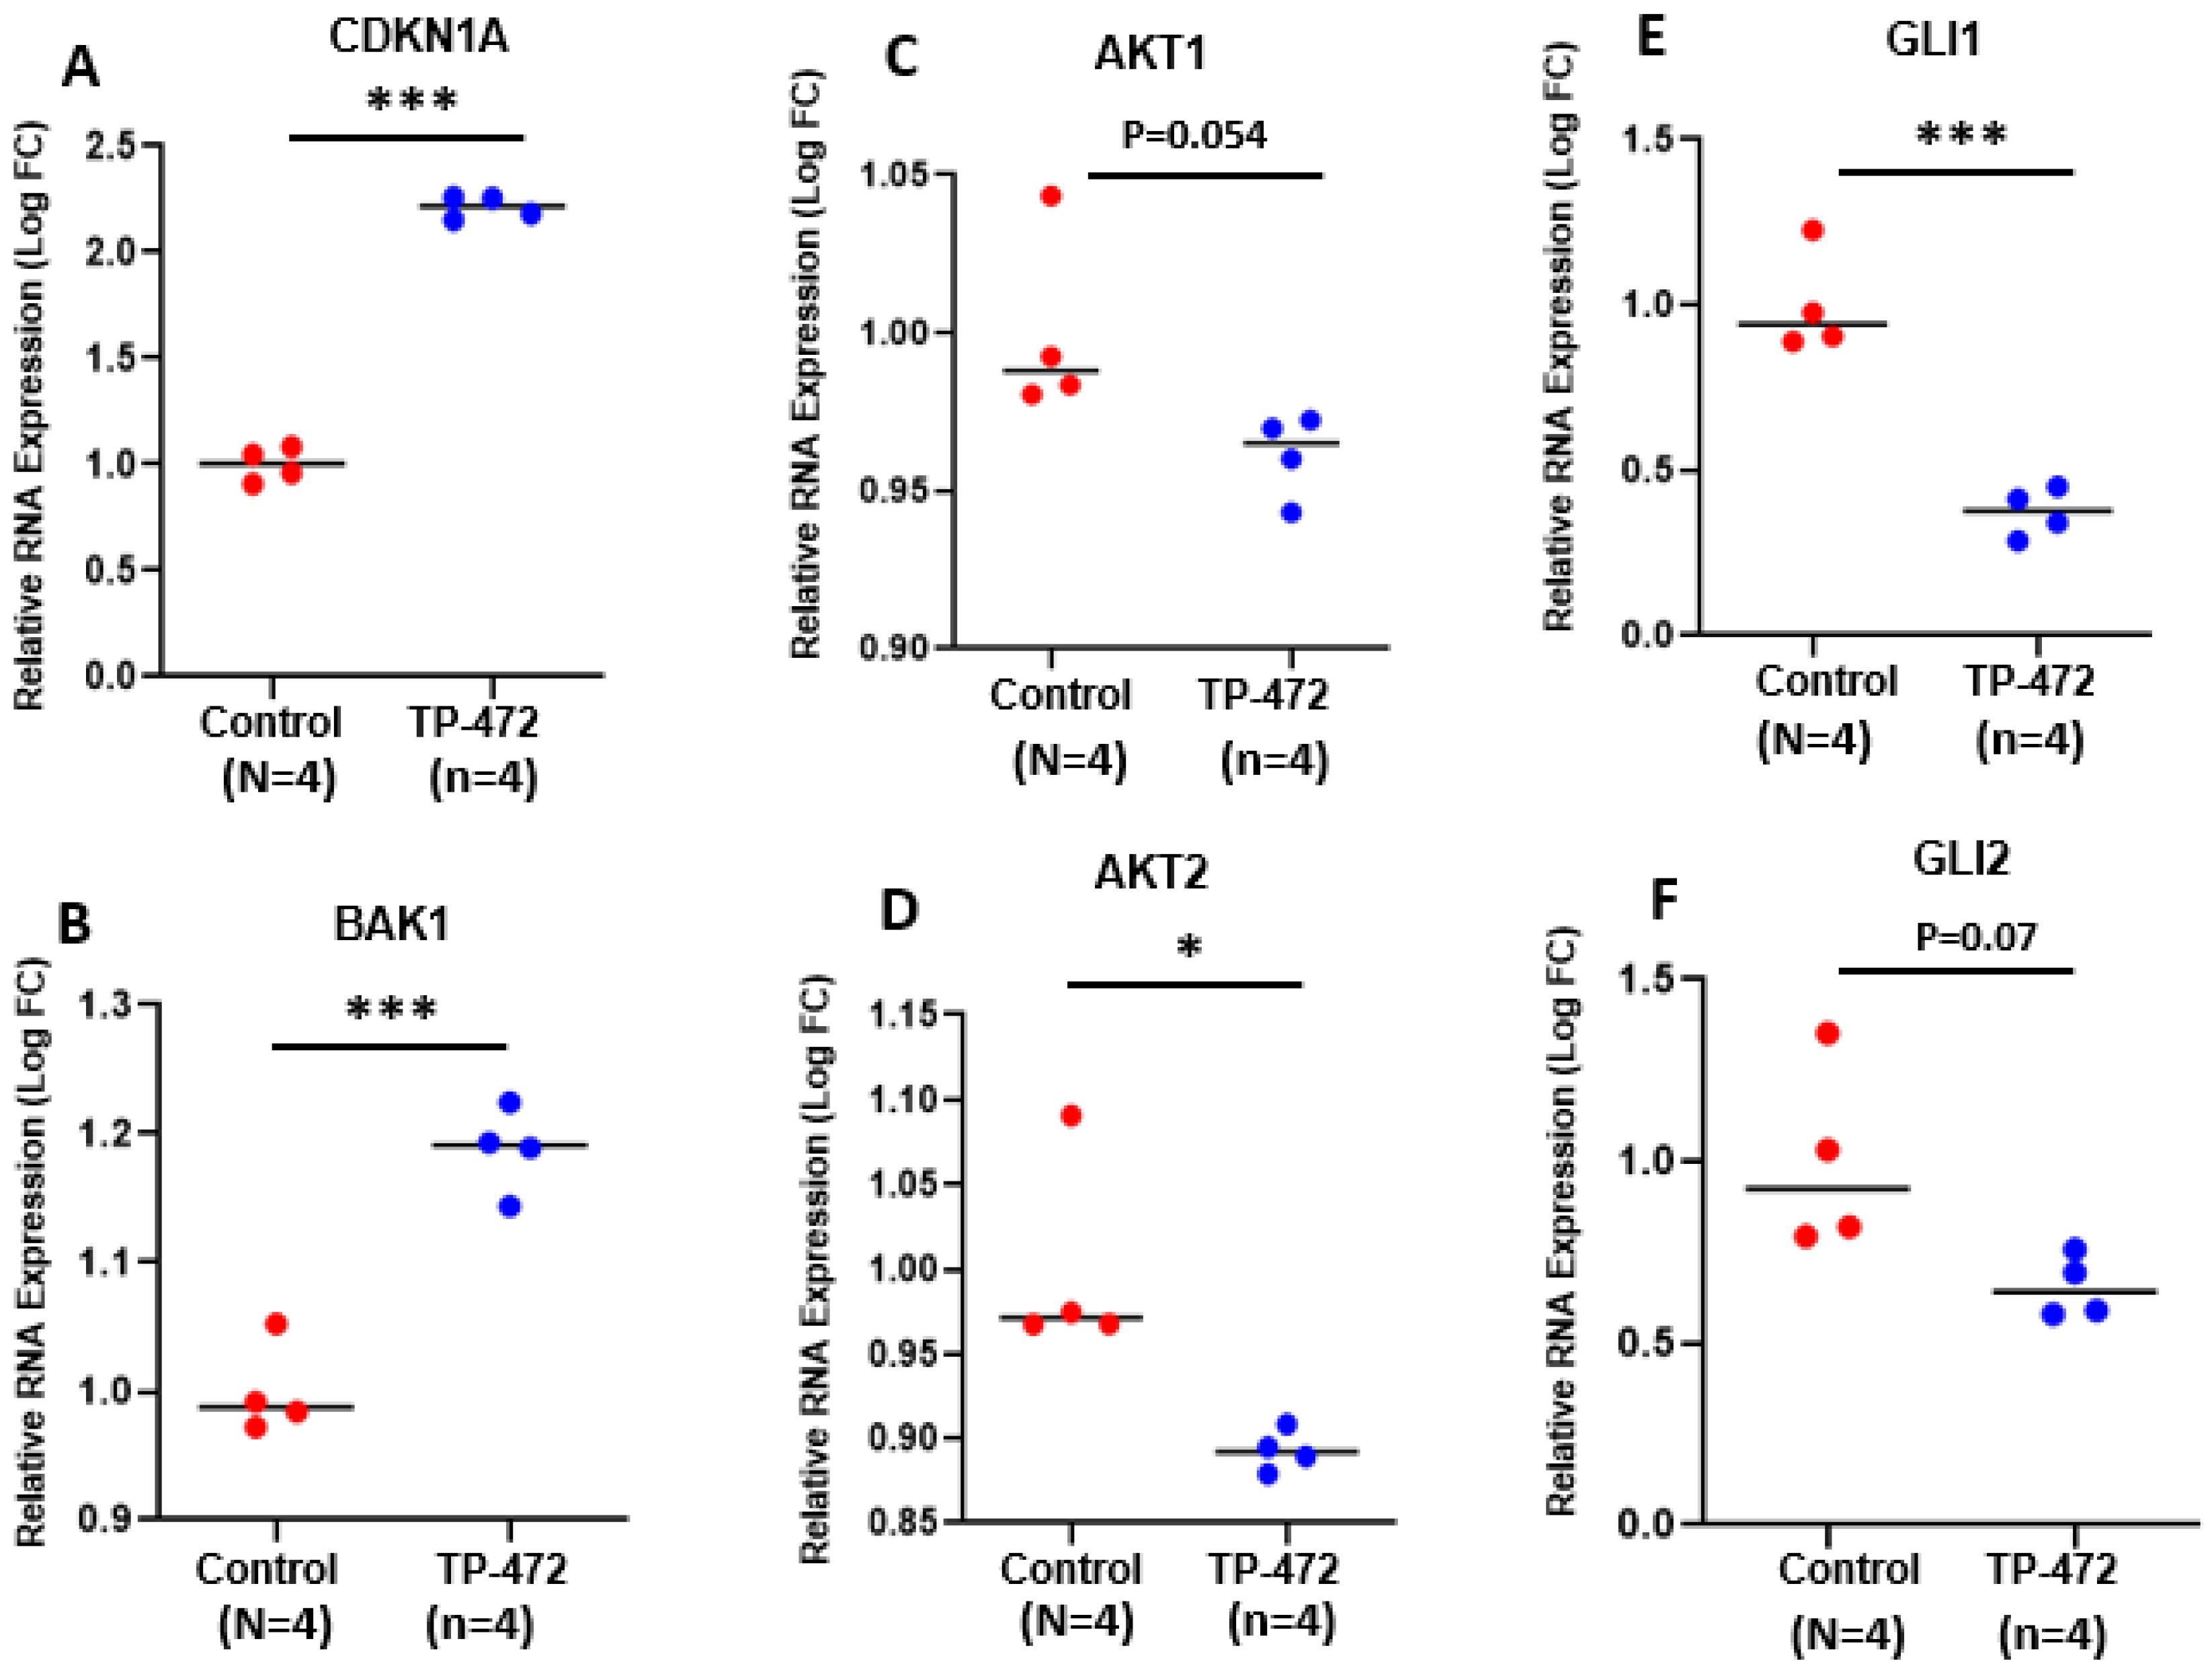
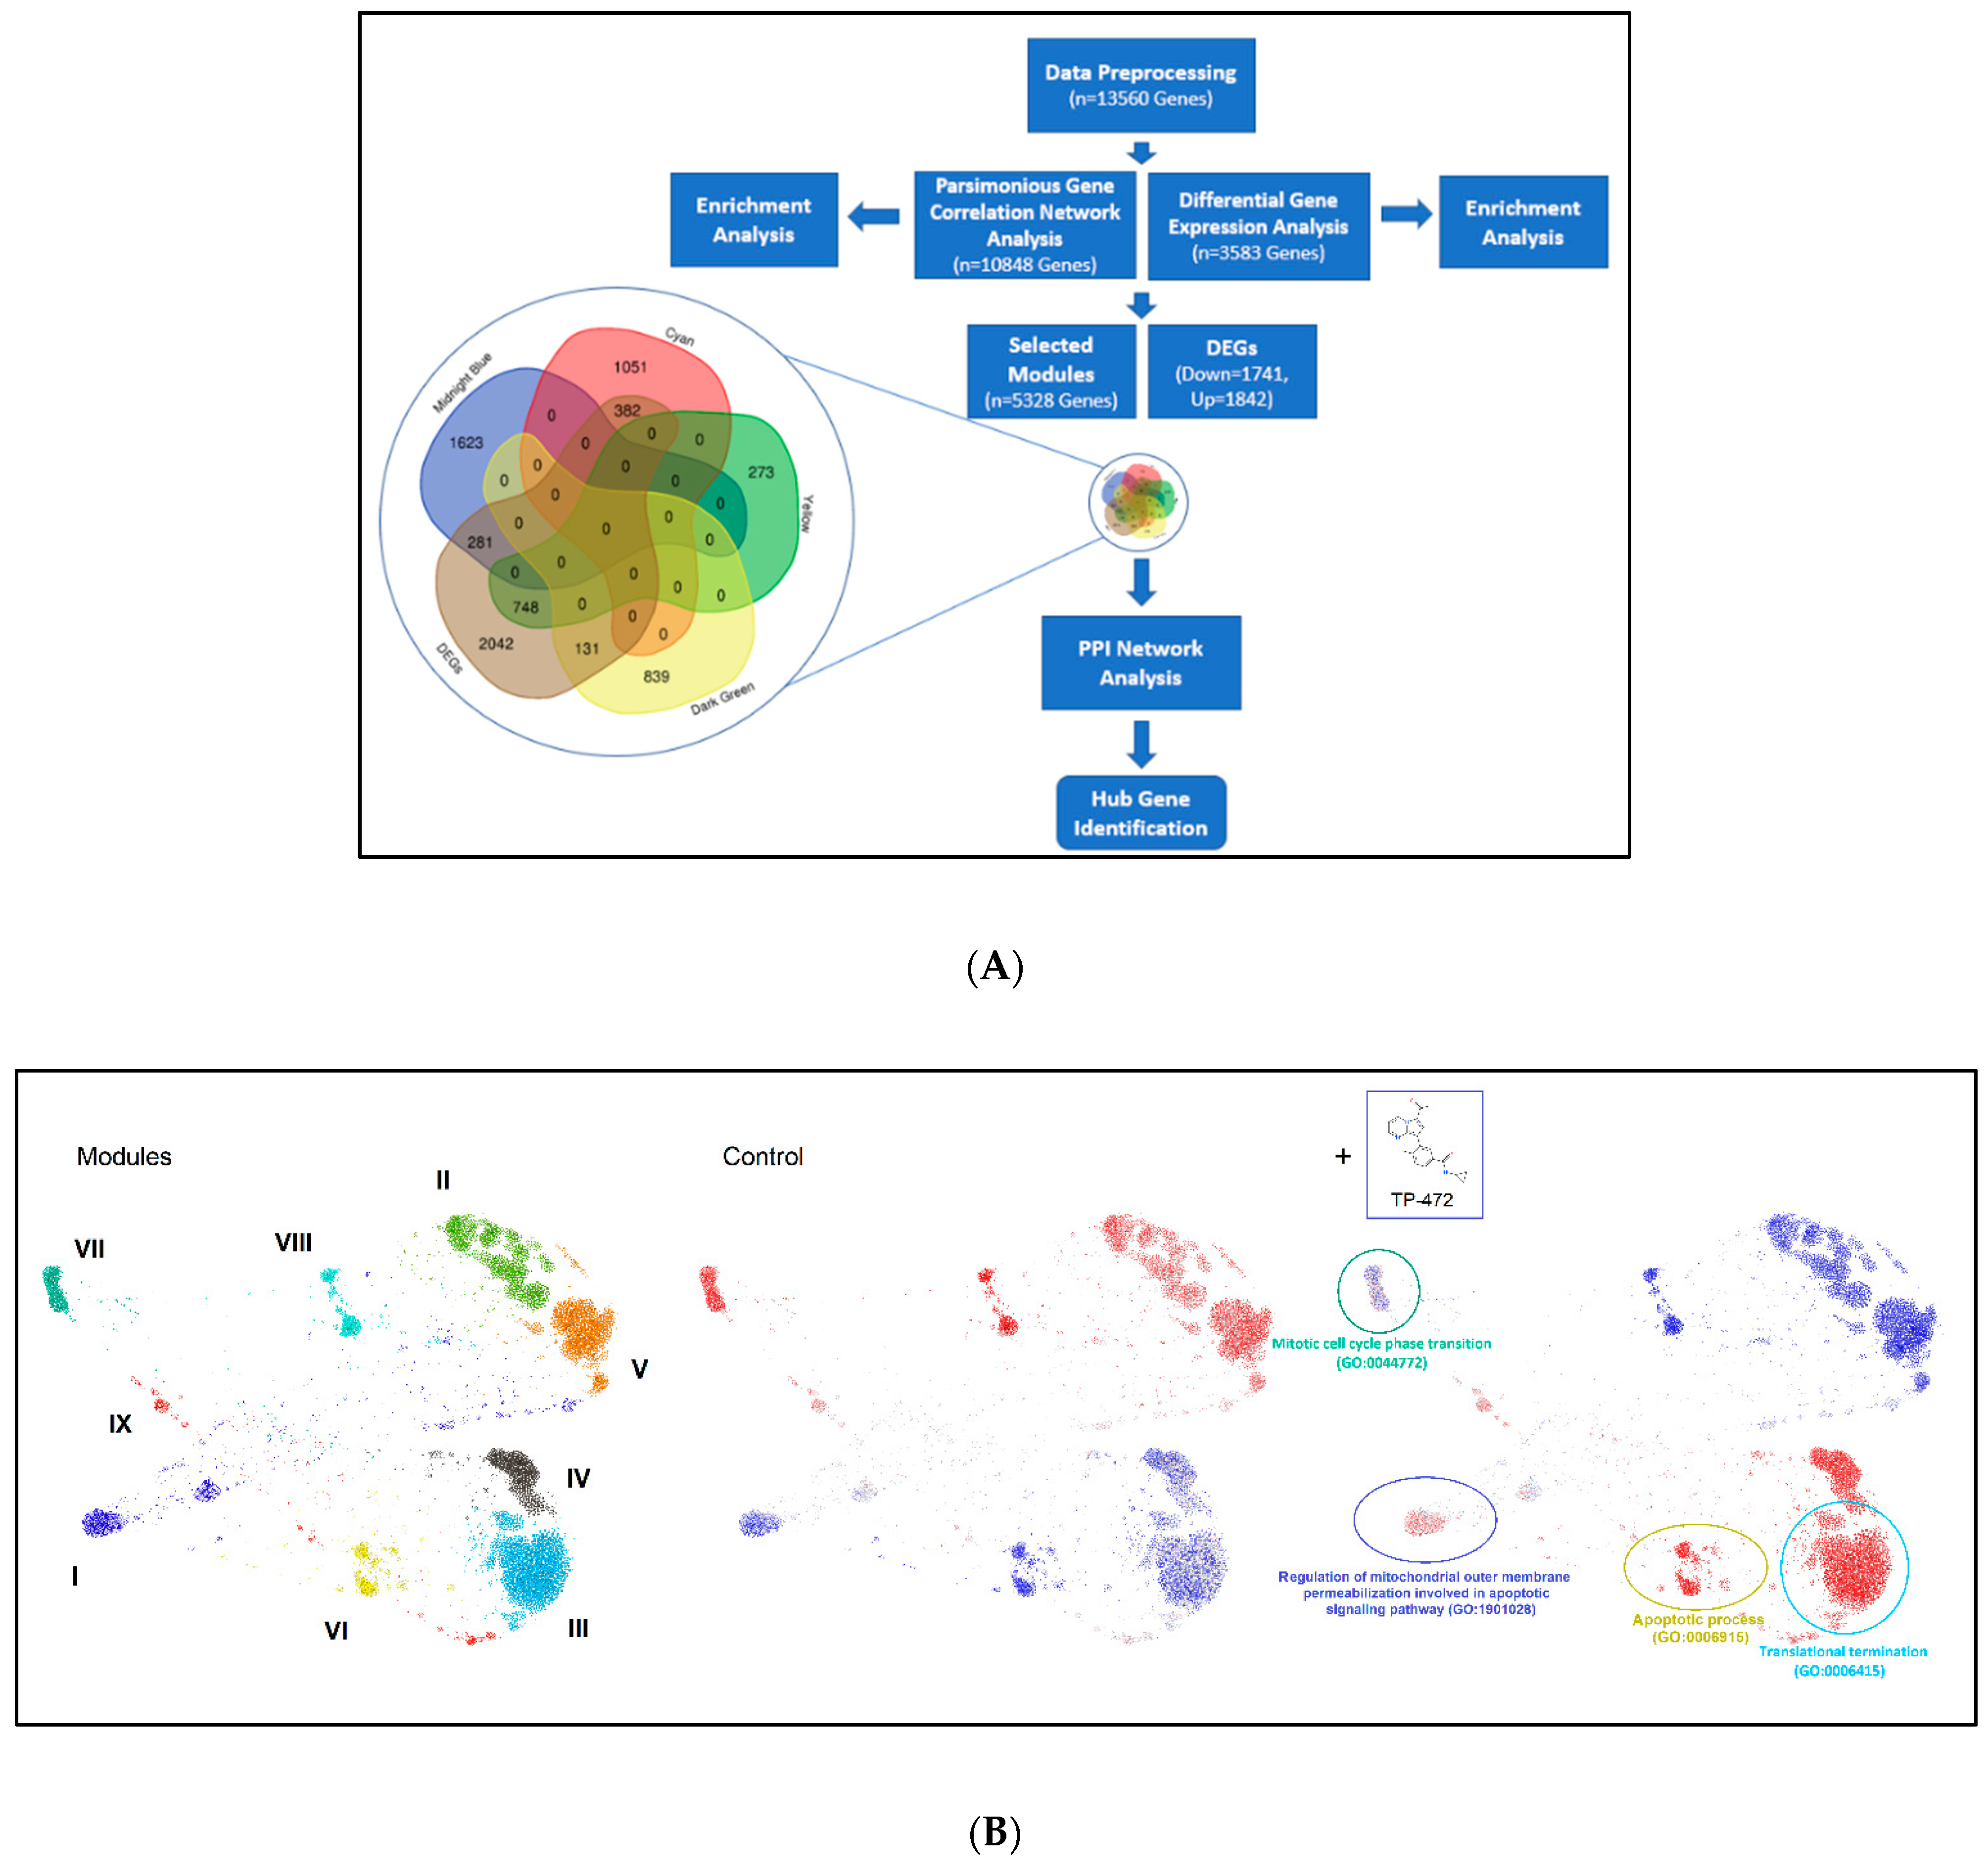
3.5.1. Pathway Analysis of DEGs upon TP-472 Treatment

To gain insight into the biological changes induced by BRD9 inhibition globally, we performed Hallmark pathway analysis and identified several pathways that were significantly altered, including interferon-alpha response, KRAS signaling, MYC targets, MTORC1 signaling, and TNF-a response (Figure 5A–E). Figure 6 shows the expression of genes-related cell cycle and proliferation between control and TP-472-treated uLMS cells. Abnormally increased cell proliferation is one of the most notable characteristics of uLMS. P21 encoded by CDKN1A is a potent inhibitor of cell progression. As shown in Figure 6, CDKN1A expression is significantly higher in TP-472-treated uLMS cells compared to the control. In addition to cell cycle-related genes, the mRNA levels of BAK, the apoptosis regulator, were significantly increased in TP-472-treated SK-UT-1 cells compared to the control. AKT is at the crossroads of cell death and survival, playing a pivotal role in multiple interconnected cellular signaling mechanisms implicated in cell apoptosis and growth [35,36]. As shown in Figure 6, the expression of AKT was markedly decreased in TP-472-treated uLMS cells. The expression of AKT2 is significantly decreased in TP-472-treated uLMS cells (Figure 6). Previously we demonstrated that the Hedgehog pathway is activated in uLMS. In this study, we observed that TP-472 significantly decreased the expression of GLI1 and markedly reduced the GLI2 expression in uLMS cells. These data suggested that TP-472 induced cell cycle arrest and apoptosis and inhibited Hedgehog pathway in uLMS cells.
We also validated the expression of representative cell cycle- and apoptosis-related genes (CDKN1A and BAK) by q-PCR. As shown in Figure S1, the significant increase in expression of CDKN1A and BAK1 upon iBRD9 treatment was consistent with RNA-seq data.

3.5.2. Parsimonious Gene Correlation Network Analysis (PGCNA)

To identify a biologically meaningful gene module, we performed PGCNA. The pipeline of this study is shown in Figure 7A. The co-expression network was constructed using the PGCNA2 package in Python software from the annotated genes, in which nine modules were identified (Figure 7B, left panel). The enrichment results showed that the midnight blue and yellow modules were positively related to apoptosis; cyan and dark green modules were associated with the cell cycle (Figure 7B, middle and right panel). Therefore, subsequent enrichment analyses were performed to obtain further biological insight for the genes in the four constructed modules. The results for all four modules are shown in Table 4. From PGCNA analysis, apoptosis and cell cycle pathways were enriched upon TP-472 treatment. The top 40 hub genes (top 10 hub genes in each module) were screened out from the intersection of the Venn diagram between DEGs and four selected modules. The results are shown in Table S1. The intramodular connectivity of genes in the corresponding modules of interest was measured using the total number of edges linked to each gene, which is represented as the degree in Table S1. Notably, several Hub DEGs, including MYC, FOS, JUN, EGR1, SHH (sonic hedgehog pathway), GRIN1, SOX9, HRAS, IMP3, CDK, TOP2A, TOP2B, among others, are identified upon TP-472 treatment (Table S1).

3.5.3. Inhibition of BRD9 Altered the Gene Expression Correlating to Histone Modifications

To investigate whether TP-472 treatment led to transcriptional changes via epigenomic effects in uLMS cells, we performed enrichment analysis of epigenetic histone markers using the Enrichr web server. As shown in Figure 8A,B, DEGs between control and TP-472 were correlated with histone modifications. Notably, DEGs induced by TP-472 treatment were significantly linked to the H4K27me3, while those suppressed by TP-472 treatment were preferentially associated with H3K4me1, H3K4me2, H3K4me3, and H3K27me3 according to the ENCODE Histone Modifications gene set library. The top 10 terms are shown in the lower panel. These studies suggest that TP-472 treatment may alter the uLMS cell transcriptome via epigenetic mechanisms.

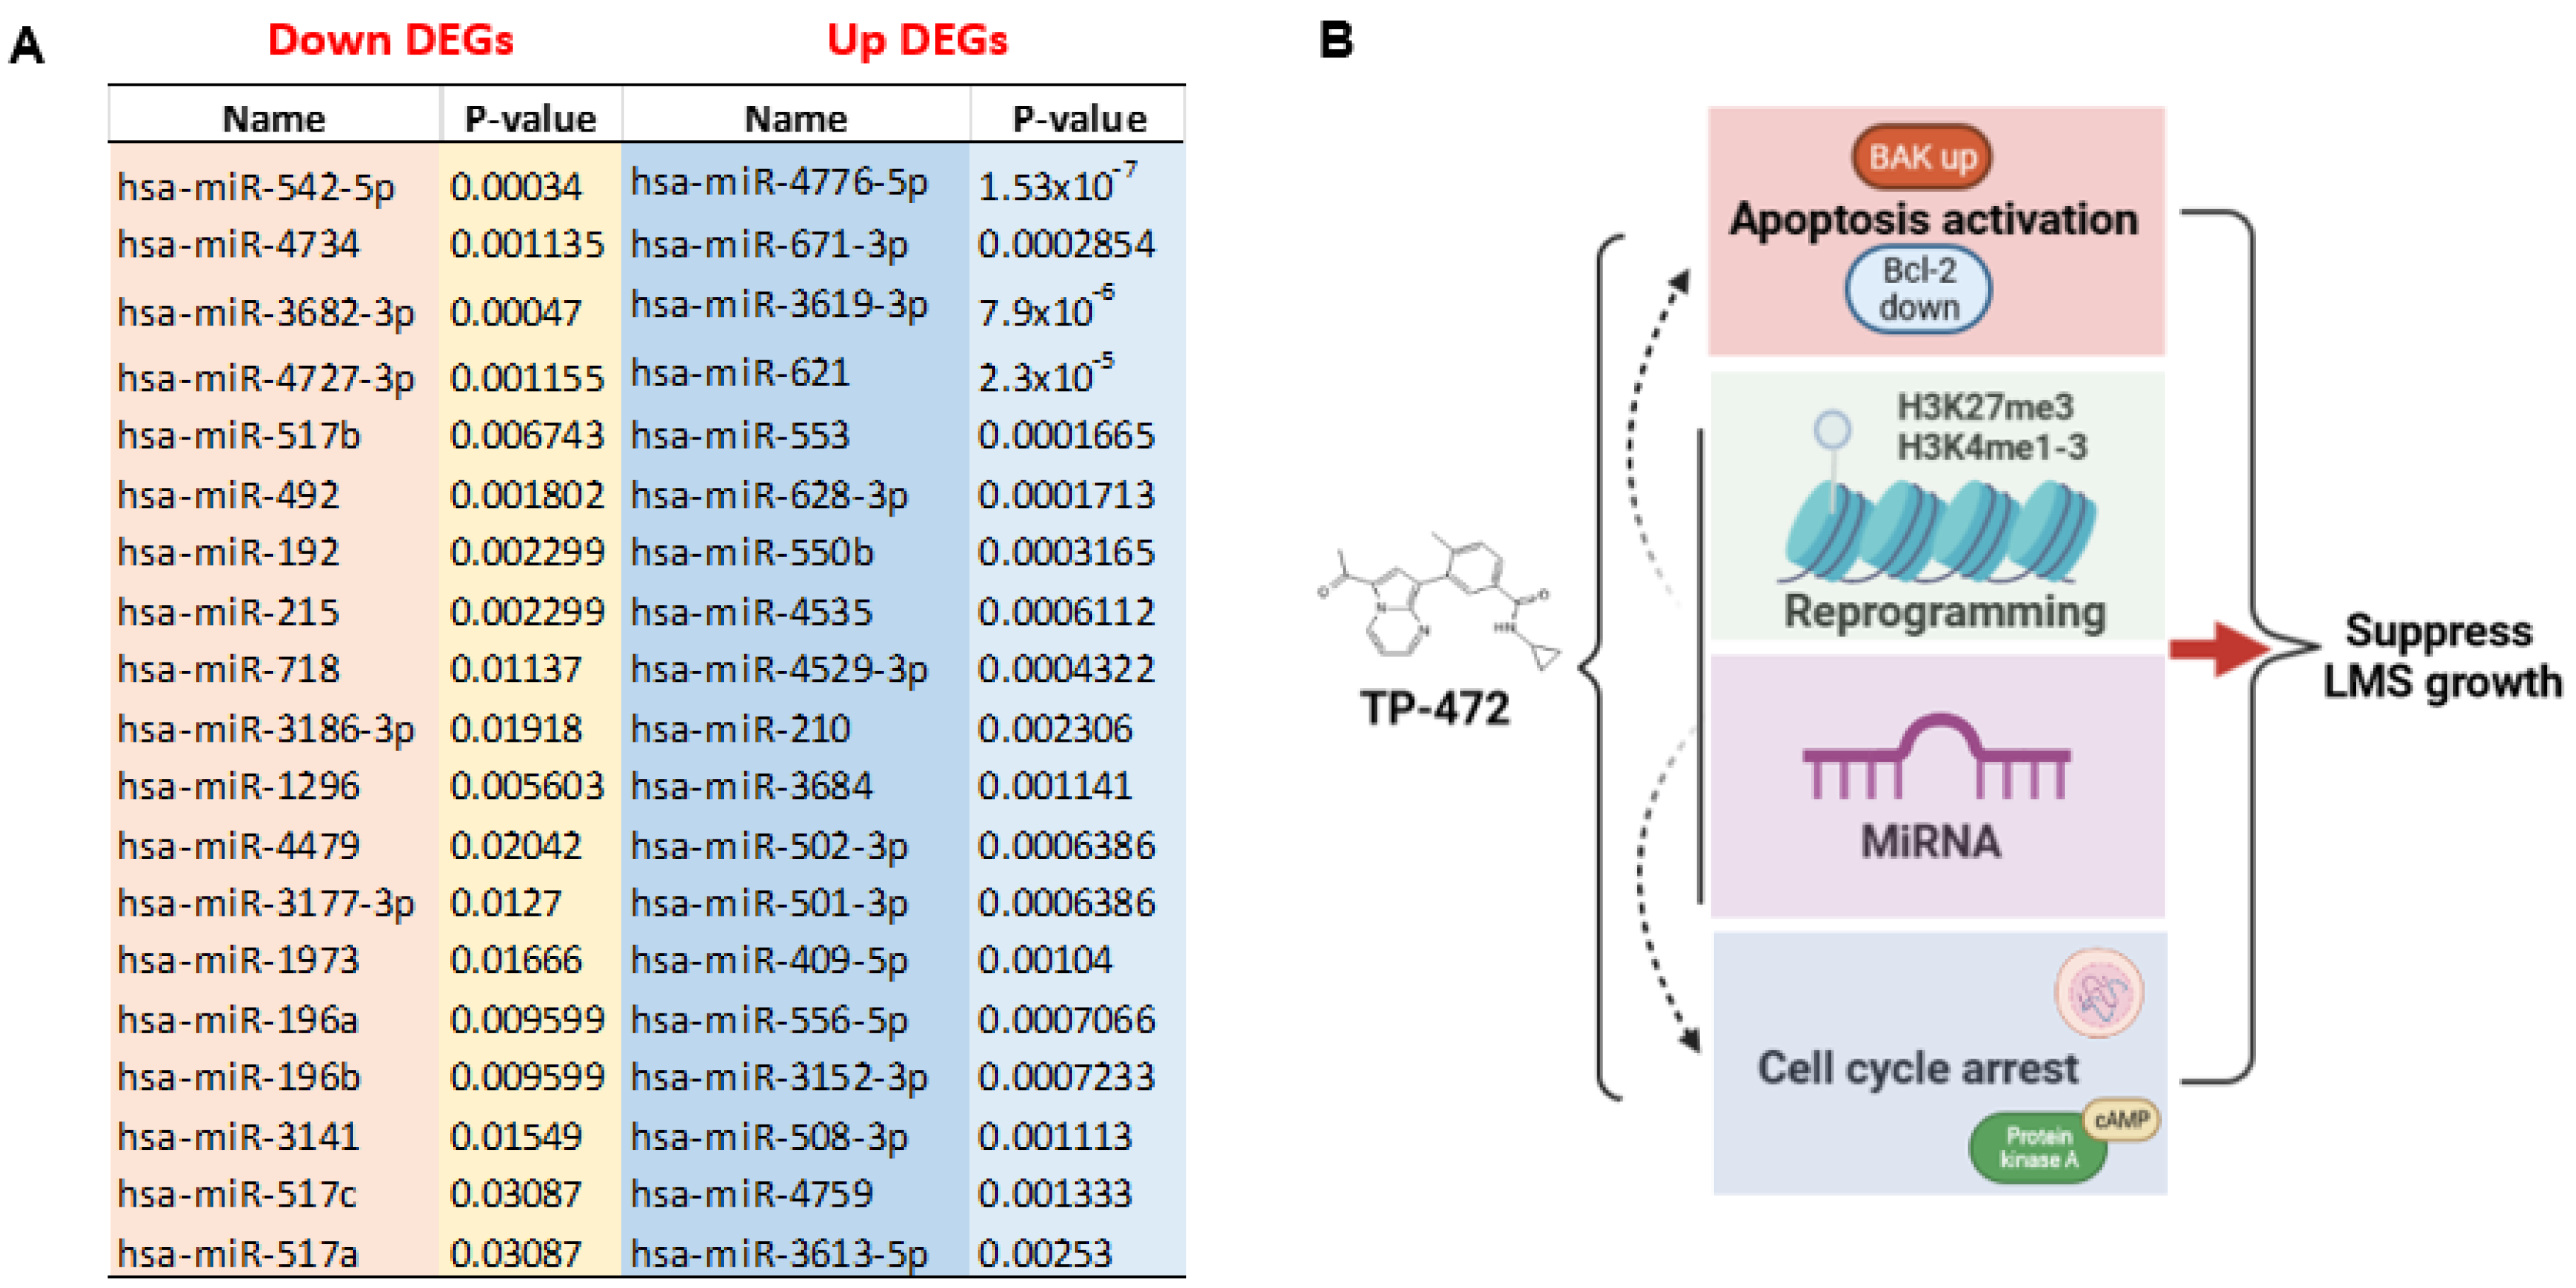
3.5.4. Inhibition of BRD9 Altered Gene Expression Correlating to miRNA Regulation

We used TargetScan microRNA analysis in Enrichr to determine the mechanism underlying the regulation of DEG via miRNA in response to TP-472 treatment. As shown in Figure 9A, genes induced by TP-472 treatment (up) correlated with miRNAs, including hsa-miR-4776-5p, hsa-miR-671-3p, hsa-miR-3619-3p, hsa-miR-621, hsa-miR-553, among others. By contrast, genes suppressed by TP-472 treatment (down) correlated with a distinct set of miRNAs, including hsa-miR-542-5p, hsa-miR-4734, hsa-miR-3682-3p, and hsa-miR-4727-3p among others, suggesting that miRNAs may be involved in regulating gene expression in response to TP-472 treatment.

4. Discussion

Understanding the relationship between the epigenetic regulators and tumorigenesis is crucial for the manipulation of chromatin regulation in cancer therapy [37,38,39,40]. The present study has revealed that BRD9, as the readers of lysine acetylation for regulating the protein-histone association and chromatin remodeling, were upregulated in uLMS tissues and cells. Inhibition of BRD9 increased cell death, induced cell cycle arrest, altered several other critical biological pathways, and reprogrammed the onco-epigenome in uLMS cells, suggesting the critical role of BRD9 in the pathogenesis of uLMS.
The association and functional studies on BRDs in cancer biology have been extensively investigated in several types of cancer. For example, BRD specifies the control mixed lineage leukemia phenotype [41]. BRDs played a role in regulating key genes from chromatin and were associated with MLL fusion oncoproteins in leukemogenesis [42,43]. BRD2 is essential for proinflammatory cytokine production in macrophages. BRD2 and BRD4 physically associate with the promoters of inflammatory cytokine genes in macrophages. BRD inhibition by JQ1 can block this association and reduce the IL-6 and TNF-a levels. These studies suggested that targeting the BET proteins will benefit hyperinflammatory conditions associated with high levels of cytokine production [44]. In ovarian cancer, JQ1 suppresses tumor growth associated with cell cycle arrest, apoptosis induction, and metabolic alterations [45]. In Ewing Sarcoma, co-immunoprecipitation revealed an interaction of BRD4 with CDK9. Combined treatment of Ewing Sarcoma with BRD- and CDK9-inhibitors resulted in enhanced responses compared to individual drugs not only in vitro but also in a preclinical mouse model in vivo [46]. A recent study reported that BETi GS-626510 (10 mg/kg twice a day treatment for 13 days) significantly decreased the in vivo uLMS growth compared to vehicle control [47]. In addition to the Bromo- and extra-terminal domain (BET) family, the role of the non-BET family has been investigated recently. For instance, non-BET family inhibitor NVS-CECR2-1 inhibits chromatin binding of CECR2 BRD and displaces CECR2 from chromatin within cells. NVS-CECR2-1 exhibits cytotoxic activity against various human cancer cells, killing SW48 colon cancer cells by inducing apoptosis [48]. In melanoma, the iBRD9 (TP-472) blocked tumor growth by suppressing ECM-mediated oncogenic signaling and inducing apoptosis [34]. In renal clear cell carcinoma, the combined analysis of BRD9 and other chromatin regulated genes showed a significant association with the high-risk groups and lower overall survival, providing a survival prediction model for further research investigating the role of the expression of BRD genes in cancers [49].
uLMS is a rare but extremely aggressive tumor characterized by therapy resistance. Consequently, uLMS patients commonly present high rates of tumor recurrence, progression and metastasis [4]. While the malignant potential of uterine fibroids is extremely low, the possibility of transforming of UFs to uLMS has been proposed [6,50]. Therefore, other mechanisms should play a critical role in the development and progression of this aggressive cancer [5,51]. In this study, we demonstrated for the first time that expression levels of non-BET family member BRD9 are aberrantly upregulated in uLMS compared to adjacent myometrial tissues and higher in uLMS cells as compared to myometrial and benign UF cells, respectively, indicating the key role of BRD9 protein in the pathogenesis and progression of this cancer.
The development and use of small chemical inhibitors are fundamental and critical to the preclinical evaluation of BRDs as targets. Recently, a novel non-BET inhibitor, TP-472, has been developed with high potency for BRD9 [52]. In this study, we investigated the impact of TP-472 on uLMS cells aberrantly overexpressing BRD9 and demonstrated that TP-472 significantly inhibited uLMS proliferation concomitantly with a dose dependent decrease in BCL-2 expression. This study is consistent with the previous observation that iBRDs induced apoptosis by activating the expression of several pro-apoptotic genes in melanoma and MLL-fusion leukemia cells [34,42].
To further determine the mechanistic action of BRD9 inhibition, we performed comparative transcriptome-wide RNA-sequencing in uLMS cells treated with vehicle or TP-472. Previously, transcriptome-wide mRNA profiling in melanoma cells demonstrated TP-472 not only upregulated pro-apoptotic genes such as BAX, CDKN1A, GADD45A, GAD45B, among others, associated with the p53 pathway, but also downregulated several extracellular matrix proteins, which are required for tumor growth [34]. Our transcriptomic profiling analysis in uLMS revealed that multiple pathways were altered in response to TP-472 treatment. For instance, signatures enriched in uLMS cells, including MYC targets, interferon-alpha/gamma, K-ras, TNF signaling via NFkB, and MTORC1 signaling were observed between TP-472 and the control group. These newly identified pathways in uLMS in response to TP-472 treatment suggest that TP-472 targets common pathways and oncogenic transcriptome networks based on different types of cancer cells. Notably, using the PGCNA approach, we identified nine modules affected by iBRD9. In this study, we focused on cell cycle and apoptosis modules that correlated with uLMS phenotype changes induced by iBRD9. The expression of genes belonging to these two models was significantly altered. In addition, we validated the expression of cell cycle and apoptosis-related genes and further demonstrated that TP-472 treatment increased the expression levels of the cell cycle arrest- and apoptosis-related genes, suggesting that TP-472 suppressed the uLMS growth via induction of both apoptosis and cell cycle arrest. Several Hub DEGs, including MYC, FOS, JUN, EGR1, SHH, GRIN1, SOX9, HRAS, IMP3, CDK1, TOP2A, TOP2B, among others, are identified upon iBRD9 treatment. MYC is known to cooperate with KRAS in driving many cancers and contributes to many cancer hallmarks [53]. The MYC gene is a proto-oncogene and encodes a nuclear phosphoprotein that plays a role in cell cycle progression, apoptosis, and cellular transformation. The expression changes of MYC as identified in the Hub DEGs are consistent with Hallmark pathway analysis, showing the MYC pathway is enriched in response to TP-472 treatment, indicating the important role of the MYC hub and related network in the pathogenesis of uLMS. This study observed the compensatory induction of MYC RNA expression and HRAS by iBRD9. Since MYC is known to undergo a variety of posttranscriptional modifications, including acetylation, ubiquitinoylation, phosphorylation, glycosylation, SUMOylation, and phosphorylation-directed isomerization, which influence its stability, location, and activity [54,55,56,57], increased effort to deciphering the role of MYC pathway and it network in the pathogenesis of uLMS studies is needed. Importantly, simultaneously inhibiting BRD9 and MYC may efficiently induce growth arrest and apoptosis of uLMS cells, suggesting the potential of a combination treatment strategy.
The jun and fos families are involved in the regulation of cell proliferation, differentiation, and transformation [58,59]. Fos can dimerize with proteins of the jun family, thereby forming the transcription factor complex AP1 and enhancing the transcriptional activity. The AP1 complex can interact with bZIP proteins and structurally unrelated transcription factors. This cooperative recruitment of transcription factors, coactivators and chromatin remodeling factors to promoter and enhancer regions mediates the selective regulation of transcription activity [60]. In this study, the fos and jun expression was increased in iBRD9-treated uLMS cells. Previous studies demonstrated a discrepancy between jun/fos proto-oncogene mRNA and protein expression in other diseases [61,62]. Further functional studies are needed to investigate the role of fos/jun families in response to iBRD9 treatment. EGR1 as an additional transcriptional regulator in Hub DEGs plays an important role in regulating the transformation, cell survival, proliferation, and cell death. In this study, TP472 increased the expression of EGR1 in uLMS, providing a mechanism of TP-472-induced inhibition of cell proliferation. Notably, the role of EGR1 in tumor formation is controversial in diseases and conditions. For example, EGR1 functions as a tumor suppressor by monitoring DNA damage, promoting cell apoptosis, and enhancing the anticancer effects of radiotherapy and chemotherapy. EGR1 can activate the expression of p53/TP53, and thereby helps prevent tumor formation. However, in certain circumstance such as hypoxic microenvironments, the increase in EGR1 expression maintains tumor cell survival, proliferation, metastasis, and tumor angiogenesis [63]. SOX9 (hub DEG) as a transcriptional factor is also identified in this study.
Several transcription factors of BRD9 have recently been identified [64]. Notably, the master transcription factor Sox 17 recruits BRD to a subset of enhancers associated with genes involved in the cell cycle and angiogenesis, among others. In this regard, BRD9 acts as a molecular bridge between the subset of enhancers and the transcription machinery [64]. Therefore, a deep dive into the role and functional mechanism of BRD9 transcription factors will help us to understand the pathogenesis of malignant uLMS.
Notably, the SHH pathway is observed in our study as the Hub pathway in response to TP-472 treatment. We have demonstrated that the Hedgehog pathway played a critical role in uLMS pathogenesis via GLI molecules [5,65,66]. In this study, we demonstrated that inhibition of BRD9 downregulated the expression of GLI1/2, the key components in the Hedgehog pathway, indicating the interplay between BRD9 and the Hedgehog pathway implicated in the uLMS pathogenesis. HRAS plays an important role in cell division, the process by which cells mature to carry out specific functions (cell differentiation), and the self-destruction of cells (apoptosis) [67]. It has been shown that TP-472 treatment leads to upregulation of GADD45A, the pro-apoptosis gene in melanoma cells [34]. GADD45A has a direct role in p38 activation by HRAS. Another required component for HRAS growth arrest is GADD45A, which is known to be regulated by p53 [67]. Interestingly, the expression level of HRAS was increased in TP-472-treated uLMS cells suggesting that HRAS might cause apoptosis in TP-472-treated uLMS cells via GADD45A.
It has been reported that pathways involved in the regulation of cell cycle and apoptosis were most significantly enriched in direct targets of IMP3 at transcriptome and translatome levels, respectively. IMP3 silencing downregulated several well-known apoptosis regulators such as BIRC5, RAF1, and ESPL1 [68]. Overexpression of IMP3 in TP-472-treated uLMS cells suggests that IMP3 plays a significant role in the uLMS pathogenesis.
The role of CDK1 in gynecological cancer is limited to ovarian and endometrial cancer [69,70]. The inhibition of CDK1 activity induced cell apoptosis and caused the G2/M phase arrest of cell cycle in endometrial cancer cells [70]. Zhang et al. showed that CDK1 inhibition by shRNA repressed the cell proliferation, and the cell numbers in G2/M phase and cell apoptosis rate were increased in both SK-OV-3 and OVCAR-3 cells [69]. Ying et al. found that CDK1 was one of the hub genes in the pathogenesis of endometrial cancer. CDK1 inhibitor, RO3306, induced cell apoptosis and caused G2/M phase arrest of the cell cycle in endometrial cancer cells [70]. Accordingly, our bioinformatics analysis results revealed that the expression level of CDK1 in TP-472-treated uLMS cells was decreased. Further experimental studies are required to determine whether CDK1 could serve as a novel therapeutic target for uLMS patients.
TOP2A is expressed predominantly in cycling cells and plays key roles in DNA replication, chromosome segregation, and transcription, while TOP2B participates mainly in transcription, and it is ubiquitously expressed in both cycling and postmitotic cells [71]. If sister chromatids are not fully separated, cells will be arrested at the G2 phase. Accordingly, by blocking the TOP2A’s function after chromosome condensation, cells arrested at metaphase, chromosomes failed to separate, and anaphase bridges formed, resulting in partial or complete chromosome gains or losses and polyploidy [72]. Histone deacetylases (HDACs) modify nucleosomal histones. The results of the coimmunoprecipitation experiments indicated that TOP2A and TOP2B are substrates for HDAC1 and HDAC2, Class I HDAC enzymes, and that complexes containing HDAC1 or HDAC2 can increase TOP2 activity [73]. Our previous study showed that HDAC inhibitors induced apoptosis of uterine fibroid cells and cell cycle arrest [74]. In this study, we demonstrated that inhibition of BRD9 downregulated the expression of TOP2A and TOP2B; therefore, it is plausible that iBRD9 exerts its effect via HDACs. These results suggested that iBRD9 altered gene set comprises a distinct and functionally connected group of targets in uLMS phenotype. We will perform further analysis with other enriched modules to obtain more comprehensive knowledge of iBRD9 action and mechanism. These hub genes have great predictive value for the prognosis and progression of uLMS and may contribute to the understanding of basic and clinical research on uLMS.
Previously, it has been reported that crosstalk between different epigenetic mechanisms regulated gene expression. To determine the relation between BRD9 and other histone marks, we analyzed the epigenome alterations associated with differentially expressed genes (DEGs) upon TP-472 treatment. Notably, we observed that DEGs in response to TP-472 treatment were significantly associated with the enrichment of several histone marks, including H3K27me3, H3K4me1, H3K4me2, and H3K4me3. It was previously reported that BET BRDs play a role in the installing histone methylation. For instance, blocking readers of H3K27ac by BET inhibitor (JQ1) abolished H3K27ac-induced H3K4me3 installation and downstream gene activation [75]. Although epigenetic changes correlating to the uLMS phenotypes have been reported in uLMS [65,76,77,78], our findings herein, to our knowledge, present the first evidence showing that non-BET BRDs may play a critical role in crosstalk with histone marks, implicating non-BET BRDs in the complex oncogenic epigenome network contributing to the pathogenesis of malignant uLMS.
miRNAs are short (~22 nucleotides) non-coding RNAs that regulate post-transcriptional gene expression by influencing the translation or stability of target mRNAs. The interplay between miRNAs and epigenomic marks has been widely reported, including uLMS [79,80]. In this study, we demonstrated that miRNAs might play a critical role in regulating gene expression in uLMS cells in response to TP-472 treatment. We identified several miRNAs that correlated with DEGs either up or downregulated by TP-472 treatment. These miRNAs have not been reported in the uLMS, broadening the knowledge that BRDs may alter the transcriptome via miRNA-mediated gene regulation. Our studies emphasize that pharmacological inhibition of BRD9 suppressed the development of uLMS. Additional studies are needed to uncover the BRD9 mechanism of action further.
We propose a mechanistic model for targeting non-BET BRDs in uLMS based on our novel findings herein that: (1) BRD9 expression is abnormally upregulated in uLMS tissues and cells; (2) targeting BRD9 alters the uLMS phenotype with a decrease in cell proliferation and anti-apoptotic marker BCL-2; (3) TP-472 altered several key pathways and reprogrammed the oncogenic epigenome and miRNA network to suppress the uLMS phenotype, leading it to be a new option for uLMS treatment (Figure 9B).

5. Conclusions

Our study demonstrates for the first time that BRD9 expression is deregulated in human uLMS tissues and cell lines compared to MM+uLMS and uterine fibroid/myometrial cell lines, respectively. Furthermore, inhibition of BRD9 suppresses the uLMS phenotype by sculpting the transcriptome, reprogramming the oncogenic epigenome, and altering the miRNA-mediated gene regulatory network (Figure 9B). Our studies broaden the knowledge about the role of BRD proteins in the pathogenesis of cancers. Accordingly, targeting non-BET BRDs in malignant uLMS may provide a promising and novel strategy for treating patients with this aggressive uterine cancer.

Supplementary Materials

The following supporting information can be downloaded at: https://www.mdpi.com/article/10.3390/cells11142160/s1, Figure S1: Validation of p21 and BAK gene expression; Table S1: Top 40 hub genes shared between DEGs and four selected modules.

Author Contributions

Conceptualization, Q.Y.; data curation: Q.Y. methodology, Q.Y., M.V.B. and A.F.; formal analysis, Q.Y., M.V.B., A.F., A.K. and R.R.L. funding acquisition, Q.Y., T.G.B. and A.A.-H.; Supervision, Q.Y., A.F. and A.A.-H., writing-original draft, Q.Y., writing-review & edits. Q.Y., M.V.B., A.F., R.R.L., H.S., T.G.B. and A.A.-H. All authors have read and agreed to the published version of the manuscript.

Funding

This study was supported in part by National Institutes of Health (NIH) grants RO1 HD094378; RO1 ES028615; U54 MD007602, RO1 HD094380, R01HD087417, and HD106285.

Institutional Review Board Statement

This study was approved by the Institutional Review Board (#20-1820) at the University of Chicago.

Informed Consent Statement

Informed consent was obtained from all subjects involved in the study.

Data Availability Statement

Raw FASTQ files were deposited in the NCBI Gene Expression Omnibus (GSE205775).

Acknowledgments

We would like to thank the University of Chicago Genomics core and Bioinformatic team for their help with the transcriptome-wide study. We would like to thank The University of Chicago Human Tissue Resource Center (RRID:SCR 019199), especially Shihong Li, and Gong Can, for their assistance with the histology and immunohistochemistry study.

Conflicts of Interest

The authors declare that they have no conflict of interest.

References

  1. D’Angelo, E.; Prat, J. Uterine sarcomas: A review. Gynecol. Oncol. 2010, 116, 131–139. [Google Scholar]
  2. Seagle, B.L.; Sobecki-Rausch, J.; Strohl, A.E.; Shilpi, A.; Grace, A.; Shahabi, S. Prognosis and treatment of uterine leiomyosarcoma: A National Cancer Database study. Gynecol. Oncol. 2017, 145, 61–70. [Google Scholar]
  3. Hensley, M.L.; Blessing, J.A.; Mannel, R.; Rose, P.G. Fixed-dose rate gemcitabine plus docetaxel as first-line therapy for metastatic uterine leiomyosarcoma: A Gynecologic Oncology Group phase II trial. Gynecol. Oncol. 2008, 109, 329–334. [Google Scholar]
  4. Gadducci, A.; Landoni, F.; Sartori, E.; Zola, P.; Maggino, T.; Lissoni, A.; Bazzurini, L.; Arisio, R.; Romagnolo, C.; Cristofani, R. Uterine leiomyosarcoma: Analysis of treatment failures and survival. Gynecol. Oncol. 1996, 62, 25–32. [Google Scholar]
  5. Garcia, N.; Ulin, M.; Ali, M.; Al-Hendy, A.; Carvalho, K.C.; Yang, Q. Evaluation of Hedgehog Pathway Inhibitors as a Therapeutic Option for Uterine Leiomyosarcoma Using the Xenograft Model. Reprod. Sci. 2021, 29, 781–790. [Google Scholar]
  6. Yang, Q.; Ciebiera, M.; Bariani, M.V.; Ali, M.; Elkafas, H.; Boyer, T.G.; Al-Hendy, A. Comprehensive Review of Uterine Fibroids: Developmental Origin, Pathogenesis, and Treatment. Endocr. Rev. 2021. [Google Scholar] [CrossRef]
  7. Zuccala, E. Epigenetics: Misdirecting methylation to drive oncogenesis. Nat. Rev. Cancer 2016, 16, 410. [Google Scholar]
  8. Wong, C.C.; Qian, Y.; Yu, J. Interplay between epigenetics and metabolism in oncogenesis: Mechanisms and therapeutic approaches. Oncogene 2017, 36, 3359–3374. [Google Scholar]
  9. Yang, Q.W.; Liu, S.; Tian, Y.; Salwen, H.R.; Chlenski, A.; Weinstein, J.; Cohn, S.L. Methylation-associated silencing of the thrombospondin-1 gene in human neuroblastoma. Cancer Res. 2003, 63, 6299–6310. [Google Scholar]
  10. Yang, Q.; Zage, P.; Kagan, D.; Tian, Y.; Seshadri, R.; Salwen, H.R.; Liu, S.; Chlenski, A.; Cohn, S.L. Association of epigenetic inactivation of RASSF1A with poor outcome in human neuroblastoma. Clin. Cancer Res. 2004, 10, 8493–8500. [Google Scholar]
  11. Yang, Q.; Tian, Y.; Ostler, K.R.; Chlenski, A.; Guerrero, L.J.; Salwen, H.R.; Godley, L.A.; Cohn, S.L. Epigenetic alterations differ in phenotypically distinct human neuroblastoma cell lines. BMC Cancer 2010, 10, 286. [Google Scholar]
  12. Jones, P.A. Epigenetics in carcinogenesis and cancer prevention. Ann. N. Y. Acad. Sci. 2003, 983, 213–219. [Google Scholar]
  13. Kanwal, R.; Gupta, S. Epigenetics and cancer. J. Appl. Physiol. 2010, 109, 598–605. [Google Scholar]
  14. Khare, S.; Verma, M. Epigenetics of colon cancer. Methods Mol. Biol. 2012, 863, 177–185. [Google Scholar]
  15. Kim, W.J.; Kim, Y.J. Epigenetics of bladder cancer. Methods Mol. Biol. 2012, 863, 111–118. [Google Scholar]
  16. Laird, P.W. Cancer epigenetics. Hum. Mol. Genet. 2005, 14, R65–R76. [Google Scholar]
  17. Yang, Q.; Mas, A.; Diamond, M.P.; Al-Hendy, A. The Mechanism and Function of Epigenetics in Uterine Leiomyoma Development. Reprod. Sci. 2016, 23, 163–175. [Google Scholar]
  18. Jain, A.K.; Barton, M.C. Bromodomain Histone Readers and Cancer. J. Mol. Biol. 2017, 429, 2003–2010. [Google Scholar]
  19. Fujisawa, T.; Filippakopoulos, P. Functions of bromodomain-containing proteins and their roles in homeostasis and cancer. Nat. Rev. Mol. Cell Biol. 2017, 18, 246–262. [Google Scholar]
  20. Crawford, N.P.; Alsarraj, J.; Lukes, L.; Walker, R.C.; Officewala, J.S.; Yang, H.H.; Lee, M.P.; Ozato, K.; Hunter, K.W. Bromodomain 4 activation predicts breast cancer survival. Proc. Natl. Acad. Sci. USA 2008, 105, 6380–6385. [Google Scholar]
  21. Leal, A.S.; Liu, P.; Krieger-Burke, T.; Ruggeri, B.; Liby, K.T. The Bromodomain Inhibitor, INCB057643, Targets Both Cancer Cells and the Tumor Microenvironment in Two Preclinical Models of Pancreatic Cancer. Cancers 2020, 13, 96. [Google Scholar]
  22. Kregel, S.; Malik, R.; Asangani, I.A.; Wilder-Romans, K.; Rajendiran, T.; Xiao, L.; Vo, J.N.; Soni, T.; Cieslik, M.; Fernadez-Salas, E.; et al. Functional and Mechanistic Interrogation of BET Bromodomain Degraders for the Treatment of Metastatic Castration-resistant Prostate Cancer. Clin. Cancer Res. 2019, 25, 4038–4048. [Google Scholar]
  23. Kato, F.; Fiorentino, F.P.; Alibes, A.; Perucho, M.; Sanchez-Cespedes, M.; Kohno, T.; Yokota, J. MYCL is a target of a BET bromodomain inhibitor, JQ1, on growth suppression efficacy in small cell lung cancer cells. Oncotarget 2016, 7, 77378–77388. [Google Scholar]
  24. Faivre, E.J.; McDaniel, K.F.; Albert, D.H.; Mantena, S.R.; Plotnik, J.P.; Wilcox, D.; Zhang, L.; Bui, M.H.; Sheppard, G.S.; Wang, L.; et al. Selective inhibition of the BD2 bromodomain of BET proteins in prostate cancer. Nature 2020, 578, 306–310. [Google Scholar]
  25. Zhu, X.; Liao, Y.; Tang, L. Targeting BRD9 for Cancer Treatment: A New Strategy. Onco. Targets Ther. 2020, 13, 13191–13200. [Google Scholar]
  26. Bell, C.M.; Raffeiner, P.; Hart, J.R.; Vogt, P.K. PIK3CA Cooperates with KRAS to Promote MYC Activity and Tumorigenesis via the Bromodomain Protein BRD9. Cancers 2019, 11, 1634. [Google Scholar]
  27. Huang, H.; Wang, Y.; Li, Q.; Fei, X.; Ma, H.; Hu, R. miR-140-3p functions as a tumor suppressor in squamous cell lung cancer by regulating BRD9. Cancer Lett. 2019, 446, 81–89. [Google Scholar]
  28. Del Gaudio, N.; Di Costanzo, A.; Liu, N.Q.; Conte, L.; Migliaccio, A.; Vermeulen, M.; Martens, J.H.A.; Stunnenberg, H.G.; Nebbioso, A.; Altucci, L. BRD9 binds cell type-specific chromatin regions regulating leukemic cell survival via STAT5 inhibition. Cell Death Dis. 2019, 10, 338. [Google Scholar]
  29. Care, M.A.; Westhead, D.R.; Tooze, R.M. Parsimonious Gene Correlation Network Analysis (PGCNA): A tool to define modular gene co-expression for refined molecular stratification in cancer. NPJ Syst. Biol. Appl. 2019, 5, 13. [Google Scholar]
  30. Jacomy, M.; Venturini, T.; Heymann, S.; Bastian, M. ForceAtlas2, a continuous graph layout algorithm for handy network visualization designed for the Gephi software. PLoS ONE 2014, 9, e98679. [Google Scholar]
  31. Xie, Z.; Bailey, A.; Kuleshov, M.V.; Clarke, D.J.B.; Evangelista, J.E.; Jenkins, S.L.; Lachmann, A.; Wojciechowicz, M.L.; Kropiwnicki, E.; Jagodnik, K.M.; et al. Gene Set Knowledge Discovery with Enrichr. Curr. Protoc. 2021, 1, e90. [Google Scholar]
  32. Supek, F.; Bosnjak, M.; Skunca, N.; Smuc, T. REVIGO summarizes and visualizes long lists of gene ontology terms. PLoS ONE 2011, 6, e21800. [Google Scholar]
  33. Yang, Q.; Elam, L.; Laknaur, A.; Gavrilova-Jordan, L.; Lue, J.; Diamond, M.P.; Al-Hendy, A. Altered DNA repair genes in human uterine fibroids are epigenetically regulated via EZH2 histone methyltransferase. Fertil. Steril. 2015, 104, e72. [Google Scholar]
  34. Mason, L.D.; Chava, S.; Reddi, K.K.; Gupta, R. The BRD9/7 Inhibitor TP-472 Blocks Melanoma Tumor Growth by Suppressing ECM-Mediated Oncogenic Signaling and Inducing Apoptosis. Cancers 2021, 13, 5516. [Google Scholar]
  35. Nitulescu, G.M.; Van De Venter, M.; Nitulescu, G.; Ungurianu, A.; Juzenas, P.; Peng, Q.; Olaru, O.T.; Grădinaru, D.; Tsatsakis, A.; Tsoukalas, D.; et al. The Akt pathway in oncology therapy and beyond (Review). Int. J. Oncol. 2018, 53, 2319–2331. [Google Scholar]
  36. Costa, R.L.B.; Han, H.S.; Gradishar, W.J. Targeting the PI3K/AKT/mTOR pathway in triple-negative breast cancer: A review. Breast Cancer Res. Treat. 2018, 169, 397–406. [Google Scholar]
  37. Schrump, D.S.; Hong, J.A.; Nguyen, D.M. Utilization of chromatin remodeling agents for lung cancer therapy. Cancer J. 2007, 13, 56–64. [Google Scholar]
  38. Qi, J. Bromodomain and extraterminal domain inhibitors (BETi) for cancer therapy: Chemical modulation of chromatin structure. Cold Spring Harb. Perspect. Biol. 2014, 6, a018663. [Google Scholar]
  39. Kaur, J.; Daoud, A.; Eblen, S.T. Targeting Chromatin Remodeling for Cancer Therapy. Curr. Mol. Pharmacol. 2019, 12, 215–229. [Google Scholar]
  40. Magnani, L.; Stoeck, A.; Zhang, X.; Lanczky, A.; Mirabella, A.C.; Wang, T.L.; Gyorffy, B.; Lupien, M. Genome-wide reprogramming of the chromatin landscape underlies endocrine therapy resistance in breast cancer. Proc. Natl. Acad. Sci. USA 2013, 110, E1490–E1499. [Google Scholar]
  41. Santillan, D.A.; Theisler, C.M.; Ryan, A.S.; Popovic, R.; Stuart, T.; Zhou, M.M.; Alkan, S.; Zeleznik-Le, N.J. Bromodomain and histone acetyltransferase domain specificities control mixed lineage leukemia phenotype. Cancer Res. 2006, 66, 10032–10039. [Google Scholar]
  42. Dawson, M.A.; Prinjha, R.K.; Dittmann, A.; Giotopoulos, G.; Bantscheff, M.; Chan, W.I.; Robson, S.C.; Chung, C.-w.; Hopf, C.; Savitski, M.M.; et al. Inhibition of BET recruitment to chromatin as an effective treatment for MLL-fusion leukaemia. Nature 2011, 478, 529–533. [Google Scholar]
  43. Lucas, X.; Gunther, S. Targeting the BET family for the treatment of leukemia. Epigenomics 2014, 6, 153–155. [Google Scholar]
  44. Belkina, A.C.; Nikolajczyk, B.S.; Denis, G.V. BET protein function is required for inflammation: Brd2 genetic disruption and BET inhibitor JQ1 impair mouse macrophage inflammatory responses. J. Immunol. 2013, 190, 3670–3678. [Google Scholar]
  45. Qiu, H.; Jackson, A.L.; Kilgore, J.E.; Zhong, Y.; Chan, L.L.; Gehrig, P.A.; Zhou, C.; Bae-Jump, V.L. JQ1 suppresses tumor growth through downregulating LDHA in ovarian cancer. Oncotarget 2015, 6, 6915–6930. [Google Scholar]
  46. Richter, G.H.S.; Hensel, T.; Schmidt, O.; Saratov, V.; von Heyking, K.; Becker-Dettling, F.; Prexler, C.; Yen, H.-Y.; Steiger, K.; Fulda, S.; et al. Combined Inhibition of Epigenetic Readers and Transcription Initiation Targets the EWS-ETS Transcriptional Program in Ewing Sarcoma. Cancers 2020, 12, 304. [Google Scholar]
  47. Choi, J.; Manzano, A.; Dong, W.; Bellone, S.; Bonazzoli, E.; Zammataro, L.; Yao, X.; Deshpande, A.; Zaidi, S.; Guglielmi, A.; et al. Integrated mutational landscape analysis of uterine leiomyosarcomas. Proc. Natl. Acad. Sci. USA 2021, 118, e2025182118. [Google Scholar]
  48. Park, S.G.; Lee, D.; Seo, H.R.; Lee, S.A.; Kwon, J. Cytotoxic activity of bromodomain inhibitor NVS-CECR2-1 on human cancer cells. Sci. Rep. 2020, 10, 16330. [Google Scholar]
  49. Lu, J.; Qian, C.; Ji, Y.; Bao, Q.; Lu, B. Gene Signature Associated With Bromodomain Genes Predicts the Prognosis of Kidney Renal Clear Cell Carcinoma. Front. Genet. 2021, 12, 643935. [Google Scholar]
  50. Yamaguchi, M.; Kusunoki, S.; Hirayama, T.; Fujino, K.; Terao, Y.; Itakura, A. Case of leiomyosarcoma arising from subserosal leiomyoma. J. Obs. Gynaecol. Res. 2019, 45, 1944–1947. [Google Scholar]
  51. Di Giorgio, E.; Dalla, E.; Franforte, E.; Paluvai, H.; Minisini, M.; Trevisanut, M.; Picco, R.; Brancolini, C. Different class IIa HDACs repressive complexes regulate specific epigenetic responses related to cell survival in leiomyosarcoma cells. Nucleic Acids Res. 2020, 48, 646–664. [Google Scholar]
  52. Moustakim, M.; Clark, P.G.K.; Hay, D.A.; Dixon, D.J.; Brennan, P.E. Chemical probes and inhibitors of bromodomains outside the BET family. Medchemcomm 2016, 7, 2246–2264. [Google Scholar]
  53. Dey, P.; Li, J.; Zhang, J.; Chaurasiya, S.; Strom, A.; Wang, H.; Liao, W.-T.; Cavallaro, F.; Denz, P.; Bernard, V.; et al. Oncogenic KRAS-Driven Metabolic Reprogramming in Pancreatic Cancer Cells Utilizes Cytokines from the Tumor Microenvironment. Cancer Discov. 2020, 10, 608–625. [Google Scholar]
  54. Hann, S.R. Role of post-translational modifications in regulating c-Myc proteolysis, transcriptional activity and biological function. Semin. Cancer Biol. 2006, 16, 288–302. [Google Scholar]
  55. Archer, T.C.; Ehrenberger, T.; Mundt, F.; Gold, M.P.; Krug, K.; Mah, C.K.; Mahoney, E.L.; Daniel, C.J.; LeNail, A.; Ramamoorthy, D.; et al. Proteomics, Post-translational Modifications, and Integrative Analyses Reveal Molecular Heterogeneity within Medulloblastoma Subgroups. Cancer Cell 2018, 34, 396–410. [Google Scholar]
  56. Tu, W.B.; Helander, S.; Pilstal, R.; Hickman, K.A.; Lourenco, C.; Jurisica, I.; Raught, B.; Wallner, B.; Sunnerhagen, M.; Penn, L.Z. Myc and its interactors take shape. Biochim. Biophys. Acta 2015, 1849, 469–483. [Google Scholar]
  57. Lourenco, C.; Resetca, D.; Redel, C.; Lin, P.; MacDonald, A.S.; Ciaccio, R.; Kenney, T.M.G.; Wei, Y.; Andrews, D.W.; Sunnerhagen, M.; et al. MYC protein interactors in gene transcription and cancer. Nat. Rev. Cancer 2021, 21, 579–591. [Google Scholar]
  58. Gazon, H.; Barbeau, B.; Mesnard, J.M.; Peloponese, J.M., Jr. Hijacking of the AP-1 Signaling Pathway during Development of, A.T.L. Front. Microbiol. 2017, 8, 2686. [Google Scholar]
  59. Langer, S.; Singer, C.F.; Hudelist, G.; Dampier, B.; Kaserer, K.; Vinatzer, U.; Pehamberger, H.; Zielinski, C.; Kubista, E.; Schreibner, M. Jun and Fos family protein expression in human breast cancer: Correlation of protein expression and clinicopathological parameters. Eur. J. Gynaecol. Oncol. 2006, 27, 345–352. [Google Scholar]
  60. Chinenov, Y.; Kerppola, T.K. Close encounters of many kinds: Fos-Jun interactions that mediate transcription regulatory specificity. Oncogene 2001, 20, 2438–2452. [Google Scholar]
  61. Han, Z.; Boyle, D.L.; Aupperle, K.R.; Bennett, B.; Manning, A.M.; Firestein, G.S. Jun N-terminal kinase in rheumatoid arthritis. J. Pharm. Exp. Ther. 1999, 291, 124–130. [Google Scholar]
  62. Aicher, W.K.; Dinkel, A.; Grimbacher, B.; Haas, C.; Seydlitz-Kurzbach, E.V.; Peter, H.H.; Eibel, H. Serum response elements activate and cAMP responsive elements inhibit expression of transcription factor Egr-1 in synovial fibroblasts of rheumatoid arthritis patients. Int. Immunol. 1999, 11, 47–61. [Google Scholar]
  63. Wang, B.; Guo, H.; Yu, H.; Chen, Y.; Xu, H.; Zhao, G. The Role of the Transcription Factor EGR1 in Cancer. Front. Oncol. 2021, 11, 642547. [Google Scholar]
  64. Zhang, C.; Chen, L.; Lou, W.; Su, J.; Huang, J.; Liu, A.; Xu, Y.; He, H.; Gao, Y.; Xu, D.; et al. Aberrant activation of m6A demethylase FTO renders HIF2alpha(low/-) clear cell renal cell carcinoma sensitive to BRD9 inhibitors. Sci. Transl. Med. 2021, 13, eabf6045. [Google Scholar]
  65. Garcia, N.; Al-Hendy, A.; Baracat, E.C.; Carvalho, K.C.; Yang, Q. Targeting Hedgehog Pathway and DNA Methyltransferases in Uterine Leiomyosarcoma Cells. Cells 2020, 10, 53. [Google Scholar]
  66. Garcia, N.; Ulin, M.; Al-Hendy, A.; Yang, Q. The Role of Hedgehog Pathway in Female Cancers. J. Cancer Sci. Clin. Ther. 2020, 4, 487–498. [Google Scholar]
  67. Bulavin, D.V.; Kovalsky, O.; Hollander, M.C.; Fornace, A.J., Jr. Loss of oncogenic H-ras-induced cell cycle arrest and p38 mitogen-activated protein kinase activation by disruption of Gadd45a. Mol. Cell Biol. 2003, 23, 3859–3871. [Google Scholar]
  68. Bhargava, S.; Patil, V.; Shah, R.A.; Somasundaram, K. IGF2 mRNA binding protein 3 (IMP3) mediated regulation of transcriptome and translatome in glioma cells. Cancer Biol. Ther. 2018, 19, 42–52. [Google Scholar]
  69. Zhang, R.; Shi, H.; Ren, F.; Zhang, M.; Ji, P.; Wang, W.; Liu, C. The aberrant upstream pathway regulations of CDK1 protein were implicated in the proliferation and apoptosis of ovarian cancer cells. J. Ovarian Res. 2017, 10, 60. [Google Scholar]
  70. Ying, X.; Che, X.; Wang, J.; Zou, G.; Yu, Q.; Zhang, X. CDK1 serves as a novel therapeutic target for endometrioid endometrial cancer. J. Cancer 2021, 12, 2206–2215. [Google Scholar]
  71. Gothe, H.J.; Bouwman, B.A.M.; Gusmao, E.G.; Piccinno, R.; Petrosino, G.; Sayols, S.; Drechsel, O.; Minneker, V.; Josipovic, N.; Mizi, A.; et al. Spatial Chromosome Folding and Active Transcription Drive DNA Fragility and Formation of Oncogenic MLL Translocations. Mol. Cell 2019, 75, 267–283. [Google Scholar]
  72. Chen, T.; Sun, Y.; Ji, P.; Kopetz, S.; Zhang, W. Topoisomerase IIalpha in chromosome instability and personalized cancer therapy. Oncogene 2015, 34, 4019–4031. [Google Scholar]
  73. Tsai, S.C.; Valkov, N.; Yang, W.M.; Gump, J.; Sullivan, D.; Seto, E. Histone deacetylase interacts directly with DNA topoisomerase II. Nat. Genet. 2000, 26, 349–353. [Google Scholar]
  74. Ali, M.; Shahin, S.M.; Sabri, N.A.; Al-Hendy, A.; Yang, Q. Activation of beta-Catenin Signaling and its Crosstalk With Estrogen and Histone Deacetylases in Human Uterine Fibroids. J. Clin. Endocrinol. Metab. 2020, 105, e1517–e1535. [Google Scholar]
  75. Zhao, W.; Xu, Y.; Wang, Y.; Gao, D.; King, J.; Xu, Y.; Liang, F.-S. Investigating crosstalk between H3K27 acetylation and H3K4 trimethylation in CRISPR/dCas-based epigenome editing and gene activation. Sci. Rep. 2021, 11, 15912. [Google Scholar]
  76. Hasan, N.M.; Sharma, A.; Ruzgar, N.M.; Deshpande, H.; Olino, K.; Khan, S.; Ahuja, N. Epigenetic signatures differentiate uterine and soft tissue leiomyosarcoma. Oncotarget 2021, 12, 1566–1579. [Google Scholar]
  77. De Carvalho Fischer, C.; Hu, Y.; Morreale, M.; Lin, W.Y.; Wali, A.; Thakar, M.; Karunasena, E.; Sen, R.; Cai, Y.; Murphy, L.; et al. Treatment with epigenetic agents profoundly inhibits tumor growth in leiomyosarcoma. Oncotarget 2018, 9, 19379–19395. [Google Scholar]
  78. Conconi, D.; Redaelli, S.; Lissoni, A.A.; Cilibrasi, C.; Perego, P.; Gautiero, E.; Sala, E.; Paderno, M.; Dalprà, L.; Landoni, F.; et al. Genomic and Epigenomic Profile of Uterine Smooth Muscle Tumors of Uncertain Malignant Potential (STUMPs) Revealed Similarities and Differences with Leiomyomas and Leiomyosarcomas. Int. J. Mol. Sci. 2021, 22, 1580. [Google Scholar]
  79. de Almeida, B.C.; Dos Anjos, L.G.; Uno, M.; Cunha, I.W.D.; Soares, F.A.; Baiocchi, G.; Baracat, E.C.; Carvalho, K.C. Let-7 miRNA’s Expression Profile and Its Potential Prognostic Role in Uterine Leiomyosarcoma. Cells 2019, 8, 1452. [Google Scholar]
  80. Gonzalez Dos Anjos, L.; de Almeida, B.C.; Gomes de Almeida, T.; Mourao Lavorato Rocha, A.; De Nardo Maffazioli, G.; Soares, F.A.; Cunha, I.W.D.; Baracat, E.C.; Carvalho, K.C. Could miRNA Signatures be Useful for Predicting Uterine Sarcoma and Carcinosarcoma Prognosis and Treatment? Cancers 2018, 10, 315. [Google Scholar]
Figure 1. Morphological observation and IHC staining of SMA, desmin, and HMB45 in four representative human uLMS tissues and adjacent myometrium.
Cells 11 02160 g001
Figure 2. BRD9 expression is aberrantly upregulated in uterine uLMS compared to adjacent myometrium. (A) The expression of BRD9 in 3 representative uLMS tissues. (B) Quantitative comparison of BRD9 positive and expression levels between uLMS and myometrium in 9 uLMS cases.
Cells 11 02160 g002
Figure 3. The protein levels of BRD9 in UTSM, HuLM, MES-SA, and SK-UT-1 cell lines and iBRD9 treatment. (A) The protein levels of BRD9 were measured by Western blot. E1, E2, and E3 represent three experiments (B) The protein levels of BRD9 were quantified using NIH Image J software. β-actin was used as an endogenous control. (C) Cell proliferation in SK-UT-1 cells in the presence or absence of TP-472; (D) Cell proliferation in MES-SA cells in the presence or absence of TP-472. (E) Bcl-2 levels in SK-UT-1 cells in the presence or absence of TP-472 measured by WB. (F) Quantitative analysis of Figure 3E using NIH Image J software. Three independent experiments were performed. * p < 0.05, ** p < 0.01, *** p < 0.001 compared between treated groups and control.
Cells 11 02160 g003
Figure 4. BRD9 inhibition causes extensive changes in the transcriptome of uLMS cells. (A) Pie chart showing the percentage of genes that exhibited changes in RNA expression between TP-472 and vehicle treatment groups as determined by RNA-seq. The cutoff value is 1.5-fold with an FDA < 0.05. (B) PCA plot of BRD9/inhibitor (TP-472) and vehicle control (DMSO), (C): Volcano plot showing the distribution of the DEGs between TP-472 and vehicle-treated SK-UT-1 cell line. The dashed line indicates the p-value significance threshold. (D) Heat map. Pearson correlation was used to cluster DEG (TP-472 vs. Control), which were then represented as a heatmap with the data scaled by Z score for each row. (E) Heat map. Pearson correlation was used to cluster DEG (TP-472 vs. Control, up genes), which were then represented as a heatmap with the data scaled by Z score for each row. (F) Heat map. Pearson correlation was used to cluster DEG (TP-472 vs. Control, down genes), which were then represented as a heatmap with the data scaled by Z score for each row.
Cells 11 02160 g004
Figure 5. Hallmark analysis demonstrated the alteration of multiple pathways in SK-UT-1 cells in response to TP-472 treatment. (A) Functional pathways analysis identified significantly altered pathways in SK-UT-1 cells treated with TP-472. Significantly enriched gene sets (TP-472 vs. control) from GSEA using Hallmark biological processes in MSigDB. Gene count and significance levels are shown by the size and color of each circle, respectively. Pathways analysis revealed that several gene sets associated with TNF-a signaling via NFkB (B), KRAS signaling (C), MYC targets (D), MTORC1 signaling (E), and interferon-alpha response (F) were altered.
Cells 11 02160 g005
Figure 6. TP-472 induces altered expression of genes related to cell cycle, apoptosis, AKTs and Hedgehog pathways. (A) CDKN1A (B) BAK1 (C) AKT1 (D) AKT2 (E) GLI1 (F) GLI2. * p < 0.05; *** p < 0.001.
Cells 11 02160 g006
Figure 7. Network representation of the modular pattern of gene expression during the transition of control to TP-472 treatment. (A) Flowchart of modular pattern analysis, (B) Left: Nine network modules are color coded. Middle and right: Overlay of gene expression z-scores for all genes in the control and TP-472 conditions shown in blue (low) to red (high) z-score color scale. Four constructed modules, including mitotic cell cycle phase (GO: 0044772), regulation of mitochondrial outer membrane permeabilization involved in apoptotic signaling pathway (GO:1901028), apoptotic process (GO: 9996915), and translational termination (GO: 0006415) were enriched and highlighted. Note: Greek numerals are the index for Modules.
Cells 11 02160 g007
Figure 8. Visualization of the top 200 DEGs involved in histone modifications. (A) top panel: relation between histone modifications and top 40 DEGs among top 200 DEGs suppressed by TP-472 treatment (down). Lower panel: Top 10 altered epigenetic terms from top 200 down DEGs upon TP-472 treatment, (B) Top panel: the relation between histone modifications and top 40 DEGs among top 200 DEGs induced by TP-472 treatment (up). Lower panel: top 10 altered epigenetic terms from top 200 up DEGs upon TP-472 treatment. Note: Arabic numerals are the index for histone modifications.
Cells 11 02160 g008
Figure 9. Visualization of the top 200 DEGs involved in miRNA regulation. (A) The relation between top 20 down/up miRNAs and top 200 up/down DEGs, (B) Model showing that TP-472 treatment activates apoptosis, induces cell cycle arrest, induces miRNA-mediated gene regulation, and reprograms pro-oncogenic epigenome in uLMS cells. Note: Arabic numerals are the index for histone modifications. Figure 9B was created using BioRender software.
Cells 11 02160 g009
Table 1. Characteristics of uLMS samples.
Case NumberType of LMSAge at
Diagnosis
Tumor Size (cm)StageRecurrenceNecrosisMetastasisSurvival Status
1Conventional587IBNfocal coagulative necrosisNoneA
2Conventional588IYextensive hyaline necrosis.
focal coagulative necrosis
LungD
3Conventional427.1IBNcoagulative tumor cell necrosis and hyaline necrosisBrain and lungA
4Conventional627.9IBYfocal coagulative necrosisLungA
5non-conventional5517IIIC1Nfocal coagulative necrosisOvary & LungD
6non-conventional5418.8IIIBYfocal coagulative necrosisAbdominal wall + BowelD
7Conventional5427IIYfocal coagulative necrosisOmentumA
8Conventional619.5IIIBNfocal coagulative necrosisOmentum, Small
intestine, Liver
A
9Conventional4224.6IBNfocal coagulative necrosisNoneD
Table 2. Antibodies used in the study.
AntibodiesCompanyCatalog NumberSourceApplicationDilution
BRD9Cell Signaling58906RabbitWB1:1000
Bcl2Abcamab182858RabbitWB1:1000
β-actinSigmaA5316MouseWB1:8000
BRD9Abcamab259839RabbitIHC-P1:1000
SMADakoM0851MouseIHC-P1:1600
DesminSanta CruzSC-14026RabbitIHC-P1:800
HMB45DakoM0634MouseIHC-P1:100
Table 3. Primer information in this study.
Gene SymbolPrimer
Sequences
F or RAssaySpeciesSize (bp)Accession
CDKN1ACGGAACAAGGAGTCAGACATTFq-PCRHuman105NM_00389.5
CDKN1AAGTGCCAGGAAAGACAACTACRq-PCRHuman105NM_00389.5
BAKAGGGCTTAGGACTTGGTTTGFq-PCRHuman100U16811.1
BAKGGGATTCCTAGTGGTGTTGATARq-PCRHuman100U16811.1
18 SCACGGACAGGATTGACAGATTFq-PCRHuman119NR_145820
18 SGCCAGAGTCTCGTTCGTTATCRq-PCRHuman119NR_145820
Table 4. The significant terms of the modules based on the 9 different enrichment databases.
ModuleMid Night BlueYellowCyanDark Green
GO_Biological_Process_2021Regulation of mitochondrial outer membrane permeabilization involved in apoptotic signaling pathway (GO:1901028) (1.38 × 10⁻⁵)Apoptotic process (GO:0006915)
(2.00 × 10⁻⁵)
Translational termination (GO:0006415) (8.54 × 10⁻³¹)Mitotic cell cycle phase transition (GO:0044772)
(3.36 × 10⁻⁷)
MSigDB_Hallmark_2020TNF-alpha Signaling via NF-kB (0.000138704)TNF-alpha Signaling via NF-kB (1.08 × 10⁻¹⁶)Myc Targets V1 (1.25 × 10−39)PI3K/AKT/mTOR Signaling (0.031214077)
WikiPathway_2021MAPK Signaling Pathway WP382 (0.001957412)Sudden Infant Death Syndrome (SIDS) Susceptibility Pathways WP706
(0.000455634)
G1 to S cell cycle control WP45 (0.037948453)Cell cycle WP179
(1.90 × 10⁻⁵)
Reactome_2015TRAF6-mediated induction of NFkB and MAP kinases upon TLR7/8 or 9 activation Homo sapiens R-HSA-975138 (0.093688577)MAPK family signaling cascades Homo sapiens R-HSA-5683057 (0.019875184)Cyclin E associated events during G1/S transition Homo sapiens R-HSA-69202 (9.09 × 10⁻¹⁰)Cell Cycle Homo sapiens R-HSA-1640170 (3.50 × 10⁻¹¹)
ENCODE_Histone_Modifications_2015H3K4me1
(2.98 × 10⁻¹⁵)
H3K27me3
(4.96 × 10−48)
H3K4me3
(5.19 × 10⁻¹⁰)
H3K4me3
(1.91 × 10⁻⁶)
TargetScan_microRNA_2017hsa-miR-4776-5p MicroRNAs (0.001954789)hsa-miR-4727-3p
(0.001242581)
hsa-miR-1284
(0.021500132)
hsa-miR-3682-3p MicroRNAs (5.49 × 10⁻¹⁴)
InterPro_Domains_2019NFkappaB IPT domain (0.007433747)Death domain (0.001693697)LSM domain (1.28 × 10⁻⁹)Protein kinase domain (4.49 × 10⁻⁵)
Pfam_Domains_2019Pkinase (0.000212328)Death (0.000791274)LSM
(5.50 × 10⁻¹⁰)
Pkinase (3.62 × 10⁻⁵)
Jensen_COMPARTMENTSNeuron part (5.89 × 10⁻⁷)BCL-2 complex (3.34 × 10⁻⁸)Intracellular ribonucleoprotein complex (5.21 × 10−49)Cellular component (5.48 × 10⁻²²)
Publisher’s Note: MDPI stays neutral with regard to jurisdictional claims in published maps and institutional affiliations.

