Abstract
The Pax-5 gene encodes a transcription factor that is essential for B-cell commitment and maturation. However, Pax-5 deregulation is associated with various cancer lesions, notably hematopoietic cancers. Mechanistically, studies have characterized genetic alterations within the Pax-5 locus that result in either dominant oncogenic function or haploinsufficiency-inducing mutations leading to oncogenesis. Apart from these mutations, some examples of aberrant Pax-5 expression cannot be associated with genetic alterations. In the present study, we set out to elucidate potential alterations in post-transcriptional regulation of Pax-5 expression and establish that Pax-5 transcript editing represents an important means to aberrant expression. Upon the profiling of Pax-5 mRNA in leukemic cells, we found that the 3′end of the Pax-5 transcript is submitted to alternative polyadenylation (APA) and alternative splicing events. Using rapid amplification of cDNA ends (3′RACE) from polysomal fractions, we found that Pax-5 3′ untranslated region (UTR) shortening correlates with increased ribosomal occupancy for translation. These observations were also validated using reporter gene assays with truncated 3′UTR regions cloned downstream of a luciferase gene. We also showed that Pax-5 3′UTR editing has direct repercussions on regulatory elements such as miRNAs, which in turn impact Pax-5 protein expression. More importantly, we found that advanced staging of various hematopoietic cancer lesions relates to shorter Pax-5 3′UTRs. Altogether, our findings identify novel molecular mechanisms that account for aberrant expression and function of the Pax-5 oncogene in cancer cells. These findings also present new avenues for strategic intervention in Pax-5-mediated cancers.
Keywords:
Pax-5; alternative polyadenylation; 3′UTR editing; B-cell; cancer; alternative splicing; microRNA 1. Introduction
Research has enabled the elucidation of multiple regulatory pathways in aberrant gene expression leading to disease, thus presenting new therapeutic targets and strategies. Adding complexity to these intricate networks are non-coding RNAs and the myriad of post-transcriptional modifications of mRNA targets. In fact, mRNA editing is biologically essential for the expansion of gene products and functional diversity. Studies estimate that up to 95% of human gene transcripts are subjected to alternative splicing events [1,2,3]. Reciprocally, reports also show that aberrant alternative splicing is frequently associated with the development of cancer [4].
Accordingly, this is also the case for the Pax-5 gene, which encodes a transcription factor essential for B-cell lineage commitment and maturation [5,6,7]. Given its pivotal regulatory function in B-cell development, Pax-5 is also involved with the onset and progression of various hematological cancers and some carcinomas (reviewed in [8]). We and others have previously shown that the Pax-5 transcript is submitted to multiple post-transcriptional editing processes [9,10] and alternative promoter regions [11,12,13] to regulate protein expression. In addition, genetic studies have shown that the human Pax-5 locus is involved in recurrent chromosomal rearrangements, which account for the aberrant expression of the Pax-5 oncogene in cancer. For example, translocation of the Pax-5 gene can result in chimeric transcription factors [14,15] or position the Pax-5 coding region under transcriptional control of the potent immunoglobulin heavy chain (IgH) gene promoter [16]. Although genomic instability is the root of aberrant Pax-5 expression in most cancer malignancies, some studies have ruled out genetic alterations involving Pax-5 as a causal link to deregulated Pax-5 protein expression in cancer cells, thus suggesting an alternate mechanism for Pax-5 ectopic expression [10,17]. This lack of understanding may also be due to the paucity of studies on the post-transcriptional regulation of Pax-5 products.
We have previously reported that Pax-5 expression and function are modulated by key micro-RNAs (miRNAs) in various types of cancer cells [18,19,20]. Consequently, the transcripts’ untranslated regions (UTR), notably at the 3′end, plays a pivotal role in transcript stability and translation efficiency [21,22,23]. Furthermore, alteration and editing of mRNA 3′UTRs, which harbor multiple binding sites for translational regulatory elements, lead to concomitant changes in mRNA stability and expression. Interestingly, the structure and overall lengths of 3′UTRs are shown to vary widely in mammalian cells. This phenomenon is due to alternative polyadenylation (APA) signals that enable premature termination of transcription, which results in truncated mRNAs [24,25]. The use of APA motifs is observed in more than half of all human transcripts and represents an important means to evade translational control [24]. In fact, shortening of mRNA 3′UTRs is a prominent process observed in proliferating cells and oncogenes, leading to greater mRNA stability and translation [26,27].
In this study, we set out to characterize Pax-5 3′UTR variability and its repercussions on translational expression. We demonstrate that the Pax-5 3′UTR is significantly edited in cancer cells through the use of APA or alternative splicing events, depending on the tissue type. Although Pax-5 3′UTR editing events are prevalent in healthy B-lymphocytes, we associate Pax-5 3′UTR shortening with an increase in oncogenic translation frequency, which can be associated with disease progression of B-cell cancers. Our findings present the first characterization of Pax-5 3′UTR editing and provide new insight to avenues in aberrant expression of the Pax-5 oncogene.
2. Materials and Methods
2.1. Cell Models and Culturing Conditions
MCF7 (mammary ductal carcinoma, HTB-22); MCF10A (mammary epithelial CRL-10317); Raji (lymphoblast B-cell, CCL-86), and REH (Acute Lymphocytic Leukemia, CRL-8286) were obtained from American Type Culture Collection (ATCC, Rockville, MD, USA). Nalm6 (B-cell precursor leukemia, ACC-128) was obtained from the Leibniz Institute DSMZ culture collection (Braunschweig, Germany). MCF7 cells were cultured in DMEM medium supplemented with 10% fetal bovine serum (FBS) and L-glutamine (2 mM). MCF10A cells were maintained in DMEM/F12 medium supplemented with 5% FBS, L-glutamine (2 mM), sodium pyruvate (1 mM), bovine insulin (10 μg/mL), EGF (20 ng/mL), cholera toxin (100 ng/mL), and hydrocortisone (500 ng/mL) (ThermoFisher, Burlington, ON, Canada). B-cells were maintained in RPMI 1640 medium supplemented with 10% FBS and L-glutamine (2 mM). Healthy donor and patient samples were obtained from the G.L.-Dumont University Hospital Centre (GLDHC, Moncton, NB, Canada) biobank repository and conducted in accordance with the Declaration of Helsinki of 1975 (revised 2013, https://www.wma.net/what-we-do/medical-ethics/declaration-of-helsinki/) (accessed on 1 February 2020). Ethics approval was provided by the GLDHC (project: CER7-3-17 Ver. 5) and the Université de Moncton (Moncton, NB, Canada) (project: 1920-016). Patient samples consisted of peripheral blood mononuclear cells (PBMCs) isolated by gradient centrifugations with Ficoll Paque (GE Life Sciences, Mississauga, ON, Canada). Primary CD19+ B-lymphocytes were purified from Ficoll density gradients of PBMC using a magnetic B-cell isolation kit according to the manufacturer’s instructions to isolate untouched B-cells by negative selection (Miltenyi Biotec, Somerville, MA, USA).
2.2. PCR, Cloning, and Quantitative RT-PCR
Reverse transcriptions were performed using SuperScript III reverse transcriptase (ThermoFisher) on RNA retrieved from cells using TRIzol® reagent (ThermoFisher) according to manufacturer’s instructions and previously described [28]. Levels of gene expression were verified by quantitative RT-PCR (qRT-PCR) in reaction mixtures composed of 12.5 μL of SYBR® Green 2X FastMix (QuantaBio, Beverly, MA, USA), 2.5 μL of each forward and reverse primer (3 μM) and 2 μL of cDNA. For miRNA analysis, cDNA was generated from 5 ng of miRNA-enriched total RNA using TaqMan® microRNA Reverse Transcription Kit (ThermoFisher). MicroRNA qRT-PCR assays were then performed using miRNA-specific TaqMan® assays (ThermoFisher). Reactions were run in a real-time PCR CFX instrument (Bio-Rad Laboratories, Mississauga, ON, Canada). Comparative expression levels for mRNA or miRNAs were calculated using the ΔΔCt method [29], using the hypoxanthine ribosyltransferase (HPRT) or small nucleolar RNA48 non-coding transcript as a normalizing control, respectively.
The Pax-5 3′UTR regions were isolated by PCR amplification using Pax-5 specific primers and cloned into either the pMiR-REPORT™ vector (ThermoFisher) or pGEM-T easy vector (Promega, Madison, WI, USA) for sequence and expression profiling. Rapid Amplification of cDNA Ends (RACE) was performed using the GeneRacer kit (ThermoFisher) as described by the manufacturer’s instructions with some modifications. Briefly, total RNA was extracted from cells and reverse transcribed using a provided modified oligo-dT adaptor primer. PCR reactions were then completed with a forward gene-specific primer and the provided GeneRacer 3′ adapter reverse primer. Nested PCR reactions were then performed using internal primer pairs specific to the Pax-5 3′UTR targeted region. All developed primers for specific PCR reactions are presented in Supplementary Table S1.
2.3. Reporter Gene Assays and Transfection
Three firefly luciferase-based reporter gene constructs (pMiR-REPORT, ThermoFisher) were designed with the luciferase gene located upstream from the various cloned regions of the Pax-5 3′UTR. Reporter constructs were transfected by electroporation (Nucleofector®, Lonza, Basel, Switzerland) into B-cell lines. Technically, 2 μg of DNA plasmid was transfected into 2 × 10⁶ cells using the Nucleofector® II device (software version S4) and the Amaxa Cell Line Nucleofector Kit V according to the manufacturer’s instructions (Lonza). After a 48 h incubation period, cells were examined for luciferase expression using the Dual-Glo luciferase system (Promega) and a Synergy Microplate reader (Biotek, Winooski, VT, USA). In co-transfections (pMiR reporter constructs + anti-miRNAs), we used the Dharmafect DUO reagent (Horizon, Lafayette, IN, USA) where 2 × 10⁶ cells received 2 μg of reporter plasmid, 20 ng of Renilla luciferase plasmid (Promega), and 100 nM of miRNA inhibitors (anti-miR™ inhibitor, ThermoFisher) against specific miRNAs or scrambled non-targeting anti-miRs as negative controls. Transfection normalizations were performed either by qRT-PCR on a plasmid backbone gene (puromycin, located on pMiR-REPORT) or by co-transfection and detection of non-inducible Renilla luciferase (pRL, Promega).
2.4. Polysomal Fractionation and Profiling
Profiling of Pax-5 transcripts in translation was performed with polyribosome extracts and fractionation using sucrose gradients (7–47% range), collection tubes, and absorbance monitoring as described previously [30]. Briefly, B-cells were pelleted and resuspended in RPMI 1640 media with 100 μg/mL of cycloheximide (CHX) (Sigma-Aldrich, Oakville, ON, Canada). After 15 min of incubation, cells were washed twice in PBS/CHX and lysed with a detergent buffer and pestle strokes in a Dounce homogenizer. The solution was centrifuged and added on top of a sucrose cushion (1 M sucrose in a polysome buffer) to concentrate the ribosomes. The polysomal fractions were collected using an ISCO Foxy Jr fractionator (Teledyne ISCO, Lincoln, NE, USA). The fractions were subjected to RT-PCR to establish differential Pax-5 3′UTR isoform quantification and translational activity using Pax-5 specific primer pairs (Supplementary Table S1).
2.5. Data Mining and Processing
Illumina Hiseq 2000 RNA-seq data sets (level 3 per-gene RNA-seq v2 expression data) of diffuse large B-cell lymphoma (DLBCL) patients (n = 48) were retrieved from TCGA (https://cancergenome.nih.gov) (accessed on 10 April 2020). The dbGaP accession number to the specific version of the TCGA data sets is phs001444.v2.p1. For chronic lymphocytic leukemia (CLL) analysis, the RNA-seq profiles were downloaded from the Gene Expression Omnibus (GEO) data set GSE66117, including 47 CLL primary B-cells raw data [31]. For control, the GSE16921 data set containing the RNA-seq of 41 immortal B-cells [32] along with the GSE62246 [33,34] and GSE70830 including 2 and 5 normal B-cell RNA-seq profiles respectively, were considered.
FASTX-Toolkit (http://hannonlab.cshl.edu/fastx_toolkit/) (accessed on 10 April 2020) was used for quality assessment of the raw files. The error ratio was calculated by using the formula: Phred Quality (Q) score = −10 log2E (E = error rate). The homogeneity of sequences was measured based on the distribution of guanine–cytosine (GC) pairs. Adapters, reads with low quality, reads consisting of >50% N bases, or >20% N bases with the Q-score < 20 were excluded from the analysis. TopHat2 package version 2.1.1 [35] was applied for splice alignment of the filtered reads with the human reference genome (GRCh38.p12, Ensembl.org). The parameters were set as the default value.
The read counts of these data sets were estimated by RSEM package (RNA-seq by expectation maximization). To identify the protein-coding genes reads > 100 bp were analyzed with the Coding-Noncoding Index (CNI, version 2) based on 64 triplets of nucleotide algorithms [36], and additionally examined with the coding potential calculator-2 (CPC-2) webserver to distinguish noncoding transcripts from mRNAs based on the length and quality rate of the open reading frame of protein-coding transcripts [37]. Next, we analyzed the retrieved protein sequences with the Pfam-scan (version 1.3) database archive to evaluate their annotation [38] and also used the phylogenetic codon substitution frequency (phyloCSF, release 20121028) to distinguish the coding transcripts from noncoding alignments according to the evolutionary preservation of amino acids with known families of proteins [39]. Cuffdiff package (version 2.2.1, 2013) was used to estimate the expression score of the transcripts as RPKM = total exon reads/mapped reads in millions × exon length in kb (RPKM = reads per kilobase of transcript per million mapped reads). The false discovery rate (FDR) was chosen as 5, and the q-value (p-adjusted) was set as <0.05.
For the prediction of polyadenylation signals, we made use of a series of polyA signal prediction software: DNA polyA signal miner [40] (dnafsminer.bic.nus.edu.sg) (accessed on 17 February 2019); PolyApred [41] (http://crdd.osdd.net/raghava/polyapred/index.html) (accessed on 20 February 2019), and Softberry POLYAH [42] (http://www.softberry.com/berry.phtml?topic=polyah&group=programs&subgroup=promoter) (accessed on 20 February 2019). To examine the Pax-5 transcript (notably the 3′UTR) for predicted splicing regulatory motifs and adenylate/uridylate-rich elements (AU-rich elements/AREs), we used the computational prediction software RNAreg 2.0 (http://regrna2.mbc.nctu.edu.tw) (accessed on 20 February 2019) [43]. For the validation of putative AU-rich motifs within the Pax-5 3′UTR, we also made use of ARED-Plus [44]. Finally, for the prediction of miRNA targeting motifs upon the Pax-5 3′UTR, we made use of a series of prediction software. First, microRNA.org (http://www.microrna.org/) (accessed on 20 March 2019) [45] used the old Pax-5 reference sequence version number (NM_016734.1) from July 2013, which was characterized by a much shorter 3′UTR (2026 nucleotides (nts)). The score cut-off was set at −0.1 or lower for adequate prediction. A second tool, miRDB (http://mirdb.org/) (accessed on 20 March 2019) [46] used new reference gene versions (NCBI/NM_016734.3) from March 2015. The input 3′UTR length was 7285 nts, and the generated results defined by a score greater than 60 were an adequate prediction. Our last miRNA database was TargetScan (http://www.targetscan.org/vert_72/) (accessed on 20 March 2019) [47], a tool to search predicted microRNA targets in mammals that used a new version 7.2 released in March 2018 for miRNA prediction sites on a 7285 nts Pax-5 3′UTR.
3. Results
3.1. Pax-5 3′UTR Mapping and Polyadenylation Signal Prediction
Many genes undergo 3′UTR editing or truncation by way of APA signals to regulate gene expression [24,26,27]. Given the essential role of Pax-5 in B-cell maturation and cancer processes, we set out to clone, sequence, and map Pax-5 mRNA 3′UTR editing to gain a better understanding of post-transcriptional regulation leading to oncogenic Pax-5 expression. Interestingly, the Pax-5 transcript was characterized by a theoretical and approximated 7.2 kb sequence (NM_016734.3) [48]. To examine the Pax-5 transcript for putative polyadenylation signals, we made use of a series of polyA signal prediction tools such as: DNA polyA signal miner [40], PolyApred [41], and Softberry POLYAH [42] to generate a list of predicted sites at their respective nucleotide positions in relation to the Pax-5 stop codon (Supplementary Table S2). Canonical and non-canonical polyA signals identified from each database were then analyzed and compared. As expected, all polyA signals from the Pax-5 3′UTR were not predicted by every database because of the software’s respective algorithms and score thresholds. We identified up to 12 different and unique polyA signal sequences on the Pax-5 3′UTR where many canonical polyA consensus signals (5′-AATAAA-3′) were identified by multiple prediction databases (Supplementary Figure S1). Interestingly, two canonical sites located at 4912 and 6019 nts beyond the stop codon (i.e., 3′UTR lengths of 4912 and 6019, respectively) were predicted by all polyA prediction tools used.
To validate our computational predictions, we performed 3′ rapid amplification of cDNA ends (3′ RACE) on a series of cell model types commonly known to express endogenous Pax-5 to map Pax-5 3′UTR truncation generated by APA processes. Using B-cell lines (REH, Nalm6, and Raji) and breast epithelial cells (MCF7 and MCF10A), we cloned, sequenced, and aligned approximately 2000 amplified products from the Pax-5 mRNA 3′UTR. Interestingly, we observed that the overall Pax-5 3′UTR length and structure varied extensively among cell types examined (Figure 1). Specifically, in mammary epithelial models, all Pax-5 3′UTRs from MCF7 cancer cells were truncated at 3.3 kb downstream of the stop codon, whereas 3′UTRs from MCF10A (non-cancerous) terminated at 3.9 kb (Figure 1A). These Pax-5 3′UTR regions from mammary cells thus represented a loss of approximately 3.9 kb (MCF7) and 3.3 kb (MCF10A) at the 3′ extremity of the 3′UTR in comparison to the reported 7.2 kb “full-length” 3′UTR of the Pax-5 transcript (NCBI/NM_016734.3) [48]. We also found that the lengths and truncation of mammary cell-derived Pax-5 3′UTRs correlated with the predicted non-canonical polyadenylation signals located at approximately 3230 and 3902 nts, respectively, downstream of the stop codon.
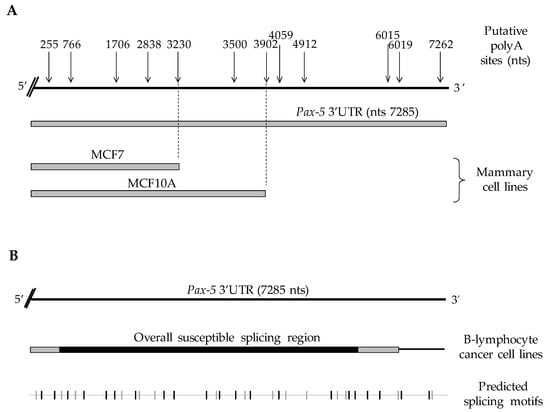
Figure 1.
Schematic representation of Pax-5 3′UTR editing in various cell types. Pax-5 3′UTR sequences isolated from (A) breast and (B) B-cell lines (Raji, REH and Nalm6) were amplified using 3′RACE, sequenced and aligned with the genomic Pax-5 3′UTR (top strand) marked with the predicted alternative polyA sites (top arrows) in relation to their nucleotide position after the stop codon. The bottom line represents a computational analysis of Pax-5 3′UTR putative splicing elements where the gray vertical nicks represent acceptor sites, whereas black vertical nicks represent donor elements for splicing sites (http://regrna2.mbc.nctu.edu.tw) (accessed on 20 March 2019).
On the other hand, Pax-5 3′UTR editing in B-cells was characterized by transcripts bearing 3′UTRs of various lengths and sequence profiles. In general, Pax-5 3′UTRs from B-cells did not exhibit premature truncation and preferentially used canonical polyA signals located at the distal 3′ end of the UTR. Interestingly, B-cell 3′UTRs underwent drastic splicing events (deletions up to 5.7 kb) resulting in a significant excision of the internal UTR regions within the Pax-5 transcript (Figure 1B). To map the various spliced 3′UTR profiles of Pax-5 transcripts in B-cells, we studied predicted splicing and regulatory RNA motifs using computational analyses (RNAreg 2.0) [43]. We found that sequenced regions from Pax-5 3′UTR splicing events correlated with predicted acceptor and donor regions of putative splicing sites (Figure 1B). These findings strongly suggested that Pax-5 transcription utilizes APA signals and alternative splicing events in a tissue-specific manner to elicit Pax-5 3′UTR editing.
3.2. Pax-5 3′UTR Alternative Splicing in Primary B-Lymphocytes and Clinical Samples
Given the notable differences in Pax-5 3′UTR splicing events found in B-cell lines, we expanded our investigation to examine B-lymphocytes isolated from primary peripheral blood mononuclear cells (PBMCs) from healthy donors and patients suffering from B-cell cancer lesions (follicular lymphoma/FL, chronic lymphocytic leukemia/CLL, and diffuse large B-cell lymphoma/DLBCL). To map Pax-5 3′UTR alternative splicing in primary B-cells, we performed 3′RACE to target and amplify the flanking sequences of the 3′UTR regions undergoing splicing and excision. As expected, splicing within the Pax-5 3′UTR was observed in all samples tested (i.e., 6 healthy donors and 17 cancer patients) (Figure 2). Interestingly, clinical cancer samples demonstrated greater excised 3′UTR regions in comparison to healthy donors. Also, the spliced region within the 3′UTR of healthy donors occurred more distally of the stop codon (approximately 1 kb downstream), whereas splicing within the 3′UTR in cancer cells occurred more upstream and proximal (approximately 300 nts) of the stop codon (Figure 2). In addition, the majority of Pax-5 3′UTRs sequenced in B-cell samples correlated with polyA-predicted sites located at approximately 6 kb in contrast to mammary cells where Pax-5 transcripts elicited early truncation by APA. These results supported our initial findings suggesting that Pax-5 3′UTR editing profiles appear to be tissue-dependent (mammary epithelial versus B-cells) and undergoing distinct molecular mechanisms (early truncation versus alternative splicing), respectively. Our observations also presented significant differences in polymorphic patterns of Pax-5 3′UTRs from clinical samples in comparison to healthy donors (i.e., greater excised 3′UTR regions) where cancer cells possessed overall shorter 3′UTRs.
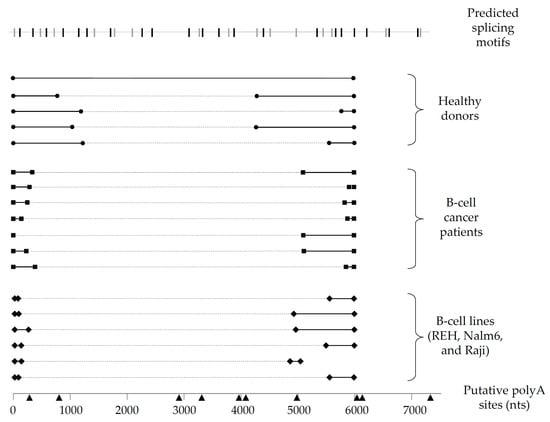
Figure 2.
Schematic representation of Pax-5 3′UTR editing in B-lymphocytes. Pax-5 3′UTR profiling of splicing patterns was performed in B-lymphocytes from healthy donors (filled circles), B-cell cancer patients (filled squares), and B-cell cancer lines (filled diamonds). The bold black lines represent the complementary alignment with the referenced full-length Pax-5 3′UTR sequence (NCBI/NM_016734.3) [48], whereas the dotted gray lines represent the excised sequences from the spliced region. Putative polyA signals (black triangles) located at their respective nucleotide position (bottom line) were predicted for polyA canonical and non-canonical motifs using bioinformatics software tools (i.e., Softberry POLYAH, DNA polyA signal miner, and PolyA pred).
3.3. UTR Editing of the Pax-5 Transcript Affects Ribosomal Translation
Given that oncogenes are known to shorten their 3′UTRs as a means to evade post-transcriptional regulation [27], we set out to assess the translational repercussions of 3′UTR editing of Pax-5 transcripts. To do so, polysomal fractionation combined with PCR was performed on B-cell lines (REH and Raji) and primary B-cells to determine potential differences in translational frequency between Pax-5 3′UTR-edited regions. Polysomal fractions were thus collected into two collection clusters where the lighter fragments representing low ribosome-bound mRNA (low translation frequency) were separated from the heavy fractions characterized by polyribosomes and high translation frequency. Total RNA from these groups was then purified for RT-PCR amplification, cloning, and sequencing. As expected, the heavier polyribosome complexes were bound to Pax-5 transcripts bearing shorter 3′UTRs in all B-cell lines tested (lanes 2 and 4, Figure 3). On the other hand, the fractions with low ribosomal complexes were associated with Pax-5 mRNAs with longer 3′UTR regions (lanes 1 and 3, Figure 3). Equally, primary B-cells from healthy donors also displayed shorter 3′UTR lengths complexed with heavier polysomal complexes (lane 6, Figure 3). However, primary B-cells, which generally express longer Pax-5 3′UTRs in comparison to cancer cells (Figure 2), also demonstrated these features in both light and heavy polysomal complexes (lanes 5 and 6) when compared with cancer cells (lanes 1 to 4, Figure 3). These results suggested that B-cell Pax-5 transcripts bearing shorter 3′UTRs are translated at a higher frequency in comparison to transcripts with longer 3′UTRs. Interestingly, when we repeated the polysomal fractionation assays with breast cancer cells, no differences were observed between polysomal density fractions. These observations may be a result of the relative minor differences in Pax-5 3′UTR editing in breast cell lines in terms of overall length and structure. Together, these results demonstrated that the overall length and structure of the Pax-5 3′UTR determine ribosomal occupancy leading to translation efficiency.
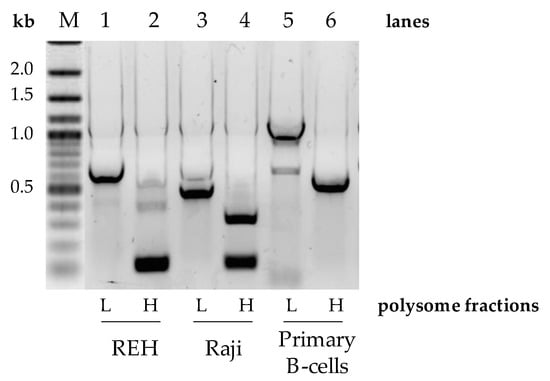
Figure 3.
Pax-5 3′UTR profiling from polysomal fractionation. The mRNA from polysomal fractions of B-cell populations was extracted, amplified by RT-PCR, and sequenced. Polysomal light (L) fractions represent low translational activities (none or few ribosomes attached to the mRNA), whereas heavy (H) fractions represent active mRNA translational complexes. PCR primers were designed to flank the excised spliced regions of the Pax-5 3′UTR and be compared between B-cell lines (REH and Raji) and primary CD19+ B-lymphocytes from healthy donor PBMCs. “M” indicates the reference molecular weight marker with corresponding nucleotide length kilobases (kb).
3.4. Impact of 3′UTR Editing on Pax-5 Post-Transcriptional Regulation
Given that Pax-5 transcripts bearing shorter 3′UTRs were preferably complexed with heavy polysomal fractions and high translation frequency, we set out to validate our findings using luciferase-based reporter assays. Using the pMiR-Report construct containing the luciferase gene under the CMV promoter (Figure 4A), we cloned the most abundant 3′UTR regions from B-cell cancers into the multiple cloning site located at the 3′ end of the luciferase sequence. The first construct (i.e., pMiR-6kb) contained the longest identified continuous Pax-5 3′UTR sequence of the Pax-5 3′UTR region. Our second construct (pMiR-1kb) consisted of the 3′UTR with an approximate total length of 1 kb represented by upstream (1–284 nts) and downstream (4982–5821 nts) sequences of the 3′UTR. In other words, the pMiR-1kb contained a 3′UTR with an internally spliced region of +285 to +4981 nts relative to the stop codon. Our final construct (pMiR-0.3kb) consisted of the 3′UTR with a spliced region excising nucleotides +52 to +5619, resulting in an approximate remaining 0.3 kb 3′UTR length (Figure 4A).
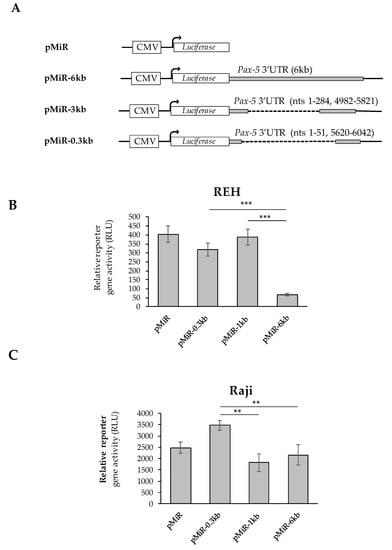
Figure 4.
Effects of Pax-5 3′UTR editing on translation potential. The most prominent spliced 3′UTR isoforms from Pax-5 transcripts isolated from B-cells were (A) cloned downstream of the firefly luciferase reporter gene. The pMiR-REPORT constructs were either left empty (pMiR) or contained a full-length Pax-5 3′UTR (pMiR-6kb); a 3′UTR variant of 1 kb (pMiR-1kb) or a 3′UTR variant of 0.3 kb (pMiR-0.3kb). The respective lengths and structures from each 3′UTR isoform and plasmid are indicated with their respective nucleotide (nt) positions relative to the stop codon. (B) REH and (C) Raji B-cell lines were transiently transfected with pMiR reporter constructs and evaluated for relative firefly luciferase activity. Relative light units (RLUs) were normalized for each transfection condition using qRT-PCR on puromycin (a resistance gene located on the backbone of the reporter plasmid). The presented data are the calculated means of three independent samples, where statistical analysis by t-test indicates significant differences with respect to control cells (** p < 0.01 and *** p < 0.001).
Reporter constructs were then transiently transfected into B-cell cancer cell lines (Raji and REH) where luciferase signals were normalized on transfection efficiency. In REH cells, we observed that reporter constructs bearing shorter 3′UTRs (i.e., pMiR-1kb and pMiR-0.3kb) exhibited significantly greater relative luciferase activity (83 and 79%, respectively) in comparison to plasmids with longer 3′UTR regions (pMiR-6kb) (Figure 4B). Similarly, transfections of Raji B-cells with reporter genes characterized by shorter 3′UTRs (i.e., pMiR-0.3kb) exhibited greater luciferase activity compared to plasmids with longer 3′UTRs (i.e., pMiR-6kb and pMiR-1kb) (Figure 4C). Interestingly, we also observed slight differences between the REH (immature) and the Raji (mature) B-cell models in terms of relative reporter activity associated with the pMiR-1kb construct. We believe that these variations may be due to cell type, lineage maturity, post-transcriptional regulating elements, and differential miRNA profiles from each cell type. Globally, our results demonstrated that mRNA translation frequency is significantly regulated by the Pax-5 3′UTR length and structure (sequence). These observations further strengthened the role and impact of 3′UTR editing in aberrant and oncogenic Pax-5 expression associated with B-cell cancers.
It has been well described that mRNA 3′UTR editing is a prominent process for oncogenes to avoid miRNA regulation [26,27]. To assess the impact of Pax-5 3′UTR shortening on its susceptibility to (or evasion of) miRNA regulation, we studied the activity of miRNA targeting on the internal excised regions found on shorter 3′UTRs from the Pax-5 transcript. Predicted miRNAs targeting the spliced 3′UTR region (nucleotides +52 to +5619) were established by web-based tools and cross-referenced with miRNAs from the literature for B-cell expression levels and role in B-cell biology or oncogenesis (Supplementary Table S3). Three miRNAs were thus selected (i.e., miR-1275, 217-5p, and 181a-5p) and validated for their expression in our B-cell models using RT-qPCR (Figure 5A). Given that only REH cells concomitantly expressed all three selected miRNAs, these cells were co-transfected with a pMiR-Report construct (pMiR-6kb or pMiR-0.3kb) and an anti-miRNA (inhibiting each selected miRNA).
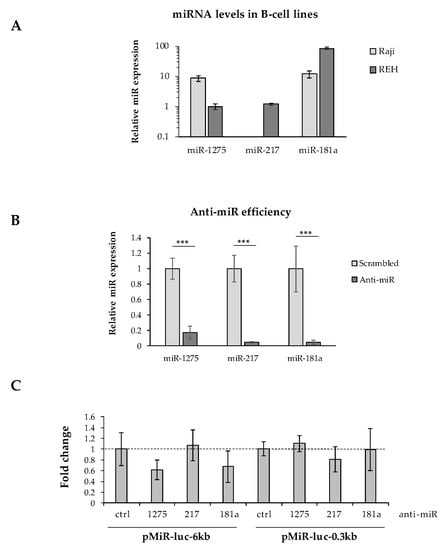
Figure 5.
Effects of Pax-5 3′UTR shortening on miRNA regulation. (A) Relative expression levels of miR-1275, miR-217, and miR-181a were determined in Raji and REH B-cell lines using TaqMan qPCR. Expressed levels were normalized and plotted in relative fold log expression over control samples (RNU48 expression). (B) REH cells were transiently transfected with anti-microRNA (anti-miR) inhibitors against miR-1275, miR-217, and miR-181a for 48 h. MiRNA silencing was then evaluated by TaqMan qPCR and compared to their respective transfected non-targeting controls (scrambled). MiRNA levels were normalized and plotted in relative expression over control samples (scrambled anti-miRs). (C) REH cells were transiently co-transfected with pMiR reporter constructs (pMiR-6kb versus pMiR-0.3kb) and anti-miR inhibitors (1275, 217, and 181a) then evaluated for relative luciferase activity. Relative light units (RLUs) were normalized and plotted in relation to control samples (scrambled anti-miRs) represented by a dotted line. The presented data are the calculated means of three independent biological assays, where statistical analysis by t-test indicates significant differences in respect to controls (*** p < 0.001).
Although anti-miR inhibitors effectively suppressed the levels of each selected miRNA (miR-1275, miR-217, and miR-181a) over 80% (Figure 5B), we were unable to determine whether any single miRNA tested could independently alter significant changes in luciferase reporter activity from either long (pMiR-6kb) or shortened/spliced 3′UTRs (pMiR-0.3kb) (Figure 5C). In fact, converse to our expectation, the inhibition of miR-1275 and miR-181a decreased the average luciferase activity from the pMiR-6kb construct harboring binding sites for these selected miRNAs. These results may be due to indirect mechanisms or downstream targets affected by the silenced miRNAs. Also, given the significant size of the excised 3′UTR region (5.7 kb), this sequence may encompass a myriad of post-transcriptional regulating elements and binding motifs.
3.5. Shortening of Pax-5 3′UTR Is Prevalent in B-Cell Cancer Malignancies
Given the oncogenic potency of Pax-5 products in B-cell malignancies, we hypothesized that aberrant overexpression of Pax-5 in these cancers may be due to 3′UTR shortening. As shown previously, Pax-5 3′UTR length inversely correlated with its reporter translation frequency. To validate these findings, we made use of RNA-seq data sets (The Cancer Genome Atlas and Gene Expression Omnibus) to examine Pax-5 3′UTR editing in the most common B-cell malignancies characterized with aberrant Pax-5 (ex: diffused large B-cell lymphoma/DLBCL [16,49] and chronic lymphocytic leukemia/CLL [50]) in comparison to healthy primary B-lymphocytes. We also analyzed 3′UTR editing in a series of common B-cell lines for a better conclusion. First, the expression data were compiled and plotted for Pax-5 differential expression. Comparison analysis of B-cell lines versus primary B-cells indicated a 6.53-fold increase in Pax-5 transcripts in this group (p < 0.001, Figure 6A). Accordingly, the overall expression level of Pax-5 in DLBCL and CLL cells was also significantly higher than normal B-cells, with changes of about 9.14- and 8.58-fold, respectively (p < 0.001).
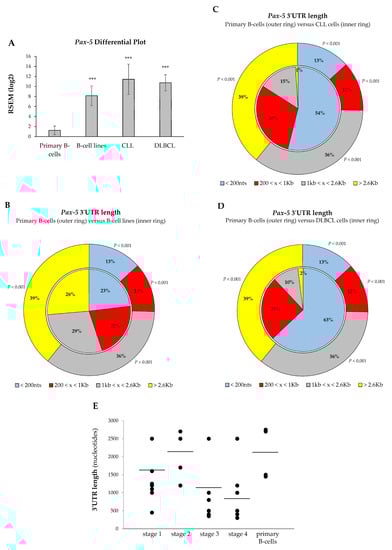
Figure 6.
3′UTR shortening profiles in B-cell cancer lesions. Comparison analyses of (A) Pax-5 transcript levels and overall 3′UTR length distribution were determined in (B) immortalized B-cell lines, (C) chronic lymphocytic leukemia/CLL, and (D) diffused large B-cell lymphoma/DLBCL. Compilation of RNA-sequencing data for Pax-5 was obtained from GSE16921 immortal B-cell data set (n = 41), GSE66117 CLL data set (n = 47), and TCGA-DLBCL data set (n = 48) versus two normal B-cell data sets GSE62246 (n = 2) and GSE70830 (n = 5), which were used as control samples (outer ring of panels B, C, and D). The read counts of these data sets were estimated by RSEM package (RNA-seq by expectation maximization). The asterisk and text indicate statistical differences by t-test analyses with respect to normal B-cell control samples (*** p < 0.001). (E) The Pax-5 3′UTR length was determined by RT-PCR in primary B-lymphocytes isolated from healthy donors (n = 7) and patients (n = 17) suffering from B-cell cancer lesions (Supplementary Table S4). The lengths of PCR-amplified products were then measured and plotted according to patients’ clinical disease staging. The average 3′UTR lengths in each category are indicated (black bars).
We next analyzed Pax-5 3′UTR shortening and its distribution within B-cell cancer subsets. Globally, transcript profiling of Pax-5 3′UTR lengths from B-cell cancers and B-cell lines demonstrated a significant shortening compared to healthy primary B-cells. For example, 75% of Pax-5 3′UTR sequences from primary B-cells extended beyond 1 kb in length, whereas only 13% of 3′UTRs were less than 200 nts (pie chart outer ring, Figure 6B). On the other hand, B-cell lines expressed 55% of 3′UTR sequences greater than 1 kb and 23% of 3′UTRs < 200 nts (inner ring, Figure 6B). This Pax-5 3′UTR landscape translates into B-cell cancer cell lines undergoing a 50% decrease (p < 0.001) in relatively long 3′UTRs (˃1 kb) and a 56% increase (p < 0.001) in short 3′UTRs (<200 nts) when compared to primary healthy B-cells.
Consistent with these results, analysis of DLBCL and CLL B-cells also expressed a significant shortening of Pax-5 3′UTR lengths. Data in CLL patients showed a 4.15-fold increase in Pax-5 transcripts with short 3′UTR lengths (<200 nts) compared to control primary cells (p < 0.001, Figure 6C). Similarly, DLBCL expressed 4.84-fold more Pax-5 transcripts with short 3′UTRs (<200 nts) compared with primary B-cells (p < 0.001, Figure 6D). Overall, these data indicated that the shortening of Pax-5 3′UTRs is widespread in B-cell cancer lesions.
3.6. Pax-5 3′UTR Shortening Relates with Hematopoietic Malignancy
We showed that cancer B-cells are characterized by a significant shortening of Pax-5 3′UTR regions in comparison to their healthy counterparts. We postulated that 3′UTR shortening may be associated with disease progression. To examine this, we measured overall lengths of Pax-5 3′UTRs by RT-PCR from patients with B-cell malignancies in relation to patient clinical staging of hematopoietic disease. Interestingly, the lengths from amplified Pax-5 3′UTRs demonstrated a trend with hematopoietic disease malignancy (Figure 6D). Specifically, we found that B-cells from healthy donors and B-cell cancers at early stages (1 and 2) appeared to contain longer Pax-5 3′UTR regions in comparison to patients with advanced disease (stage 3 and 4), which comprised significantly shorter 3′UTRs (Spearman’s rank correlation, rs = −0.8) (Figure 6D). These findings suggested that Pax-5 3′UTR shortening may correlate with B-cell hematopoietic disease progression. These results also brought physiological significance to 3′UTR editing in Pax-5 aberrant expression and hematopoietic malignancy.
4. Discussion
It is well established that adequate and strict regulation of Pax-5 expression is essential for B lymphocyte development and differentiation (reviewed in [51]). Conversely, aberrant Pax-5 expression is involved in the pathogenesis of B-cell lymphoid cancer and, more recently, of solid carcinomas [8,17,52,53]. Although the downstream activity and phenotype associated with Pax-5 expression are relatively well characterized, there is a paucity of studies elucidating the upstream regulatory mechanisms governing Pax-5 expression in healthy and malignant cellular settings. In this study, we described the first evidence of Pax-5 3′UTR editing and its effects on translation in human B-cells and lymphoid cancer lesions. Specifically, we demonstrated that the Pax-5 transcript utilizes alternative polyadenylation (APA) signals (both canonical and non-canonical) in addition to alternative splicing to alter its 3′UTR sequence and translational expression.
First, we profiled Pax-5 transcripts in mammary cell lines and found that the majority of Pax-5 3′UTRs measured between 3.3 and 3.5 kb, which was seemingly shorter than the putative reported 7.2 kb full-length sequence (NCBI/NM_016734.3) [48]. Also, in mammary cell lines, termination of Pax-5 transcripts consistently aligned with non-canonical polyA signals within the 3′UTR. Conversely, Pax-5 3′UTRs from B-lymphocytes depicted a much more diverse pattern of mRNA editing consisting of alternative splicing events and the use of canonical polyA signals. These findings thus described marked differences in Pax-5 3′UTR editing and in post-transcriptional regulation, which appeared to be tissue-dependent. Accordingly, these discrepancies in Pax-5 3′UTR editing were consistent with Pax-5 function, which was shown to exhibit dichotomous phenotypes depending on its cellular context. For example, Pax-5 promoted an oncogenic role in specific lymphoproliferative cancers (ex: CLL and DLBCL), whereas in mammary cancers, Pax-5 elicited tumor suppressor features and promoted cellular epithelialization [53,54].
We also observed that Pax-5 mRNAs from B-lymphocytes primarily aligned with distal canonical polyA sites (compared to proximal sites used by mammary cells). More importantly, B-cell Pax-5 transcripts were subjected to splicing and excision of internal regions in the 3′UTR (up to 5.7 kb). To our knowledge, this was the first evidence of 3′UTR alternative splicing of Pax-5 transcripts. These findings were envisaged given multiple reports of Pax-5 transcriptional editing processes at both the 5′ and 3′ extremities [10,13,55]. In fact, studies have estimated that 95% of gene transcripts undergo alternative splicing events [1,2,3] where only 4% of these events occur in the 3′UTR [56]. Furthermore, mRNAs encoding transcription factors are more commonly spliced (accounting for 14%) than other genes [57]. Although mRNA editing is vital for the expansion of gene products and function diversity, aberrant alternative splicing is also concomitantly linked to cancer [4]. Accordingly, our observation of extensive editing of Pax-5 3′UTRs in cancer cells may explain aberrant and oncogenic Pax-5 expression. This hypothesis was further supported by the association of Pax-5 3′UTR shortening to B-cell cancer progression.
Our findings concurred with previous reports indicating that shortening of mRNA 3′UTRs has major repercussions on translation, stability, and function [25,58]. Some studies have reported that 3′UTR shortening is a prominent event primarily observed in proliferating cells and oncogenes [26,27]. Our results supported these findings where Pax-5 overexpression in B-cell cancer cell lines and patient samples (i.e., CLL and DLBCL) are marked with significant shortening of Pax-5 3′UTRs. Most importantly, we associated 3′UTR shortening to various clinical stages of B-cell cancer progression. We thus propose that aberrant Pax-5 expression in B-cell cancer arises from 3′UTR editing to escape post-transcriptional regulation from co-interacting elements. Considering the extent of the 3′UTR editing of the Pax-5 transcript (5.7 kb deletion), we initially focused on trans-acting regulators such as miRNAs. It is well established that miRNAs convey an effective level of gene regulation leading to altered expression profiles and cancer cell behavior [59]. Mechanistically, miRNAs inhibit translation through the specific targeting of complementary sequences located on the target mRNA, notably in the 3′UTR [60]. We thus generated a list of predicted miRNAs targeting the Pax-5 3′UTR in cancer cells (Supplementary Table S3). As a result, the Pax-5 transcripts from breast cancer cells characterized by 3′UTRs 3.3 kb would theoretically escape more than half (51.5%) of the targeting miRNAs in comparison to the reported full-length 3′UTRs. More interestingly, Pax-5 transcripts from B-cells characterized by a 5.7 kb excision of the 3′UTR internal sequence would evade approximately 94% of the predicted targeting miRNAs. Pax-5 3′UTR editing is thus a determining factor of miRNA-mediated regulation of the Pax-5 oncogene in cancer cells.
Many of the miRNAs identified in Supplementary Table S3 are uncharacterized while others, such as miR-181a, miR-217, and miR-1275, have been reported as tumor suppressors or involved in cancer disease progression [61,62,63,64]. Suitably, we attempted to study the role of miR-1275, miR-217, and miR-181a in post-transcriptional regulation of Pax-5, given that these miRNAs and cognate binding motifs would be specifically lost following the editing and deletion of 3′UTR internal sequences. Although the overall length and structure (sequence) of Pax-5 3′UTRs had a significant effect on reporter activity (Figure 4), the inhibition of each selected miRNA did not alter the expression of reporter genes harboring long (pMiR-6kb) or short (pMiR-0.3kb) 3′UTRs (Figure 5). The latter tested miRNAs may be unable to solely regulate 3′UTR-dependant Pax-5 expression owing to the considerable size of the spliced region (5.7 kb) and its potential interactions with other post-transcriptional regulating elements. As mentioned previously, the 5.7 kb spliced internal region of the Pax-5 3′UTR would evade approximately 94% of all predicted targeting miRNAs (Supplementary Table S3).
In addition to miRNA regulation, adenylate/uridylate-rich elements (AU-rich elements/AREs) are also prevalent mRNA stability motifs located in 3′UTRs. These motifs allow RNA-binding proteins (RBPs) to regulate translation by targeting ARE-containing mRNAs for rapid degradation (reviewed in [65]). These cis-acting regulatory elements within 3′UTRs are most commonly found in human genes encoding proto-oncogenes, transcription factors, and cytokines involved vital cellular processes (ex: stress response, cell-cycle regulation, inflammation, apoptosis, etc.) and carcinogenesis [44,66]. The accessibility and interplay between AU-rich regulatory motifs and their respective RBPs within Pax-5 3′UTR variants may also contribute to the fate of mRNA stability and translation. Using AU-rich motif prediction software (RegRNA 2.0 [43] and ARED-Plus [44]), we identified four ARE sites (defined by a core AUUUA sequence motif) at positions +3767, +5702, +7091 and +7137 within the Pax-5 3′UTR. In this case, Pax-5 transcripts from B-cells with alternatively spliced 3′UTRs would be devoid of 75% of AREs, resulting in increased Pax-5 translation. Altogether, the truncation and excision of important regulatory motifs within the Pax-5 3′UTR will curtail cis- and trans-acting elements in an orchestrated manner to regulate mRNA half-life and protein translation efficacy [60,66,67].
Overall, our findings provide new evidence that the human Pax-5 transcript is submitted to 3′UTR editing (APA and alternative splicing). Shorter Pax-5 3′UTRs also promote downstream expression as demonstrated by increases in reporter gene activities. In addition, we found that Pax-5 3′UTR lengths are associated with B-cell cancer lesions and malignancy. Our study not only brings new insight to the molecular biology of the post-transcription processing of Pax-5 mRNA but also provides new potential mechanisms for aberrant Pax-5 expression in cancer cells. Globally, these preliminary findings warrant the need for further investigation as potential therapeutic options or diagnostic tools.
Supplementary Materials
The following are available online at https://www.mdpi.com/article/10.3390/cells11010076/s1, Figure S1: Prediction of putative polyA signals in the Pax-5 3′UTR, Table S1: In silico analysis of polyadenylation signals within the Pax-5 3′UTR, Table S2: Oligonucleotide primer sequences, Table S3: Predicted miRNA targeting of the Pax-5 3′UTR, Table S4: Clinical data relating to patient samples.
Author Contributions
Conceptualization, G.A.R.; Data curation, E.G. and N.C.; Formal analysis, A.-P.B., E.G., G.A.R. and N.C.; Funding acquisition, N.F. and G.A.R.; Investigation, N.F. and G.A.R.; Methodology, A.-P.B., B.H., R.G. and A.O.; Project administration, N.F. and G.A.R.; Resources, G.A.R. and N.F.; Software, E.G.; Writing of original draft, A.-P.B. and G.A.R.; Editing and review, B.H., E.G. and G.A.R. All authors have read and agreed to the published version of the manuscript.
Funding
This work was supported by grants from: the New Brunswick (NB) Innovation Foundation; the NB Health Research Foundation (NBHRF); and, by the DUO research grant program from the Vitalité Health network NB. Student salary support was allocated by the TD Bank Graduate Student Research Award at the Atlantic Cancer Research Institute (A.-P.B.) and the Beatrice Hunter Cancer Research Institute in partnership with the NBHRF (A.-P.B., R.G. and B.H.). G.A.R. is also supported by the Leukemia and Lymphoma Society of Canada and a Natural Sciences and Engineering Research Council of Canada (NSERC) Discovery Development Grant no. DDG-2020-00005.
Institutional Review Board Statement
Healthy donor and clinical samples were obtained from the G.L.-Dumont University Hospital Centre (GLDHC, Moncton, NB, Canada) biobank repository, which is also part of Exactis, a pan-Canadian repository for cancer biospecimens (https://www.exactis.ca) (accessed on 1 February 2020). This study was conducted in accordance with the guidelines of the Declaration of Helsinki of 1975 (revised 2013, https://www.wma.net/what-we-do/medical-ethics/declaration-of-helsinki/) (accessed on 1 February 2020). Institutional Review Board Statement and approval for studies involving human samples were granted by both the GLDHC-Vitalité Health Network (project: CER7-3-17 Ver. 5) and the Université de Moncton (Moncton, NB, Canada) (project: 1920-016) ethics evaluation committees.
Informed Consent Statement
Informed consent was obtained from all subjects involved in the study, which provided samples to the G.L.-Dumont University Hospital Centre (GLDHC, NB, Canada) biobank repository (part of Exactis, a pan-Canadian repository for cancer biospecimens (https://www.exactis.ca)) (accessed on 1 February 2020). During biobanking, biological samples are processed for storage and coded to render samples untraceable.
Conflicts of Interest
The authors declare no conflict of interests.
References
- Johnson, J.M.; Castle, J.; Garrett-Engele, P.; Kan, Z.; Loerch, P.M.; Armour, C.D.; Santos, R.; Schadt, E.E.; Stoughton, R.; Shoemaker, D.D. Genome-wide survey of human alternative pre-mRNA splicing with exon junction microarrays. Science 2003, 302, 2141–2144. [Google Scholar] [CrossRef]
- Pan, Q.; Shai, O.; Lee, L.J.; Frey, B.J.; Blencowe, B.J. Deep surveying of alternative splicing complexity in the human transcriptome by high-throughput sequencing. Nat. Genet. 2008, 40, 1413–1415. [Google Scholar] [CrossRef]
- Baralle, D.; Baralle, M. Splicing in action: Assessing disease causing sequence changes. J. Med. Genet. 2005, 42, 737–748. [Google Scholar] [CrossRef] [PubMed]
- Srebrow, A.; Kornblihtt, A.R. The connection between splicing and cancer. J. Cell Sci. 2006, 119, 2635–2641. [Google Scholar] [CrossRef]
- Barberis, A.; Widenhorn, K.; Vitelli, L.; Busslinger, M. A novel B-cell lineage-specific transcription factor present at early but not late stages of differentiation. Genes Dev. 1990, 4, 849–859. [Google Scholar] [CrossRef]
- Nutt, S.L.; Heavey, B.; Rolink, A.G.; Busslinger, M. Commitment to the b-lymphoid lineage depends on the transcription factor pax5. Nature 1999, 401, 556–562. [Google Scholar] [CrossRef] [PubMed]
- Morrison, A.M.; Nutt, S.L.; Thévenin, C.; Rolink, A.; Busslinger, M. Loss- and gain-of-function mutations reveal an important role of bsap (Pax-5) at the start and end of b cell differentiation. Semin. Immunol. 1998, 10, 133–142. [Google Scholar] [CrossRef] [PubMed]
- O’Brien, P.; Morin, P.; Ouellette, R.; Robichaud, G. The Pax-5 gene: A pluripotent regulator of B-cell differentiation and cancer disease. Cancer Res. 2011, 71, 7345–7350. [Google Scholar] [CrossRef] [PubMed]
- Zwollo, P.; Arrieta, H.; Ede, K.; Molinder, K.; Desiderio, S.; Pollock, R. The Pax-5 gene is alternatively spliced during B-cell development. J. Biol. Chem. 1997, 272, 10160–10168. [Google Scholar] [CrossRef] [PubMed]
- Robichaud, G.A.; Nardini, M.; Laflamme, M.; Cuperlovic-Culf, M.; Ouellette, R.J. Human Pax-5 C-terminal isoforms possess distinct transactivation properties and are differentially modulated in normal and malignant B cells. J. Biol. Chem 2004, 279, 49956–49963. [Google Scholar] [CrossRef]
- Robichaud, G.A.; Perreault, J.P.; Ouellette, R.J. Development of an isoform-specific gene suppression system: The study of the human Pax-5b transcriptional element. Nucleic Acids Res. 2008, 36, 4609–4620. [Google Scholar] [CrossRef] [PubMed][Green Version]
- Liu, M.L.; Rahman, M.; Hirabayashi, Y.; Sasaki, T. Sequence analysis of 5′-flanking region of human Pax-5 gene exon 1b. Zhongguo Shi Yan Xue Ye Xue Za Zhi 2002, 10, 100–103. [Google Scholar]
- Busslinger, M.; Klix, N.; Pfeffer, P.; Graninger, P.G.; Kozmik, Z. Deregulation of Pax-5 by translocation of the emu enhancer of the igh locus adjacent to two alternative Pax-5 promoters in a diffuse large-cell lymphoma. Proc. Natl. Acad. Sci. USA 1996, 93, 6129–6134. [Google Scholar] [CrossRef] [PubMed]
- Cazzaniga, G.; Daniotti, M.; Tosi, S.; Giudici, G.; Aloisi, A.; Pogliani, E.; Kearney, L.; Biondi, A. The paired box domain gene pax5 is fused to etv6/tel in an acute lymphoblastic leukemia case. Cancer Res. 2001, 61, 4666–4670. [Google Scholar] [PubMed]
- Nebral, K.; Konig, M.; Harder, L.; Siebert, R.; Haas, O.A.; Strehl, S. Identification of pml as novel pax5 fusion partner in childhood acute lymphoblastic leukaemia. Br. J. Haematol. 2007, 139, 269–274. [Google Scholar] [CrossRef]
- Poppe, B.; De Paepe, P.; Michaux, L.; Dastugue, N.; Bastard, C.; Herens, C.; Moreau, E.; Cavazzini, F.; Yigit, N.; Van Limbergen, H.; et al. Pax5/igh rearrangement is a recurrent finding in a subset of aggressive b-nhl with complex chromosomal rearrangements. Genes Chromosom. Cancer 2005, 44, 218–223. [Google Scholar] [CrossRef]
- Kanteti, R.; Nallasura, V.; Loganathan, S.; Tretiakova, M.; Kroll, T.; Krishnaswamy, S.; Faoro, L.; Cagle, P.; Husain, A.; Vokes, E.; et al. Pax5 is expressed in small-cell lung cancer and positively regulates c-met transcription. Lab. Investig. A J. Tech. Methods Pathol. 2009, 89, 301–314. [Google Scholar] [CrossRef]
- Leblanc, N.; Harquail, J.; Crapoulet, N.; Ouellette, R.J.; Robichaud, G.A. Pax-5 inhibits breast cancer proliferation through miR-215 up-regulation. Anticancer Res. 2018, 38, 5013–5026. [Google Scholar] [CrossRef]
- Harquail, J.; LeBlanc, N.; Landry, C.; Crapoulet, N.; Robichaud, G.A. Pax-5 inhibits Nf-κB activity in breast cancer cells through IKKε and mirna-155 effectors. J. Mammary Gland Biol. Neoplasia 2018, 23, 177–187. [Google Scholar] [CrossRef]
- Harquail, J.; LeBlanc, N.; Ouellette, R.J.; Robichaud, G.A. Mirnas 484 and 210 regulate Pax-5 expression and function in breast cancer cells. Carcinogenesis 2019, 40, 1010–1020. [Google Scholar] [CrossRef]
- Sachs, A. The role of poly(a) in the translation and stability of mRNA. Curr. Opin. Cell Biol. 1990, 2, 1092–1098. [Google Scholar] [CrossRef]
- Fabian, M.R.; Sonenberg, N.; Filipowicz, W. Regulation of mRNA translation and stability by micrornas. Annu. Rev. Biochem. 2010, 79, 351–379. [Google Scholar] [CrossRef]
- Andreassi, C.; Riccio, A. To localize or not to localize: MRNA fate is in 3′utr ends. Trends Cell Biol. 2009, 19, 465–474. [Google Scholar] [CrossRef] [PubMed]
- Tian, B.; Hu, J.; Zhang, H.; Lutz, C. A large-scale analysis of mRNA polyadenylation of human and mouse genes. Nucleic Acids Res. 2005, 33, 201–212. [Google Scholar] [CrossRef] [PubMed]
- Di Giammartino, D.; Nishida, K.; Manley, J. Mechanisms and consequences of alternative polyadenylation. Mol. Cell 2011, 43, 853–866. [Google Scholar] [CrossRef]
- Sandberg, R.; Neilson, J.R.; Sarma, A.; Sharp, P.A.; Burge, C.B. Proliferating cells express mRNAs with shortened 3′ untranslated regions and fewer microrna target sites. Science 2008, 320, 1643–1647. [Google Scholar] [CrossRef] [PubMed]
- Mayr, C.; Bartel, D. Widespread shortening of 3′utrs by alternative cleavage and polyadenylation activates oncogenes in cancer cells. Cell 2009, 138, 673–684. [Google Scholar] [CrossRef] [PubMed]
- Benzina, S.; Harquail, J.; Jean, S.; Beauregard, A.P.; Colquhoun, C.D.; Carroll, M.; Bos, A.; Gray, C.A.; Robichaud, G.A. Deoxypodophyllotoxin isolated from juniperus communis induces apoptosis in breast cancer cells. Anticancer Agents Med. Chem. 2015, 15, 79–88. [Google Scholar] [CrossRef]
- Livak, K.J.; Schmittgen, T.D. Analysis of relative gene expression data using real-time quantitative pcr and the 2(-delta delta c(t)) method. Methods 2001, 25, 402–408. [Google Scholar] [CrossRef]
- Esposito, A.M.; Mateyak, M.; He, D.; Lewis, M.; Sasikumar, A.N.; Hutton, J.; Copeland, P.R.; Kinzy, T.G. Eukaryotic polyribosome profile analysis. J. Vis. Exp. 2010, 40, 1948. [Google Scholar] [CrossRef] [PubMed]
- Kushwaha, G.; Dozmorov, M.; Wren, J.D.; Qiu, J.; Shi, H.; Xu, D. Hypomethylation coordinates antagonistically with hypermethylation in cancer development: A case study of leukemia. Hum. Genom. 2016, 10 (Suppl. 2), 18. [Google Scholar] [CrossRef]
- Deng, X.; Hiatt, J.B.; Nguyen, D.K.; Ercan, S.; Sturgill, D.; Hillier, L.W.; Schlesinger, F.; Davis, C.A.; Reinke, V.J.; Gingeras, T.R.; et al. Evidence for compensatory upregulation of expressed x-linked genes in mammals, caenorhabditis elegans and drosophila melanogaster. Nat. Genet. 2011, 43, 1179–1185. [Google Scholar] [CrossRef]
- Raju, S.; Kretzmer, L.Z.; Koues, O.I.; Payton, J.E.; Oltz, E.M.; Cashen, A.; Polic, B.; Schreiber, R.D.; Shaw, A.S.; Markiewicz, M.A. Nkg2d-nkg2d ligand interaction inhibits the outgrowth of naturally arising low-grade b cell lymphoma in vivo. J. Immunol. 2016, 196, 4805–4813. [Google Scholar] [CrossRef]
- Koues, O.I.; Kowalewski, R.A.; Chang, L.W.; Pyfrom, S.C.; Schmidt, J.A.; Luo, H.; Sandoval, L.E.; Hughes, T.B.; Bednarski, J.J.; Cashen, A.F.; et al. Enhancer sequence variants and transcription-factor deregulation synergize to construct pathogenic regulatory circuits in B-cell lymphoma. Immunity 2015, 42, 186–198. [Google Scholar] [CrossRef]
- Kim, D.; Pertea, G.; Trapnell, C.; Pimentel, H.; Kelley, R.; Salzberg, S.L. Tophat2: Accurate alignment of transcriptomes in the presence of insertions, deletions and gene fusions. Genome Biol. 2013, 14, R36. [Google Scholar] [CrossRef]
- Sun, L.; Luo, H.; Bu, D.; Zhao, G.; Yu, K.; Zhang, C.; Liu, Y.; Chen, R.; Zhao, Y. Utilizing sequence intrinsic composition to classify protein-coding and long non-coding transcripts. Nucleic Acids Res. 2013, 41, e166. [Google Scholar] [CrossRef]
- Kang, Y.J.; Yang, D.C.; Kong, L.; Hou, M.; Meng, Y.Q.; Wei, L.; Gao, G. Cpc2: A fast and accurate coding potential calculator based on sequence intrinsic features. Nucleic Acids Res. 2017, 45, W12–W16. [Google Scholar] [CrossRef]
- Finn, R.D.; Coggill, P.; Eberhardt, R.Y.; Eddy, S.R.; Mistry, J.; Mitchell, A.L.; Potter, S.C.; Punta, M.; Qureshi, M.; Sangrador-Vegas, A.; et al. The pfam protein families database: Towards a more sustainable future. Nucleic Acids Res. 2016, 44, D279–D285. [Google Scholar] [CrossRef]
- Lin, M.F.; Jungreis, I.; Kellis, M. Phylocsf: A comparative genomics method to distinguish protein coding and non-coding regions. Bioinformatics 2011, 27, i275–i282. [Google Scholar] [CrossRef]
- Liu, H.; Han, H.; Li, J.; Wong, L. Dnafsminer: A web-based software toolbox to recognize two types of functional sites in DNA sequences. Bioinformatics 2005, 21, 671–673. [Google Scholar] [CrossRef]
- Ahmed, F.; Kumar, M.; Raghava, G.P. Prediction of polyadenylation signals in human DNA sequences using nucleotide frequencies. In Silico Biol. 2009, 9, 135–148. [Google Scholar] [CrossRef]
- Salamov, A.A.; Solovyev, V.V. Recognition of 3′-processing sites of human mRNA precursors. Comput. Appl. Biosci. 1997, 13, 23–28. [Google Scholar] [CrossRef]
- Chang, T.H.; Huang, H.Y.; Hsu, J.B.; Weng, S.L.; Horng, J.T.; Huang, H.D. An enhanced computational platform for investigating the roles of regulatory RNA and for identifying functional RNA motifs. BMC Bioinform. 2013, 14 (Suppl. 2), S4. [Google Scholar] [CrossRef] [PubMed]
- Bakheet, T.; Williams, B.R.; Khabar, K.S. Ared 3.0: The large and diverse au-rich transcriptome. Nucleic Acids Res. 2006, 34, D111–D114. [Google Scholar] [CrossRef] [PubMed]
- Betel, D.; Wilson, M.; Gabow, A.; Marks, D.S.; Sander, C. The microrna.Org resource: Targets and expression. Nucleic Acids Res. 2008, 36, D149–D153. [Google Scholar] [CrossRef] [PubMed]
- Chen, Y.; Wang, X. Mirdb: An online database for prediction of functional microrna targets. Nucleic Acids Res. 2020, 48, D127–D131. [Google Scholar] [CrossRef]
- Agarwal, V.; Bell, G.W.; Nam, J.W.; Bartel, D.P. Predicting effective microrna target sites in mammalian mRNAs. Elife 2015, 4, e05005. [Google Scholar] [CrossRef]
- Zhao, W.; Liu, M.; Li, H.; Wang, S.; Tang, S.; Kong, R.M.; Yu, R. Ultra-sensitive label-free electrochemical detection of the acute leukaemia gene Pax-5a based on enzyme-assisted cycle amplification. Biosens. Bioelectron. 2019, 143, 111593. [Google Scholar] [CrossRef] [PubMed]
- Torlakovic, E.; Slipicevic, A.; Robinson, C.; DeCoteau, J.F.; Alfsen, G.C.; Vyberg, M.; Chibbar, R.; Flørenes, V.A. Pax-5 expression in nonhematopoietic tissues. Am. J. Clin. Pathol. 2006, 126, 798–804. [Google Scholar] [CrossRef] [PubMed]
- Krenacs, L.; Himmelmann, A.; Quintanilla-Martinez, L.; Fest, T.; Riva, A.; Wellmann, A.; Bagdi, E.; Kehrl, J.; Jaffe, E.; Raffeld, M. Transcription factor B-cell-specific activator protein (bsap) is differentially expressed in b cells and in subsets of B-cell lymphomas. Blood 1998, 92, 1308–1316. [Google Scholar] [CrossRef] [PubMed]
- Cobaleda, C.; Schebesta, A.; Delogu, A.; Busslinger, M. Pax5: The guardian of b cell identity and function. Nat. Immunol. 2007, 8, 463–470. [Google Scholar] [CrossRef] [PubMed]
- Lang, D.; Powell, S.K.; Plummer, R.S.; Young, K.P.; Ruggeri, B.A. Pax genes: Roles in development, pathophysiology, and cancer. Biochem. Pharmacol. 2007, 73, 1–14. [Google Scholar] [CrossRef] [PubMed]
- Benzina, S.; Beauregard, A.-P.; Guerrette, R.; Jean, S.; Faye, M.D.; Laflamme, M.; Maïcas, E.; Crapoulet, N.; Ouellette, R.J.; Robichaud, G.A. Pax-5 is a potent regulator of E-cadherin and breast cancer malignant processes. Oncotarget 2017, 8, 12052–12066. [Google Scholar] [CrossRef]
- Vidal, L.; Perry, J.; Vouyovitch, C.; Pandey, V.; Brunet-Dunand, S.; Mertani, H.; Liu, D.-X.; Lobie, P. Pax5alpha enhances the epithelial behavior of human mammary carcinoma cells. Mol. Cancer Res. MCR 2010, 8, 444–456. [Google Scholar] [CrossRef] [PubMed]
- Borson, N.D.; Lacy, M.Q.; Wettstein, P.J. Altered mRNA expression of pax5 and blimp-1 in b cells in multiple myeloma. Blood 2002, 100, 4629–4639. [Google Scholar] [CrossRef]
- Modrek, B.; Resch, A.; Grasso, C.; Lee, C. Genome-wide detection of alternative splicing in expressed sequences of human genes. Nucleic Acids Res. 2001, 29, 2850–2859. [Google Scholar] [CrossRef]
- Danckwardt, S.; Kaufmann, I.; Gentzel, M.; Foerstner, K.U.; Gantzert, A.S.; Gehring, N.H.; Neu-Yilik, G.; Bork, P.; Keller, W.; Wilm, M.; et al. Splicing factors stimulate polyadenylation via uses at non-canonical 3′ end formation signals. EMBO J. 2007, 26, 2658–2669. [Google Scholar] [CrossRef]
- Akman, B.H.; Can, T.; Erson-Bensan, A.E. Estrogen-induced upregulation and 3′-utr shortening of cdc6. Nucleic Acids Res. 2012, 40, 10679–10688. [Google Scholar] [CrossRef] [PubMed]
- Di Leva, G.; Garofalo, M.; Croce, C.M. Micrornas in cancer. Annu. Rev. Pathol. 2014, 9, 287–314. [Google Scholar] [CrossRef]
- Bartel, D. Micrornas: Target recognition and regulatory functions. Cell 2009, 136, 215–233. [Google Scholar] [CrossRef] [PubMed]
- Wang, X.; Li, M.; Wang, Z.; Han, S.; Tang, X.; Ge, Y.; Zhou, L.; Zhou, C.; Yuan, Q.; Yang, M. Silencing of long noncoding RNA malat1 by miR-101 and miR-217 inhibits proliferation, migration, and invasion of esophageal squamous cell carcinoma cells. J. Biol. Chem. 2015, 290, 3925–3935. [Google Scholar] [CrossRef] [PubMed]
- Li, J.; Li, D.; Zhang, W. Tumor suppressor role of miR-217 in human epithelial ovarian cancer by targeting igf1r. Oncol. Rep. 2016, 35, 1671–1679. [Google Scholar] [CrossRef] [PubMed]
- Wei, Y.; Lai, X.; Yu, S.; Chen, S.; Ma, Y.; Zhang, Y.; Li, H.; Zhu, X.; Yao, L.; Zhang, J. Exosomal miR-221/222 enhances tamoxifen resistance in recipient er-positive breast cancer cells. Breast Cancer Res. Treat. 2014, 147, 423–431. [Google Scholar] [CrossRef] [PubMed]
- Pena-Chilet, M.; Martinez, M.T.; Perez-Fidalgo, J.A.; Peiro-Chova, L.; Oltra, S.S.; Tormo, E.; Alonso-Yuste, E.; Martinez-Delgado, B.; Eroles, P.; Climent, J.; et al. Microrna profile in very young women with breast cancer. BMC Cancer 2014, 14, 529. [Google Scholar] [CrossRef]
- Chen, C.Y.; Shyu, A.B. Au-rich elements: Characterization and importance in mRNA degradation. Trends Biochem. Sci. 1995, 20, 465–470. [Google Scholar] [CrossRef]
- Khabar, K.S. Hallmarks of cancer and AU-rich elements. Wiley Interdiscip. Rev. RNA 2017, 8, e1368. [Google Scholar] [CrossRef] [PubMed]
- Filipowicz, W.; Bhattacharyya, S.N.; Sonenberg, N. Mechanisms of post-transcriptional regulation by micrornas: Are the answers in sight? Nat. Rev. Genet. 2008, 9, 102–114. [Google Scholar] [CrossRef] [PubMed]


Publisher’s Note: MDPI stays neutral with regard to jurisdictional claims in published maps and institutional affiliations. |
© 2021 by the authors. Licensee MDPI, Basel, Switzerland. This article is an open access article distributed under the terms and conditions of the Creative Commons Attribution (CC BY) license (https://creativecommons.org/licenses/by/4.0/).