1. Introduction
Rice (
Oryza sativa L.) is one of the essential staple cereal crops around the world, supplying over 21% of the calorific needs of the world population and playing an important role in food security and human nutrition [
1,
2]. Globally, rice is grown over an area of approximately 163 million hectares, amounting to an annual production of 758.8 million tons in 2017 [
3]. Given the world’s population growth rate, an additional 26 million tons per year in world grain production is required. Moreover, food habits are changing due to rising living standards, such as the increased consumption of livestock products (such as meat, eggs, and milk), which drives the increase in demand for feed grains, especially in Asia [
4,
5]. At present, China’s area under rice cultivation is 30.3 million hectares with the total yield reaching 207.7 million tons and an average yield of 6.8 t ha
−1, which is 65% higher than that of the world average [
6]. China, the world’s largest rice producer, has sustainably fed 22% of the world’s population using only 7% of the arable land in the world. However, in the past 10 years, increases in rice yield have been slowing down in China, and the increasing population and shortage of arable land have exerted tremendous stress on food security [
7]. Therefore, to ensure food security for the growing population, improving rice productivity (production per unit area) remains a priority in China.
Much emphasis has been put on genetic diversity in rice breeding programs to increase yield potential, but inadequate crop management practices of farmers may be one of the main constraints to increasing rice productivity [
8,
9]. Hence, it is imperative to simultaneously consider genotype and agronomic practices to exploit the true yield potential of high-yielding rice cultivars and achieve a sustainable increase in rice productivity. The application of nitrogen-efficient genotypes integrated with nitrogen fertilizer is an important approach to improve upland rice yield and reduce fertilizer N for this crop [
10]. Playing a main role in the formation of chlorophyll, proteins, and nucleic acids, nitrogen (N) is a major element that determines crop yield and greatly contributes to rice production [
8,
11]. In the last 50 years, global rice yield has continuously increased, partly because of the increase in fertilizer use, especially those containing the nutrient nitrogen [
12,
13,
14]. To maximize grain output, farmers frequently apply more N fertilizer than the minimum needed for the maximum crop growth [
15]. Overuse of N fertilizer has become wide spread in China, where the average N application rate for rice production was 180 kg ha
-1, approximately 75% higher than the global average [
13]. However, the use of N fertilizer is generally inefficient; only 20 to 30 percent of N is taken up by the rice plant. A large proportion of N is lost through surface run-off; nitrate leaching in groundwater; volatilization of the atmosphere, thus increasing greenhouse gas emissions; or by microbial denitrification. These practices not only cause environmental pollution but also increase the cost of production [
16,
17]. Furthermore, excessive application of N fertilizer may lead to a decrease in rice yield because it increases susceptibility to lodging, pests, and diseases, and delays maturity [
8,
18,
19]. Numerous studies have pioneered various improved nitrogen management strategies to obtain higher grain yield and nitrogen use efficiency in rice, such as site-specific N management [
13] and integrated soil–crop system management practices [
20]. Whereas most of these enhanced nitrogen management techniques either optimize the total N input or decrease the N losses, they require extensive technical support that is limited by its dissemination to farmers, with the overall yield remaining unchanged. Proper management of nitrogen fertilizer usage in rice fields has been considered an effective field tactic, not only for increasing grain yield, but also for its beneficial environmental impacts.
In addition to nitrogen, planting density is another key factor in determining crop yield [
21,
22]. Due to labor shortages and high seed costs, farmers transplant rice with a wide spacing. As a result, rice grain yield will decrease because of inadequate rice densities [
23]. It has been established that the panicle number per unit area plays an important role in determining yield and increasing the tiller number may be a feasible way to offset grain yield losses [
24,
25]. The tiller number has a close relationship with the panicle number per unit area, and moreover, a positive relationship between the tiller number and planting density is generally observed, as the planting density is considered one of the main factors affecting tillering [
26]. On the other hand, a high planting density could lead to a yield reduction because of an excessive tiller number, increased ineffective tiller percentage, high spikelet sterility, and a reduced number of grains per panicle [
27]. Furthermore, the dense canopy with less ventilation and more moisture around the plants at high planting density can create good conditions for disease and insects, and make plants more susceptible to lodging, which consequently causes rice yield losses [
28]. Therefore, the optimum planting density is critical for increasing rice yield through an increase in the total spikelet number, despite the contradictions from other yield factors.
Recently, numerous studies involving the combination of different crop management strategies and tactics, such as varied planting densities, water management, and different nutrient compositions, have been conducted, particularly in low latitude regions such as southern China, Pakistan, Philippines, and so on [
7,
8,
9,
29,
30,
31,
32]. However, relatively few researchers have focused on the interactive effects of planting density and nutrient management on rice yield in northern China. It is well known that rice production is different between southern and northern China [
33]. Due to global warming, serious heat damage to the crop in southern rice growing areas of the Yangtze River basin has shifted some rice production northwards. Northeastern China is one of the most important rice farming regions, and rice hectarage has increased due to the increase in temperature [
8]. Thus, studies on crop management in northeast China are necessary to optimize nutrient concentrations, and the planting density in rice production of northern China is very important for achieving food security and sustainable development.
Rice yield is determined by yield components including panicle number per unit area, spikelet number per panicle, percentage of filled grains, and 1000-grain weight. Therefore, it is very important to master agronomic practices that affect these yield components, and consequently, the grain yield. However, much effort has focused on N efficiency, the SPAD value, N and biomass accumulation, and N metabolism [
24,
34], while less attention has been paid to the influence of the main yield formation factors. Therefore, this field experiment was conducted using inbred and hybrid rice cultivars at two sites in Liaoning Province, China, over a two-year period. The objectives of this study were to: (1) evaluate the effects of different N rates and planting densities on rice grain yield, particularly on the main yield components; and (2) develop an optimum combination of N rate and planting density aimed at achieving high yield with optimal inputs for rice production in northeastern China.
2. Materials and Methods
2.1. Experimental Sites and Soil Properties
Field trials were carried out at the Teaching and Research Institute of Shenyang Agricultural University, Shenyang, in Liaoning Province, China (41°48′N,123°24′E), and in a farmer’s field in Teng’ao County, Anshan, in Liaoning Province, China (40°17′N,122°10′E), in 2015 and were repeated in the same field in 2016. The soil types of Shenyang and Anshan are loam and clay, respectively. Soil samples were collected from the tested fields before plowing at a 0–20 cm depth; samples were air-dried, sieved, and analyzed in the laboratory using standard techniques wherein basic physical and chemical properties were estimated (
Table 1).
2.2. Tested Materials
The experimental materials used were two japonica inbred rice cultivars Shendao 47 (a middle-tillering, mid-sized panicle cultivar), Shendao 505 (a relatively heavy-tillering, short stiff-strawed cultivar, small-sized panicle), and one japonica hybrid rice cultivar Jingyou 586 (a low-tillering, large-sized panicle cultivar). These three cultivars have been well-received and widely grown by local farmers. Rice seeds were pre-germinated each year and subsequently sown in a seedbed on 14 April and 19 April and transplanted on 24 May and 25 May 2015, at Shenyang and Anshan, respectively, while in 2016, pre-germinated seeds were sown on 13 April and 17 April and transplanted on 22 May and 26 May, respectively. Seedlings with four leaves were manually transplanted to the experimental field using a labeled rope to delineate the sub-plots.
2.3. Experimental Design and Crop Management
Experiments were arranged in a split-split-plot design with nitrogen application rates as the main plot, planting densities as the subplot, and cultivars as the sub-subplot with three replications. The size of each plot was 18 m2 (5 m long, 3.6 m wide, and 12 rows with a 30-cm row spacing). The treatments in each year were arranged in a randomized block design with three replications to give a total of 108 experimental units. The planting densities of 25 × 104 (D1), 16.7 × 10⁴ (D2), and 12.5 × 10⁴ hills ha−1 (D3) were used with three seedlings per hill for conventional japonica rice and two seedlings per hill for hybrid japonica rice. Plant density treatments D1, D2, and D3 had hill spacings of 30 × 13.3 cm, 30 × 19.8 cm, and 30 × 26.7 cm, respectively. The total N amounts of the four N fertilizer application rates were 0 (N0), 140 (N1), 180 (N2), and 220 kg ha−1 (N3), which were sequentially applied as follows: 50% at basal, 30% at 7 days after transplanting, and the remaining 20% at the panicle initiation of each cultivar (the panicle initiation dates of cultivars in Ashan and Shenyang were 22 June and 24 June 2015, respectively, and 20 June and 23 June 2016, respectively). All nitrogen fertilizers were applied in the form of urea. Phosphorus (90 kg P2O5 ha−1 as triple superphosphate) and potassium (75 kg K2O ha−1 as potassium sulfate) were applied in all plots one day before transplanting. To prevent fertilizer and water flow between neighboring plots, the plots were separated by 50-cm-wide ridges with plastic film inserted into the soil at a depth of 20 cm. The field was flooded after transplanting, and a flood water depth of 3–5 cm was maintained until the tillering stage, and then the water was drained at the maximum tillering stage to reduce unproductive tillers; re-watering at the booting stage with the water layer of 3–5 cm until the heading stage; and performing wetting–drying alternation irrigation during grain filling duration; and draining water a week before maturity. Weeds, pest insects, and diseases were intensively controlled using chemicals to avoid biomass and yield losses.
2.4. Measurement and Sampling
The tiller or panicle numbers of 30 randomly selected hills from each plot counted at the maximal tillering, and heading and maturity stages were used to estimate the mean maximal and mean panicle numbers per hill at both stages, respectively, for each location in both years. Six hills were sampled from each plot at full heading and maturity. After recording the number of panicles, the plant samples were separated into leaves, stems (culm plus sheath), and panicles. The dry weights of each organ were determined after oven-drying at 70 °C to a constant weight. At maturity, the number of panicles of 30 hills in each plot was counted to determine the number of panicles per unit area, and plants from six representative hills were sampled diagonally from the middle of each plot. Plants were manually threshed to separate the grains from straw. The threshed grain samples were air-dried and then submerged in a 50% alcohol (V
water:V
alcohol = 1:1) solution to separate filled spikelets from unfilled spikelets and then oven-dried at 70 °C to a constant weight. Three subsamples of 20 g of filled grains were manually counted to determine the 1000-grain weight (20 divided by the counted number of filled spikelets and then multiplied by 1000), and the number of filled spikelets was calculated as the total dry weight of filled grains divided by the grain weight. All unfilled spikelets were manually counted, and the total number of spikelets (filled and unfilled) was calculated. Spikelets per panicle (ratio of total spikelet number to panicle number) and the seed-setting rate (ratio of filled spikelet number to total spikelet number) were calculated. Grain yield at maturity with a grain moisture around 20% was estimated by manually harvesting a 4.8 m
2 (the middle four rows by 3 m) area of each plot using a sickle. Grain yields were adjusted to 14.5% moisture content. The harvest index was calculated using the following formula.
At heading stage, five plants were randomly chosen in each plot and the flag leaf or fully expanded leaf from the top plants was labeled to investigate photosynthesis, chlorophyll content (SPAD value), and the leaf area index. The photosynthesis was measured with a LI-6400 photosynthesis system (Li-Cor Inc., Lincoln, Nebraska USA) during 9:00 a.m.–11:00 a.m. on a sunny and calm day once a year on August 18, 2015, and August 16, 2016. The parameters measured included stomatal conductance (Gs), net photosynthesis rate (Pn), transpiration rate (Tr), and intercellular CO2 concentration (Ci), which were automatically recorded. Meanwhile, five labeled leaves were selected to measure the chlorophyll content (SPAD value) with a Minolta SPAD-502 chlorophyll meter (Minolta, Tokyo Japan). The upper, middle, and lower parts of each selected leaf were measured, and then the mean of the three readings was calculated as the SPAD value for the given leaf. The total green leaf area of each labeled plant was measured using a leaf area meter (LI-300, Li-Cor Inc., Lincoln, NE, USA) to determine the leaf area index (LAI).
2.5. Statistical Analysis
Analysis of variance (ANOVA) was completed using the GLM procedure in SAS (version 9.4, SAS Institute, Cary, NC, USA). All significant treatment effects were determined using the least significant difference (LSD) at
p < 0.05, and significant correlation coefficients were identified based on
p < 0.05. All figures were generated with Origin 9.0 (OriginLab, Northampton, MA, USA), and the standard errors of the means were calculated and presented in the graphs as error bars. The method of poly linear regressed analysis was used to establish the regression models between grain yield and agronomic treatments (nitrogen and planting density). ANOVA did not show any significant difference between the two years and two locations (
Table 2); as a consequence, we reanalyzed the data with a reducing model by removing the insignificant factors, which in this case was the year and location factors. The presented means were the averaged results across locations and years.
3. Results
3.1. Grain Yield and Yield Components
For the random factors, grain yield was significantly (
p < 0.0001) affected by the year but not by the location or the interaction of year by location (
Table 2). For the fixed factors, the effect of cultivars on grain yield was significant. On average, Jingyou 586 produced 2.7% and 3.5% higher grain yield than Shendao 47 and Shendao 505, respectively. Different N rates and planting densities significantly affected grain yield. Furthermore, the interactive effects between cultivar and N rate, cultivar and planting density, and N rate and planting density were significant on grain yield.
In terms of grain yield, different cultivars responded differently to N rate and planting density. Under different N rates and planting density combinations (
Table 3), the highest grain yield (10.97 t ha
−1 from Shendao 47) was observed in the N3D2 treatment, while the yield was not significantly different among the N3D2, N3D1, and the N2D1 treatments. Compared with the N3 treatment, the highest grain yields under N0, N1, and N2 treatments were all observed in the D1 treatment and were significantly reduced with decreased planting density. These results indicated that the increase in grain yield relied on an increase in planting density when the N application rate was at a moderate level. However, grain yield in the N3D1 treatment was lower than that in the N2D1 treatment, implying that when planting density was at a high level, the application of more N fertilizer had a negative effect on the yield. Compared to the other treatments, the N2D1 treatment produced the highest grain yield (10.84 t ha
−1) for Shendao 505, whereas grain yield significantly decreased in the N3D1 treatment. Grain yield significantly decreased when the amount of N fertilizer applied was more than the amount of the N2 level. Moreover, the reduced planting density resulted in yield reduction. In addition, when the N application rate was at the N3 level, reducing the planting density did not affect grain yield, and the difference among D1, D2, and D3 was not statistically significant. For Jingyou 586, the highest grain yield was observed in the N3D3 treatment. The average grain yield for the N rate markedly increased under the N3 treatment (10.96 t ha
−1) compared with the N0, N1, and N2 treatments (7.68 t ha
−1 under the N0 treatment, 9.76 t ha
−1 under the N1 treatment, and 10.68 t ha
−1 under the N2 treatment). Under a constant N rate, grain yield increased with increasing planting density, except for N3. When the amount of N fertilizer applied was more than the N1 level, a nonsignificant difference was observed among the three densities, implying that when N supply was sufficient, planting density did not affect grain yield. The N0 level consistently produced the lowest grain yields regardless of cultivar and plant density across year and site.
The ANOVA for yield component traits, including effective panicles, number of spikelets per panicle, number of spikelets per unit ground area, percentage of filled grains, and 1000-grain weight, is shown in
Table 2. Generally, cultivar, N rate, planting density, and the interaction between the cultivar and the N rate had significant effects on yield components. The interaction between cultivar and the density had a significant effect on effective panicles, spikelets per unit, and 1000-grain weight, but not for spikelets per panicle and grain filling percentage. In addition, the interactive effect between N rate and planting density was significant for all yield components, except for spikelets per panicle and 1000-grain weight.
For all cultivars, the effective panicle number per unit area all increased significantly with the increase of N rate and planting density, and the N3D1 treatment demonstrated the greatest values, which were 360.9, 416.7, and 279.9 m−2 for Shendao 47, Shendao 505, and Jingyou 586, respectively. The N0D3 treatment consistently showed the lowest effective panicles per unit area, ranging from 156.7 to 228.6 m−2. Effective panicle number per unit area differed significantly among the three cultivars. The mean panicle number of Shendao 505 was 24.5% and 34.9% greater than that of Shendao 47 and Jingyou 586, respectively.
Unlike effective panicles per unit area, the spikelets per panicle increased with a decrease in planting density. In each N rate treatment, increasing planting density resulted in a continuous decrease in spikelets per panicle. Jingyou 586 had significantly higher spikelets per panicle than Shendao 47 and Shendao 505. Spikelets per unit area being affected by cultivar, N rate, and planting density followed a similar pattern as the effects on grain yield. The higher number of spikelets per unit area in Shendao 47 was attributed to both the greater numbers of effective panicles and spikelets per panicle, while the greater number of effective panicles and the greater panicle size contributed to the higher number of spikelets per unit area for Shendao 505 and Jingyou 586, respectively.
There were small and inconsistent differences among treatments in the grain filling percentage and 1000-grain weight for three cultivars. Grain filling percentage and 1000-grain weight showed an overall decreasing trend as N rate and planting density were increased. For example, the N0 treatment demonstrated the greatest grain filling percentage given the same other factors. The 1000-grain weight was affected by cultivar, with the greatest value being observed for Jingyou 586.
3.2. Regression Analysis between Grain Yield and Nitrogen and Planting Density
The regression models between grain yield and agronomic treatments (nitrogen (X1) and planting density (X2)) for each cultivar were established using the method of poly linear regressed analysis, and the specific equations and correlation coefficients were as follows:
Y47 = 2827.63 + 34.87X1 + 419.04X2 – 0.34X1X2 – 0.07X12 – 8.01X22, R2 = 0.927;
Y505 = 4876.58 + 27.15X1 + 262.83X2 – 0.21X1X2 – 0.06X12 – 4.49X22, R2 = 0.933;
Y586 = 6949.80 + 23.11X1 + 226.87X2 – 0.39X1X2 – 0.04X12 – 5.31X22, R2 = 0.889;
Where, Y47, Y505, and Y586 refer to the yields for Shendao 47, Shendao 505, and Jingyou 586, respectively.
Moreover, the regression equations and regression coefficients were tested for significance using the F test and t test, respectively. These regression equations were highly significant for inbred Shendao 47 (F = 106.334), Shendao 505 (F = 117.533), and hybrid Jingyou 586 (F = 67.461). Significant correlation coefficients of R = 0.963, 0.966, and 0.943, respectively, were observed between actual and predicted grain yields. The results demonstrated that the regression correlations among the grain yield, N rate, and planting density were extremely significant. Meanwhile, the t test results showed that all the regression coefficients were significant except the X1X2 and X22 coefficients of Shendao 505 and the X2, X12, and X22 coefficients of Jingyou 586. The t values of Shendao 47, Shendao505, and Jingyou 586 were 6.788**, 8.205**, and 5.404** for X1; 2.606**, 1.826*, and 0.591 for X2; −1.796*, −3.867**, and −0.442 for X12; −1.989*, −1.308, and −0.059 for X22; and −1.753*, −1.332 and −2.356** for X1X2, respectively, (* and ** represent significance at p < 0.05 and p < 0.01, respectively). The regression equations indicated that the relationship between grain yield and the N rate and planting density showed a single-curve peak. In other words, grain yield increased with increasing nitrogen and planting density, with gradually decreasing increments. Furthermore, when the N rate and planting density reached a certain level, the grain yield declined. Maximum grain yields and optimal combinations of the N rate and planting density for each of the three cultivars were estimated using the regression equations. The maximum yields of Shendao 47, Shendao 505, and Jingyou 586 were 10.85, 10.64, and 11.03 t ha−2 when the nitrogen rates were 195.6, 182.5, and 220 kg ha−2 N and the planting densities were 22 × 104, 25 × 104, and 13.1 × 10⁴ hills ha-2, respectively.
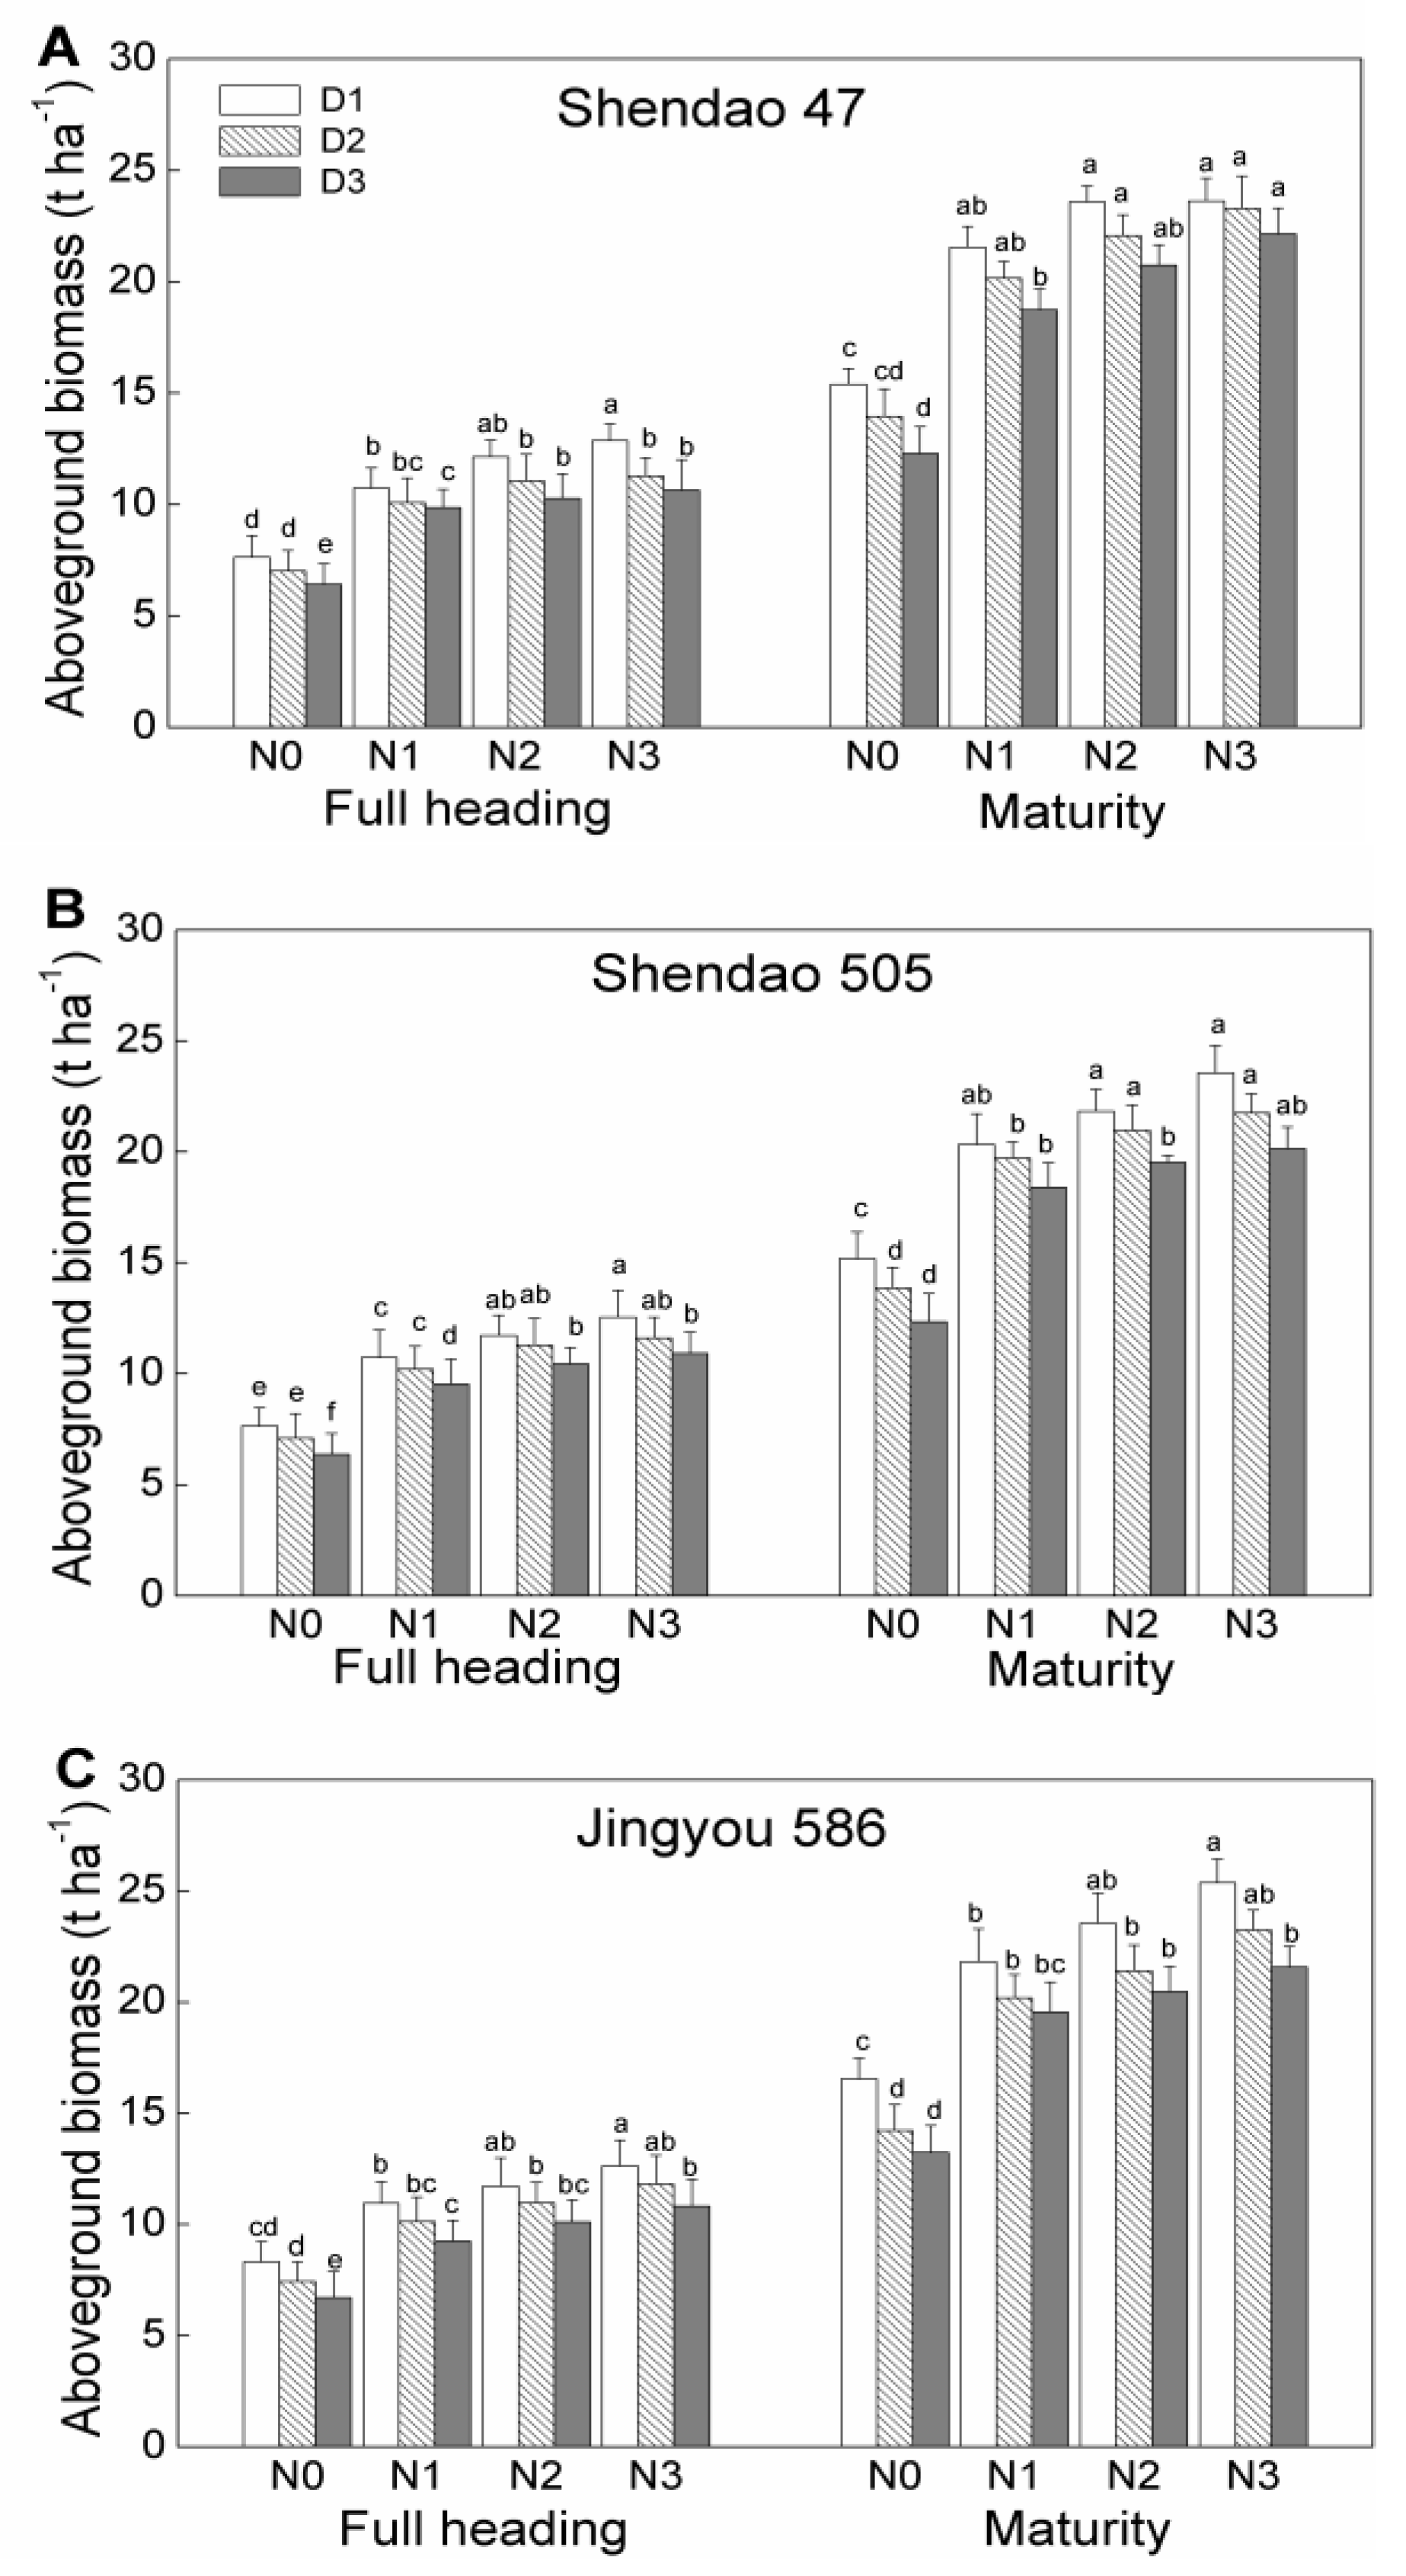
3.3. Aboveground Biomass and Harvest Index
At the full heading stage, the mean aboveground biomass (averaged across treatments) of Jingyou 586 was similar to or slightly higher than that of Shendao 47 and Shendao 505. Aboveground total biomass was 6.43–12.63 t ha
−1 for Shendao 47, 6.37– 12.54 t ha
−1 for Shendao 505, and 6.72– 12.88 t ha
−1 for Jingyou 586 (
Figure 1). At harvest time, mean aboveground biomass production (averaged across the treatments) in Jingyou 586 (20.18 t ha
−1) was higher than that of Shendao 47 (17.80 t ha
−1) and Shendao 505 (17.51 t ha
−1).
For a constant N rate, the aboveground biomass increased with increasing planting density, and the aboveground biomass of N3D1 was the highest among all treatments and cultivars across all growth stages. However, there was no consistent difference in biomass accumulation. From full heading through to maturity, the largest aboveground biomass accumulation was observed in the N3D2 treatment for Shendao 47, N3D1 with similarity to the N2D1 for Shendao 505, and N3D3 for Jingyou 586.
Unlike the aboveground biomass, the harvest index decreased with increasing N rate and planting density, except for the N3D3 treatment (
Figure 2). The harvest index was 42.5–52.8% for Shendao 47, 44.3–52.6% for Shendao 505, and 44.5–54.6% for Jingyou 586. When the N rate was 0, 140, or 180 kg ha
−1, the differences in harvest index among planting densities were not statistically significant. Under a high N rate (220 kg ha
−1), the harvest index differed significantly among planting densities, with the harvest index in N3D3 similar to that in the N0, N1, and N2 treatments.
3.4. Leaf Photosynthetic Characteristics
Nitrogen rate, planting density, and the interactions between cultivar and nitrogen rate, between cultivar and planting density, and between nitrogen rate and transplanting density significantly affected Pn (
Table 4). The Pn of Shendao 47 increased from 21.92 to 27.59 µmol m
−2 s
−1 (mean of three planting densities) with the nitrogen rate increasing from 0 kg ha
−1 to 180 kg ha
−1, while it decreased from 27.59 to 26.79 µmol m
−2 s
−1 with the nitrogen rate increasing further from 180 kg ha
−1 to 220 kg ha
−1. A planting density increase from D3 to D2 led to an increase in Pn from 23.6 to 26.16 µmol m
−2 s
−1 (mean of four nitrogen rates); however, the Pn decreased from 26.16 to 24.48 as the planting density increased further from D2 to D1. For Shendao 505, a similar pattern was observed for the effect of N rate on Pn. Under a constant nitrogen rate, however, increased planting density caused a continuous increase in Pn. The Pn of Jingyou 586 increased from 22.78 to 27.68 µmol m
−2 s
−1 (mean of three planting densities) as the nitrogen rate increased from 0 kg ha
−1 to 220 kg ha
−1. Given each nitrogen rate, the Pn showed an overall decreasing trend with increasing planting density. The maximal values of Pn of Shendao 47, Shendao 505, and Jingyou 586 appeared in N3D2, N2D1, and N3D3, respectively. Cultivar, nitrogen rate, and planting density had a similar effect on Gs and Tr as they did on Pn (
Table 4). The trends of Gs and Tr for the three cultivars were consistent with Pn. The maximal values of both Gs and Tr of Shendao 47, Shendao 505, and Jingyou 586 appeared in the N3D2, N2D1, and N3D3 treatments, respectively.
The Ci values were significantly affected by cultivar, nitrogen rate, planting density, and the interaction between nitrogen rate and planting density (
Table 4). Increase in nitrogen rate from 0 kg ha
−1 to 180 kg ha
−1 resulted in a decrease in Ci for both Shendao 47 and Shendao 505, while increasing the nitrogen rate from 180 kg ha
−1 to 220 kg ha
−1 resulted in an increase in Ci for both Shendao 47 and Shendao 505. For Jingyou 586, increasing the nitrogen rate resulted in a continuous decrease in Ci. In each nitrogen rate treatment, the Ci of Shendao 47 showed a V-shaped trend as the planting density increased from D3 to D1, except for N2. The Ci showed a continuous decrease for Shendao 505 as the planting density increased from N3 to N1, while showing a continuous increase for Jingyou 586. The minimum values of Ci of Shendao 47, Shendao 505, and Jingyou 586 appeared in N3D2, N2D1, and N3D3, respectively.
Cultivar, nitrogen rate, and interaction between nitrogen rate and planting density had significant effects on the SPAD (
Table 4). Increasing the nitrogen rate from 0 kg ha
−1 to 220 kg ha
−1 resulted in a continuous increase in SPAD for all three cultivars. The maximum values of SPAD for Shendao 47, Shendao 505, and Jingyou 586 appeared in the N3D2, N2D1, and N3D3 treatments, respectively.
The LAI was significantly affected by cultivar, nitrogen rate, planting density, and their interactions (
Table 4). Increasing the nitrogen rate from 0 kg ha
−1 to 220 kg ha
−1 resulted in a continuous increase in LAI for all three cultivars. In each nitrogen rate treatment, the LAI of Shendao 47 increased first and then decreased as the planting density increased from D3 to D1. The LAI of Shendao 505 continuously increased as the planting density increased from D3 to D1, while the LAI of Jingyou 586 decreased with increasing planting density, except in the N2 treatment. The maximal values of LAI of Shendao 47, Shendao 505, and Jingyou 586 appeared in N3D2, N2D1, and N3D3, respectively.
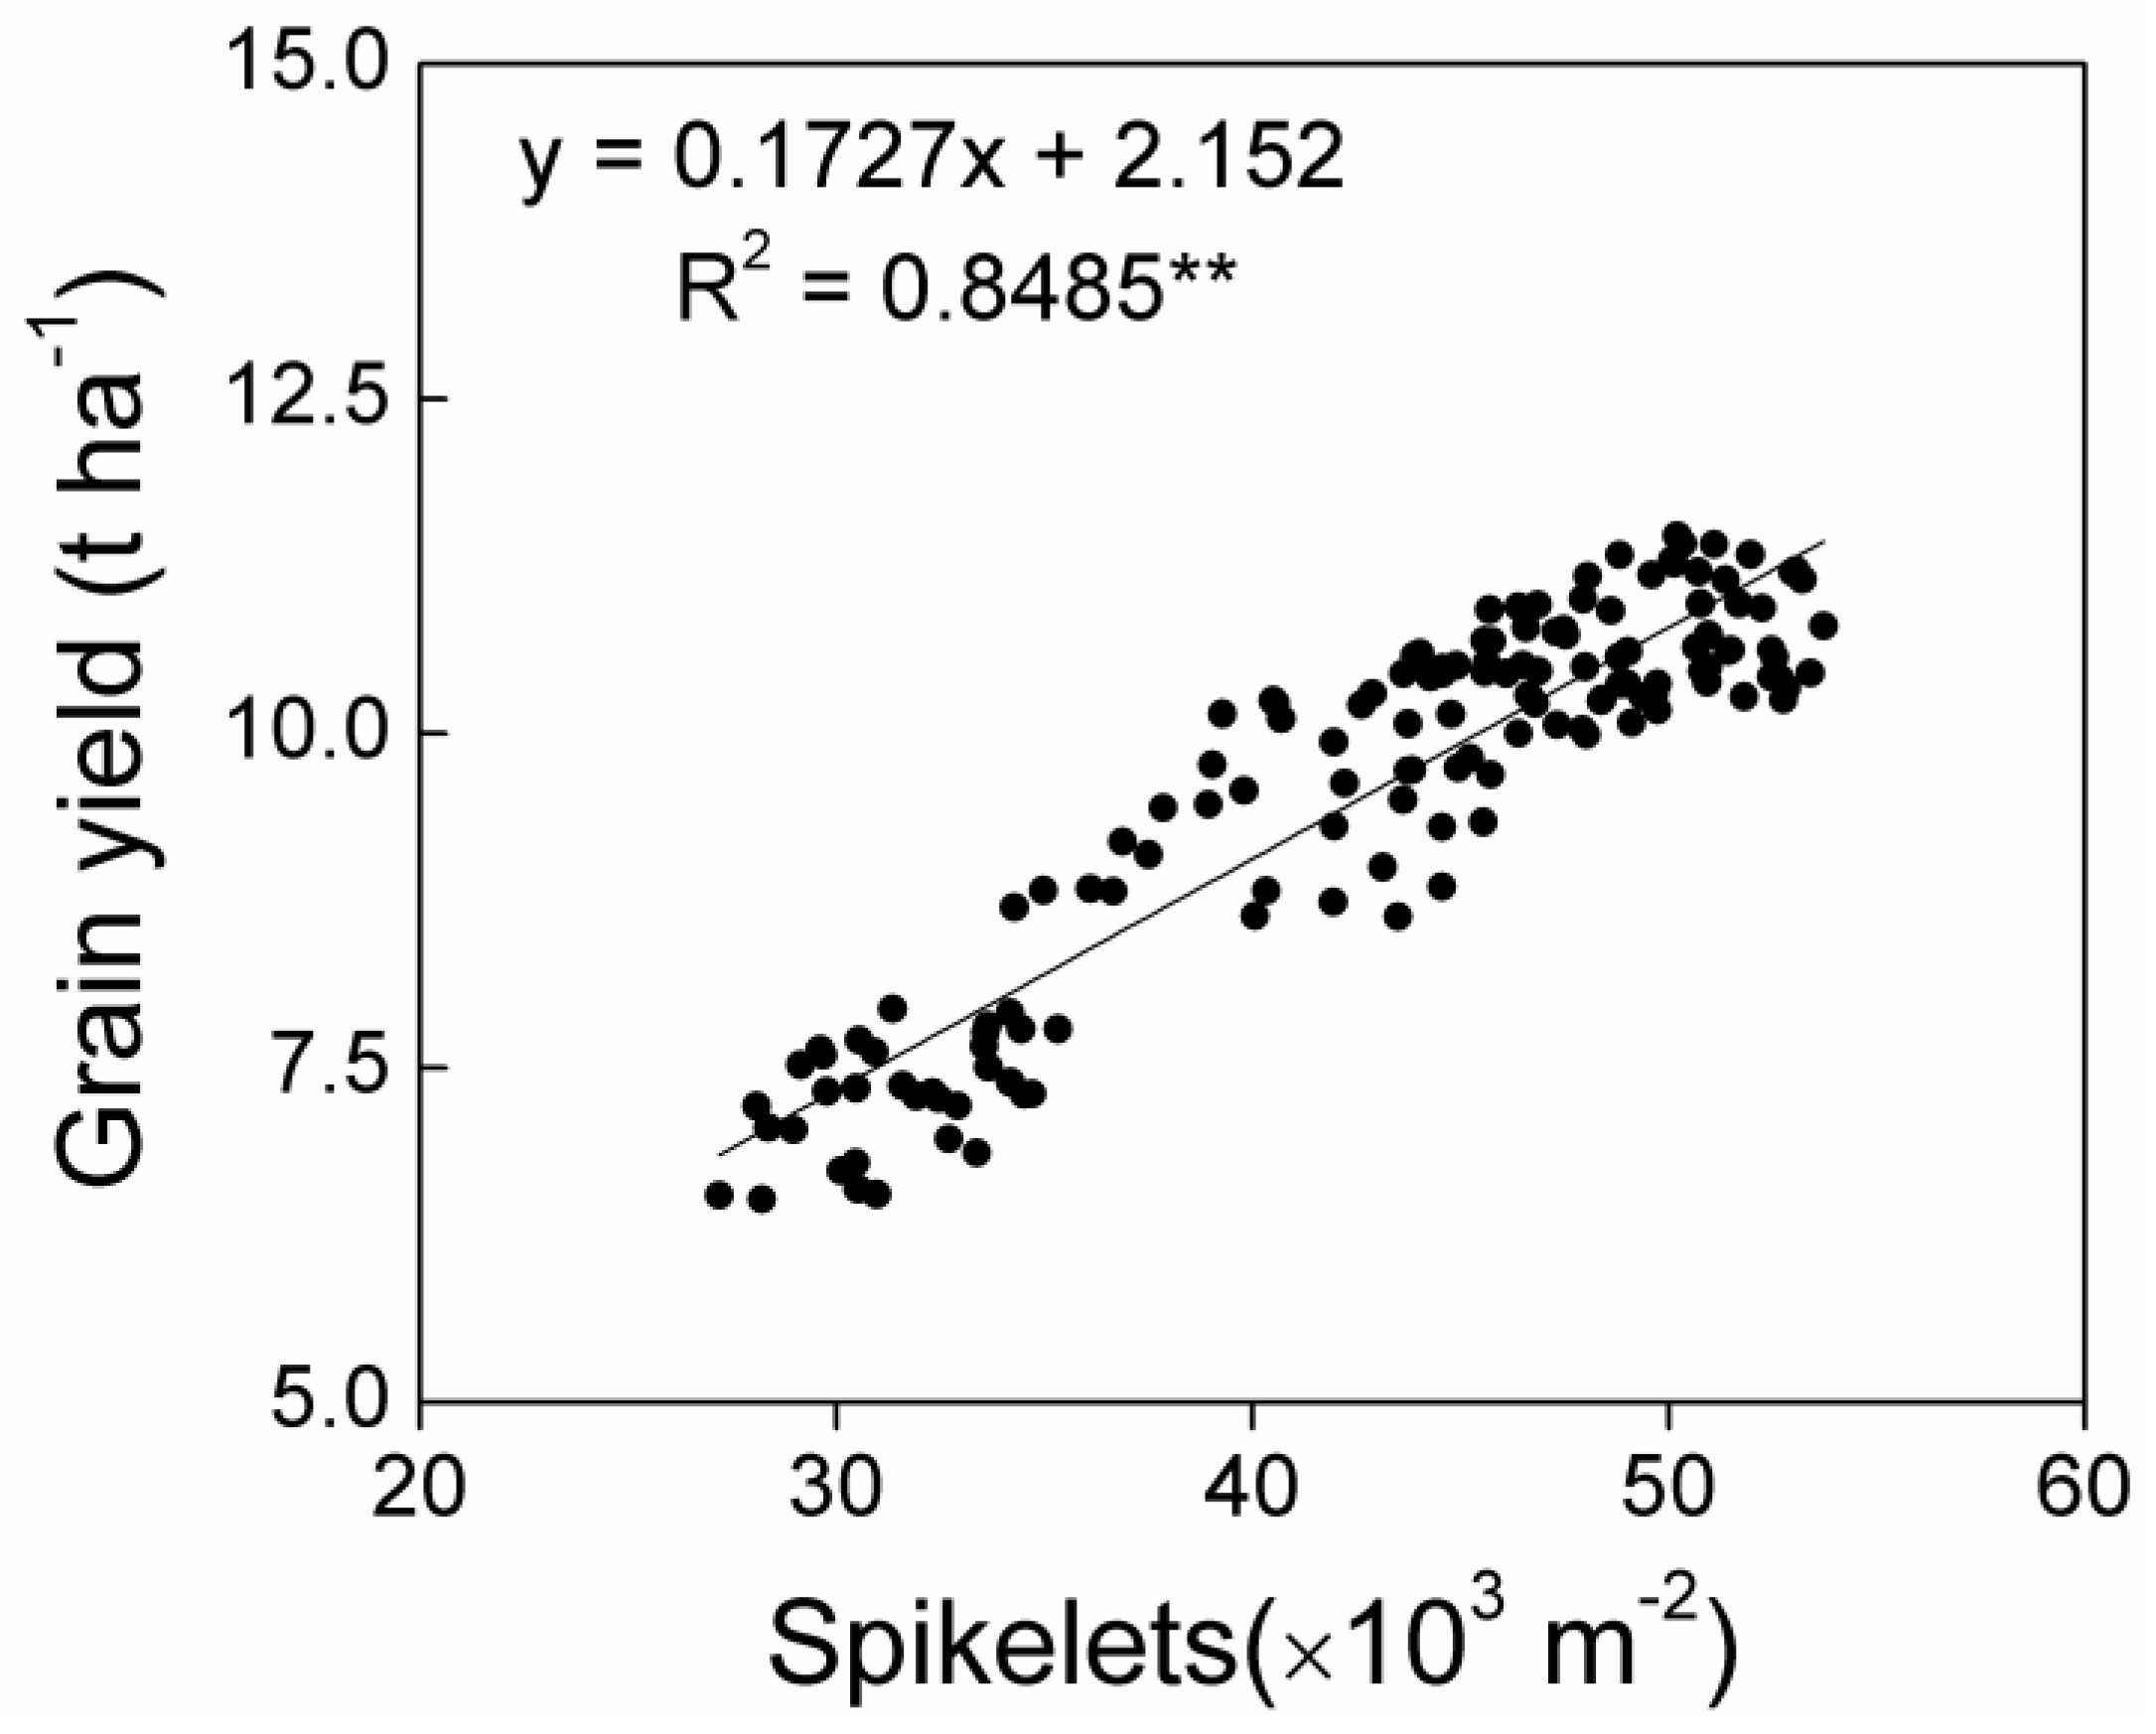
3.5. Relationship between Grain Yield and Yield Components
For all treatments, grain yield had a positive correlation with the number of panicles per unit area (
Figure 3A), while there were no correlations between grain yield and spikelets per panicle (
Figure 3B), filled grain percentage, and 1000-grain weight (
Figure 3C,D). The components of spikelets per unit area were panicles per unit area and spikelets per panicle, and more markedly positive correlations were observed between grain yield and spikelets per unit area (
Figure 4) rather than between grain yield and panicles per unit area (
Figure 3A). This indicated a stronger effect of spikelets per unit area on grain yield.
3.6. Relationship between Grain Yield and Leaf Photosynthetic Characteristics
Remarkable positive correlations were found between the grain yield and Pn, Gs, Tr, SPAD, and LAI (
Figure 5A,B,D–F). Correlation analysis also indicated that the grain yield had a significantly negative correlation with Ci (
Figure 5C).
4. Discussion
Plant density is a critical factor for establishing a reasonable crop population that ensures a high grain yield. Moreover, nitrogen is probably the most important nutrient in rice production because its deficiency or excess induces grain yield reduction. In the present study, grain yield rose with the increase in N fertilizer from 0 kg ha
−1 to 180 kg ha
−1 for all the tested cultivars. However, grain yields of Shendao 47 and Shendao 505 decreased with a further increase in N fertilizer from 180 kg ha
−1 to 220 kg ha
−1, while the Jingyou 586 yield continued to increase but at decreasing increments for a given N level (
Table 3). In addition, grain yield increased with planting density from 12.5 to 25 hills m
−2 (except Jingyou 586 under 220 kg ha
−1 N rate). However, the differences in grain yield among planting densities were not significant at N3 (
Table 3). Furthermore, our results also showed that cultivars had different grain yields in response to different combinations of N rate and planting density, reaching a peak at N3D2, N2D1, and N3D3 for Shendao 47, Shendao 505, and Jingyou 586, respectively (
Table 3). These results suggest that the tolerance or response to excessive fertilizer in terms of grain yield varied with rice cultivars and that there would be no uniform optimal planting density across cultivars.
Greater grain yields were mainly ascribed to the establishment of a larger sink capacity, which was quantified using the total number of spikelets per unit area. The differences in grain filling percentage and grain weight were relatively small across nitrogen rates and transplanting densities. Rice grain yield was determined using spikelet number per unit area (composed of panicles per unit area and spikelets per panicle), grain filling percentage, and grain weight; the spikelet number per unit area was considered the primary determinant [
35]. In this study, grain yield was found to have a significantly positive correlation with panicles per unit area (
Figure 3A) and spikelets per unit area (
Figure 4). Moreover, more markedly positive correlations could be found between grain yield and spikelets per unit area rather than between grain yield and panicles. This meant that the grain yield was directly determined by spikelets per unit area, which is consistent with a previous study [
35]. An increased yield sink capacity is a premise to realizing higher yield [
7,
36], and the differential grain yield responses to the N rate and planting density can be explained primarily by the number of panicles per unit area and spikelets per panicle [
7,
36,
37,
38]. In this study, the N rate and planting density had greater effects on panicles than spikelets per panicle (
Table 2); N improved the panicles mainly by promoting tillering, while planting density improved panicles mainly by increasing the number of basic seedlings, and the spikelets per panicle were restricted by the number of panicles [
24]. Counce et al. [
37] reported that for smaller groups, rice grain yield increased mainly by increasing the tiller number; when the rice plant population is optimal, improved grain yield mainly depends on optimizing the number of tillers and number of spikelets per panicle, yet when the rice group is large, improving the grain yield mainly depends on increasing the number of spikelets per panicle. Similar to our study, the greatest grain yield of Shendao 47 under the N3D2 treatment was mainly attributed to both the greater number of panicles per unit area and the spikelets per panicle, the greatest yield of Shendao 505 was obtained under the N2D1 treatment and mainly depended on the number of panicles per unit area, whereas the spikelets per panicle was mainly responsible for the greatest grain yield of Jingyou 586 under the N3D3 treatment (
Table 3).
From another perspective, grain yield is the product of the total aboveground biomass and harvest index [
39]. Numerous studies have demonstrated that a grain yield increase could be achieved through either a harvest index improvement or aboveground biomass enhancement or both [
38,
40,
41]. The importance of biomass production and the harvest index in determining grain yield has been a controversial issue. Yang et al. [
42] studied hybrids, indica inbreds, and NPTs (New plant types) and found that the higher yield of hybrids was attributed to a high harvest index rather than the biomass production compared with indica inbreds and NPTs. However, Peng et al. [
43] attributed the advantage in yield potential of hybrids to a greater biomass production rather than the harvest index. In this study, inbred rice Shendao 47 and Shendao 505 achieved the greatest grain yields under N3D2 and N2D1 treatments, respectively, mainly due to more biomass accumulation after the full heading stage. The greatest grain yield of hybrid rice cultivar Jingyou 586 under treatment N3D3 was attributed to both a high harvest index and more biomass accumulation after the heading (
Figure 1 and
Figure 2). It has been widely accepted that there is little range to further increase the harvest index after the Green Revolution [
44], and further improvement in rice yield might rely on increasing biomass production rather than the harvest index [
43,
45]
To identify the underlying physiological mechanisms of nitrogen fertilization and planting density improving grain yield, the effects of the nitrogen rate and planting density on leaf photosynthetic characteristics and leaf area development should be examined. As the foundation of crop growth and development, photosynthesis is the major factor in determining the crop productivity composition [
46]. Various studies have reported that crop yield has a significant positive correlation with the leaf photosynthetic capacity [
46,
47]. Similarly, in the present study, the grain yield is significantly and positively correlated with the Pn, Gs, Tr, SPAD, and LAI, while it is significantly negatively correlated with Ci (
Figure 5). Our finding was also consistent with previous studies that stated that the leaf photosynthetic capacity is the key factor that determines the grain yield [
46].
The leaf photosynthetic capacity and grain yield are closely related to nitrogen fertilization. Abundant studies have reported that nitrogen deficiency decreases grain yield and leaf photosynthetic capacity in various crops [
48,
49]. Similarly, in this study, the leaf photosynthetic capacity and grain yield increased with the increase in N fertilizer from 0 kg ha
−1 to 180 kg ha
−1 for all the tested cultivars. However, grain yields of Shendao 47 and Shendao 505 decreased with the further increase in N fertilizer from 180 kg ha
−1 to 220 kg ha
−1, while the Jingyou 586 yield continued increasing but with a lower slope at a given N level. This could be attributed to the fact that: (1) the light irradiance to some leaves was weak due to overused nitrogen fertilizer promoting leaf development and hence shading, and (2) rice grew excessively tall when nitrogen fertilizer was abundant and became susceptible to lodging and diseases. Planting density is one of the critical factors coordinating the contradiction between crop population and individual. Generally, increasing plant population produces a greater grain yield for most crops, while further increases in planting density can cause yield penalty [
50], which might be due to a weakening light irradiance to the leaf via shading and strong competition at a high planting density in terms of nutrient supply. While our results showed that cultivar and planting density had significant effects on grain yield and leaf photosynthetic capacity, each cultivar obtained the maximum values at different planting densities. Various studies have reported that hybrid rice cultivars with a high tillering capacity can be planted at a wide range of spacings and still produce higher yield [
30,
31], which is consistent with our studies. Ahmad et al. [
32] evaluated the performance of the cropping system model (CSM)-CERES-Rice (Cropping system model-Crop estimation through resource and environment synthesis) and found inbred rice cultivars should be planted with more seedlings per hill to produce a high yield. This indicates that there is no uniform optimal planting density across cultivars.
Our results suggest that the appropriate combination of nitrogen fertilizer and planting density could effectively promote the leaf photosynthetic capacity, increase the yield of rice, and abate the environmental pollution caused by excessive fertilizer use. The regression analyses showed that the combinations of nitrogen fertilizer and planting density with the greatest effect were 195.6 kg ha−1 N and 22 × 104 hills ha−1, respectively, for Shendao 47; 182.5 kg ha−1 and 25 × 104 hills ha−1, respectively, for Shendao 505; and 220 kg ha−1 and 13.125 × 10⁴ hills ha−1, respectively, for Jingyou 586.


