Article

Genome-Wide Characterization and Expression Profiling of Squamosa Promoter Binding Protein-Like (SBP) Transcription Factors in Wheat (Triticum aestivum L.)

1
Institute of Food Crops, Hubei Academy of Agricultural Sciences, Wuhan 430064, China
2
Engineering Research Center of Ecology and Agricultural Use of Wetland, Ministry of Education, Yangtze University, Jingzhou 434000, China
3
Hubei Collaborative Innovation Center for Grain Industry, Yangtze University, Jingzhou 434000, China
4
College of Agriculture, Yangtze University, Jingzhou 434000, China
*
Authors to whom correspondence should be addressed.
Agronomy 2019, 9(9), 527; https://doi.org/10.3390/agronomy9090527
Submission received: 18 July 2019 / Revised: 29 August 2019 / Accepted: 6 September 2019 / Published: 9 September 2019
(This article belongs to the Section Crop Breeding and Genetics)

Abstract

:
Transcription factors (TFs) play fundamental roles in the developmental processes of all living organisms. Squamosa Promoter Binding Protein-like (SBP/SBP-Box) is a major family of plant-specific TFs, which plays important roles in multiple processes involving plant growth and development. While some work has been done, there is a lot more that is yet to be discovered in the hexaploid wheat SBP (TaSBP) family. With the completion of whole genome sequencing, genome-wide analysis of SBPs in common hexaploid wheat is now possible. In this study, we used protein–protein Basic Local Alignment Search Tool (BLASTp) to hunt the newly released reference genome sequence of hexaploid wheat (Chinese spring). Seventy-four TaSBP proteins (belonging to 56 genes) were identified and clustered into five groups. Gene structure and motif analysis indicated that most TaSBPs have relatively conserved exon–intron arrangements and motif composition. Analysis of transcriptional data showed that many TaSBP genes responded to some biological and abiotic stresses with different expression patterns. Moreover, three TaSBP genes were generally expressed in the majority of tissues throughout the wheat growth and also responded to many environmental biotic and abiotic stresses. Collectively, the detailed analyses presented here will help in understanding the roles of the TaSBP and also provide a reference for the further study of its biological function in wheat.

1. Introduction

Throughout the entire lifespan of a plant, plant-specific transcription factors (TFs) play key roles in regulating the expression of downstream genes in a temporal and spatial manner by specifically binding cis-acting elements of gene promoter regions, and thereby regulate plant growth and development processes [1,2]. For example, in rice, Rice Starch Regulator1 (RSR1) from APETALA2/ethylene responsive factor (AP2/ERF) TFs negatively regulates the expression of type I starch synthesis genes, and RSR1 deficiency results in enhanced expression of starch synthesis genes in seeds and facilitates the improvement of rice quality and nutrition value [3]. A cotton v-myb avian myeloblastosis viral oncogene homolog (MYB) member, GbMYB5, is positively involved in plant adaptive responses to drought stress by activating the expression of dehydration-responsive genes in the abscisic acid (ABA)-dependent signaling pathway [4]. When activated by symbiotic arbuscular mycorrhizal fungi, GRAS (a plant-specific protein named after GAI, RGA and SCR) transcription factor Mycorrhiza-induced GRAS 1 (MIG1) is capable of modulating root cortex development by recruiting DELLA1 into the gibberellin (GA) signaling pathway as a transcriptional coactivator [5]. Additionally, the basic leucine zipper (bZIP) transcription factor LONG HYPOCOTYL 5 (HY5) plays a vital role in anthocyanin accumulation by regulating the expression of downstream anthocyanin biosynthesis genes in apple (Malus domestica) [6].
Squamosa promoter binding proteins (SBPs) are important members of the plant-specific TF super family. SBPs possess a conserved SBP-box domain comprised of 76 highly conserved amino acid residues [7]. Nuclear magnetic resonance (NMR) studies of the structure of the SBP fragment revealed that its DNA-binding domain consists of two separate zinc-binding sites and one nuclear localization signal (NLS) [8,9]. The binding of SBP-box domain to DNA requires the participation of Zn2+, which binds to two zinc-binding sites on SBP. One of the zinc-binding sites is Cys-Cys-His-Cys (C2HC) and the other is Cys-Cys-Cys-His (C3H) or Cys-Cys-Cys-Cys (C4) [10,11]. Overlapping with the second zinc-binding site, the NLS is located at the C-terminal end of the SBP-box domain, and it guides SBP proteins into the nucleus and regulates the transcription of related downstream genes [12]. Since the initial finding of the first SBP-like gene squa from Antirrhinum majus L. [13], which was involved in the process of stamen differentiation, many plant genomes have been found to contain SBP gene families, including Arabidopsis (Arabidopsis thaliana L.) [14], rice (Oryza sativa L.) [15], tomato (Solanum lycopersicum L.) [16], maize (Zea mays L.) [17], and grape (Vitis vinifera L.) [18]. These SBPs play critical roles in regulating flower and fruit development [17,19], plant morphological variation [20], GA hormone signal transduction [21], abiotic stress response [22,23], and response to copper and fungal toxins [24,25]. It has been reported that SBP-Box Genes SPL10 significantly enhances salt tolerance in rice seedlings [26], whereas SPL3/4/5 acts synergistically with the Flowering Locus T (FT)-FD module to induce flowering in Arabidopsis [27]. Recently, Ma et al. showed that CmSBP11 was involved in the metabolism of vitamin C during muskmelon (Cucumis melo L.) ripening [28]. Another key gene, OsSPL14, was found to increase rice yields and enhance lodging resistance by controlling the number of tillers and increasing the mechanical strength of the stalks, and it has been successfully applied to breed improvement of Indica cultivars [29,30].
Common wheat (Triticum aestivum) is one of the most important crops with a large production area in the world [31]. It provides staple food globally for a large proportion of the human population, and has great socio-economic importance [32]. High and stable yield has always been the primary goal of wheat production [33]. Previous studies have confirmed that SBP genes play important roles in regulating tiller and inflorescence branches of plants. Zhang et al. confirmed that TaSPL17 is a homologous gene of OsSBP14 and involved in tiller and ear development [34]. Paralogous genes TaSPL20 and TaSPL21 are strongly associated with important yield-related traits, such as plant height (PH) and thousand-grain weight (TGW) [35]. In addition, TaSPL3/17, a group of microRNA156 target genes, plays active roles in regulating strigolactones (SL) signaling pathways during bread wheat tillering and spikelet development [36]. However, even though a little characterization of wheat SBP (TaSBP) family has been done, more is needed [37,38]. In 2015, Wang et al., using common wheat and the genome database of its A and D subgenome donors Triticum urartu L. (AA) and Aegilops tauschii L. (DD), conducted a whole-genome analysis of the wheat SBP family [39]. Compared with the 19 SPL genes present in rice, Wang et al. found 13 and 7 complete open reading frames (ORFs) from wheat diploid progenitors Aegilops tauschii L. (DD) and Triticum urartu L. (AA), respectively. Finally, they identified 58 SBP genes from the hexaploid wheat genome. This was the first systematic analysis of the wheat SBP family. However, many of the 58 sequence hits were only partially aligned with the complete SBP domain that was used as a query, thus this result is not necessarily accurate. With recent development of more complete and better annotated common wheat and its subgenome donors (Triticum urartu L. (Tu), AA; Aegilops speltoides L. (As), SS; and Aegilops tauschii L. (Ae), DD), many more SBP sequences and detailed information are available now [40]. Aegilops speltoides L. (SS) is the B subgenome progenitor of common wheat, which hybridized with Triticum urartu (AA) and resulted in the evolution of wild emmer wheat (WEW, T. turgidum ssp. dicoccoides (Körn.) Thell., AABB) [41,42]. Subsequently, domesticated emmer wheat (DEW, T. turgidum ssp. dicoccon (Schrank) Thell., AABB), which hybridized spontaneously with Aegilops tauschii (DD) to produce hexaploid bread wheat (Triticum aestivum, AABBDD), indicating that WEW was direct progenitor of domesticated wheat [43]. Considering that the whole gene sequencing of Aegilops speltoides L. (SS) has not been completed, we think it is feasible to use the genome data of WEW as the source of B subgenome data. Therefore, this is a good time to update and complete the information of SBP genes in hexaploid wheat.
In our study, we used the newly published Chinese Spring genome data (International Wheat Genome Sequencing Consortium (IWGSC) RefSeq v1.1 annotation, https://urgi.versailles.inra.fr/download/iwgsc/IWGSC_RefSeq_Annotations/v1.1/) to conduct a comprehensive and systematic phylogenetic analysis of the wheat SBP family. We also analyzed gene structure and motif patterns of SBP protein sequences. Meanwhile, based on released transcriptome data, we analyzed the expression characteristics of all TaSBPs in different tissues, development stages, and under different abiotic/biotic stresses to predict the possible functions and the expression regulation modes of SBP genes.

2. Materials and Methods

2.1. Sequences Retrieval

Computer-based methods were used to identify members of the SBP gene family from the wheat reference genome IWGSC RefSeq v1.1 annotations (https://urgi.versailles.inra.fr/download/iwgsc/IWGSC_RefSeq_Annotations/v1.1/). The known SBP protein sequences, including 17 SBPs from Arabidopsis (AtSBPs), 19 SBPs from rice (OsSBPs), and 31 SBPs from maize (ZmSBPs), were collected and used as query sequences for protein–protein Basic Local Alignment Search Tool (BLASTp; version 2.7.1) analysis (e-value < 1 × 10⁻¹⁰) [44]. Then, we took advantage of the Pfam database (http://pfam.xfam.org/) to select sequences that contained the SBP-box domain [45]. The hit sequences were further validated by Simple Modular Architecture Research Tool (SMART; version 7) to remove the redundant and unmatched proteins (http://smart.embl-heidelberg.de/smart/show_motifs.pl/) [46]. Additionally, these retrieved sequences were submitted to InterProScan (http://www.ebi.ac.uk/interpro/) to verify the SBP domains (IPR004333, IPR036893, and IPR017238) [47].

2.2. Phylogenetic Analysis

The 228 protein sequences (17 from Arabidopsis, 19 from rice, 27 from apple, 17 from grape, 31 from maize, 13 from sorghum, 17 from barley, 16 from pineapple, 15 from tomato, and 56 from common wheat) were compared by using ClustalW2 software (2.1, Nanyang Technological University, Singapore) with default parameters [48]. Then, the unrooted phylogenetic tree was created using the maximum likelihood (ML) method with 1000 replicated-bootstraps in MEGA7 [49]. Finally, the phylogenetic tree was further edited in the Interactive Tree of Life (ITOL, Version 3.2.317, http://itol.embl.de/) to produce the final illustration [50].

2.3. Exon–Intron Structure and Motif Analysis

To determine the exon–intron structure of each TaSBP gene, structure analysis was performed by Gene Structure Display Server (GSDS, 2.1, Peking University, Peking, China; http://gsds.cbi.pku.edu.cn/index.php/) based on the GFF3 annotation file of the reference genome [51]. The Multiple Em for Motif Elicitation (MEME suite 5.0.5, http://meme-suite.org/) was used to identify conserved TaSBP protein motifs [52]. The trained parameters were applied as follows: each sequence may contain any number of nonoverlapping occurrences of each motif, the number of different motifs as 20, the width of motifs between 6 and 50 aa, and default values were used for the other parameters. The motif prediction results were put into the software TBtools (v0.6668, South China Agricultural University, Guangzhou, Guangdong, China; https://github.com/CJ-Chen/TBtools/) to produce an illustration [53]. The annotations of those predicted motifs were analyzed by Simple Modular Architecture Research Tool (SMART; version 7 http://coot.embl-heidelberg.de/SMART/) and the InterproScan online tool (version 75.0, http://www.ebi.ac.uk/interpro/) [42,43].

2.4. Chromosomal Location and Duplication Patterns of Wheat SBP Proteins

The start and end location information of TaSBP genes were extracted from the genome reference GFF3 files. Then, these TaSBPs were separately assigned to wheat chromosomes based on their physical position and displayed using the software MapInspect Version 1.0 (http://www.softsea.com/review/MapInspect.html) [54]. The common tool “all against all BLAST search” was used to determine possible paralogous or orthologous sequences among wheat and its subgenome donor with an E-value cutoff of 1 × 10⁻¹⁰, and identity > 75% [55]. Then, we used Multiple Collinearity Scan toolkit (MCScanX) to depict their homology relationships [56]. The R package “circlize” was used to draw the diagram showing their locations and homology relationships [57]. In addition, the non-synonymous (Ka) and synonymous (Ks) substitution rates were calculated with the using Dna Sequence Polymorphism (DnaSP) 5.10 to analyze gene duplication events [58].

2.5. Cis-Acting Elements and miR156 Target Site Prediction

Promoter regions, defined as the 1500-bp sequences upstream of start codons, were searched for cis-acting elements using the PlantCARE database [59]. Using the Analysis of Motif Enrichment (AME) function in the MEME program, enrichment analysis was performed to identify regulatory elements within a collection of promoter sequences from all genes [1]. The motif with an adjusted Fisher’s test p-value less than 0.05 was considered to be a significantly enriched one. The full-length nucleotide sequences of TaSBPs were analyzed to predict the putative target sites of miR156 using psRNATarget tool (2017 release version, http://plantgrn.noble.org/psRNATarget/?function) [60,61].

2.6. Multiple Conditional Transcriptome Analysis of TaSBP

Multiple RNA-seq original data from different tissues, development stages, and treatments were downloaded from the NCBI Short Read Archive (SRA) database and mapped to the wheat genome by hisat2. Then, gene assembly, expression level calculations, and identifications of differences in differentially expressed genes were performed using Cufflinks [62]. The obtained expression FPKM (fragments per kilobase of transcript per million) values were used to generate the heat map of TaSBPs using the R package “pheatmap” [63].

2.7. Characterization of Wheat SBP Proteins

The identified wheat SBP proteins were used to performed characterization analysis on the ExPASy Server10 (https://prosite. expasy.org/) [64]. The features of protein length, molecular weight (MW), theoretical isoelectric point (pI), instability index, aliphatic index, and grand average of hydropathicity (GRAVY) were all predicted. The similarity analysis of the full-length sequence was conducted using DNAman6.0 and online analysis software Weblogo (version6.0, Lynnon Biosoft, Quebec City, QC, Canada; http://weblogo.berkeley.edu/logo.cgi/) [6]. Subcellular localization prediction was carried out using Plant-mPLoc (version 2.0, http://www.csbio.sjtu.edu.cn/bioinf/plant-multi/) and WoLF PSORT (https://wolfpsort.hgc.jp/), and signal peptides prediction was performed on SignalP (version 4.1, http://www.cbs.dtu.dk/services/SignalP/) [65,66,67].

3. Results

3.1. SBP Sequences Search

After genomic retrieval, 100 SBP-like proteins were obtained from hexaploid wheat. However, after validation by SMART and InterPro online tools, only 74 wheat protein sequences were confirmed to be members of the SBP family, which belong to 56 genes (include 18 splice variants) (Table 1 and Table S1). Genes had a 1:1:1 correspondence across the three homoeologous subgenomes (A, B, and D subgenome) in wheat referred to as triads [68]. We identified 16 triads TaSBPs with reference to the results of Ramírez-González et al. [68] (Table S2). The naming of wheat SBP genes consists of five parts: (1) ”TaSBP” represents the hexaploid wheat SBP gene family; (2) Arabic numerals represent the gene number; (3) “-A/B/D” represents the subgenomic group where the gene is located; (4) “L/S” means that the gene is located on the long/short arm of the chromosome; and (5) lowercase letters “a”, “b” and “c” represent different splice variants of one gene. In addition, we also searched for SBPs from diploid (Aegilops tauschii, AeSBPs (the number is 16); Triticum urartu, TuSBPs (the number is 17)) and tetraploid donors (Triticum dicoccoides, TdSBPs (the number is 31)) of hexaploid wheat (Table 2). The naming of these genes is consistent with the form of wheat SBPs.

3.2. Classification of the SBP Gene Family

To investigate the evolutionary relationships in grass species, we constructed a ML tree with MEGA7.0 [49] using the amino acid sequence of putative SBP family members from nine dicot and monocot subfamilies: Arabidopsis, apple, grape, tomato, pineapple, rice, maize, sorghum, and barley (Figure S1, Table S3). According to the comprehensive phylogenetic tree, the result showed that the predicted TaSBP family cluster into five subfamilies, named Groups I–V. The 56 SBP genes from wheat had representatives in all subfamilies: Group IV included the least TaSBP proteins (6), Group III had the greatest number of TaSBP members (20), Group I and V each have nine members, and Groups II and IV included 12 members (Figure S1).
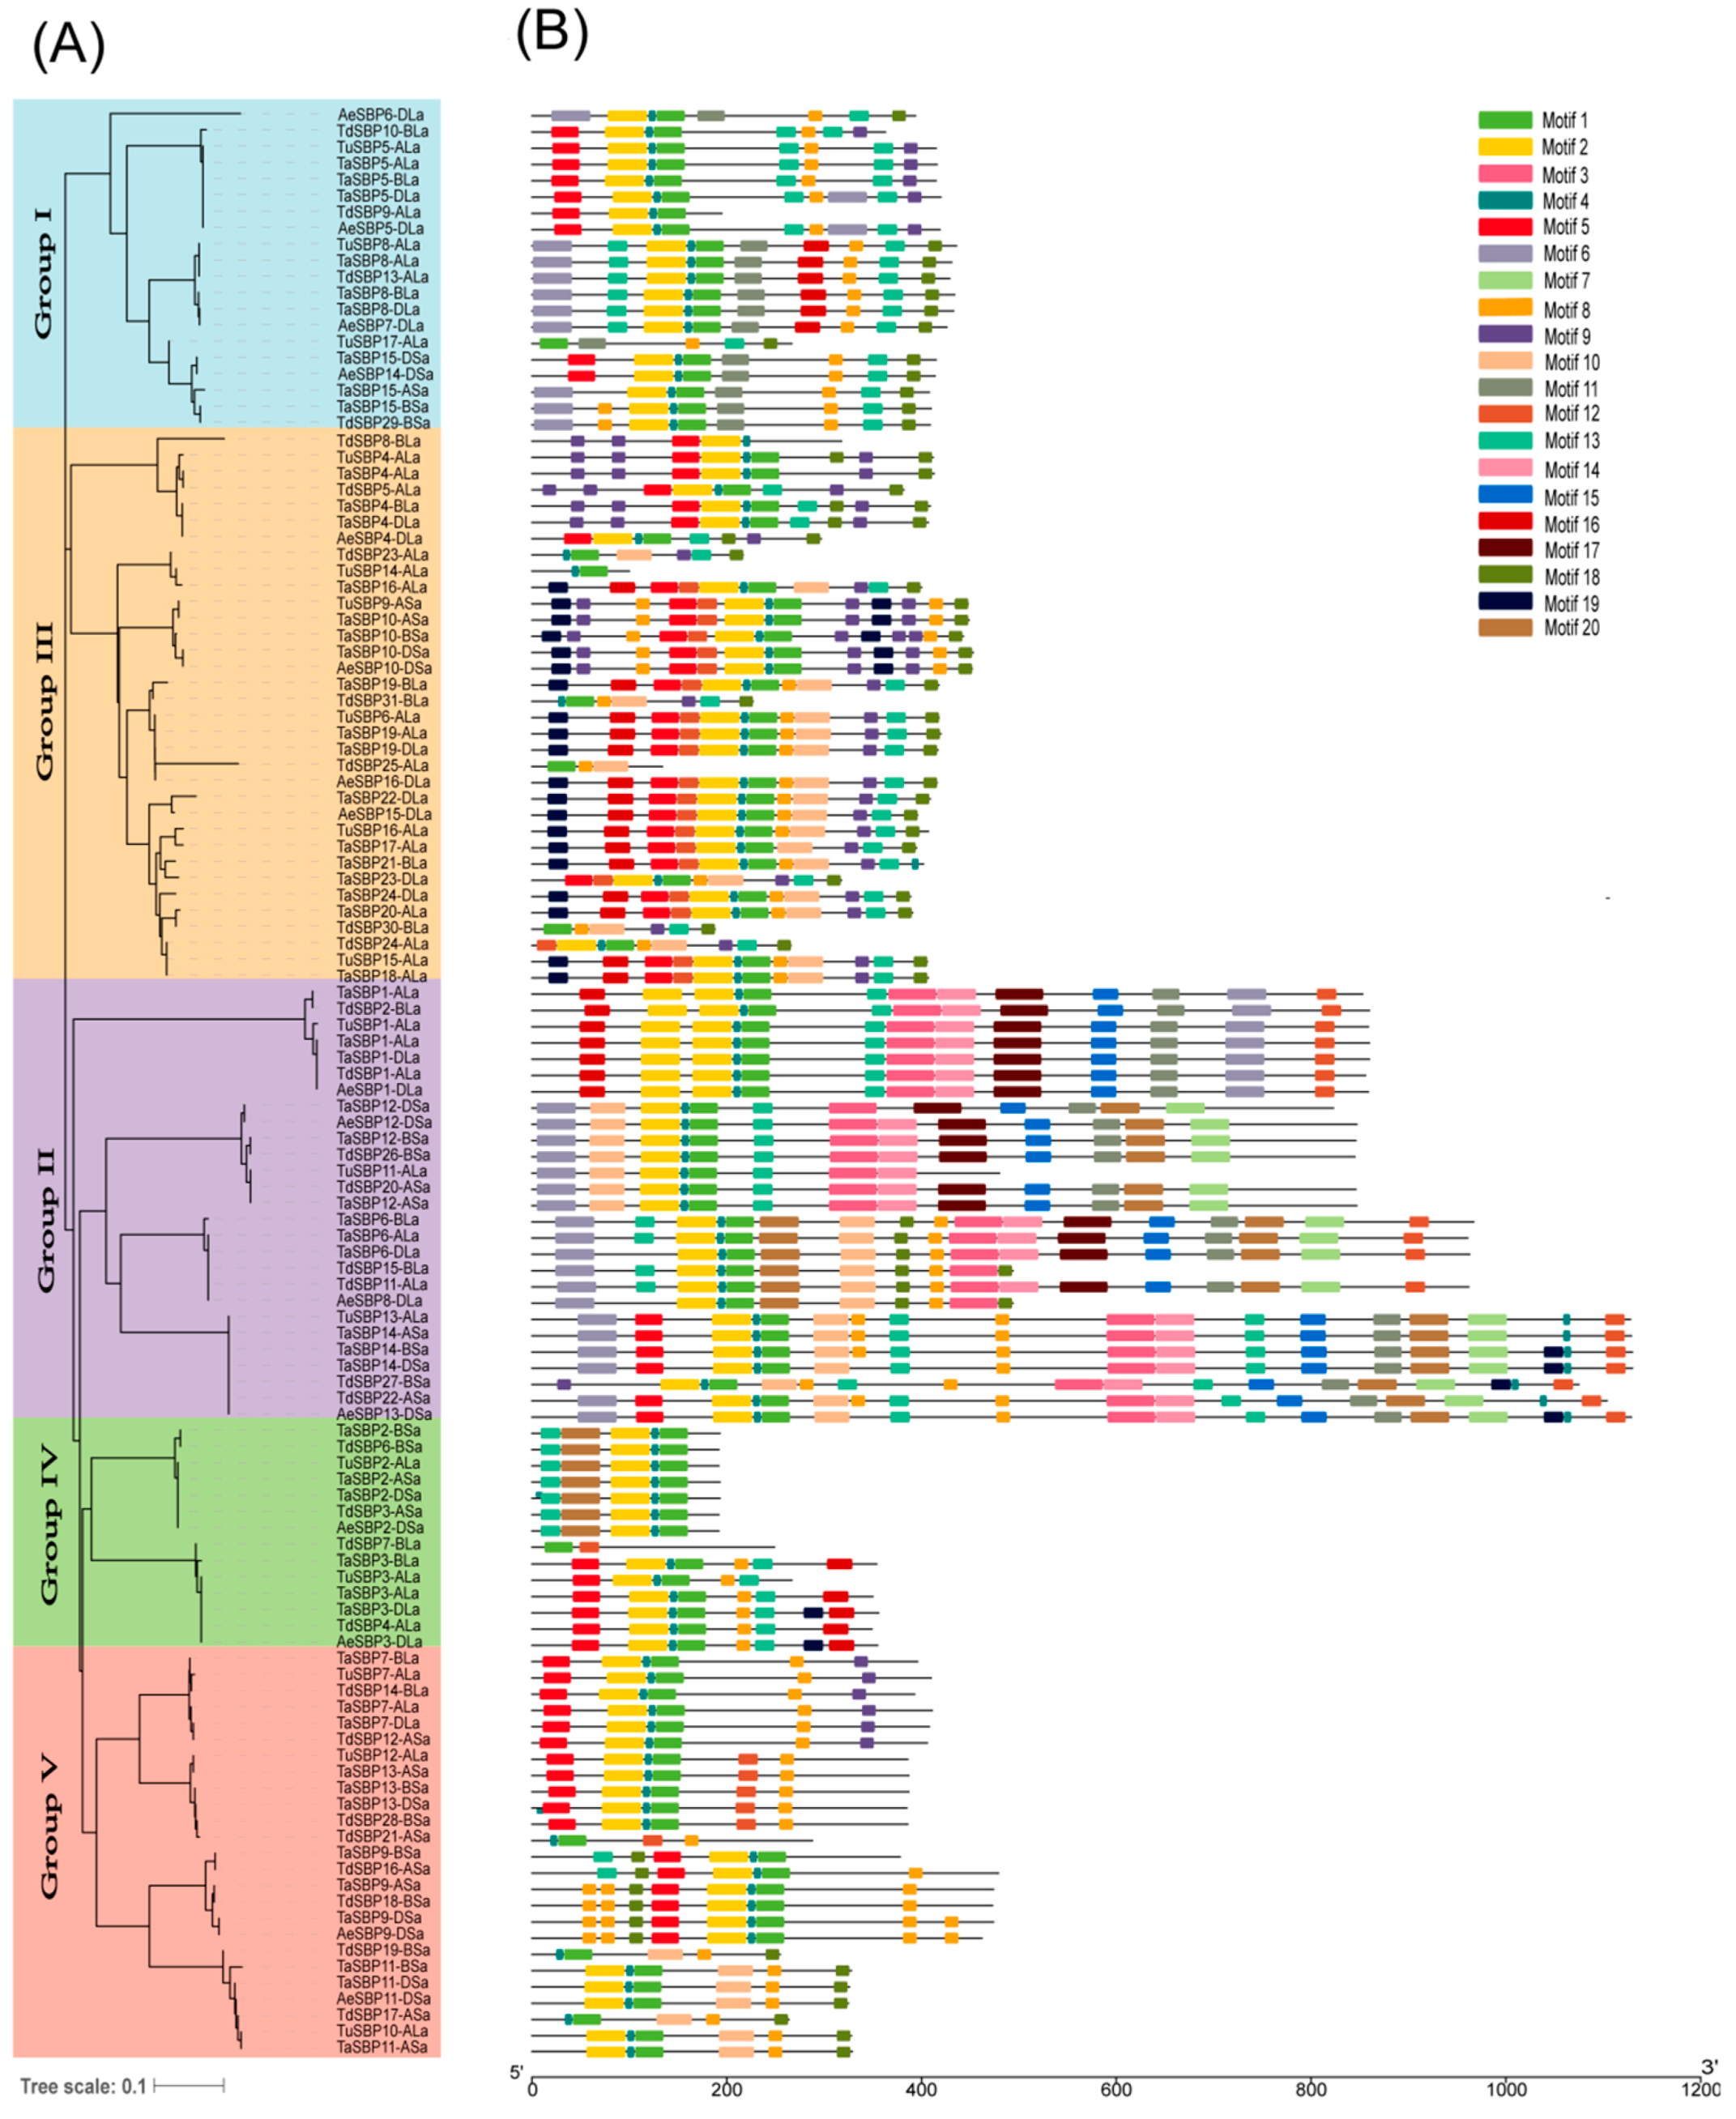
To gain a better understanding of the structural diversity of the TaSBPs, we also built a separate phylogenetic tree of wheat and its subgenomic donors using the same method (Figure 1A, Table 2). As shown in the Figure 1A, we found that Triticum urartu has the most members in Group III (6 members); Triticum dicoccoides has the most members in Groups II and V (8 members); Groups I–II have the same number SBP proteins from Aegilops tauschii (4). We also found that SBP members of hexaploid wheat, Triticum urartu, Triticum dicoccoides and Aegilops tauschii were distributed in Groups I–V, respectively. The group with the most members is Group III, including 17 TaSBPs, 6 TuSBPs, 7 TdSBPs, and 4 AeSBPs. Group IV has the fewest members, including 6 TaSBPs, 6 TuSBPs, 4 TdSBPs, and 2 AeSBPs.

3.3. The Pattern of Gene Structure and Conserved Motifs

By comparing the gene structure, we concluded that SBP genes contained different exon–intron composition patterns (Table 1; Table 2). Additionally, Figure 1 also provides a detailed illustration of the relative lengths of the introns, along with the conservation of the corresponding exon sequences within each SBP gene in the hexaploid wheat and its diploid and tetraploid donors. In hexaploid wheat, we found 51 TaSBP sequences have complete UTRs. Of the remaining five sequences, four genes did not have 5′- and 3′-UTRs (TaSBP3-BLa, TaSBP5-ALa, TaSBP5-DLa, and TaSBP6-DLa) and one (TaSBP16-ALa) has only 3′-UTR. TaSBP2-ASa/TaSBP2-BSa/TaSBP2-DSa contained only two exons, whereas TaSBP6-ALa/TaSBP6-BLa/TaSBP6-DLa and TaSBP12-ASa/TaSBP12-BSa/TaSBP12-DSa contained 11 exons with varying lengths. The intron number of TaSBP sequences ranged from 1 to 10. In Triticum urartu L., members from Groups I, II, and IV have the same number of exons, respectively, 3, 10, and 3. TuSBP1-ALa and TuSBP13-Ala have the largest number of exons, i.e. 10. In Triticum dicoccoides, the number of exons ranged from 1 (TdSBP3-ASa, TdSBP8-BLa, TdSBP19-BSa, and TdSBP26-BSa) to 11 (TdSBP11-ALa). In Aegilops tauschii L., the gene structure of Groups I, III and V is relatively conservative. For Group II, the number of exons ranged from 6 (AeSBP8-DLa) to 11 (AeSBP12-DSa). In general, the genetic conservatism of Group II was lower compared to the other groups, especially in TdSBPs. By analyzing the length of exons, we found that most of the second exons are translated as SBP-box domains. Moreover, phylogenetic trees classified TaSBPs with similar exon–intron structure together. Taking Group III as an example, all members consisted of a short exon sandwiched between two longer exons (Figure 1). This is probably a sign that the genes in the same group have similar functions, as Pan et al. demonstrated in moso bamboo (Phyllostachys heterocycla L.) [11].
We used the MEME online tool to predict the motif distribution and composition of TaSBP proteins. According to the report of Bailey et al., motifs with E-values > 0.01 are probably just statistical components rather than real motifs [52]. Thus, we chose the 20 most statistically significant motifs to describe the motif pattern of SBPs from the hexaploid wheat and its diploid and tetraploid donors (Figure 2). Details of these 20 motifs are shown in Table S4. The lengths of the 20 motifs were between 15 (Motif 9) and 50 (Motifs 4, 12, and 17) amino acid residues. The number of motifs in each TaSBP protein varied from 5 (TaSBP2-ASa, TaSBP2-BSa, and TaSBP2-DSa) to 17 (TaSBP14-BSa and TaSBP14-DSa). Notably, each of the TaSBP proteins contained Motifs 1, 2 and 4 (Motifs 1 and 2 are both SBP zinc-binding sites). Furthermore, Motifs 5, 8, and 13 were distributed across all groups, whereas Motifs 3, 14, and 15 only existed in Group V (Figure 2). Almost all TuSBP proteins had Motifs 1 and 2, except for TuSBP17-ALa (without Motif 2). Similarly, Motifs 1, 2 and 4 were identified in all AeSBP proteins. Almost all TdSBP proteins had Motifs 1 and 4, except for TdSBP7-BLa (without Motif 4), TdSBP25-ALa (without Motif 4), TdSBP30-BLa (without Motif 4) and TdSBP8-BLa (without Motif 1). These results show that the motifs of SBP proteins were conserved. As a result, members with conserved motif compositions and similar gene structures were divided into the same groups.

3.4. Chromosomal Distribution of SBP Genes

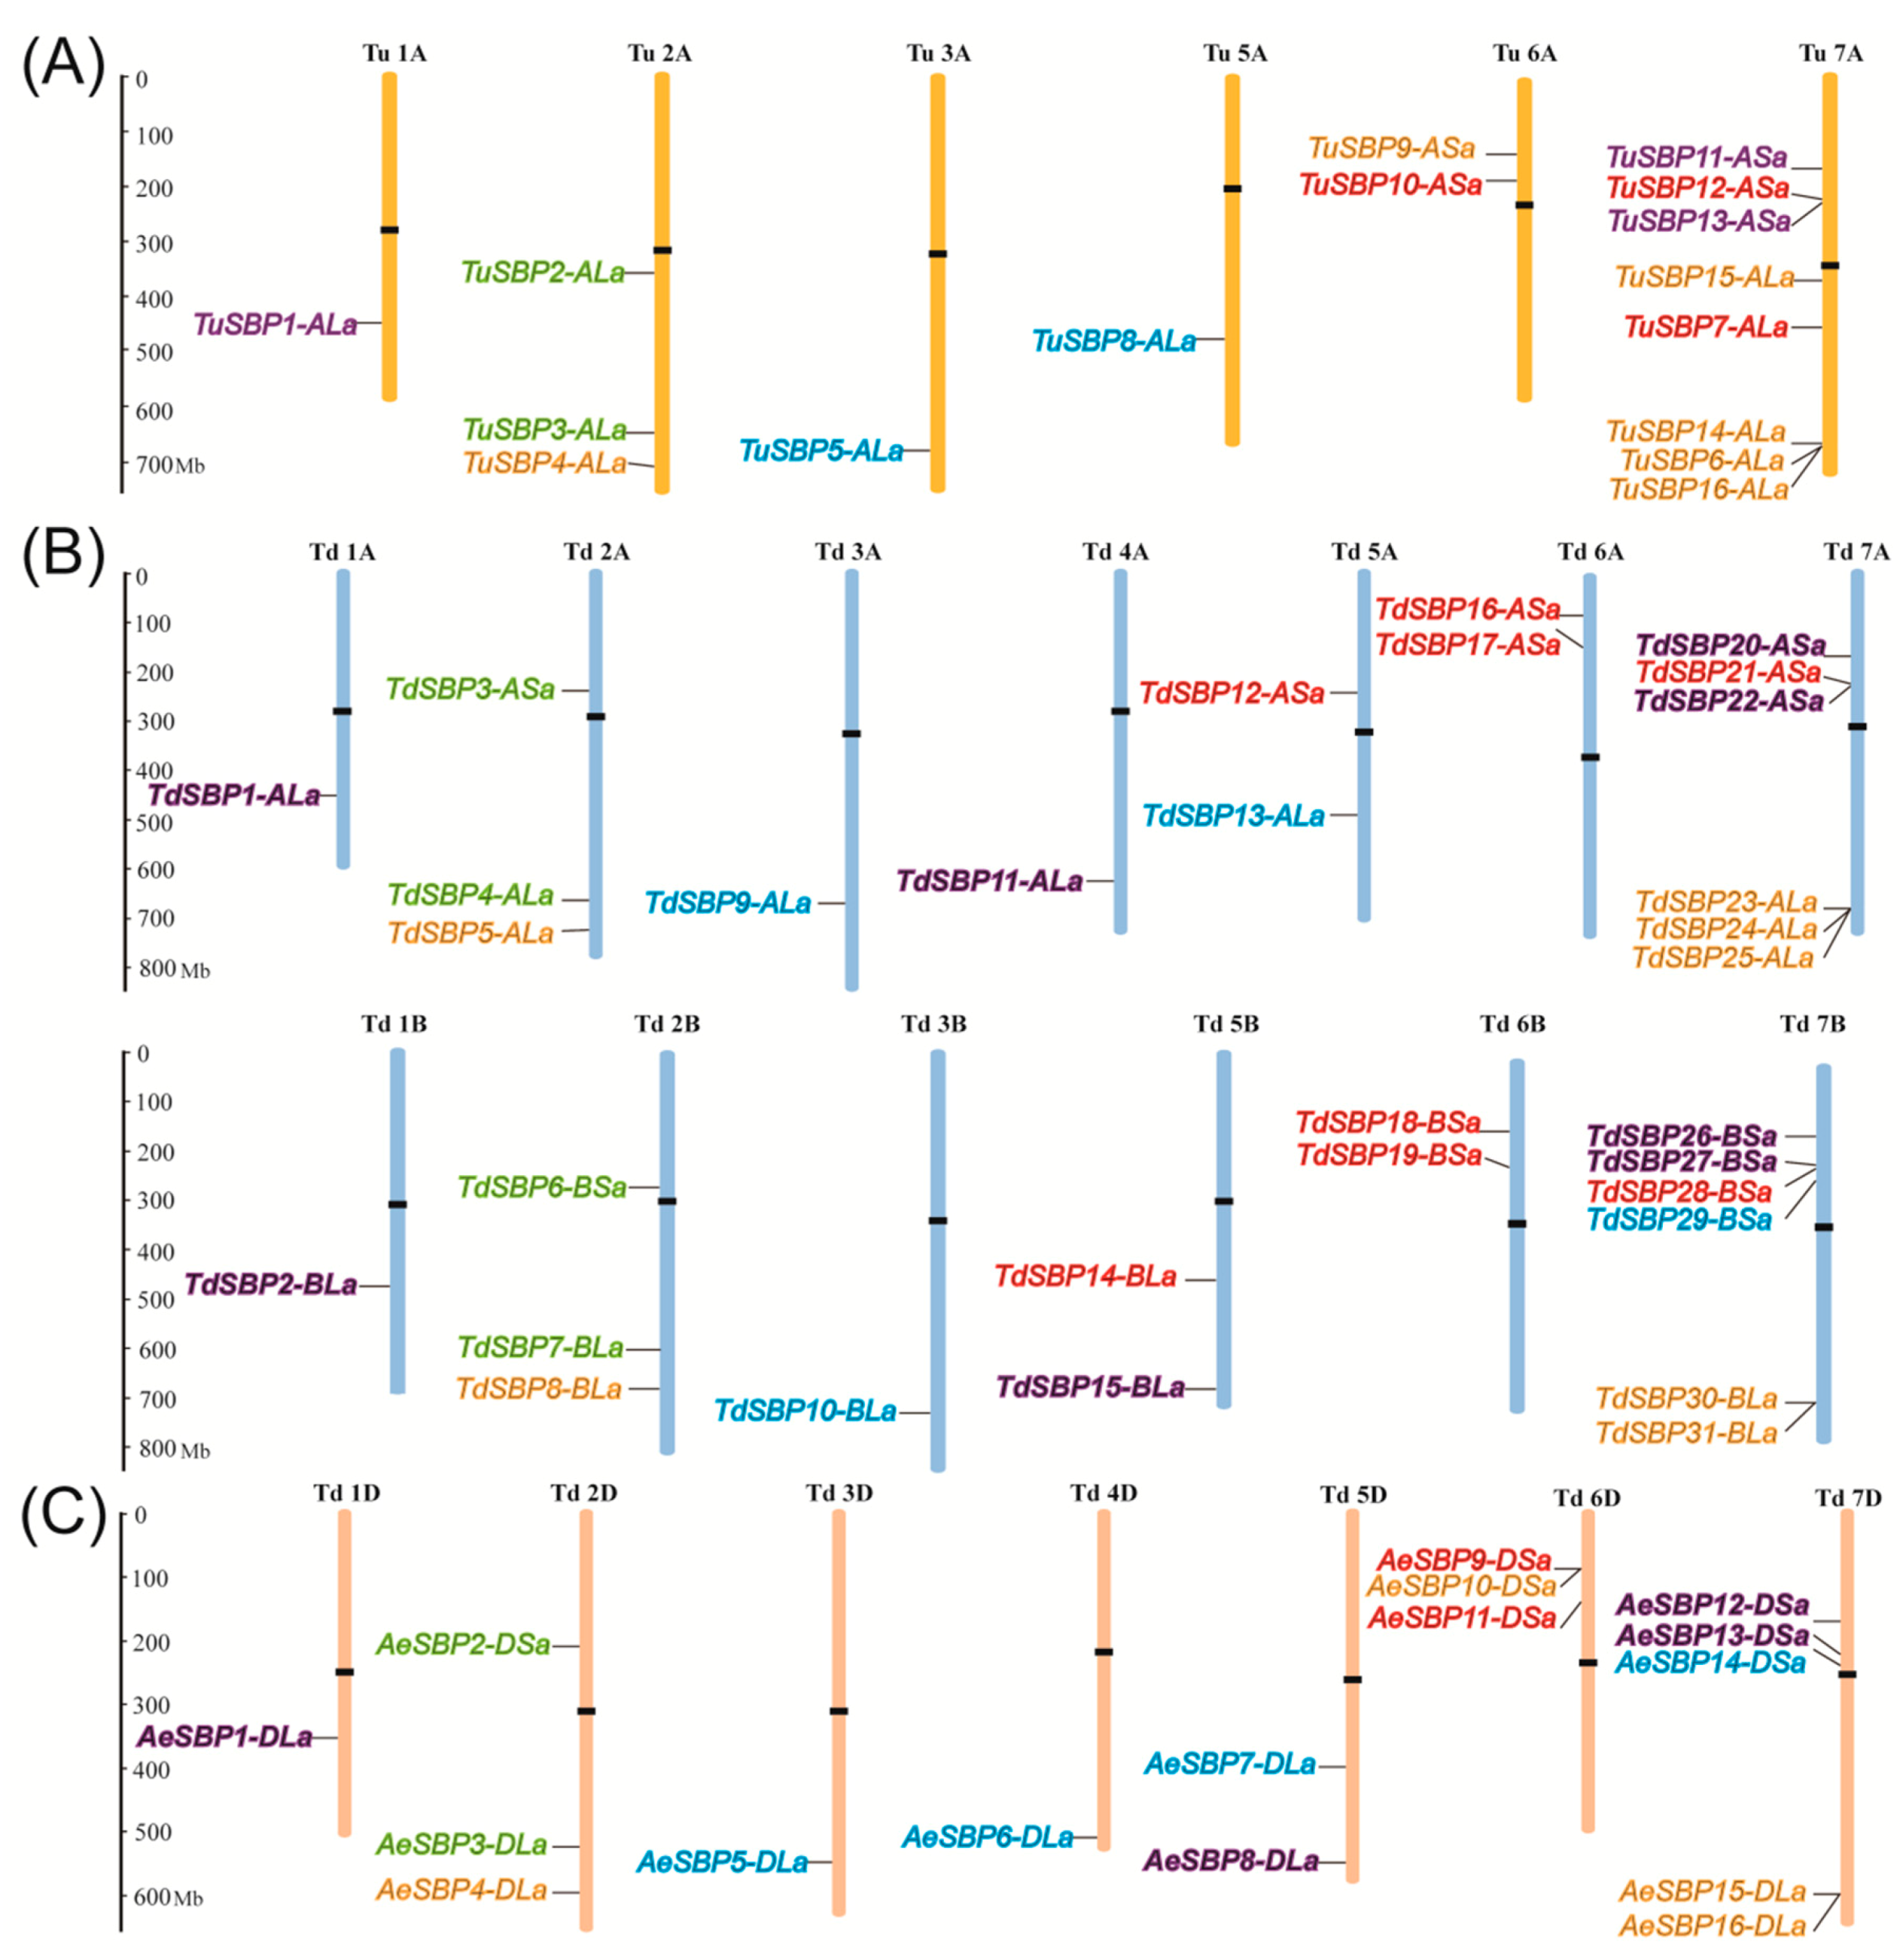
The reference GFF3 files provided the chromosomal location information of the TaSBP genes. After positioning, 56 TaSBPs were mapped on 19 chromosomes (Figure 3 and Table 1), and there were no SBP genes found on chromosomes 4B and 4D. A large proportion of the TaSBP genes were distributed on chromosome 7 (23 genes) and the fewest were distributed on chromosome 4 (1 gene). We know that wheat underwent two separate allopolyploidization events; 21 chromosomes in wheat come from three duplicates (A, B and D subgenome) of the genome [69]. In this study, we found that all TaSBPs were distributed roughly evenly across the three subgenomes (subgenome A, 19; subgenome B, 18; and subgenome D, 19). Additionally, we found that the members of each group were distributed on both the long and short arms of the chromosomes, and 24 genes were distributed on the short arms. There are more genes distributed on the long arms, a total of 32 TaSBPs (Figure 3). However, the distribution range of genes on chromosomes varied from group to group. Group IV was distributed on chromosome 2, whereas Group III was the most widely distributed in the genome, being on chromosome 1, 2, 5, 6, and 7 (Figure 3). In Triticum urartu, 17 TuSBP genes were placed on six of seven chromosomes, five of which were distributed on short arms. Chromosome 7 contained the highest number of TuSBP genes (8); only one member was assigned on each of chromosomes 1, 3 and 5. In Triticum dicoccoides, 31 TdSBP genes were located on 13 chromosomes, 14 of which were distributed on short arms. Chromosomes 7A and 7B contained the highest number of TdSBP genes (6); no genes are mapped to chromosome 4B. In Aegilops tauschii, 16 AeSBP genes are unevenly distributed on seven chromosomes, and seven AeSBPs were located on the short arm of the chromosome. As a result, distribution of these SBP genes on chromosomes in different species was irregular; for example, the number of genes distributed on chromosome 7 is always larger than others (Figure 3 and Figure 4).

3.5. Homologous Gene Pairs and Synteny Analysis

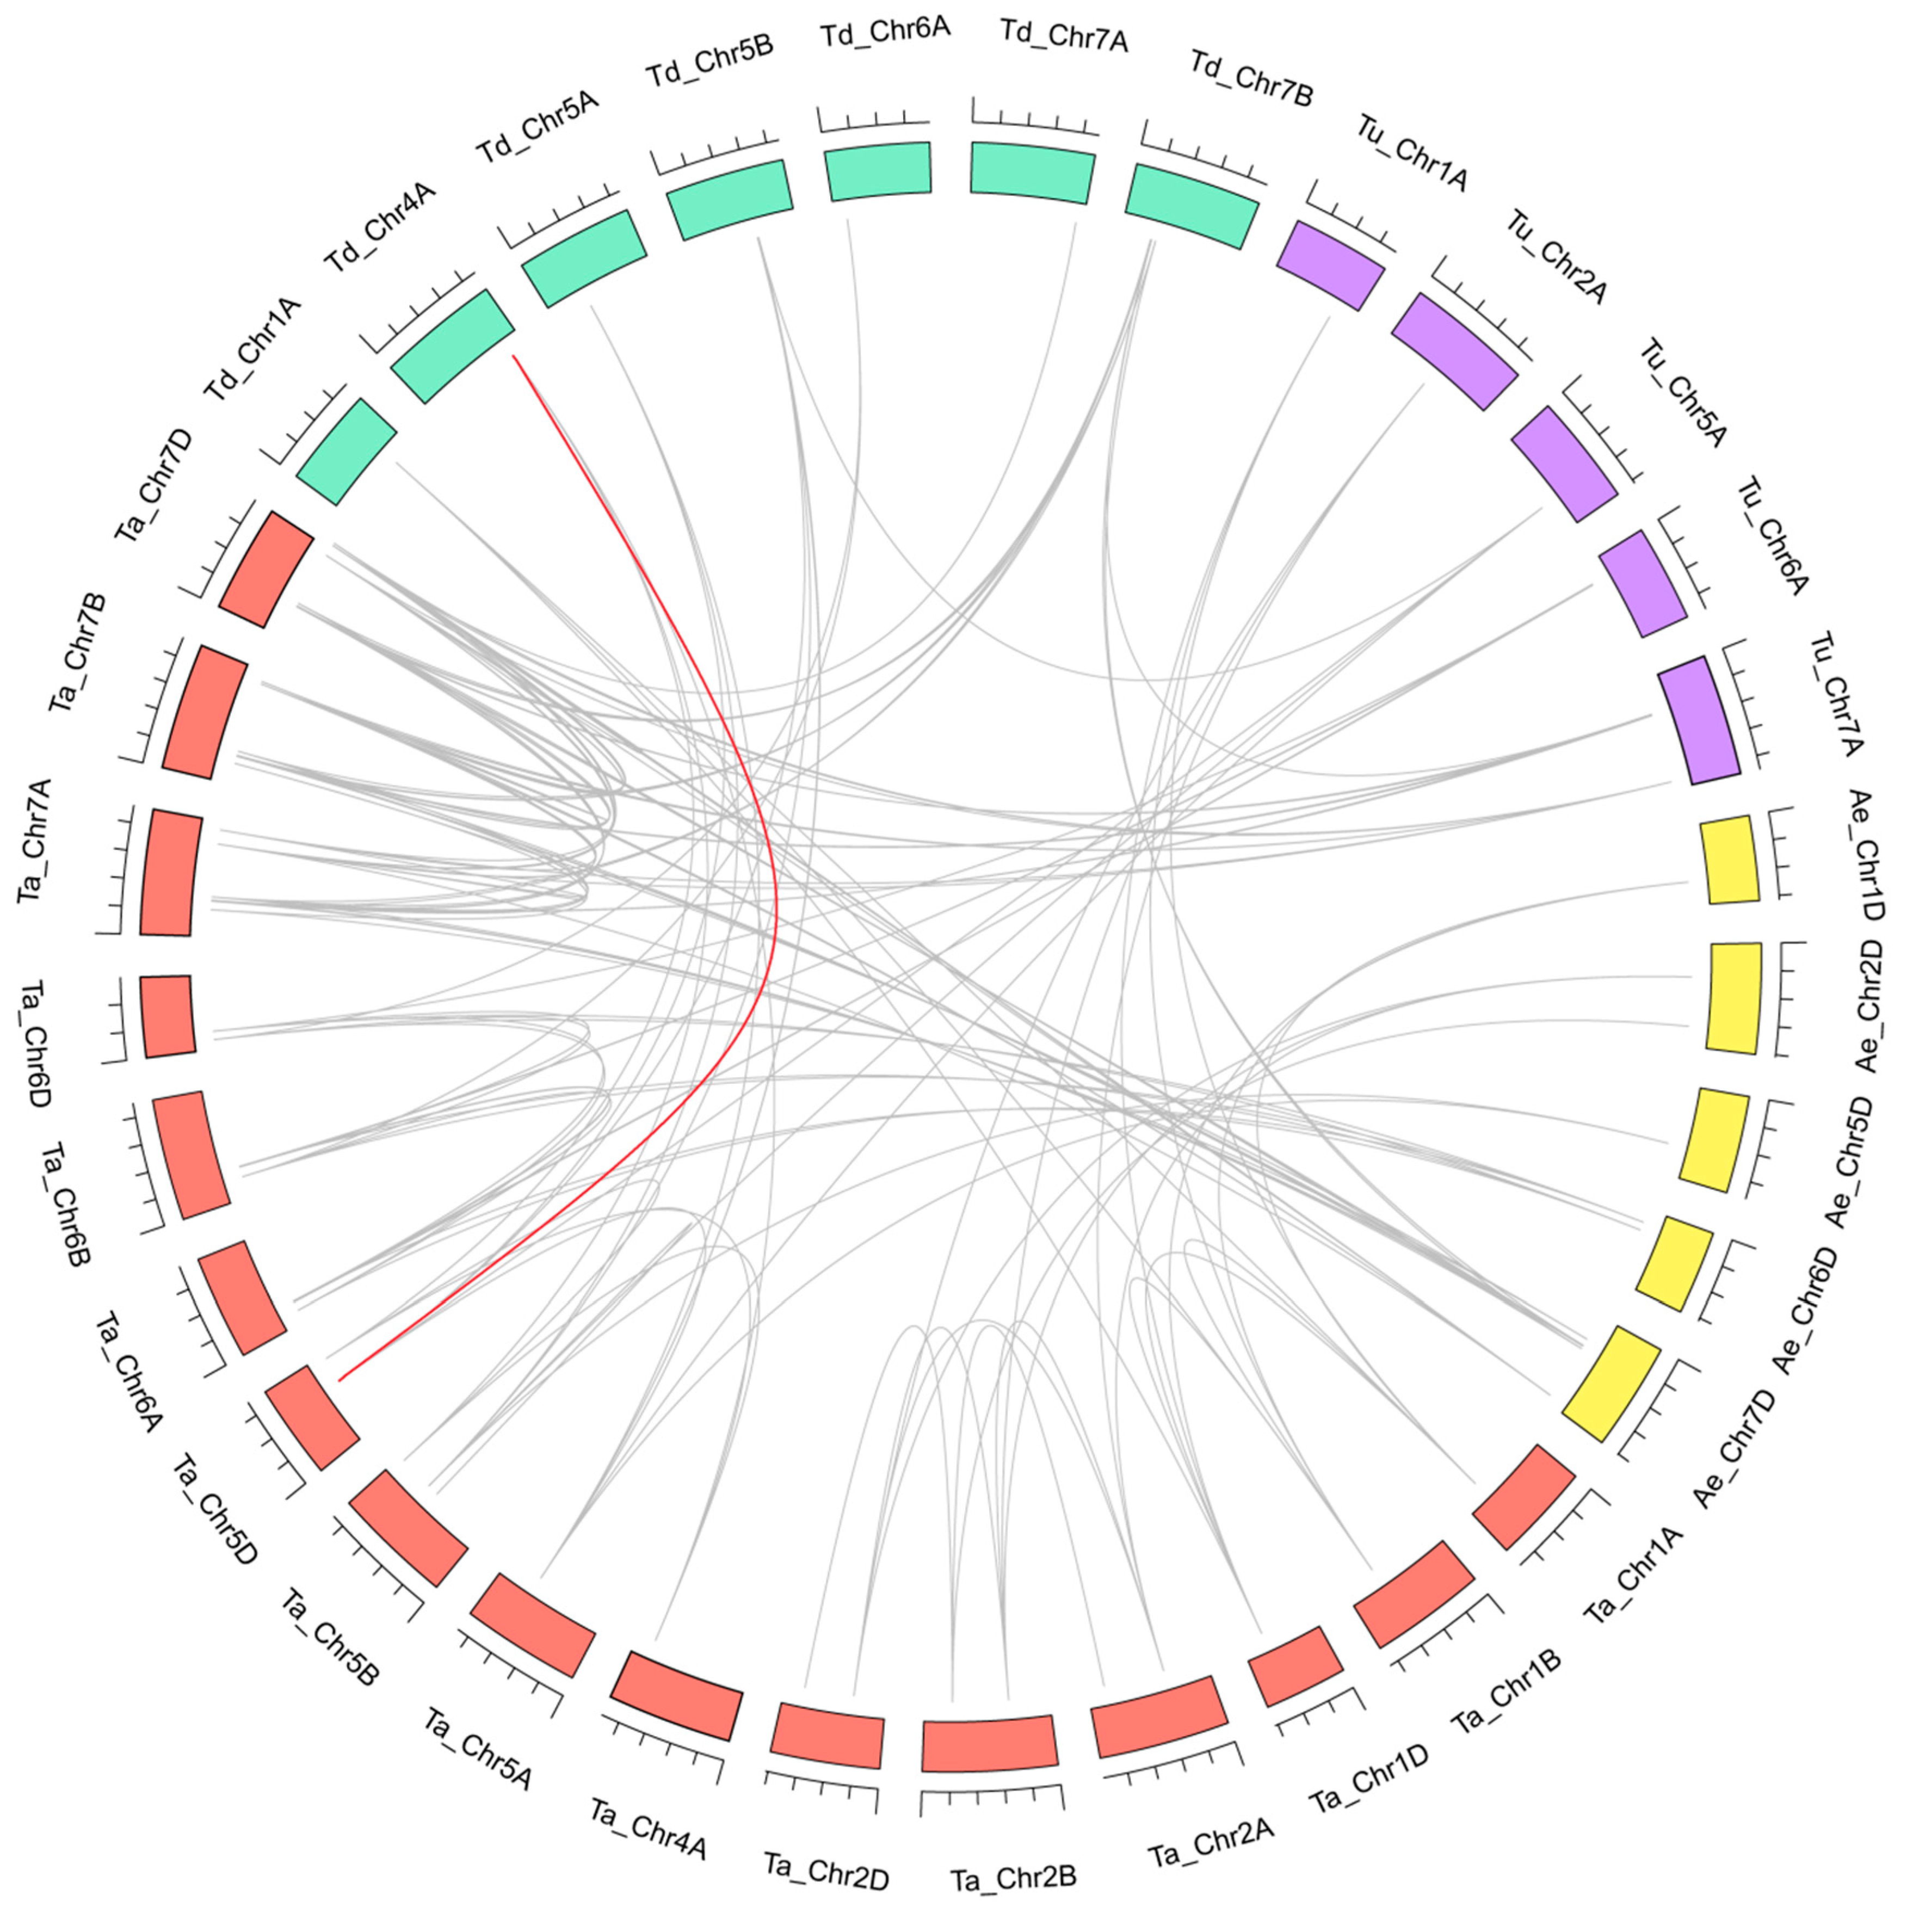
In comparative genomics, phylogeny-based and bidirectional best-hit methods are commonly used to determine possible paralogous or orthologous pairs. To identify orthologs of wheat and its subgenomic donors, 62, 42, 22, and 25 pairs of putative paralogous of TaSBP vs. TaSBP, TaSBP vs. TuSBP, TaSBP vs. TdSBP, and TaSBP vs. AeSBP were identified (Figure 5). These results were consistent with phylogenetic analyses in Figure 1A. After we removed the gene pairs associated with triads, we obtained 35 homologous pairs of TaSBP vs. TaSBP. To better understand the evolutionary factors that affect the SBP gene family, we calculated Ka and Ks ratio between TaSBP gene pairs (Table S5). The ratio of 12 TaSBP vs. TaSBP pairs of the tandem and segmental duplications was less than 1, suggesting that this gene family might have undergone light degree purifying selective pressure during evolution in wheat. The chromosome locations of most wheat SBP genes and their orthologs in Triticum urartu, Triticum dicoccoides, and Aegilops tauschii could correspond to each other (Figure 5). However, TaSBP6-DLa on wheat chromosomes 5DL had corresponding orthologs on 4AL (TdSBP11-ALa) in Triticum dicoccoides.

3.6. SBP Genes with MicroRNA156 Target Sites

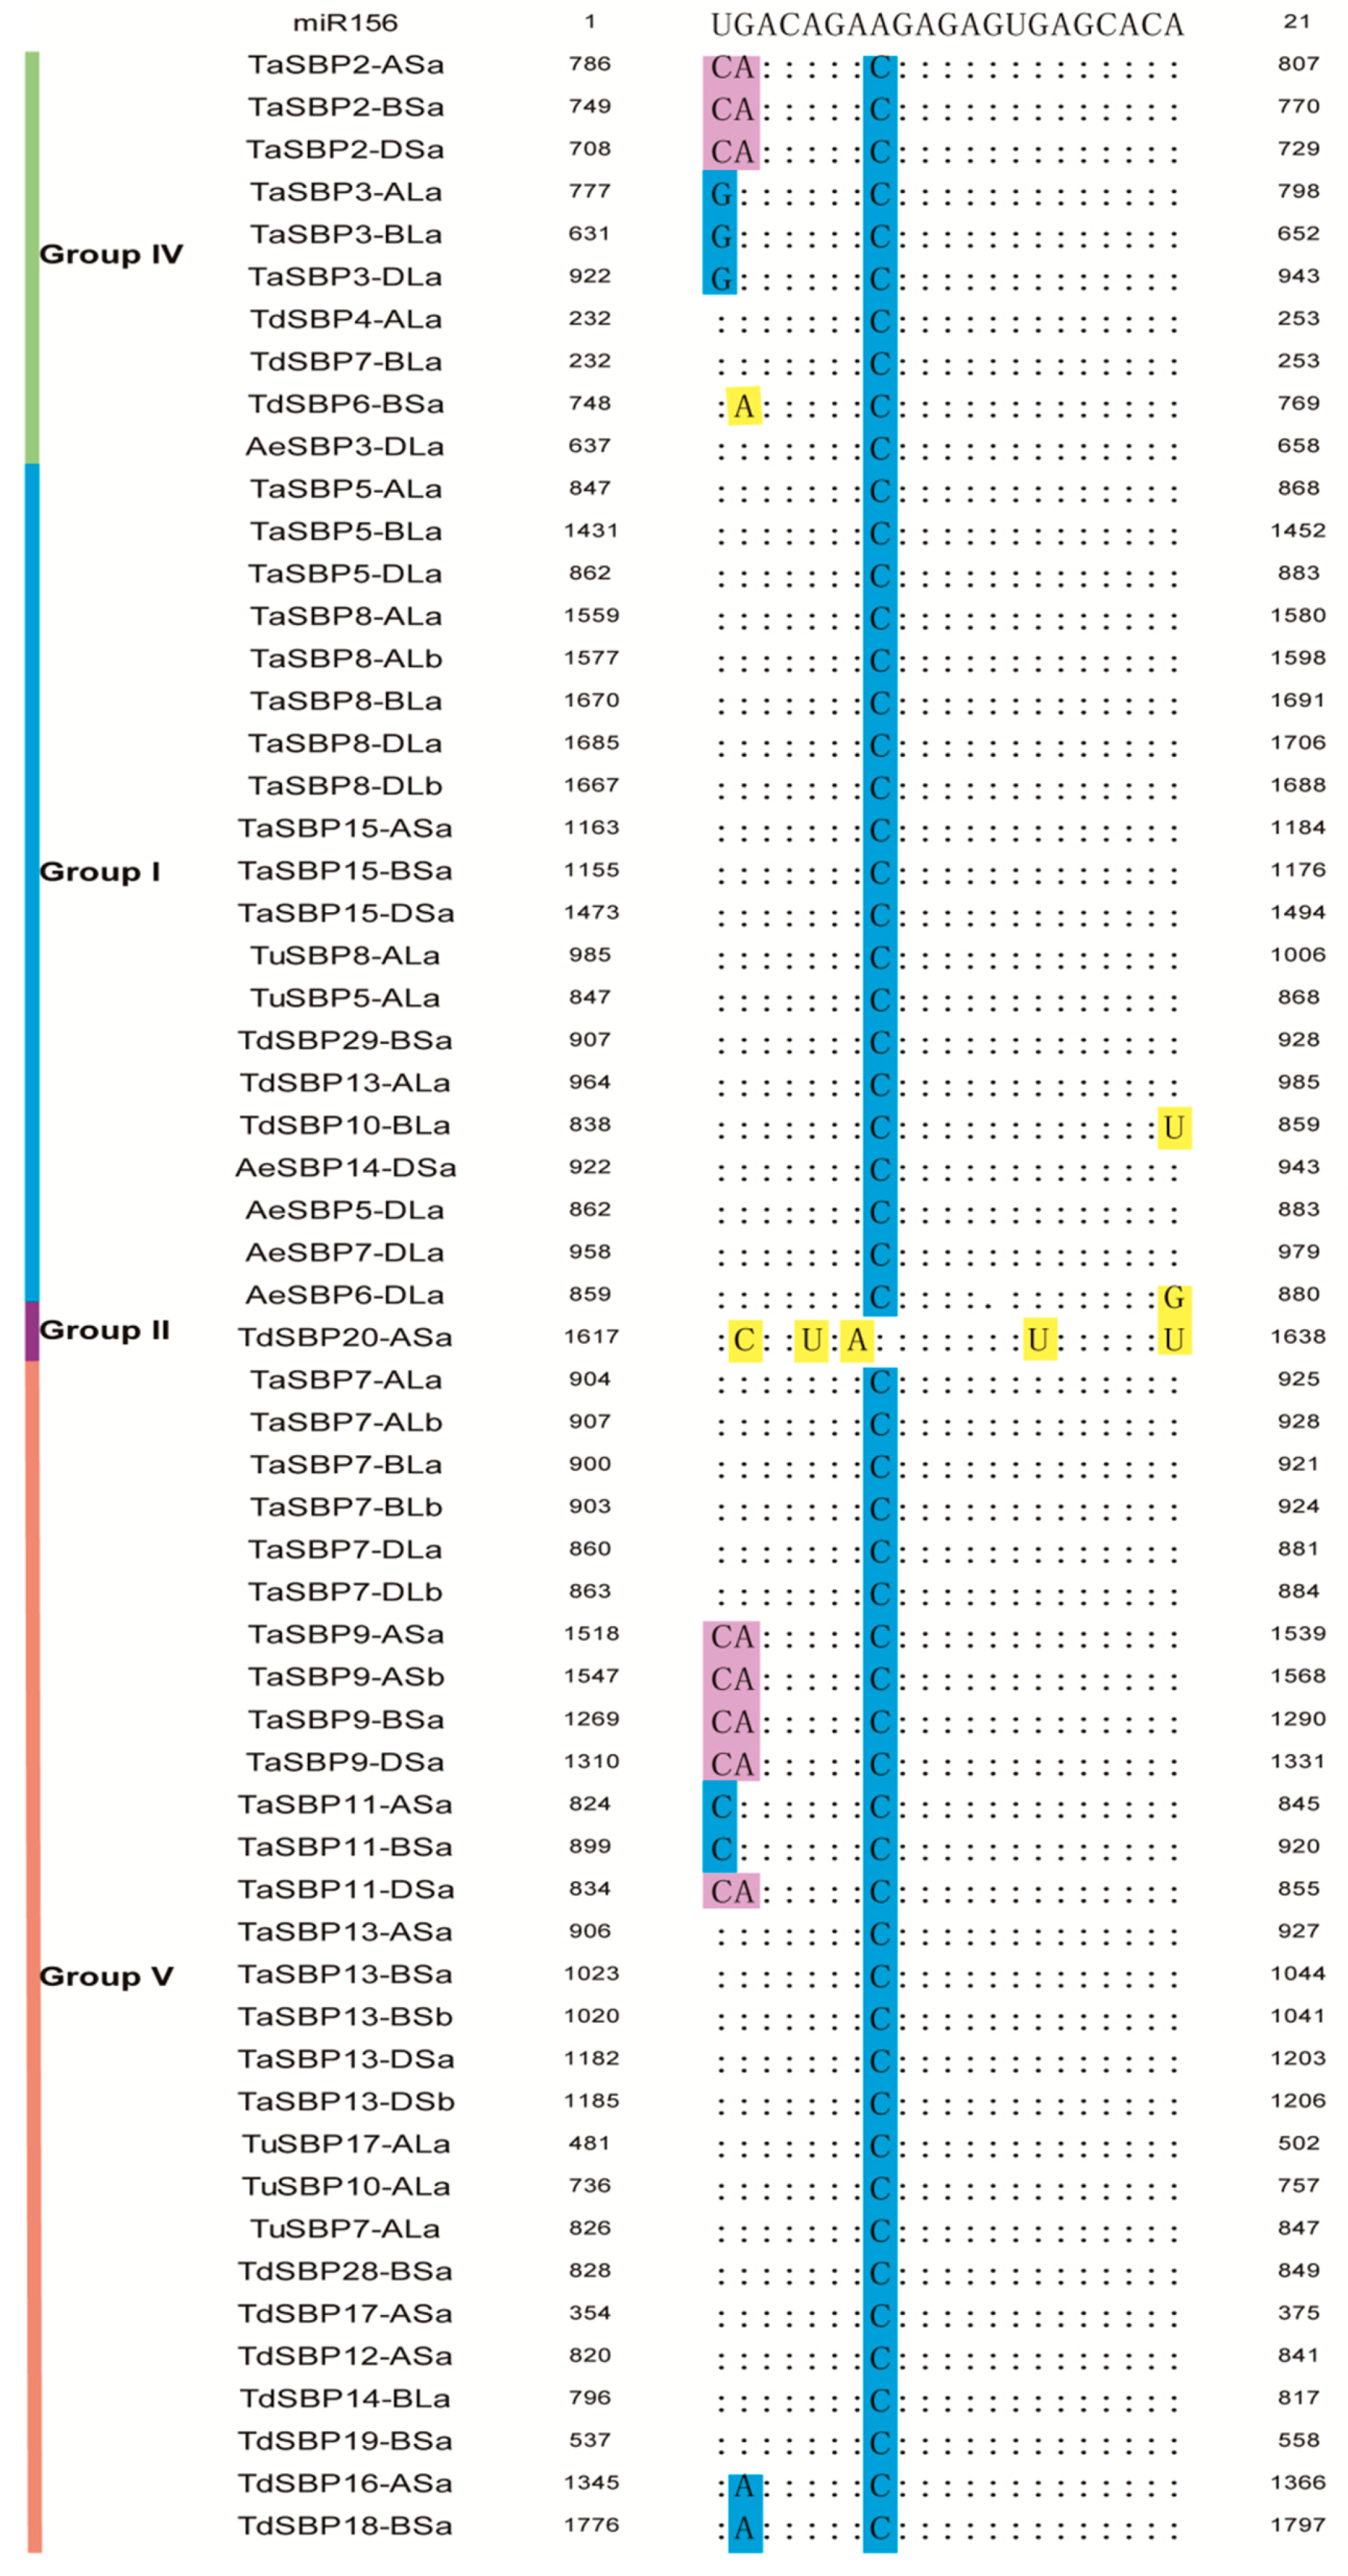
Furthermore, miR156 target sites were compared in each of the SBP genes we identified to gain further insight into their evolutionary relationship with one another. Querying the miRBase database [61,70] for miR156, we found 59 SBP genes (including 31 TaSBPs, 5 TuSBPs, 14 TdSBPs and 9 AeSBPs) coding DNA sequence (CDS) sequences well matched with miR156 and might be the targets of microRNAs (Figure 6). It is worth noting that these 59 genes are all from Group I (20), II (1), IV (10) and V (28). Since miR156 and its target genes are thought to be involved in some important developmental processes since overexpression of OsmiR156b and OsmiR156h in rice resulted in various phenotypic changes such as severe dwarfism, strongly reduced panicle size, and delayed flowering [15]. We speculate that the miRNA156 target genes of SBPs (from Triticum aestivum, Triticum urartu, Triticum dicoccoides and Aegilops tauschii) may also be involved in the regulation of plant growth and development.

3.7. Identification of Cis-Acting Elements in the Promoter of SBP Genes

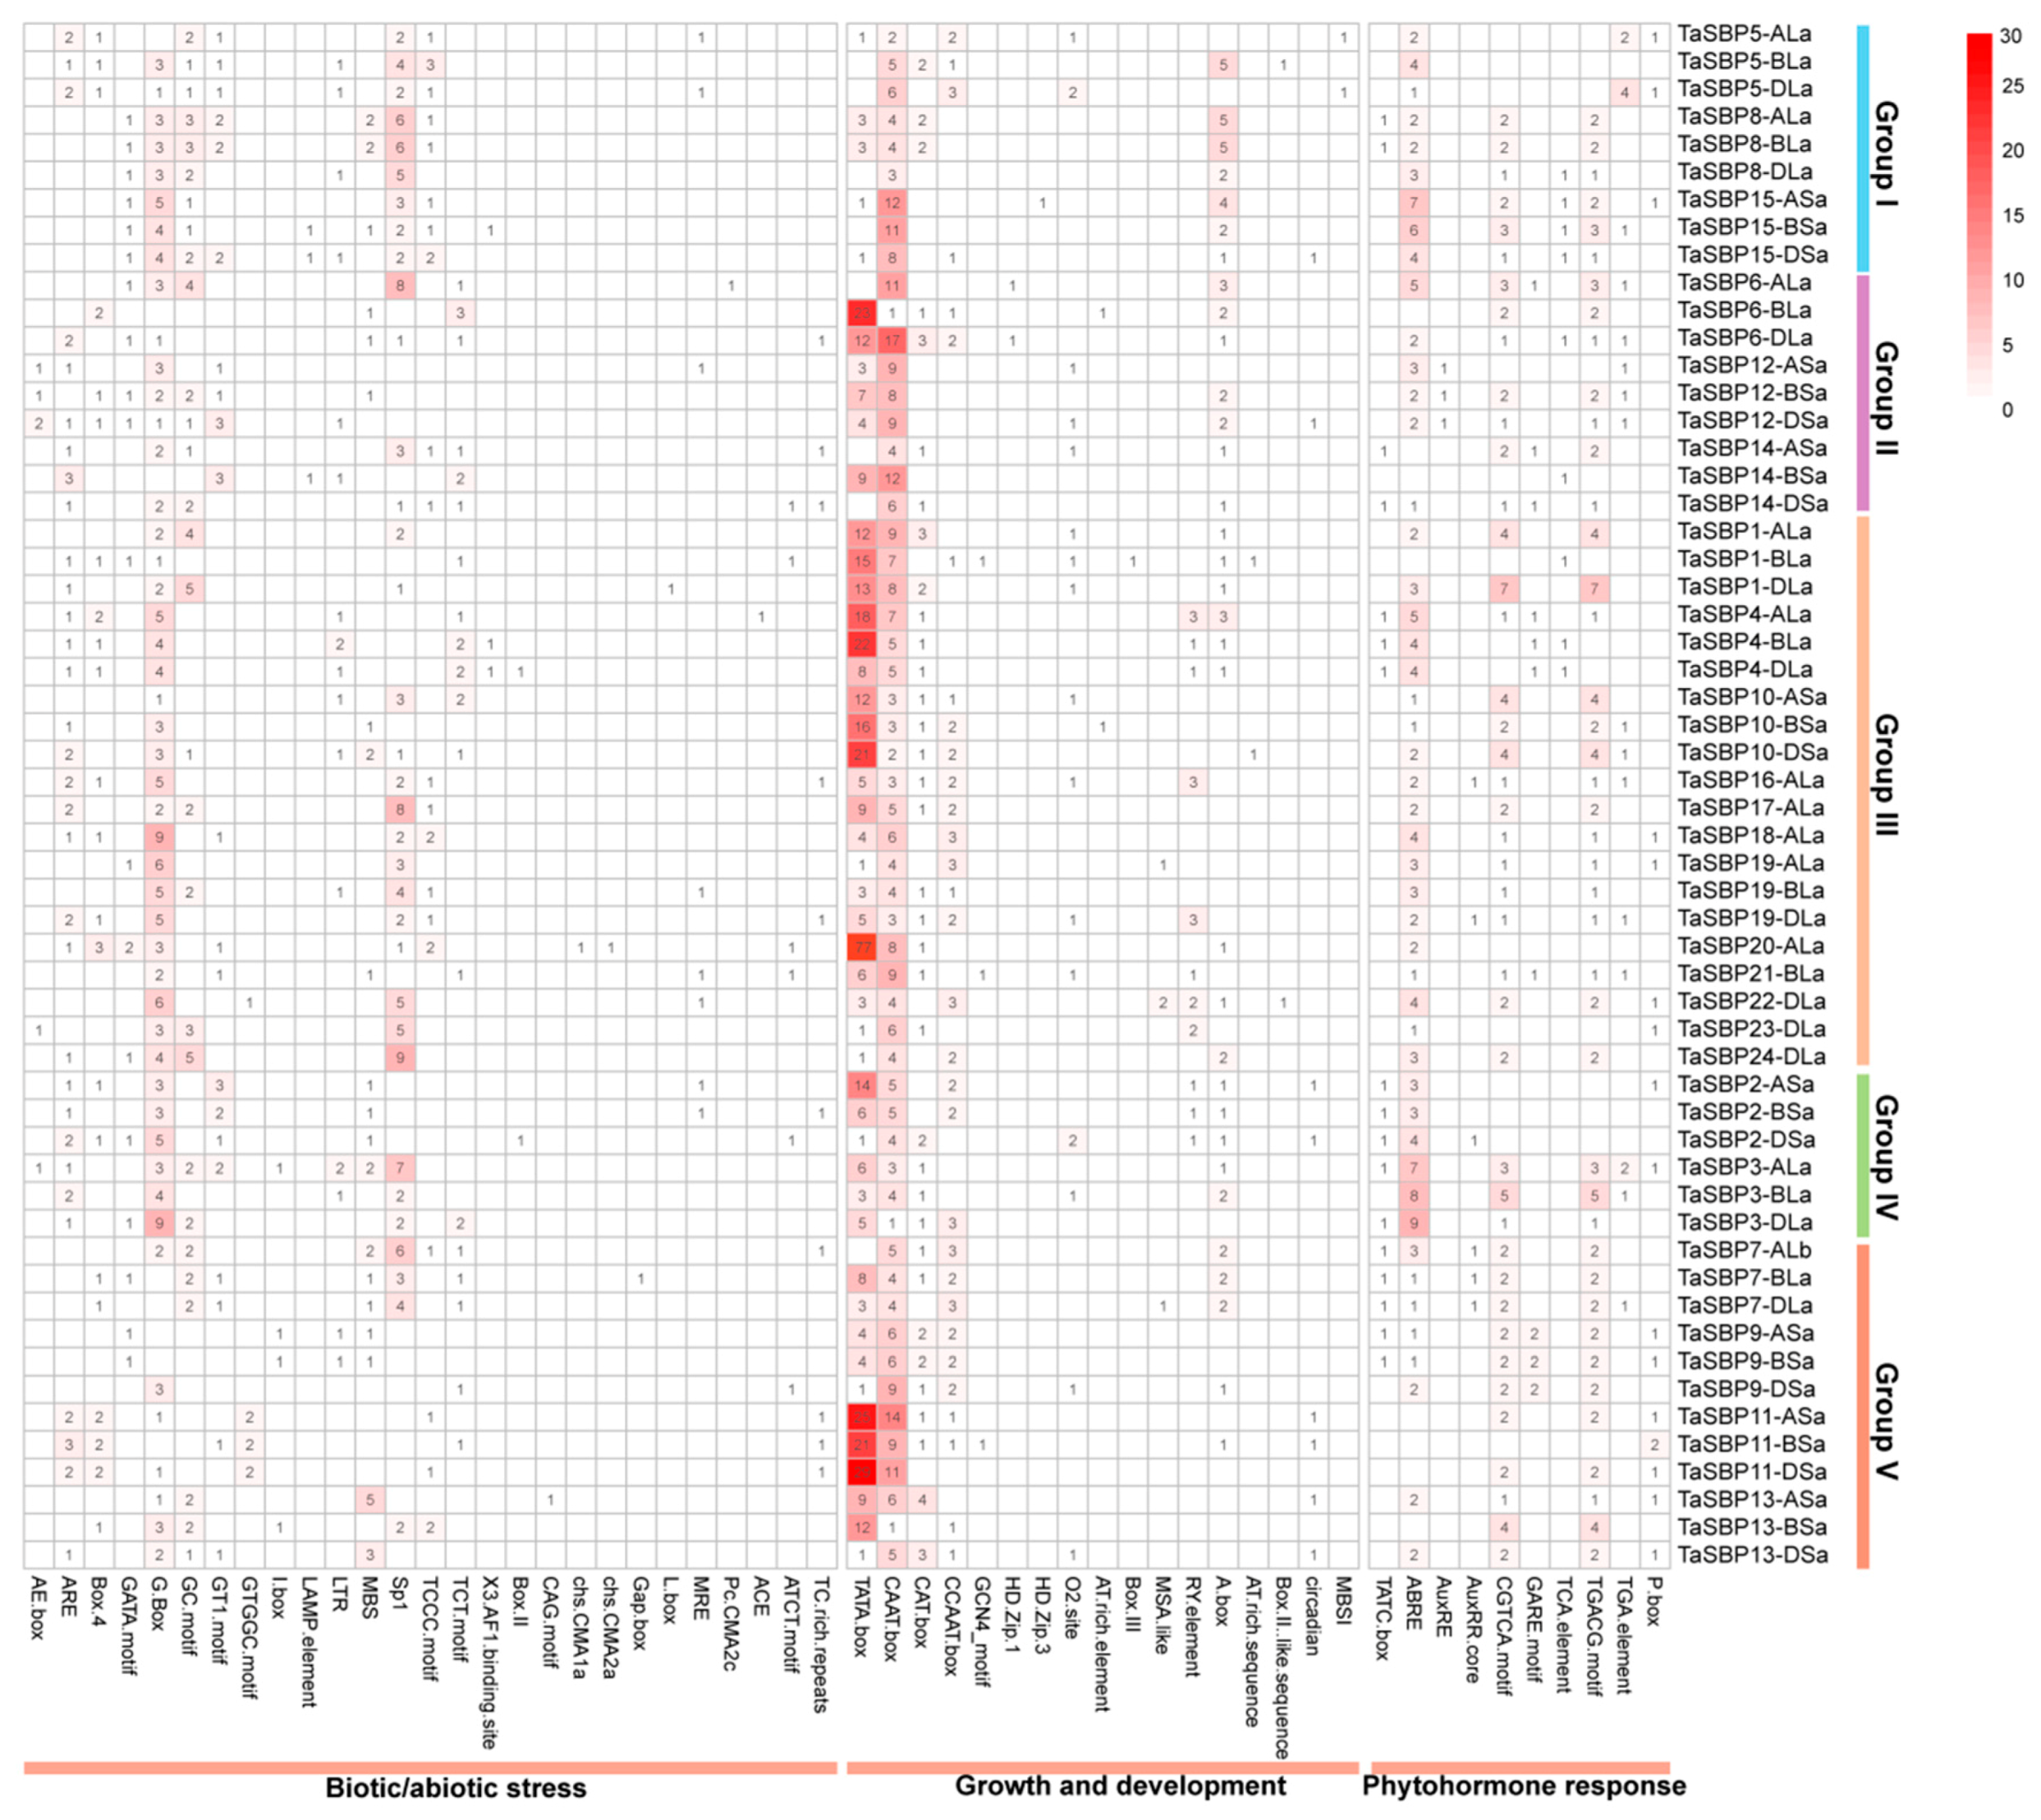
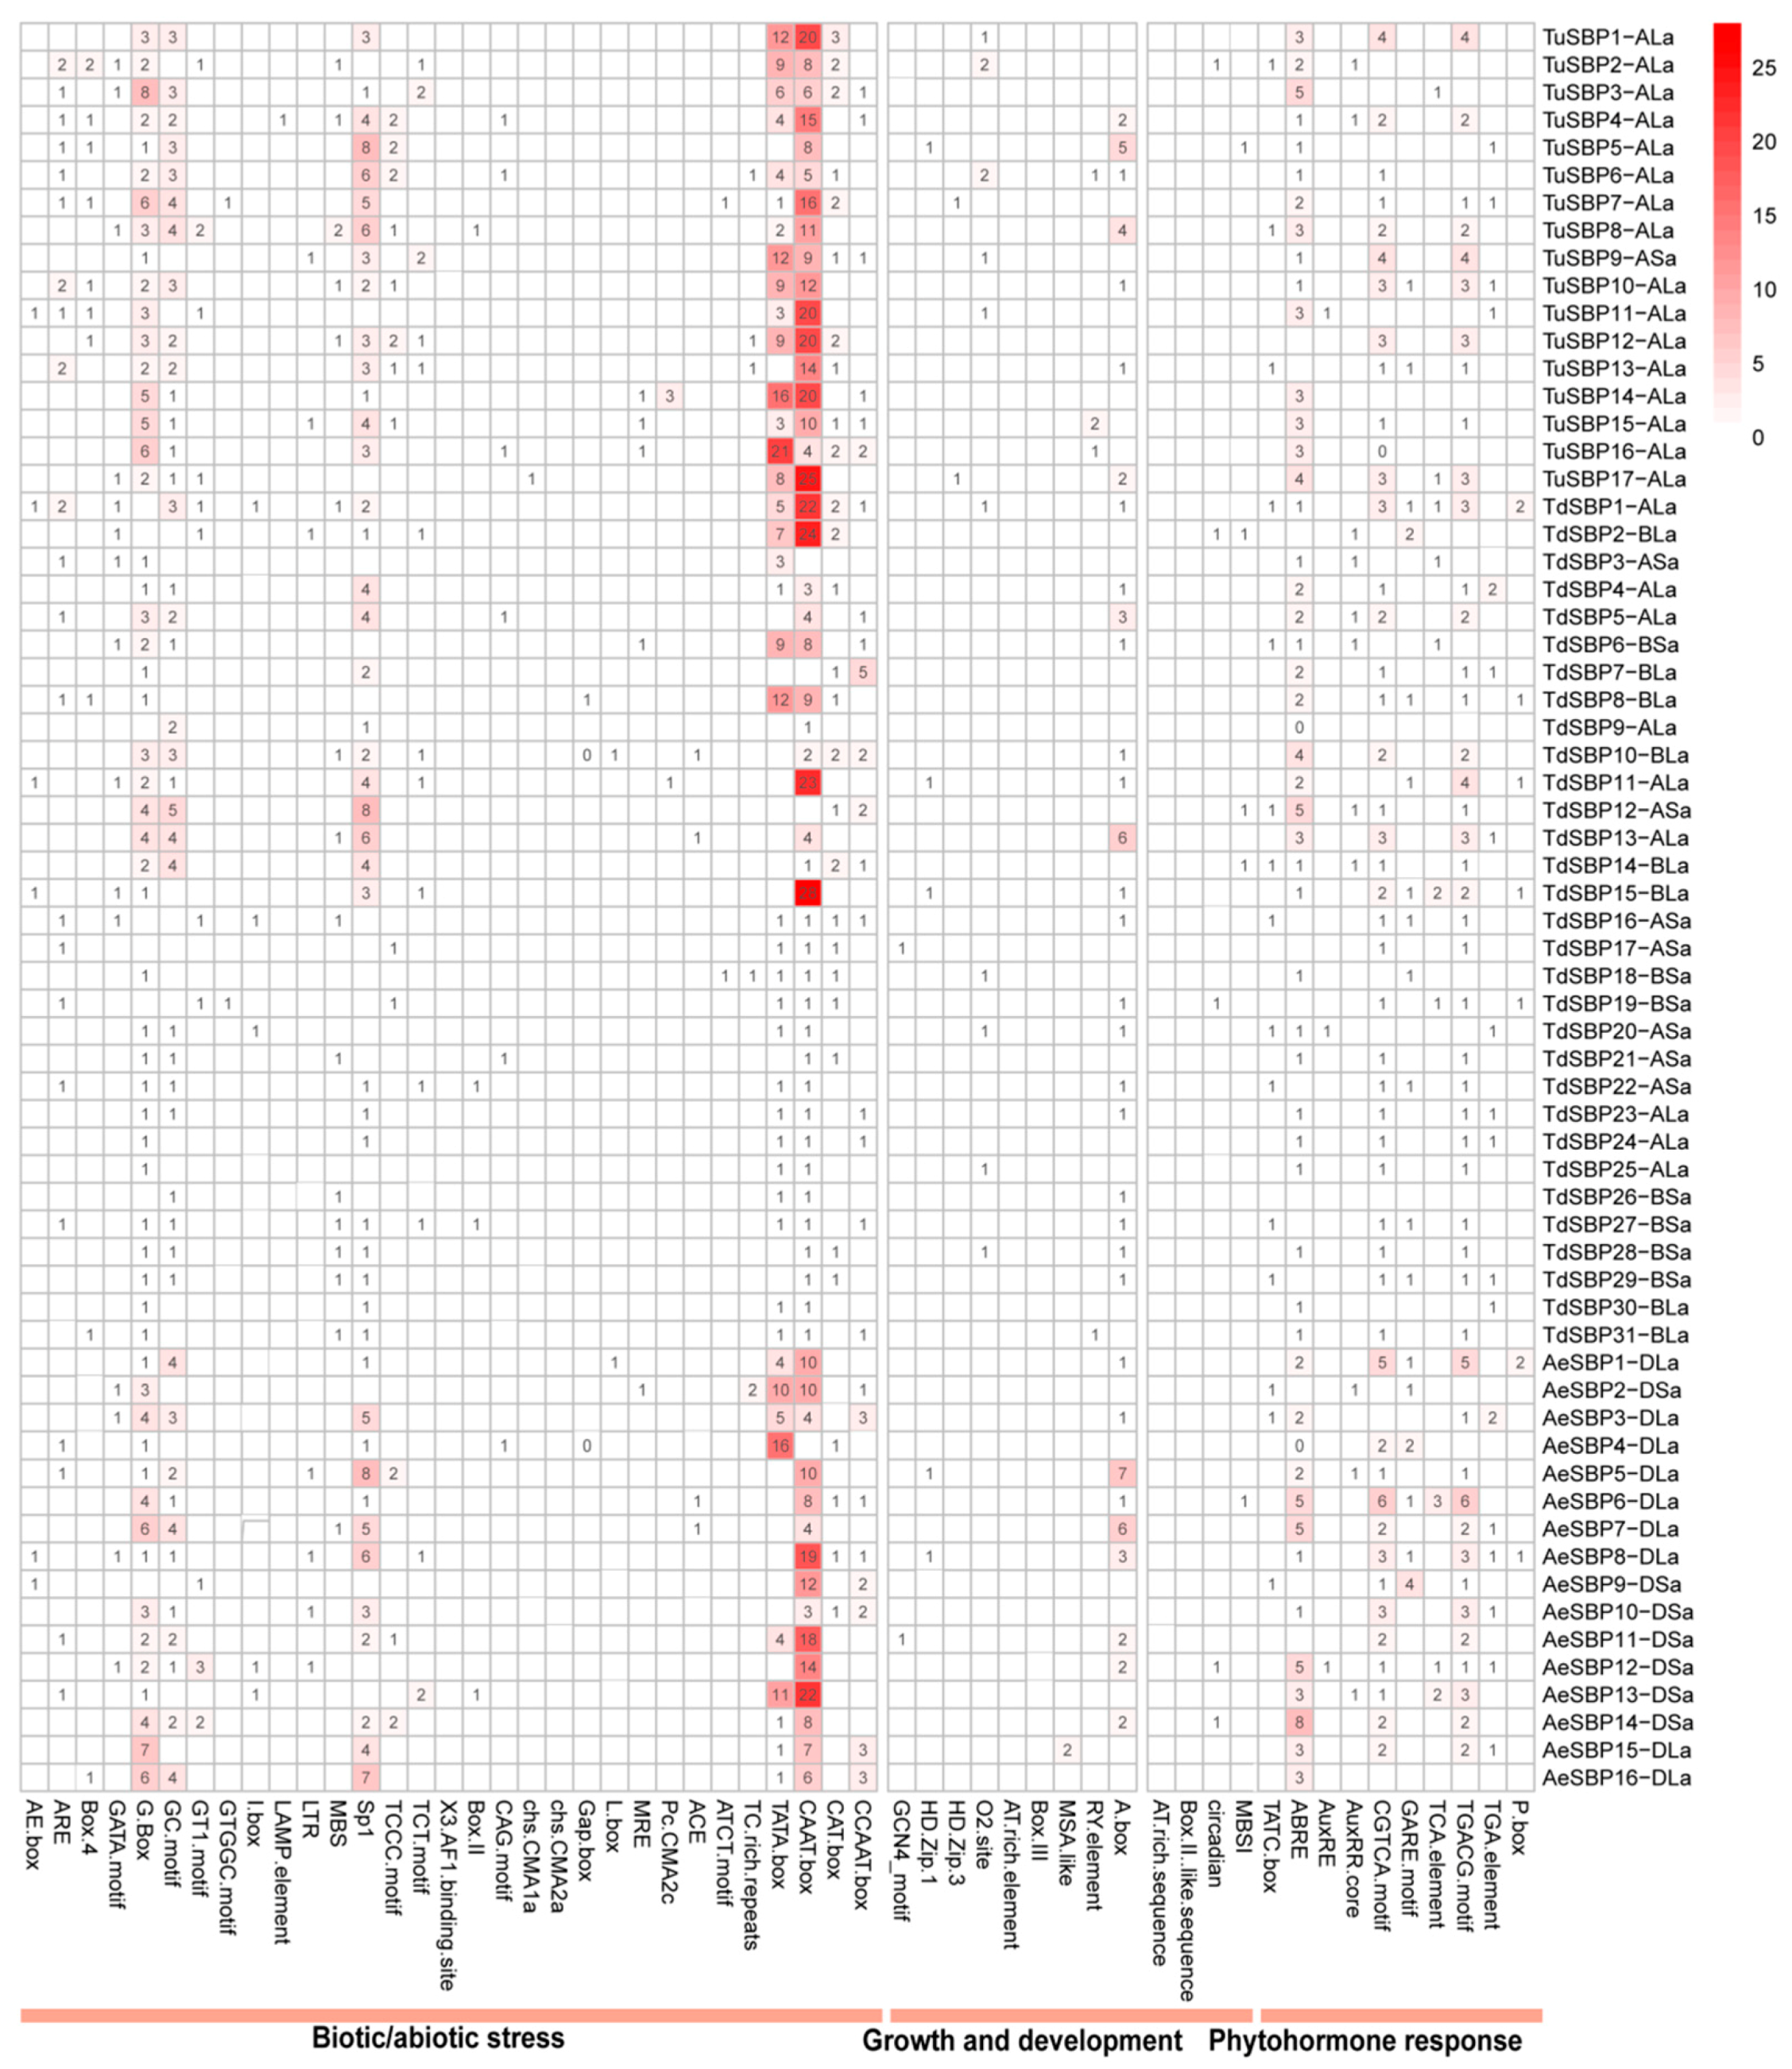
The different cis elements in the promoter of a gene indicate possible factors that affect the regulation of gene expression. In the present study, cis-elements responsible for biotic/abiotic stress, growth and development and phytohormone response were identified (Figure 7, Tables S6 and S7). In biotic/abiotic stress, two motifs, G-box and CAAT, were most frequently identified in the wheat SBP gene promoters [71]. For hormone-related cis-acting elements, the MeJA-responsive elements CGTCA and TGACG were most frequently identified in the TaSBP gene promoters [1,72]. The ABA-responsive element (ABRE) was also found in most of wheat SBP genes [73]. For TaSBP3, seven, eight, and nine cis-elements were identified on its A, B, and D homoeolog promoters, respectively. Several growth and development related cis-elements, such as TATA-box, CAAT-box and CAT-box were also present in promoters of some wheat SBP genes [1,71]. The distribution pattern of cis-acting elements in Triticum urartu and Aegilops tauschii is also similar to that of hexaploid wheat (Figure 8). In Triticum dicoccoides, the degree of enrichment of TdSBP1-ALa, TdSBP2-BLa, TdSBP3-ASa, TdSBP3-ASa, TdSBP8-BLa, TdSBP11-ALa, and TdSBP11-ALa in cis-acting element TATA-box and CAAT-box is relatively higher than other TdSBPs.

3.8. Expression Analysis of SBP Genes in Wheat

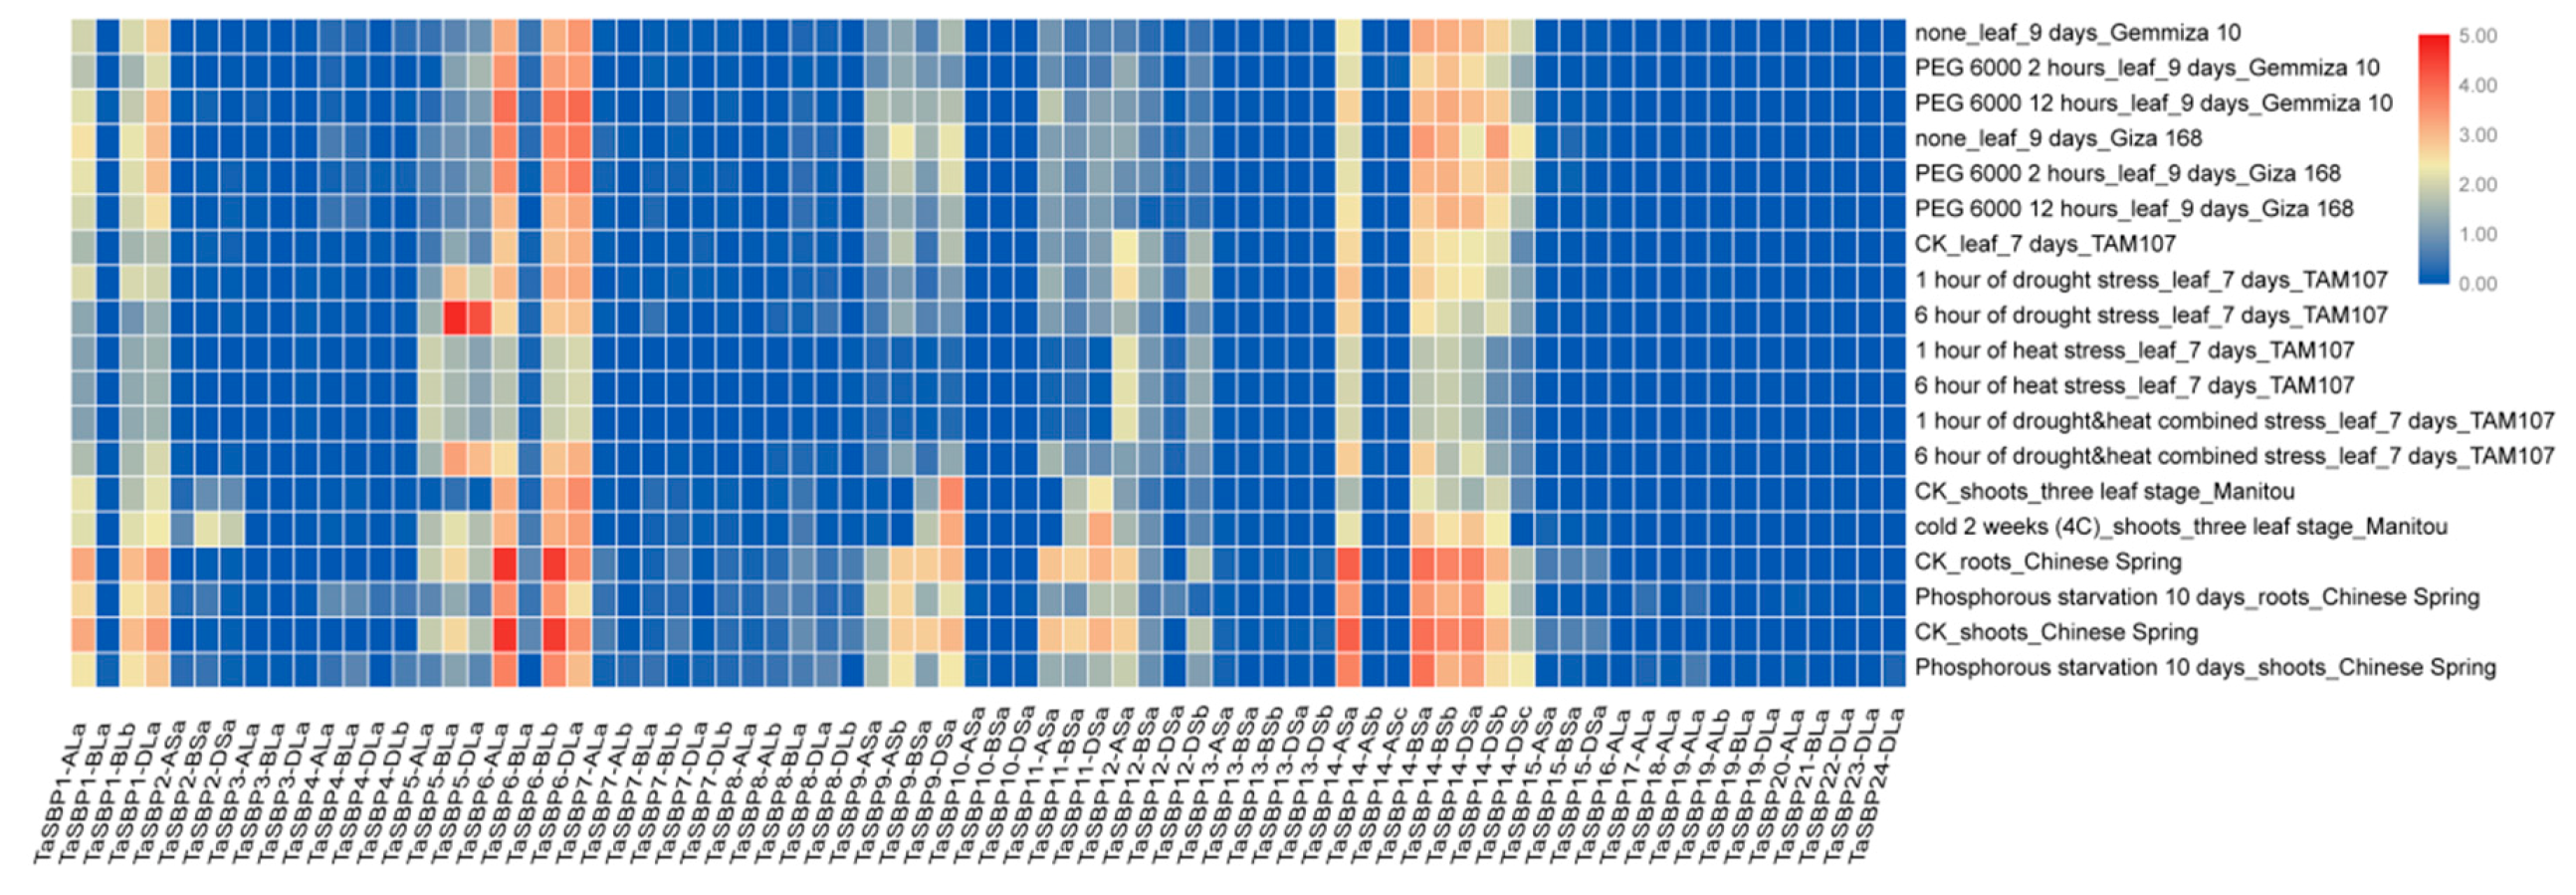
The original RNA-seq data related to biotic stress, abiotic stress and growth and development were downloaded from the NCBI database and used to mine the expression profiling of 74 TaSBP proteins we identified, and then used to generate heat maps (Table S8). To discuss whether there is a difference in the expression level of the gene’s shear variant, we also put the expression profile data of 18 shear variants in the same table. Figure 9 shows the expression level of TaSBP genes under abiotic stresses. In PEG6000 simulated drought stress, the expression of genes TaSBP6-ALa, TaSBP6-BLb, TaSBP6-DLa, TaSBP14-ASa, TaSBP14-BSa, TaSBP14-BSb, and TaSBP14-BSb were generally high (fold change > 3). At the same time, gene expression patterns are different in different cultivars. For example, in drought stress, the expressions of gene TaSBP6-ALa, TaSBP6-BLb, and TaSBP6-DLa in Gemmiza 10 increased with an extension in treatment time, while the expressions in Giza168 decreased over time. Six genes (TaSBP5-ALa, TaSBP5-BLa, TaSBP5-DLa, TaSBP6-BLb, TaSBP6-DLa, and TaSBP14-ASa) were highly expressed under high temperature stress, and their expression levels were all higher at 6 h after treatment than at 1 h. After two weeks of low temperature treatment, the expression levels of genes TaSBP9-DSa and TaSBP11-DSa were significantly higher than those of the experimental control. In the treatment of phosphorus starvation, 14 genes were highly expressed in root (TaSBP1-ALa, TaSBP1-BLb, TaSBP1-Dla, TaSBP6-ALa, TaSBP6-BLa, TaSBP6-BLb, TaSBP6-DLa, TaSBP9-DSa, TaSBP11-DSa, TaSBP14-ASa, TaSBP14-BSa, TaSBP14-BSb, TaSBP14-DSa, and TaSBP14-DSb). After increasing the heat treatment, the expression levels of genes TaSBP5-BLa, TaSBP6-ALa, TaSBP6-BLb, and TaSBP6-DLa were downregulated, compared with drought stress alone after 1 h (Figure 9). During a 6-h combined heat and drought stress, the expression of TaSBP5-BLa and TaSBP5-DLa was lower than that under drought stress alone. The high expression of TaSBP14-ASa at 6 h of heat treatment was inhibited while being affected by drought stress. This was also the case with the expression of TaSBP5-ALa.
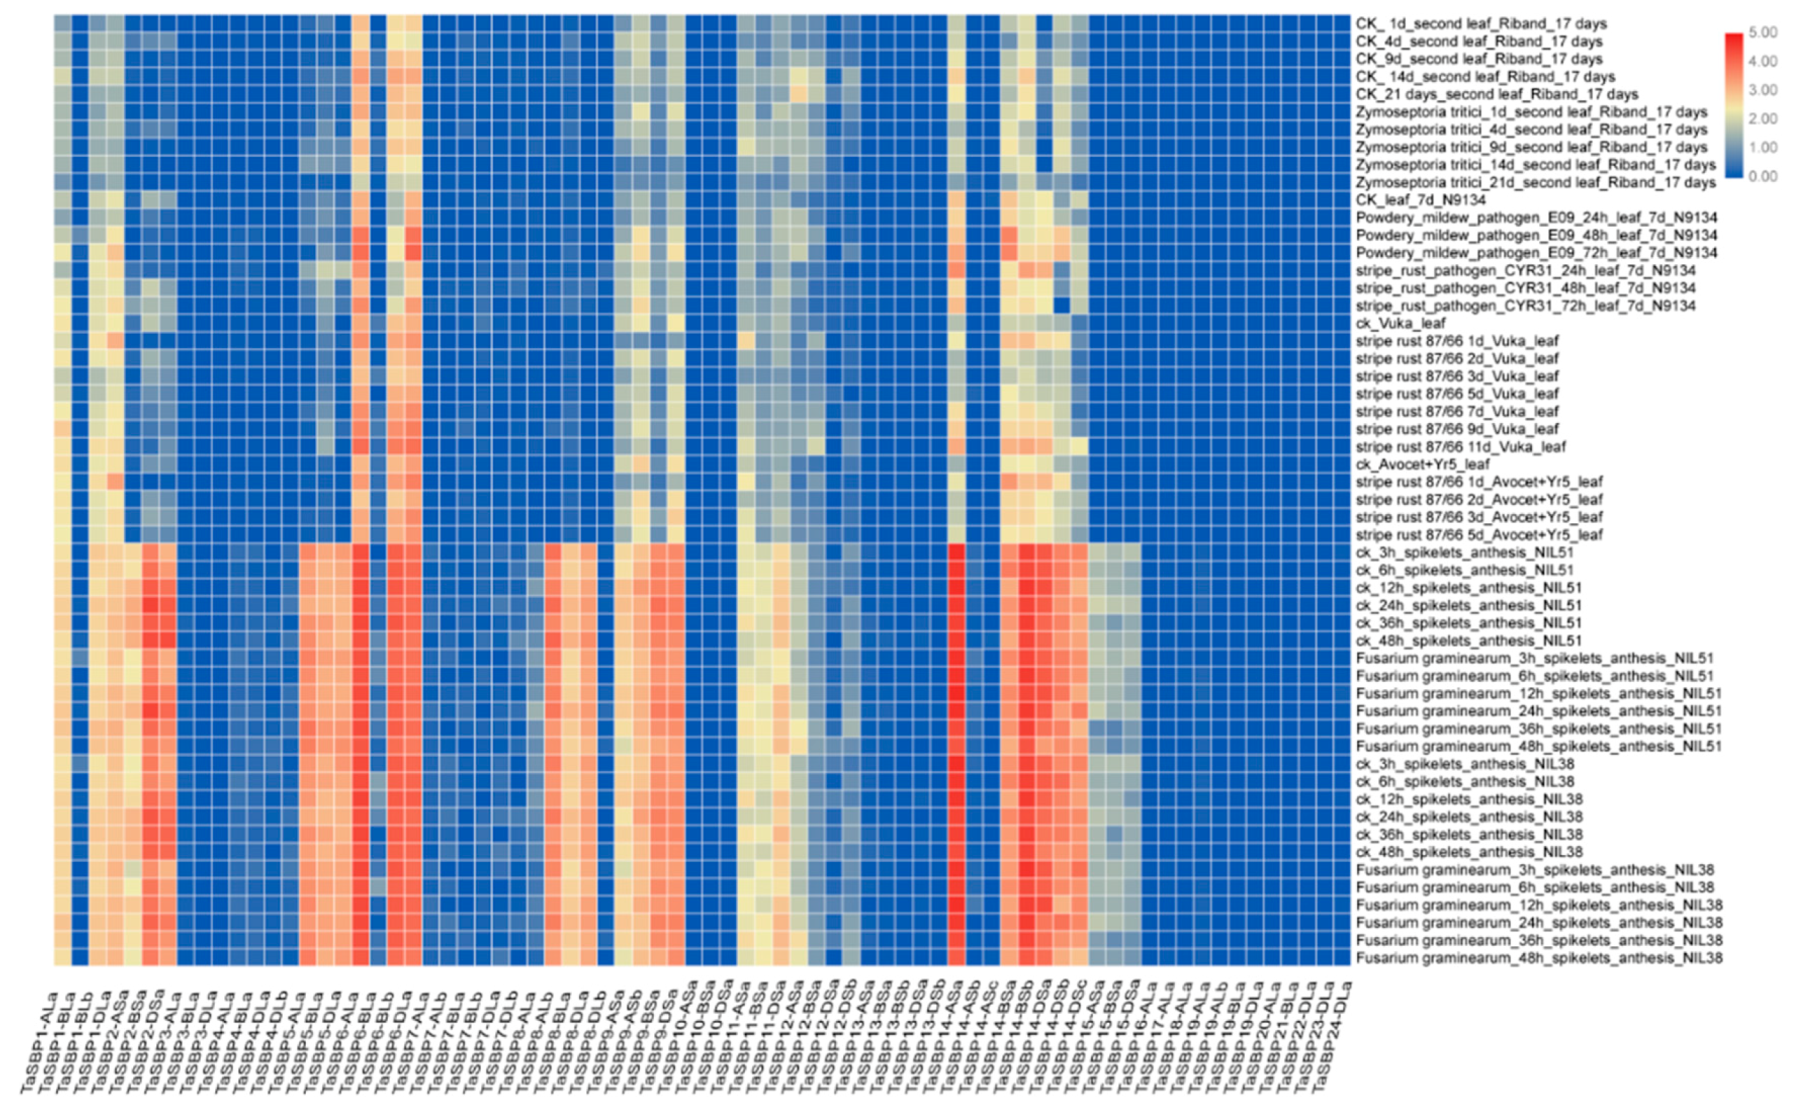
During biotic stress, 35 TaSBP genes were expressed by Fusarium graminearum infection (Figure 10). These TaSBPs could be divided into two groups. One group contained 18 members that generally highly expressed in Gemmiza 10 and Giza168 (fold change > 3). The other group contained the remaining members (17), which had lower expression (fold change < 3). In addition, TaSBP6-ALa, TaSBP6-BLb, and TaSBP6-DLa responded to the infection of stripe rust, and their expression increased with extended treatment time after one day post inoculation (dpi) in variety Vuka. After 9 dpi of Zymoseptoria tritici inoculation, the expression of gene TaSBP6-ALa, TaSBP6-BLb, and TaSBP6-DLa were consistently suppressed compared with the control experiment. TaSBP6-ALa, TaSBP6-DLa, and TaSBP14-BSa were significantly expressed in response to the stress of powdery mildew in leaf (fold change > 3).
As shown in Figure 11, 18 genes (TaSBP1-ALa, TaSBP1-BLb, TaSBP1-Dla, TaSBP6-ALa, TaSBP6-BLb, TaSBP6-DLa, TaSBP9-ASa, TaSBP9-ASb, TaSBP9-BSa, TaSBP9-DSa, TaSBP11-ASa, TaSBP11-BSa, TaSBP11-DSa, TaSBP14-ASa, TaSBP14-BSa, TaSBP14-BSb, TaSBP14-DSa, and TaSBP14-DSb), were expressed in most developmental stages, suggesting that SBP genes may play vital roles in plant growth and development. Furthermore, four genes (TaSBP9-ASa, TaSBP9-ASb, TaSBP9-BSa, and TaSBP9-DSa) were lowly expressed at seeding stage, anthesis and milk grain stage, and highly expressed in tillering stage, full boot and 30% spike stage. In addition to TaSBP1-ALa, TaSBP1-BLb, TaSBP1-Dla, TaSBP9-ASb, and TaSBP11-ASa, the remaining 13 members of these 18 genes all had the highest expression in the stigma or ovary, compared with other tissues at the flowering stage. Taken together, TaSBP6-ALa, TaSBP6-BLb, TaSBP6-DLa, TaSBP9-ASa, TaSBP9-ASb, TaSBP9-BSa, TaSBP9-DSa, TaSBP14-BSa, TaSBP14-BSb, TaSBP14-DSa, and TaSBP14-DSb were highly expressed in multiple tissues, may be involved in the regulation of growth and development, and may require further functional analysis.

3.9. Protein Features and Conservative Domain Analyses

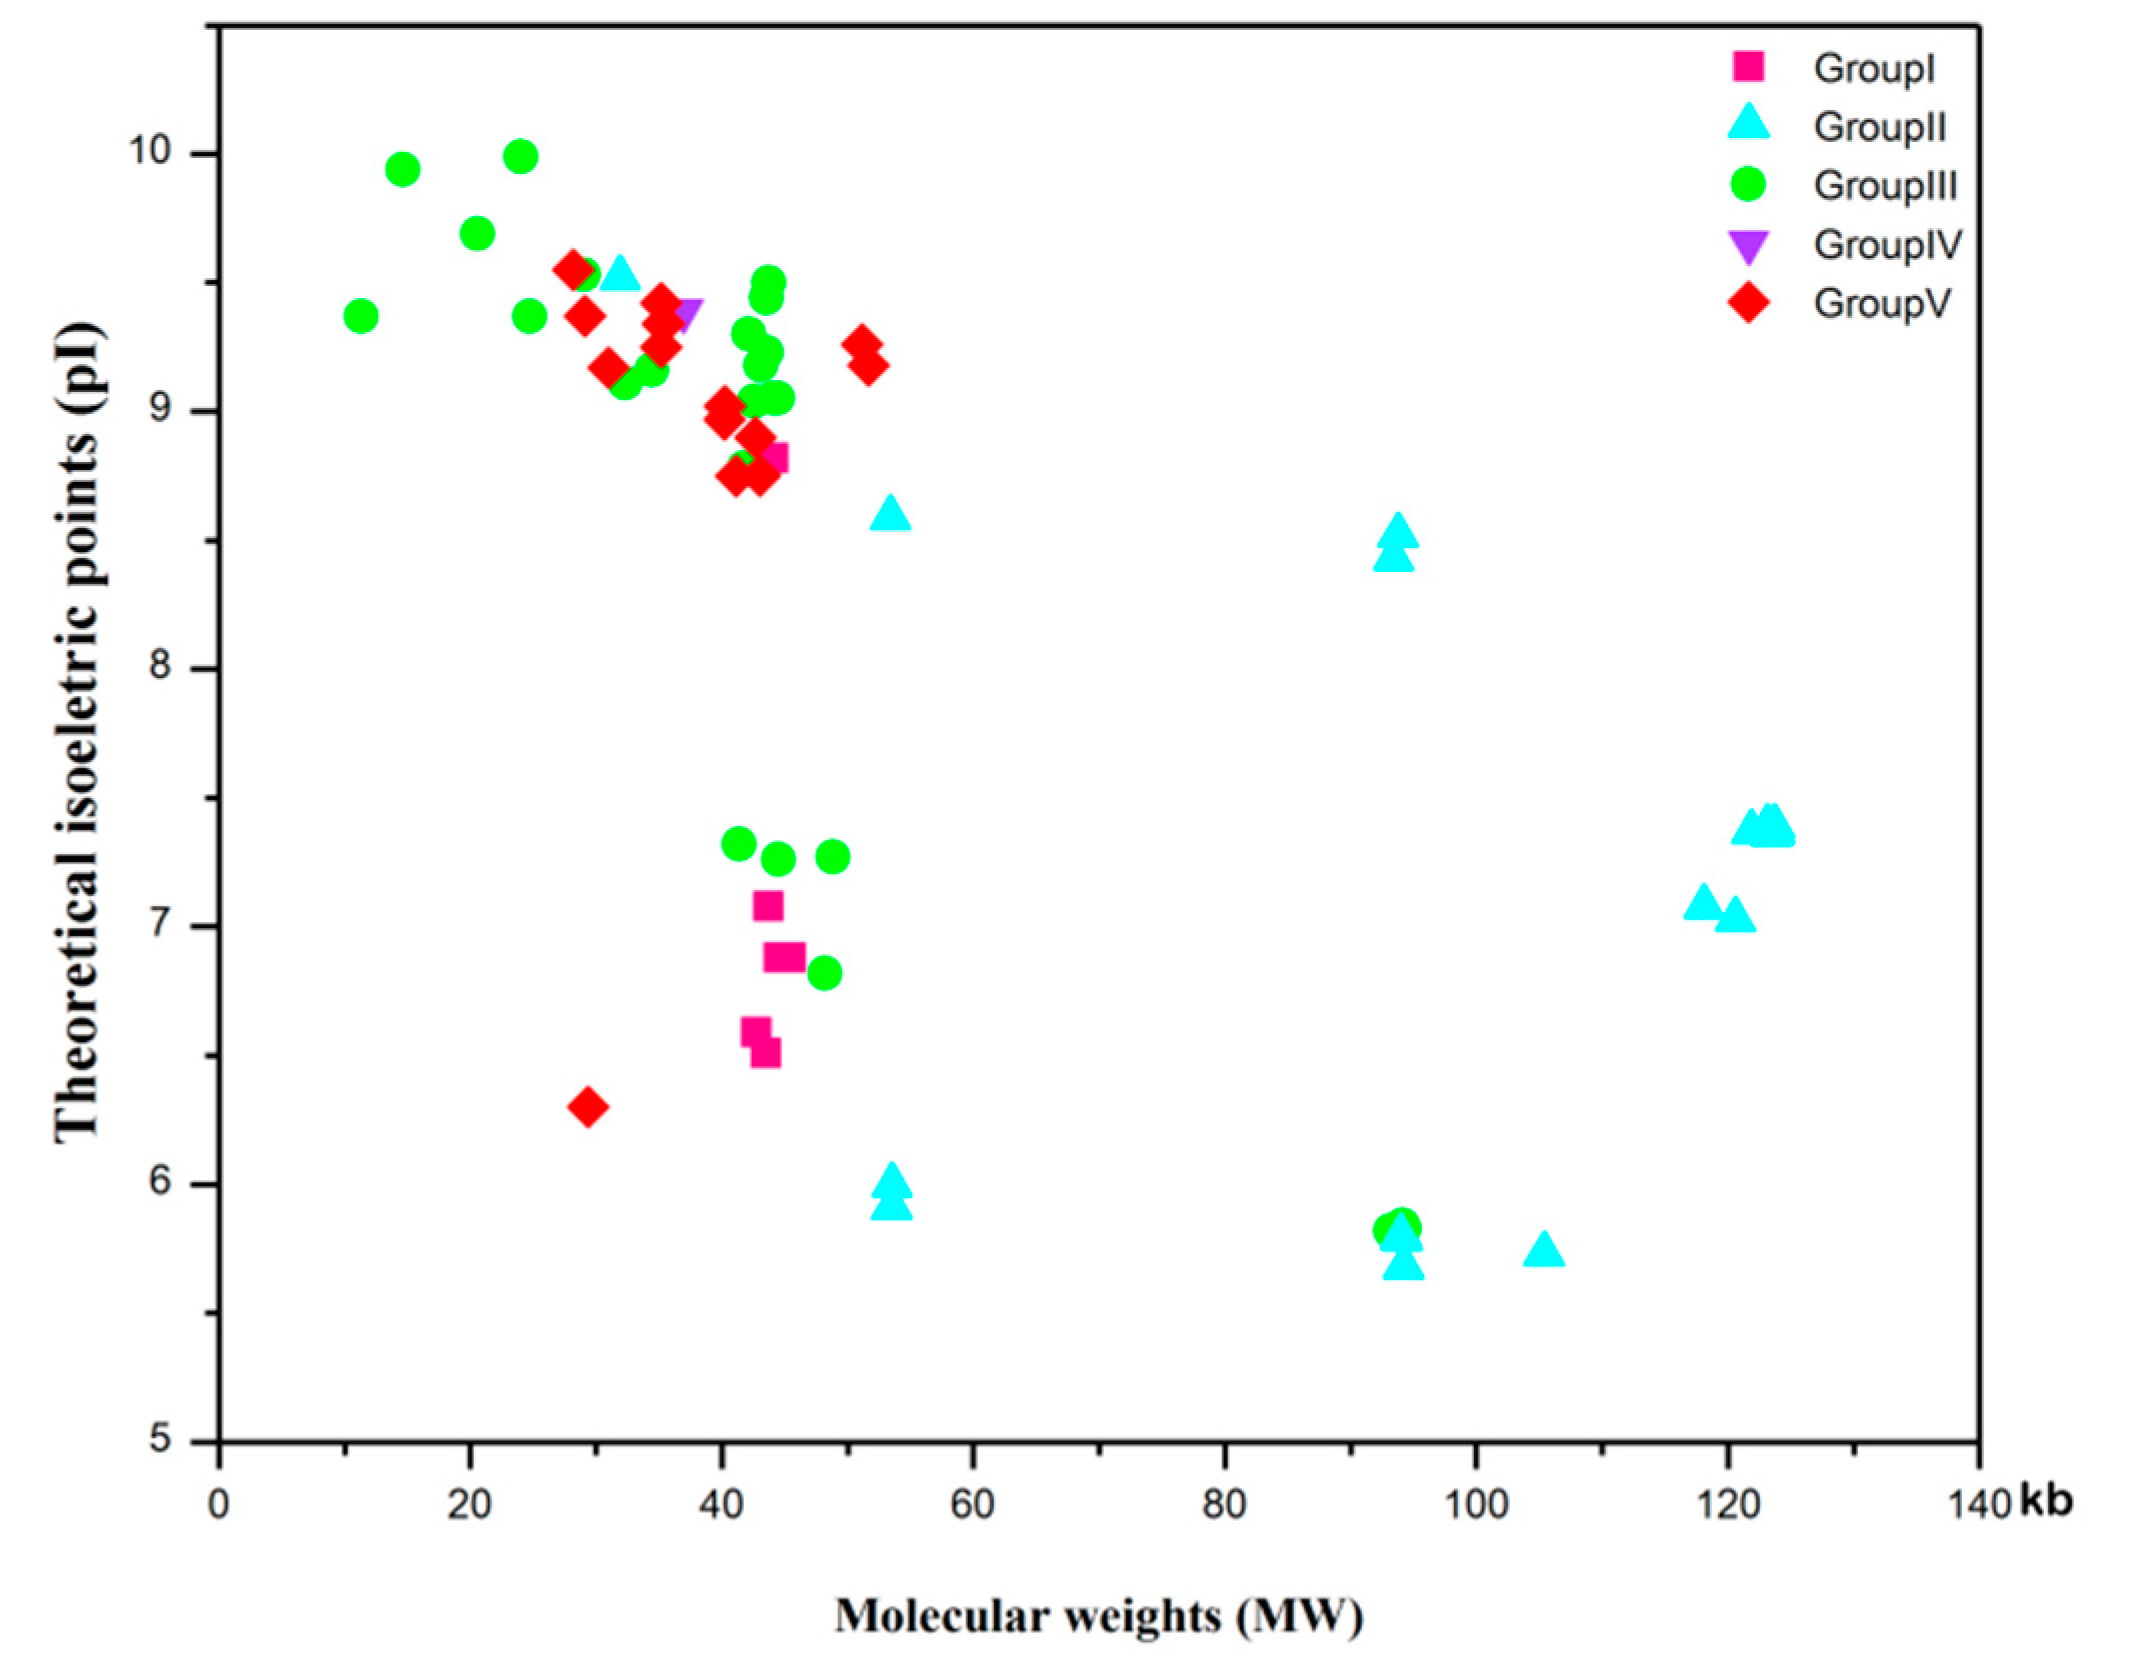
The proteins encoded by the 138 predicted full-length SBP proteins (TaSBP, 74; TuSBP, 17; TdSBP, 31; and AeSBP, 16) range from 100 (TuSBP14-ALa) to 1129 (TaSBP14-BSa, TaSBP14-DSa, and AeSBP13-DSa) amino acids (aa). The assumed molecular weights of the SBP proteins vary widely, ranging from 11.36 (TuSBP14-ALa) to 123.70 kD (TaSBP14-BSa). The maximum number of SBP proteins (107) was alkaline in nature according to their isoelectric point, which was greater than 7. However, the isoelectric point of some SBP members (31) was lower than 7, indicating that they are acidic proteins in nature. Our result show that the SBP genes encode unstable proteins because the instability index of 128 SBP proteins we identified was greater than 40. All SBP proteins were found to be hydrophilic based on their GRAVY value. Detailed information about SBP features is shown in Table S1. Then, we mapped the distribution of 138 SBP proteins with the values of RMW and theoretical pI in Figure 12. In Group I, the theoretical pI of most SBP proteins ranged from 6 to 10, and the RMW was approximately 41.69 kDa, whereas the pI of most SBP proteins in Group IV ranged from 9 to 10 with a RMW of approximately 27.09 kDa. In Group III, the theoretical pI of most SBP proteins was between 5 and 11 and the RMW was approximately 43.93 kDa. Generally, the protein characteristics of Groups I–V in wheat were distributed extensively, implying their functional diversity.
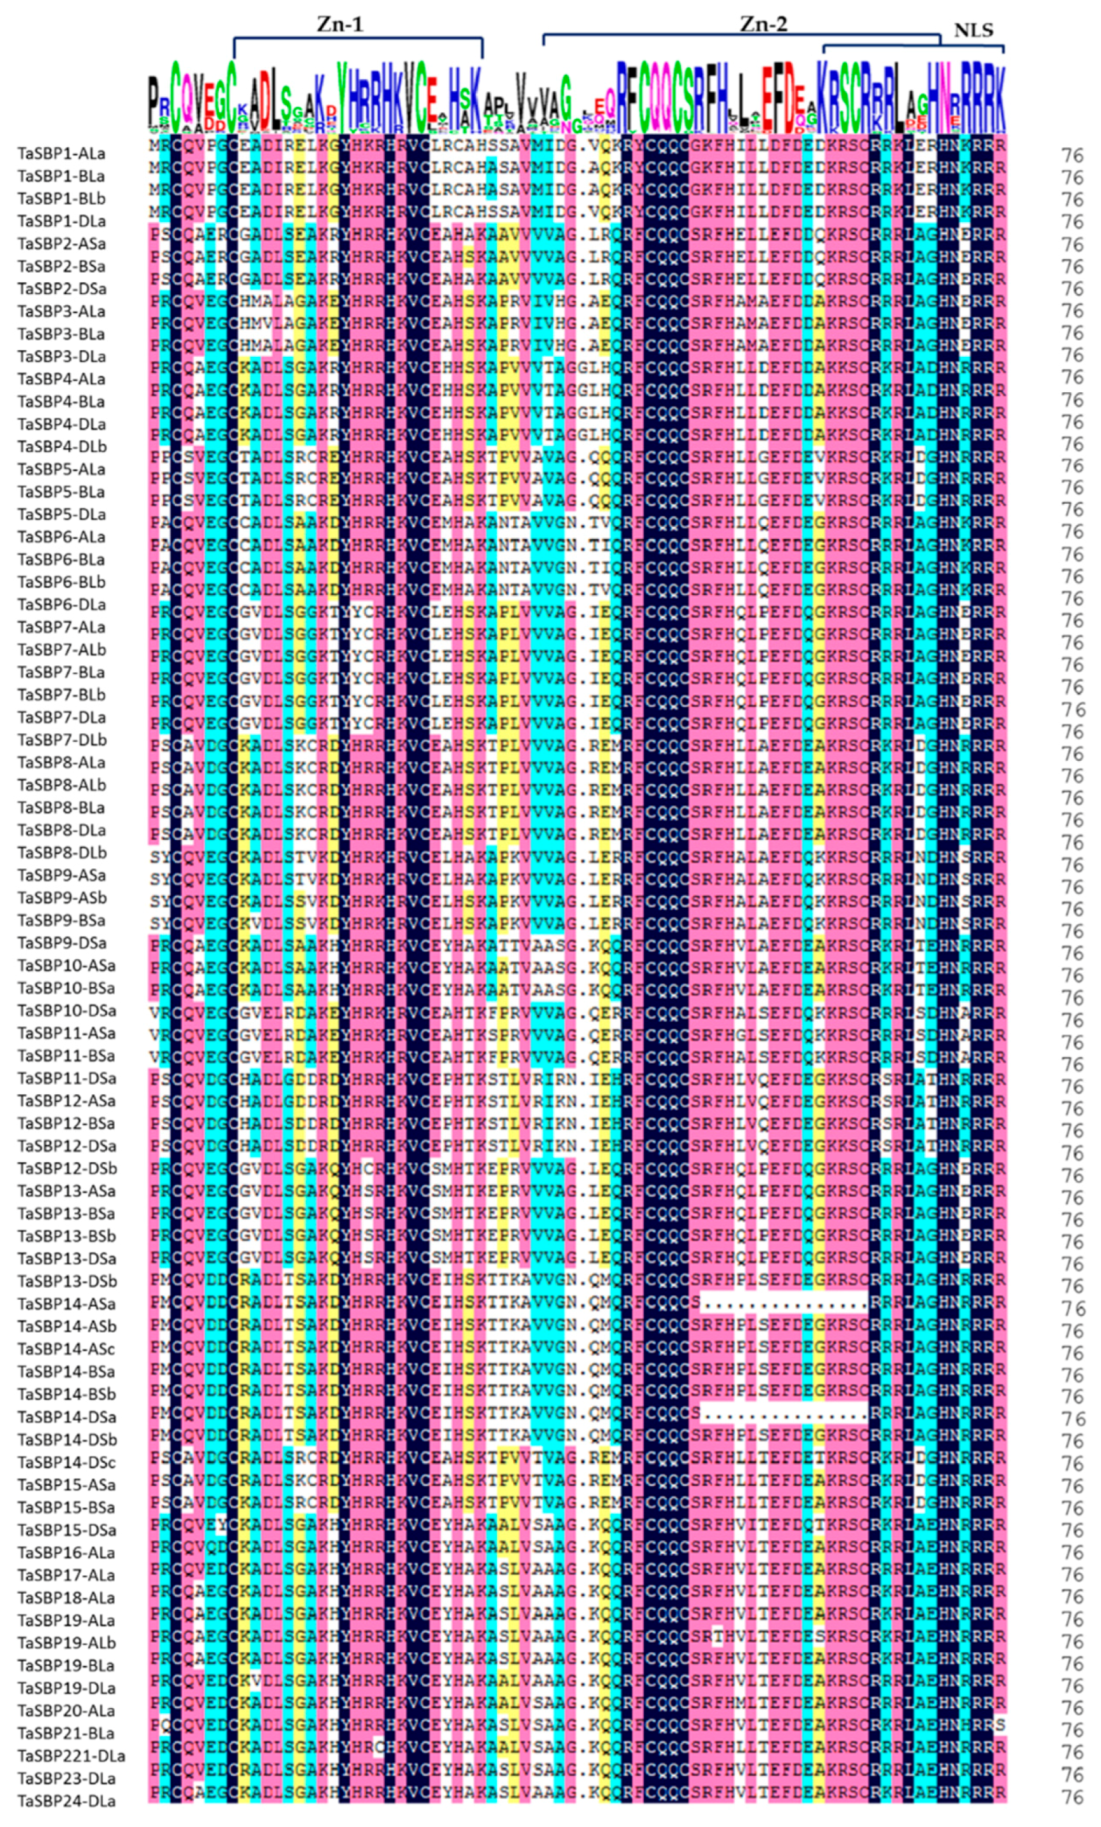
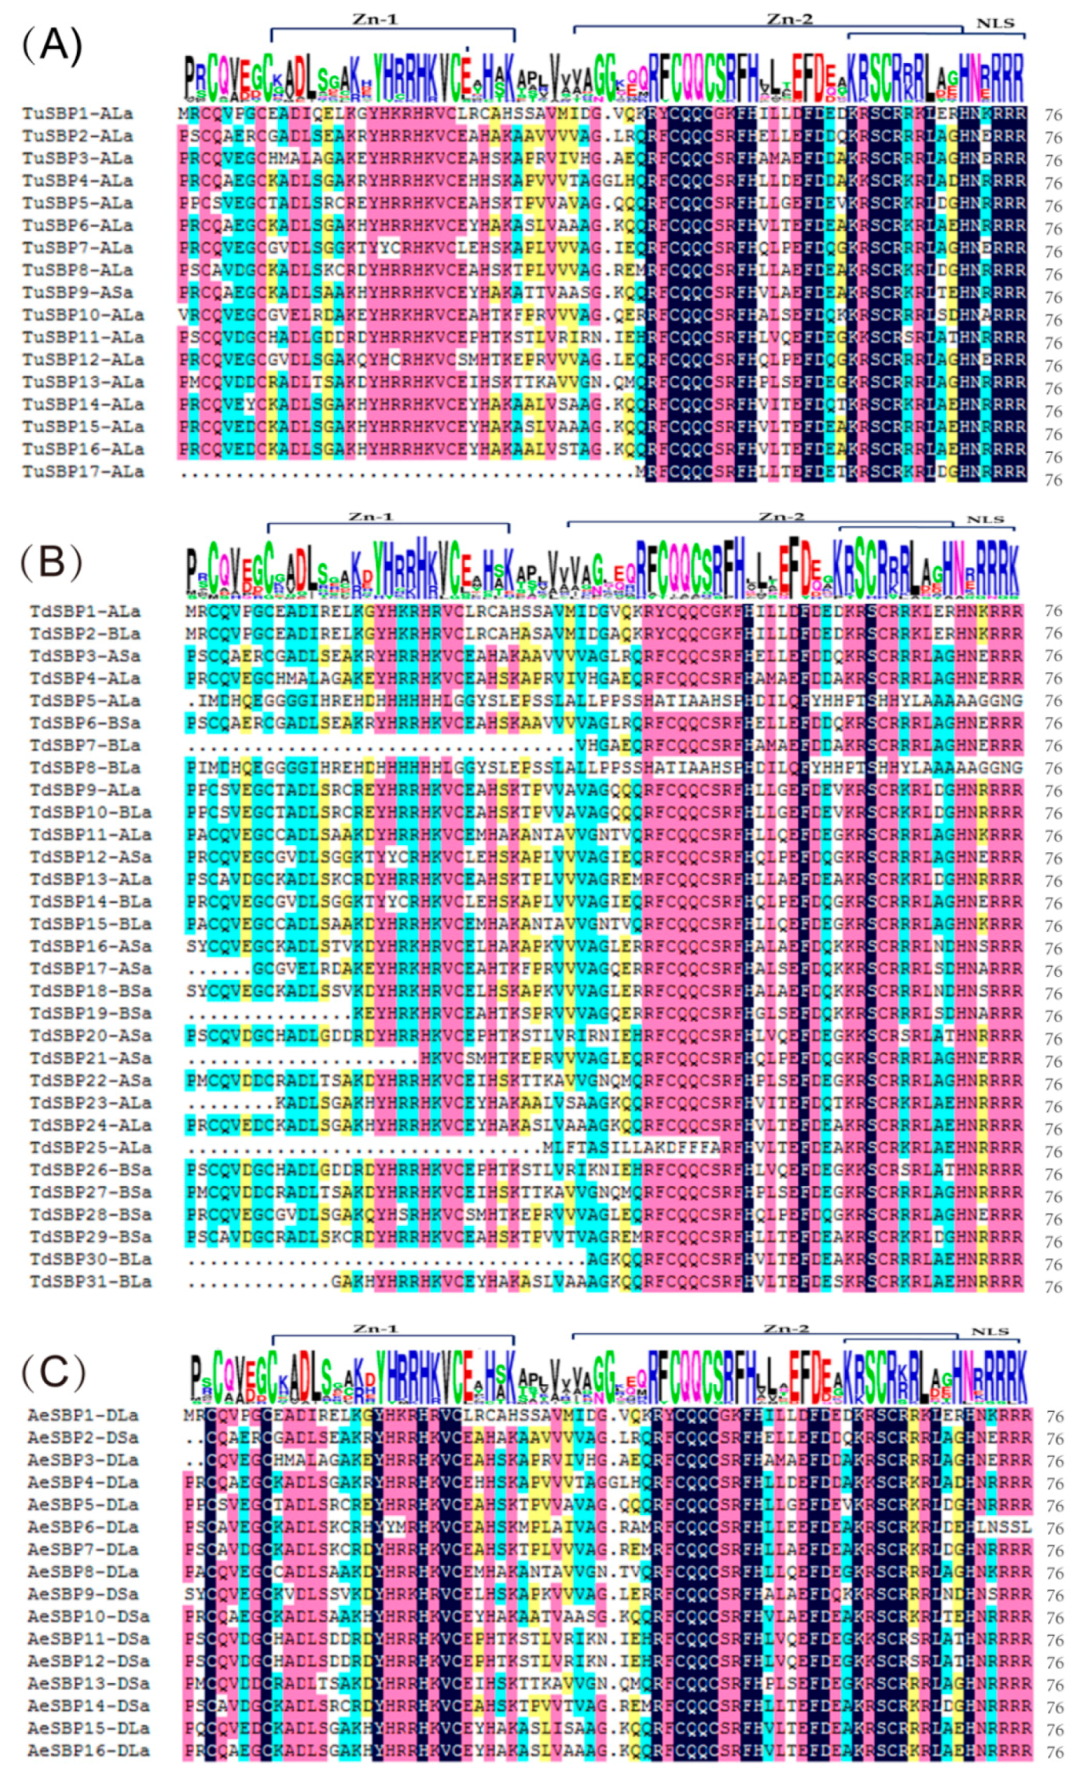
Furthermore, we compared the full length of 74 TaSBPs and analyzed the conserved domain structure (Figure 13). The results confirm that each protein contained a conserved 76-amino-acid coding region, which contained two zinc-binding sites C2HC (Cys(45)-Cys(48)-Cys(63)-His(70)) and C3H (Cys(45)-Cys(48)-Cys(63)-His(70)). In addition, one NLS structure was located at the carboxyl terminus of the SBP domain and partially overlapped the second zinc finger structure (Figure 13). Previous studies have confirmed that it plays an important role in guiding the SBP gene into the nucleus and regulating the transcriptional expression of downstream genes [9,12]. When we compared the conserved domains of TaSBP protein sequences with DNAman 6.0, we found that a few sites in the SBP domain coding region had an amino acid substitution (Figure 13). For example, in the first zinc-binding site, Cys(8)-Cys(25)-His(28)-Cys(30), His was replaced by Cys in TaSBP1-ALa, TaSBP1-BLa, TaSBP1-BLb, and TaSBP1-Dla. The other zinc-binding site in wheat SBPs is Cys(45)-Cys(48)-Cys(63)-His(70). Two proteins (TaSBP14-ASa and TaSBP14-DSa) lose His at position 63 of the amino acid sequence. In addition, we also performed a comparative analysis of the conserved domains of SBP protein in Triticum urartu, Triticum dicoccoides and Aegilops tauschii, (Figure 14). The TuSBPs sequence conservation of SBP domain was 75.94%, and the conservation of AeSBPs was 76.22%. In comparison, the conservation of the TdSBPs sequence was slightly lower, at 67.44%. In general, SBP family is relatively conservative among the four species we discussed. Previous studies have reported similar results in rice and maize [15,17]. Therefore, we speculate that the domain of SBPs was relatively conservative in monocots species.
Information on subcellular locations of proteins can provide useful insights to reveal their functions [66]. The predicted result indicates that the majority of SBP proteins we identified were localized in the nucleus (Table S1). Moreover, the 138 SBP proteins had no signal peptides distribution.

4. Discussion

SBPs are an important transcription factor family that exists only in plants and are known to regulate flower and fruit development along with other major physiological processes [2,17]. In the present study, we determined the systemic characteristics of SBP proteins by referring to the model plants to achieve a comprehensive analysis of the SBP family in wheat. In our study, 74 SBP sequences from wheat were identified, with 15 SBPs from tomato (Solanum lycopersicum L.) [16], 18 SBPs from grape [18], and 19 SBPs from rice [15]. By comparing the genome data of the 13 plants we collected, we found that there are large differences in their genome size. In fact, the number of SBP genes varied among these plant species, but do not vary proportionally along with the changes in genome size (Table S9). The discrepancy in the number of SBP genes in different plant species may be attributed to gene duplication. In our result, whole genome duplication (31 pairs), segmental duplication (29 pairs) and tandem duplication (6 pairs) events all contribute to the expansion of SBP gene family in wheat (Table S5). Furthermore, these 74 TaSBP proteins were classified into five groups according to the phylogenetic tree. The members of Groups I, IV and V had relatively lower divergence than other groups, which had a more conserved exon–intron structure than other subgroups (Figure 1). Similar results were obtained in Triticum urartu and Aegilops speltoides (Figure 1 and Table 2).
The distribution patterns of the remaining genes were different between groups, as shown in Arabidopsis [14], rice [15], and tomato [16]. The phylogenetic tree also showed coevolutionary relationships between species, and the relationship among wheat, rice, barley and maize was closer than that of Arabidopsis, grape, apple and pineapple (Figure S1). Therefore, we speculated that the common ancestors of SBPs may have evolved independently between different species during the evolution of plants from monocotyledons to dicotyledons. When the SBP genes in hexaploid wheat were compared with those of its diploid and tetraploid donors, we found that some genes were missing during polyploidization. For example, TuSBP17 and AeSBP6, we did not find their homologous genes in hexaploid wheat (Table S10). Another point is that we found no SBP gene distribution on chromosome 4B and 4D of wheat. When comparing the chromosomal map of TdSBP and AeSBP genes, we found that there is no TdSBP distribution on chromosome 4B. However, there is a distribution of AeSBP gene on chromosome 4, which is AeSBP6-DLa. We hypothesize that gene deletions on the 4D chromosome are associated with loss of genes produced by wheat during the third genome-wide doubling event [43]. In addition, there are genes that undergo duplication events during polyploidization. For instance, there are two genes on chromosome 6 in diploid (Triticum urartu) and tetraploid (Triticum dicoccoides), but a third gene TaSBP9-ASa appears on chromosome 6 in hexaploid wheat (Figure 3; Figure 4). This suggests that the process of polyploidy affects the expansion of the SBP gene family in hexaploid wheat.
To date, the shortest SBP sequence is the protein AtSPL3 (131aa) [14], and the sequence length of the SBP family varied widely during evolution. Based on our results, the length of SBPs is between 100 aa and 1129 aa, which increases the possibility of functional differentiation of the SBP family [11,15] (Figure S2). Interestingly, both AeSBP6-DLa and TuSBP1-ALa are homologous genes of TaSBP1-ALa. TuSBP1-ALa and TaSBP1-ALa have similar structural distribution patterns, but AeSBP6-DLa and TaSBP1-ALa have significantly different genetic structures (Figure 1 and Table 1 and Table 2). We hypothesized that AeSBP6-DLa may have different functions from TaSBP1-ALa, but this hypothesis needs to be verified by further experiments. Furthermore, the alignments indicated that all SBP proteins we identified contained the SBP domain. Each of them contained approximately 76 amino acids as a DNA-binding domain (DBD) [7,10]. This DBD contained two different zinc-binding sites and an NLS in the N-terminal region [74]. The first zinc-binding site is Cys-Cys-His-Cys (C2HC) and the second is Cys-Cys-Cys-His (C3H). Each zinc-binding site can combine with one Zn2+ and the binding pattern is fairly different from other zinc-binding sites found [7,75]. The predicted results of subcellular localization indicate that the presence of SBPs in wheat and its diploid and tetraploid donors is more likely to be present in the nucleus as previously reported in other species, but this result requires further validation by experiments [12,61,76].
Members from the same group may have a similar gene structure [11,18]. By comparing the exon–intron structure, we found that gene structure could reflect the phylogenetic relationship of the SBP family to some extent. For example, all members in Group I contained three exons (Figure 1). However, differences in gene structure between sequences cannot be ignored. On the one hand, we noted that the coding sequences of SBP genes we identified were interrupted by a variable number of exons, ranging from 1 to 11, and a similar situation has been reported in maize [17], Arabidopsis [14], and tomato [16]. This apparent quantitative difference may be ascribed to the expansion of SBP genes through the repeated events in evolutionary clades [37,77]. On the other hand, the amino acid coding sequences of SBP proteins are also highly variable in the length of the sequences (Table S2). In addition, we also noticed that the genetic structure of each group is conserved, but the length of introns varies greatly. This situation has also been reported in rice [15]. Therefore, we speculate that the high level of divergence in the intron sequences between TaSBP, TuSBP, TdSBP, and AeSBP genes may also indicate that some of these introns have been involved in the evolution and diversification of SBP proteins.
Because motif composition is also an important indicator to classify different genes, we then analyzed and compared the motif composition of the SBP protein sequences [49,78,79]. Corresponding to the results of conserved domain analysis, the distribution of Motifs 1 and 2 were highly conserved in all sequences, and the annotation showed that they were all zinc-binding sites (Figure 13). However, similar to the intron distribution, there were significant differences in the numbers and the configuration mode of patterns of motifs. Of all SBP sequences with three exons, motif numbers fluctuated between 5 and 20, and the SBP-box domain had no fixed position in the sequence (Figure 2). Similar results have been seen in other species, including moss [80], moso bamboo [11], and maize [17]. At the same time, we also noticed that there were similar motifs and orders of motifs in the proteins for each group. These indicated that the genes in same group might have similar functions in plant development. However, Motifs 1 and 2 have been shown to be zinc binding sites, and the functions of other motifs require further experimental verification. We also analyzed the data of TaSBP gene splice variants (Figure S2). The result shows that different splice variants of the same gene are conserved in gene structure and motif combination, which may mean that the function of the gene is also conserved.
Combined with the results of the analysis of the cis-acting elements, we found that the elements of SBPs are mainly enriched in six elements: TATA-box, CAAT-box, G-box, Sp1, ABRE, CGTCA-motif, and TGACG-motif. However, combined with the expression profile, we found that the enrichment of elements is not directly related to the functioning. For example, ABRE is the main element in response to drought stress which most enriched on genes TaSBP3-ALa, TaSBP3-BLa, TaSBP3-DLa. However, under drought stress, the expression levels of TaSBP6-ALa, TaSBP6-BLa, TaSBP6-DLa, TaSBP14-ASa, TaSBP14-BSa, and TaSBP14-DSa are much higher than those of TaSBP3-ALa, TaSBP3-BLa, and TaSBP3-DLa. This may mean that the exercise of the TaSBP gene function may be regulated by multiple elements.
In addition, SBP genes were mapped to corresponding chromosomes to determine their physical position, and we found that SBP genes were widely but not evenly distributed on chromosomes. Similar findings have been reported in other wheat transcription factor families, such as MADS [81], AP2/ERF [82], and MAPKKK [83]. The number of genes on chromosome 7 (23 genes) was the most, whereas the number of genes on chromosome 4 (1 gene) was the least in wheat. More interestingly, members of the same group were always located in similar locations in different subgenomes of the same chromosome (Figure 3). The only exception was gene TaSBP6-ALa, whose triad genes in B and D subgenome were both located on chromosome 5. Chromosome doubling events during evolution have been discussed in wheat [84,85]. In the results, we found that gene replication or loss occurred during polyploidization by comparing the distribution of SBP genes in hexaploid wheat from its diploid and tetraploid ancestors (Figure 3 and Figure S2).
Our analysis of SBP gene expression profiles in different tissues contributes to our understanding of the dynamics of gene expression in wheat. The results show that a few TaSBP genes (TaSBP6-ALa, TaSBP6-BLb and TaSBP6-DLa) had relatively high transcript accumulation in various organs, indicating they have indispensable roles in different growth stages of wheat (Figure 9). Conversely, many proportions of SBPs members displayed distinct tissue-specific expression patterns. For example, at anthesis, 18 genes (TaSBP1-ALa, TaSBP1-BLb, TaSBP1-Dla, TaSBP6-ALa, TaSBP6-BLb, TaSBP6-DLa, TaSBP9-ASa, TaSBP9-ASb, TaSBP9-BSa, TaSBP9-DSa, TaSBP11-ASa, TaSBP11-BSa, TaSBP11-DSa, TaSBP14-ASa, TaSBP14-BSa, TaSBP14-BSb, TaSBP14-DSa, and TaSBP14-DSb) were highly expressed in stigma or ovary. These tissue-specific genes may be functionally related to reproductive development. In the process of plant growth, plants are subjected to various abiotic or biological stresses, such as drought stress [4], cold stress [86], heat stress [87], and multiple biotic stresses [88]. These survival pressures will lead to the reduction of wheat yield and bring negative impact on social-economic stability [4,87]. In the present study, the expression of the TaSBP6-ALa, TaSBP6-BLb, and TaSBP6-DLa, genes were upregulated under heat stress (Figure 9). Previous studies have shown that AtSPL1 and AtSPL12 inflorescence displays hypersensitivity to heat stress. According to Figure S1, TaSBP6-ALa, TaSBP6-BLb, TaSBP6-DLa, AtSPL1 and AtSPL12 were in the same branch of the evolutionary tree, with 92.11% homology of the SBP-box domain, and are likely to have similar functions in improving plant thermotolerance [88] (Figure S3). Under drought starvation treatments, the expression of TaSBP14-DSa increased with increased treatment time, while the expression patterns of TaSBP14-BSa is completely opposite in Giza168. Moreover, the expression patterns of the TaSBP14-ASa and TaSBP14-DSa were not identical in another cultivar, Gemmiza 10. As shown in Figure 10, 18 genes were expressed by Fusarium graminearum infection both in NIL38 and NIL51 (Table S8). We speculated that these genes may be involved in plant defense mechanisms. In addition, 18 genes were widely expressed in various tissues at different growth stages, and the expression of genes TaSBP6-ALa, TaSBP6-BLb, and TaSBP6-DLa was significantly higher than others. Generally, gene TaSBP6-ALa, TaSBP6-BLb, and TaSBP6-DLa were expressed at many stages of wheat development, and responded to various environmental pressures such as heat, drought, stripe rust, and Fusarium graminearum infection. Therefore, we suggest that these three genes can be considered as candidate genes for exploring the mechanisms of wheat development and stress regulation. Additionally, our study illustrates the convenience of transcriptome data analysis for screening in the early stage of the experiment. Based on this, we can screen appropriate candidate genes for functional verification and mechanism analysis.

5. Conclusions

In this study, we systematically identified and classified the SBP gene families in wheat and its diploid and tetraploid donors, including phylogenetic relationships, evolutionary patterns, and exon/intron structure analysis. In total, 74 TaSBP proteins were obtained and were classified into Groups I–V after systematic investigations. These proteins were transcribed from 56 genes, 35 of which are target genes for miRNA156. Seventeen TuSBP and 16 AeSBP proteins were disturbed on seven chromosomes. Thirty-one TdSBP proteins were disturbed on 13 of 14 chromosomes. The results of cis-acting elements analysis show that the SBP genes were enriched on CAAT-box and TATA-box elements upstream of the sequences. In diploid and tetraploid donors, 5 TuSBPs, 14 TdSBPs and 9 AeSBPs are the target genes of miRNA156. Interestingly, none of the members of Group III were miRNA156′s target genes. Concurrently, the SBP-box domain is highly conserved in TaSBPs. WGD, tandem and segmental duplications contributed to the expansion of the SBP gene family. The wheat SBP genes were involved in crucial processes, including some stages of plant growth and defensive responses to some abiotic and biotic stresses. These data bring new insight to the control of TaSBP gene expression at the transcriptional level, which provides new clues for further functional characterization of SBP genes and genetic improvement of wheat.

Supplementary Materials

The following are available online at https://www.mdpi.com/2073-4395/9/9/527/s1, Figure S1. Phylogenetic analysis of SBP family in wheat and nine other reference plant species. The maximum-likelihood tree was built using MEGA 7.0 with 1000 bootstraps. The five different subfamilies were indicated by different colors; Figure S2. Comparative analysis of the phylogenetics, exon–intron structure, and conserved motifs of SBP family in wheat. (A) The phylogenetic tree of 74 TaSBP proteins were constructed by using MEGA 7.0. (B) GSDS2.0 software was employed to generate the gene structure of 74 SBP proteins from Hexaploid wheat. The green boxes are CDS, the black lines are introns and the yellow boxes are 5′Untranslated regions (UTRs) or 3′UTR. (C) Motif composition models of 74 SBP proteins. Different motifs are color-coded. The gene order in (B,C) is similar to that in (A); Figure. S3. Sequence alignment of SBP conservative domain of TaSBPA6, TaSBPB6.2, TaSBPD6, AtSPL1 and AtSPL12. The conservativeness of amino acid sites in the sequence is distinguished by different colors. Black represents 100% conservativeness, purple represents ≥ 75% conservativeness, and blue represents ≥ 50% conservativeness; Table S1. Information of SBP proteins identified in this study.; Table S2. List of 1:1:1 High Confidence syntenic triads identified in this study; Table S3. General information of SBP-box genes selected for phylogenetic analysis of Figure S1; Table S4. Annotation of putative of TaSBP proteins identified by MEME; Table S5. Homologous gene pairs of TaSBP genes; Table S6. Prediction results about cis-acting elements by PlantCARE analysis; Table S7. Detailed information on predicted Cis-Acting Elements; Table S8. Metadata for RNA-Seq samples. Details for each sample including variety, tissue, age, stress conditions and original publication; Table S9. The genome size of the 10 species used in the establishment of the tree is shown in Figure S1; Table S10. Homologous gene pairs between wheat and its diploid and tetraploid ancestors.

Author Contributions

C.G. and Y.L. guided the design of the experiment. D.M. and J.Y. directed the data analysis. J.S. conducted data analysis and manuscript writing. L.Y., Y.H. and G.Z. contributed to the data analysis. Z.Z., H.T. and L.C. supervised the experiment and confirmed the manuscript. C.G. and Y.L. are the guarantors of this work, thus they have full access to all the data in the research and are responsible for the integrity of the data and the accuracy of the data analysis. All authors read and approved the final manuscript.

Funding

This work was supported by the National Key R&D Program of China (2018YFD0200500, 2017YFD0100802) and Open Project Program of Engineering Research Center of Ecology and Agricultural Use of Wetland, Ministry of Education (KF201802).

Acknowledgments

The authors thank the reviewers for their valuable suggestions during the revision of the early manuscripts.

Conflicts of Interest

The authors declare no conflict of interest.

References

  1. Ilhan, E.; Büyük, I.; Inal, B. Transcriptome-Scale characterization of salt responsive bean TCP transcription factors. Gene 2018, 642, 64–73. [Google Scholar] [CrossRef] [PubMed]
  2. Shu, K.; Zhou, W.G.; Yang, W.Y. APETALA 2-domain-containing transcription factors: Focusing on abscisic acid and gibberellins antagonism. New Phytol. 2018, 217, 977–983. [Google Scholar] [CrossRef] [PubMed]
  3. Fu, F.F.; Xue, H.W. Coexpression Analysis Identifies Rice Starch Regulator1, a Rice AP2/EREBP Family Transcription Factor, as a Novel Rice Starch Biosynthesis Regulator. Plant Physiol. 2010, 154, 927–938. [Google Scholar] [CrossRef] [PubMed]
  4. Chen, T.; Li, W.; Hu, X.; Guo, J.; Liu, A.; Zhang, B. A cotton MYB transcription factor, GbMYB5, is positively involved in plant adaptive response to drought stress. Plant Cell Physiol. 2015, 56, 917–929. [Google Scholar] [CrossRef] [PubMed]
  5. Heck, C.; Kuhn, H.; Heidt, S.; Walter, S.; Rieger, N.; Requena, N. Symbiotic Fungi Control Plant Root Cortex Development through the Novel GRAS Transcription Factor MIG1. Curr. Biol. 2016, 26, 2770–2778. [Google Scholar] [CrossRef] [PubMed] [Green Version]
  6. An, J.P.; Qu, F.J.; Yao, J.F.; Wang, X.N.; You, C.X.; Wang, X.F.; Hao, Y.J. The bZIP transcription factor MdHY5 regulates anthocyanin accumulation and nitrate assimilation in apple. Hortic. Res. 2017, 4, 17023. [Google Scholar] [CrossRef] [PubMed]
  7. Yamasaki, K.; Kigawa, T.; Inoue, M.; Tateno, M.; Yamasaki, T.; Yabuki, T.; Aoki, M.; Seki, E.; Matsuda, T.; Nunokawa, E.; et al. A novel zinc-binding motif revealed by solution structures of DNA-binding domains of Arabidopsis SBP-family transcription factors. J. Mol. Biol. 2004, 337, 49–63. [Google Scholar] [CrossRef]
  8. Klein, J.; Saedler, H.; Huijser, P. A new family of DNA binding proteins includes putative transcriptional regulators of the Antirrhinum majus floral meristem identity gene squamos. Mol. Gen. Genet. 1996, 250, 7–16. [Google Scholar] [CrossRef]
  9. Song, A.; Gao, T.W.; Wu, D.; Xin, J.J.; Chen, S.; Guan, Z.Y.; Wang, H.B.; Jin, L.L.; Chen, F.D. Transcriptome-wide identification and expression analysis of chrysanthemum SBP-like transcription factors. Plant Physiol. Biochem. 2016, 102, 10–16. [Google Scholar] [CrossRef]
  10. Birkenbihl, R.P.; Jach, G.; Saedler, H.; Huijser, P. Functional dissection of the plant-specific SBP-domain: Overlap of the DNA-binding and nuclear localization domains. J. Mol. Biol. 2005, 352, 585–596. [Google Scholar] [CrossRef]
  11. Feng, P.; Wang, Y.; Liu, H.L.; Wu, M.; Chu, W.Y.; Chen, D.M.; Yan, X. Genome-wide identification and expression analysis of SBP-like transcription factor genes in Moso Bamboo (Phyllostachys edulis). BMC Genom. 2017, 18, 486. [Google Scholar] [CrossRef]
  12. Harreman, M.T.; Kline, T.M.; Milford, H.G.; Harben, M.B.; Hodel, A.E.; Corbett, A.H. Regulation of nuclear import by phosphorylation adjacent to nuclear localization signals. J. Biol. Chem. 2004, 279, 20613–20621. [Google Scholar] [CrossRef] [PubMed]
  13. Huijser, P.; Klein, J.; Lönnig, W.E.; Meijer, H.; Saedler, H.; Sommer, H. Bracteomania, an inflorescence anomaly, is caused by the loss of function of the MADS-box gene squamosa in Antirrhinum majus. Embo J. 1992, 11, 1239–1249. [Google Scholar] [CrossRef]
  14. Cardon, G.; Höhmann, S.; Klein, J.; Nettesheim, K.; Saedler, H.; Huijser, P. Molecular characterisation of the Arabidopsis SBP-box genes. Gene. 1999, 237, 91. [Google Scholar] [CrossRef]
  15. Xie, K. Genomic organization, differential expression, and interaction of SQUAMOSA promoter-binding-like transcription factors and microrna156 in rice. Plant Physiol. 2006, 142, 280–293. [Google Scholar] [CrossRef] [PubMed]
  16. María, S.; Xing, S.; H?Hmann, S.; Berndtgen, R.; Huijser, P. Genomic organization, phylogenetic comparison and differential expression of the SBP-box family of transcription factors in tomato. Planta 2012, 235, 1171–1184. [Google Scholar] [CrossRef]
  17. Mao, H.D.; Yu, L.J.; Li, Z.J.; Yan, Y.; Han, R.; Liu, H.; Ma, M. Genome-wide analysis of the SPL family transcription factors and their responses to abiotic stresses in maize. Plant Gene 2016, 6, 1–12. [Google Scholar] [CrossRef] [Green Version]
  18. Hongmin, H.; Jun, L.; Min, G.; Singer, S.D.; Hao, W.; Linyong, M. Genomic Organization, Phylogenetic Comparison and Differential Expression of the SBP-Box Family Genes in Grape. PLoS ONE 2013, 8, e59358. [Google Scholar] [CrossRef]
  19. Zhang, X.; Dou, L.; Pang, C.; Song, M.; Wei, H.; Fan, S.; Wang, C.; Yu, S. Genomic organization, differential expression, and functional analysis of the SPL gene family in Gossypium hirsutum. Mol. Genet. Genom. MGG 2015, 290, 115–126. [Google Scholar] [CrossRef]
  20. Jiao, Y.; Wang, Y.; Xue, D.; Wang, J.; Yan, M.; Liu, G.; Dong, G.; Zeng, D.; Lu, Z.; Zhu, X.; et al. Regulation of OsSPL14 by OsmiR156 defines ideal plant architecture in rice. Nat. Genet. 2010, 42, 541–544. [Google Scholar] [CrossRef]
  21. Jung, J.H.; Ju, Y.; Seo, P.J.; Lee, J.H.; Park, C.M. The SOC1-SPL module integrates photoperiod and gibberellic acid signals to control flowering time in Arabidopsis. Plant J. 2012, 69, 577–588. [Google Scholar] [CrossRef] [PubMed]
  22. Wang, Y.; Hu, Z.L.; Yang, Y.X.; Chen, X.Q.; Chen, G.P. Function annotation of an SBP-box gene in Arabidopsis based on analysis of co-expression networks and promoters. Int. J. Mol. Sci. 2009, 10, 116–132. [Google Scholar] [CrossRef] [PubMed]
  23. Kim, J.J.; Lee, J.H.; Kim, W.; Jung, H.S.; Huijser, P.; Ahn, J.H. The microRNA156-SQUAMOSA PROMOTER BINDING PROTEIN-LIKE3 module regulates ambient temperature-responsive flowering via FLOWERING LOCUS T in Arabidopsis. Plant Physiol. 2012, 159, 461–478. [Google Scholar] [CrossRef] [PubMed]
  24. Yamasaki, K.; Hagiwara, H. Excess iron inhibits osteoblast metabolism. Toxicol. Lett. 2009, 191, 211–215. [Google Scholar] [CrossRef] [PubMed]
  25. Stone, J.M.; Liang, X.; Nekl, E.R.; Stiers, J.J. Arabidopsis AtSPL14, a plant-specific SBP-domain transcription factor, participates in plant development and sensitivity to fumonisin B1. Plant J. 2010, 41, 744–754. [Google Scholar] [CrossRef] [PubMed]
  26. Lan, T.; Zhang, S.; Liu, T.; Wang, B.; Guan, H.; Zhou, Y.; Duan, Y.; Wu, W. Fine mapping and candidate identification of SST, a gene controlling seedling salt tolerance in rice (Oryza sativa L.). Euphytica 2015, 205, 269–274. [Google Scholar] [CrossRef]
  27. Jung, J.H.; Lee, H.J.; Ryu, J.Y.; Park, C.M. SPL3/4/5 Integrate Developmental Aging and Photoperiodic Signals into the FT-FD Module in Arabidopsis Flowering. Mol. Plant. 2016, 9, 1647–1659. [Google Scholar] [CrossRef] [Green Version]
  28. Ma, Y.; Chen, X.L.; Zhang, H.X.; Tu, Y. Cloning and Expression Analysis of Transcription Factor CmSBP11 in melon. Genom. Appl. Biol. 2018, 37, 345–349. [Google Scholar] [CrossRef]
  29. Miura, K.; Ikeda, M.; Matsubara, A.; Song, X.J.; Ito, M.; Asano, K.; Matsuoka, M.; Kitano, H.; Ashikari, M. OsSPL14 promotes panicle branching and higher grain productivity in rice. Nat. Genet. 2010, 6, 545–549. [Google Scholar] [CrossRef]
  30. Kim, S.R.; Ramos, J.M.; Hizon, R.J.M.; Ashikari, M.; Virk, P.S.; Torres, E.A.; Nissila, E.; Jena, K.K. Introgression of a functional epigenetic OsSPL14WFP allele into elite indica rice genomes greatly improved panicle traits and grain yield. Sci. Rep. 2018, 8, 3833. [Google Scholar] [CrossRef]
  31. Yin, J.L.; Fang, Z.W.; Sun, C.; Zhang, P.; Zhang, X.; Lu, C.; Wang, S.P.; Ma, D.F.; Zhu, Y.X. Rapid identification of a stripe rust resistant gene in a space-induced wheat mutant using specific locus amplified fragment (SLAF) sequencing. Sci. Rep. 2018, 8, 3086. [Google Scholar] [CrossRef] [PubMed]
  32. Wang, B.; Wei, J.; Song, N.; Wang, N.; Zhao, J.; Kang, Z. A novel wheat NAC transcription factor, TaNAC30, negatively regulates resistance of wheat to stripe rust. J. Integr. Plant Biol. 2018, 60, 432–443. [Google Scholar] [CrossRef] [PubMed]
  33. Schwessinger, B. Fundamental wheat stripe rust research in the 21st century. New Phytol. 2017, 213, 1625–1631. [Google Scholar] [CrossRef] [PubMed]
  34. Zhang, T.; Xu, K.; Liu, S.; Ya, J.; Su, F. Cloning, Tissue-specific Expression and Prokaryotic Expression Analysis of TaSPL17 Gene in Wheat(Triticum aestivum). Acta Agric. Boreal-Occident. Sin. 2015, 6, 1004–1389. [Google Scholar] [CrossRef]
  35. Zhang, B.; Xu, W.; Liu, X.; Mao, X.; Li, A.; Wang, J.; Chang, X.; Zhang, X.; Jing, R. Functional Conservation and Divergence among Homoeologs of TaSPL20 and TaSPL21, Two SBP-Box Genes Governing Yield-Related Traits in Hexaploid Wheat. Plant Physiol. 2017, 19, 1177–1191. [Google Scholar] [CrossRef] [PubMed]
  36. Liu, J.; Cheng, X.; Liu, P.; Sun, J. miR156-Targeted SBP-Box Transcription Factors Interact with DWARF53 to Regulate TEOSINTE BRANCHED1 and BARREN STALK1 Expression in Bread Wheat. Plant Physiol. 2017, 174, 1931–1948. [Google Scholar] [CrossRef] [PubMed]
  37. Guo, A.Y.; Zhu, Q.H.; Gu, X.; Ge, S.; Yang, J.; Luo, J. Genome-wide identification and evolutionary analysis of the plant specific SBP-box transcription factor family. Gene 2008, 418, 1–8. [Google Scholar] [CrossRef]
  38. Abdullah, M.; Cao, Y.; Cheng, X.; Shakoor, A.; Su, X.; Gao, J.; Cai, Y. Genome-Wide Analysis Characterization and Evolution of SBP Genes in Fragaria vesca, Pyrus bretschneideri, Prunus persica and Prunus mume. Front. Genet. 2018, 9, 1–12. [Google Scholar] [CrossRef]
  39. Wang, B.N.; Geng, S.F.; Wang, D.; Feng, N.; Zhang, D.D.; Wu, L.; Hao, C.Y.; Zhang, X.Y.; Li, A.L.; Long, M. Characterization of Squamosa Promoter Binding Protein-LIKE Genes in Wheat. J. Plant Biol. 2015, 58, 220–229. [Google Scholar] [CrossRef]
  40. István, M.; Marie, K.; Hana, Š.; András, F.; András, C.; Mária, M.; Jan, V.; Márta, M.L.; Jaroslav, D. Flow cytometric chromosome sorting from diploid progenitors of bread wheat, T. urartu, Ae. speltoides and Ae. Tauschii. Theor. Appl. Genet. 2014, 127, 1091–1104. [Google Scholar] [CrossRef]
  41. Dvorák, J.; Terlizzi, P.D.; Zhang, H.B.; Resta, P. The evolution of polyploid wheat: Identification of the A genome donor species. Genome 1993, 36, 21–31. [Google Scholar] [CrossRef]
  42. Maestra, B.; Naranjo, T. Homoeologous relationships of Aegilops speltoides chromosomes to bread wheat. Theoret. Appl. Genet. 1998, 97, 181–186. [Google Scholar] [CrossRef]
  43. Avni, R.; Nave, M.; Barad, O.; Baruch, K.; Twardziok, S.O.; Gundlach, H.; Hale, I.; Mascher, M.; Spannagl, M.; Wiebe, K.; et al. Wild emmer genome architecture and diversity elucidate wheat evolution and domestication. Science 2017, 357, 93–97. [Google Scholar] [CrossRef] [PubMed] [Green Version]
  44. Altschul, S.F.; Madden, T.L.; Schäffer, A.A.; Zhang, J.; Zhang, Z.; Miller, W.; Lipman, D.J. Gapped BLAST and PSI-BLAST: A new generation of protein database search programs. Nucleic Acids Res. 1997, 25, 3389–3402. [Google Scholar] [CrossRef] [PubMed]
  45. Finn, R.D.; Mistry, J.; Schuster-Bockler, B.; Griffiths-Jones, S.; Hollich, V.; Lassmann, T.; Moxon, S.; Marshall, M.; Khanna, A.; Durbin, R.; et al. Pfam: Clans, web tools and services. Nucleic Acids Res. 2006, 34, 247–251. [Google Scholar] [CrossRef] [PubMed]
  46. Letunic, I.; Copley, R.R.; Schmidt, S.; Ciccarelli, F.D.; Doerks, T.; Schultz, J.; Ponting, C.P.; Bork, P. SMART 4.0: Towards genomic data integration. Nucleic Acids Res. 2004, 32, 142–144. [Google Scholar] [CrossRef] [PubMed]
  47. Quevillon, E.; Silventoinen, V.; Pillai, S.; Harte, N.; Mulder, N.; Apweiler, R.; Lopez, R. InterProScan: Protein domains identifier. Nucleic Acids Res. 2005, 33, 116–120. [Google Scholar] [CrossRef] [PubMed]
  48. Oliver, T.; Schmidt, B.; Nathan, D.; Clemens, R.; Maskell, D. Using reconfigurable hardware to accelerate multiple sequence alignment with clustalw. Bioinformatics 2005, 21, 3431–3432. [Google Scholar] [CrossRef]
  49. Kumar, S.; Stecher, G.; Tamura, K. MEGA7: Molecular Evolutionary Genetics Analysis version 7.0 for bigger datasets. Mol. Biol. Evol. 2016, 33, 1870–1874. [Google Scholar] [CrossRef]
  50. Letunic, I.; Bork, P. Interactive tree of life (iTOL) v3: An online tool for the display and annotation of phylogenetic and other trees. Nucleic Acids Res. 2016, 44, 242–245. [Google Scholar] [CrossRef]
  51. Hu, B.; Jin, J.; Guo, A.Y.; Zhang, H.; Luo, J.; Gao, G. GSDS 2.0: An upgraded gene feature visualization server. Bioinformatics 2015, 31, 1296–1297. [Google Scholar] [CrossRef] [PubMed]
  52. Bailey, T.L.; Williams, N.; Misleh, C.; Li, W.W. MEME: Discovering and analyzing DNA and protein sequence motifs. Nucleic Acids Res. 2006, 34, 369–373. [Google Scholar] [CrossRef] [PubMed]
  53. Chen, C.J.; Xia, R.; Chen, H.; He, Y.H. TBtools, a Toolkit for Biologists integrating various HTS-data handling tools with a user-friendly interface. Biorxiv 2018. [Google Scholar] [CrossRef]
  54. Wang, G.; Wang, T.; Jia, Z.H.; Xuan, J.P.; Pan, D.L.; Guo, Z.R.; Zhang, J.Y. Genome-Wide Bioinformatics Analysis of MAPK Gene Family in Kiwifruit (Actinidia Chinensis). Int. J. Mol. Sci. 2018, 19, 2510. [Google Scholar] [CrossRef] [PubMed]
  55. Gu, Z.; Cavalcanti, A.; Chen, F.C.; Bouman, P.; Li, W.H. Extent of Gene Duplication in the Genomes of Drosophila, Nematode, and Yeast. Mol. Biol. Evol. 2002, 19, 256–262. [Google Scholar] [CrossRef] [PubMed] [Green Version]
  56. Wang, Y.; Tang, H.; Debarry, J.D.; Tan, X.; Li, J.; Wang, X. MCScanX: A toolkit for detection and evolutionary analysis of gene synteny and collinearity. Nucleic Acids Res. 2012, 40, 49. [Google Scholar] [CrossRef] [PubMed]
  57. Gu, Z.; Gu, L.; Eils, R.; Schlesner, M.; Brors, B. circlize implements and enhances circular visualization in R. Genome Anal. 2014, 30, 2811–2812. [Google Scholar] [CrossRef] [PubMed] [Green Version]
  58. Rozas, J. DNA sequence polymorphism analysis using DnaSP. Methods Mol. Biol. 2009, 537, 337–350. [Google Scholar] [CrossRef] [PubMed]
  59. Lescot, M.; Déhais, P.; Thijs, G.; Marchal, K.; Moreau, Y.; Van de Peer, Y.; Rouzé, P.; Rombauts, S. PlantCARE, a database of plant cis-acting regulatory elements and a portal to tools for in silico analysis of promoter sequences. Nucleic Acids Res. 2002, 30, 325–327. [Google Scholar] [CrossRef]
  60. Dai, X.; Zhao, P.X. psRNATarget: A plant small RNA target analysis server. Nucleic Acids Res. 2011, 39, 155–159. [Google Scholar] [CrossRef] [PubMed]
  61. Yin, J.L.; Liu, M.Y.; Ma, D.F.; Wu, J.W.; Lia, S.L.; Zhua, Y.X.; Han, B. Identification of circular RNAs and their targets during tomato fruit ripening. Postharvest Biol. Technol. 2018, 136, 90–98. [Google Scholar] [CrossRef]
  62. Trapnel, C.; Roberts, A.; Goff, L.; Pertea, G.; Kim, D.; Kelley, D.R.; Pimentel, H.; Salzberg, S.L.; Rinn, J.L.; Pachter, L. Differential gene and transcript expression analysis of RNA-seq experiments with TopHat and Cufflinks. Nat. Protoc. 2012, 7, 562–578. [Google Scholar] [CrossRef] [PubMed] [Green Version]
  63. Denise, M.; Timothy, W.H.; Han, S.J.; Michael, Y.G.; Arielle, G.Z.; Allyson, L.B.; Oliver, J.H.; Alexandra, M.O.; Mariam, Q.; Giorgio, T.; et al. Microbiota-dependent sequelae of acute infection compromise tissue-specific immunity. Cell 2015, 163, 354–366. [Google Scholar] [CrossRef]
  64. Wilkins, M.R.; Gasteiger, E.; Bairoch, A.; Sanchez, J.; Williams, K.L.; Appel, R.D.; Hochstrasser, D.F. Protein Identification and Analysis Tools in the ExPASy Server. Methods Mol. Biol. 1999, 112, 531–552. [Google Scholar] [CrossRef] [PubMed]
  65. Chou, K.C.; Shen, H.B. Plant-mPLoc: A Top-Down Strategy to Augment the Power for Predicting Plant Protein Subcellular Localization. PLoS ONE 2010, 5, e11335. [Google Scholar] [CrossRef] [PubMed]
  66. Horton, P.; Park, K.J.; Obayashi, T.; Nakai, K. Protein subcellular localization prediction with WoLF PSORT. Asian Pac. Bioinform. Conf. 2006, 39–48. [Google Scholar] [CrossRef]
  67. Petersen, T.N.; Brunak, S.; Heijne, G.V.; Nielsen, H. SignalP 4.0: Discriminating signal peptides from transmembrane regions. Nat. Methods 2011, 8, 785–786. [Google Scholar] [CrossRef] [PubMed]
  68. Ramírez-González, R.H.; Borrill, P.; Lang, D.; Harrington, S.A.; Brinton, J.; Venturini, L.; Davey, M.; Jacobs, J.; van Ex, F.; Pasha, A.; et al. The transcriptional landscape of polyploid wheat. Science 2018, 361, 662. [Google Scholar] [CrossRef]
  69. Feldman, M.; Levy, A.A. Allopolyploidy-a shaping force in the evolution of wheat genomes. Cytogenet Genome Res. 2005, 109, 250–258. [Google Scholar] [CrossRef]
  70. Griffiths-Jones, S.; Saini, H.K.; van Dongen, S.; Enright, A.J. miRBase: Tools for microRNA genomics. Nucleic Acids Res. 2008, 36, D154. [Google Scholar] [CrossRef]
  71. Zhu, Y.; Yang, L.; Liu, N.; Yang, J.; Zhou, X.; Xia, Y.; He, Y.; He, Y.; Gong, H.; Ma, D.; et al. Genome-wide identification, structure characterization, and expression pattern profiling of aquaporin gene family in cucumber. BMC Plant Biol. 2019, 19, 345. [Google Scholar] [CrossRef] [PubMed]
  72. Rouster, J.; Leah, R.; Mundy, J.; Cameron-Mills, V. Identification of a methyl jasmonate-responsive region in the promoter of a lipoxygenase 1 gene expressed in barley grain. Plant J. 2011, 513–523. [Google Scholar] [CrossRef] [PubMed]
  73. Fujita, Y.; Fujita, M.; Satoh, R.; Maruyama, K.; Parvez, M.M.; Seki, M.; Hiratsu, K.; Ohme-Takagi, M.; Shinozaki, K.; Yamaguchi-Shinozaki, K. AREB1 is a transcription activator of novel ABRE-Dependent ABA signaling that enhances drought stress tolerance in Arabidopsis. Plant Cell 2005, 17, 3470. [Google Scholar] [CrossRef] [PubMed]
  74. Dai, F.G.; Hu, Z.L.; Chen, G.P.; Wang, B.Q.; Wang, Y. Progress in the plant specific SBP-box gene family. Chin. Bull. Life Sci. 2010, 22, 155–160. [Google Scholar] [CrossRef]
  75. Moreno, M.A.; Harper, L.C.; Krueger, R.W.; Dellaporta, S.L.; Freeling, M. Liguleless1 encodes a nuclear-localized protein required for induction of ligules and auricles during maize leaf organogenesis. Genes Dev. 1997, 11, 616–628. [Google Scholar] [CrossRef] [PubMed]
  76. Unte, U.S.; Sorensen, A.M.; Pesaresi, P.; Gandikota, M.; Leister, D.; Saedler, H.; Huijser, P. SPL8, an SBP-box gene that affects pollen sac development in Arabidopsis. Plant Cell 2003, 15, 1009–1019. [Google Scholar] [CrossRef] [PubMed]
  77. Ling, L.Z.; Zheng, S.D. Unraveling the Distribution and Evolution of miR156-targeted SPLs in Plants by Phylogenetic Analysis. Plant Divers. Resour. 2012, 34, 33–46. [Google Scholar] [CrossRef]
  78. Wong, D.C.J.; Gutierrez, R.L.; Gambetta, G.A.; Castellarin, S.D. Genome-wide analysis of cis-regulatory element structure and discovery of motif-driven gene co-expression networks in grapevine. DNA Res. 2017, 24, 311–326. [Google Scholar] [CrossRef] [Green Version]
  79. Riese, M.; Höhmann, S.; Saedler, H.; Thomas, M.; Huijser, P. Comparative analysis of the SBP-box gene families in P. patens and seed plants. Gene 2007, 401, 1–37. [Google Scholar] [CrossRef]
  80. Ma, J.; Yang, Y.; Luo, W.; Yang, C.; Ding, P.; Liu, Y.; Qiao, L.; Chang, Z.; Geng, H.; Wang, P.; et al. Genome-wide identification and analysis of the MADS-box gene family in bread wheat (Triticum aestivum L.). PLoS ONE 2017, 12, e0181443. [Google Scholar] [CrossRef]
  81. Yue, W.; Nie, X.; Cui, L.; Zhi, Y.; Zhang, T.; Du, X.; Song, W. Genome-wide sequence and expressional analysis of autophagy Gene family in bread wheat (Triticum aestivum L.). J. Plant Physiol. 2018, 229, 7–21. [Google Scholar] [CrossRef] [PubMed]
  82. Wang, M.; Yue, H.; Feng, K.W.; Deng, P.C.; Song, W.N.; Nie, X.J. Genome-wide identification, phylogeny and expressional profiles of mitogen activated protein kinase kinase kinase (MAPKKK) gene family in bread wheat (Triticum aestivum L.). BMC Genom. 2016, 17, 668. [Google Scholar] [CrossRef] [PubMed]
  83. Feldman, M.; Liu, B.; Segal, G.; Abbo, S.; Levy, A.A.; Vega, J.M. Rapid elimination of low-copy DNA sequences in polyploidy wheat: A possible mechanism for differentiation of homoeologous chromosomes. Genetics 1997, 147, 1381–1387. [Google Scholar] [CrossRef] [PubMed]
  84. Zhang, Z.C.; Belcram, H.; Gornicki, P.; Charles, M.; Just, J.; Huneau, C.; Magdelenat, G.; Couloux, A.; Samain, S.; Gill, B.S.; et al. Duplication and partitioning in evolution and function of homoeologous Q loci governing domestication characters in polyploid wheat. Proc. Natl. Acad. Sci. USA 2011, 108, 18737–18742. [Google Scholar] [CrossRef] [PubMed]
  85. Hao, J.; Yang, J.; Dong, J.; Fei, S.Z. Characterization of BdCBF, genes and genome-wide transcriptome profiling of BdCBF3 -dependent and -independent cold stress responses in Brachypodium Distachyon. Plant Sci. 2017, 262, 52. [Google Scholar] [CrossRef] [PubMed]
  86. Heidi, W.; Pierre, M.; Senthold, A.; Bruce, K.; Jeffrey, W.; Michael, O.; Gerard, W.W.; Giacomo, D.S.; Jordi, D.; Robert, G.; et al. Canopy temperature for simulation of heat stress in irrigated wheat in a semi-arid environment: A multi-model comparison. Field Crop. Res. 2015, 10, 6563. [Google Scholar] [CrossRef]
  87. Thomas, N.; Benedikt, W.; Sapna, S.; Christian, A.; Christoph, B.; Alexandra, P.; Matthias, P.; Gerald, S.; Barbara, S.; Marc, L.; et al. Joint Transcriptomic and Metabolomic Analyses Reveal Changes in the Primary Metabolism and Imbalances in the Subgenome Orchestration in the Bread Wheat Molecular Response to Fusarium graminearum. Genes Genomes Genet. 2015, 5, 2579–2592. [Google Scholar] [CrossRef]
  88. Lu, M.C.; Liu, Y.Q.; Chen, D.Y.; Xue, Y.X.; Mao, Y.B.; Chen, X.Y. Arabidopsis Transcription Factors SPL1 and SPL12 Confer Plant Thermotolerance at Reproductive Stage. Mol. Plant 2017, 10, 735–748. [Google Scholar]
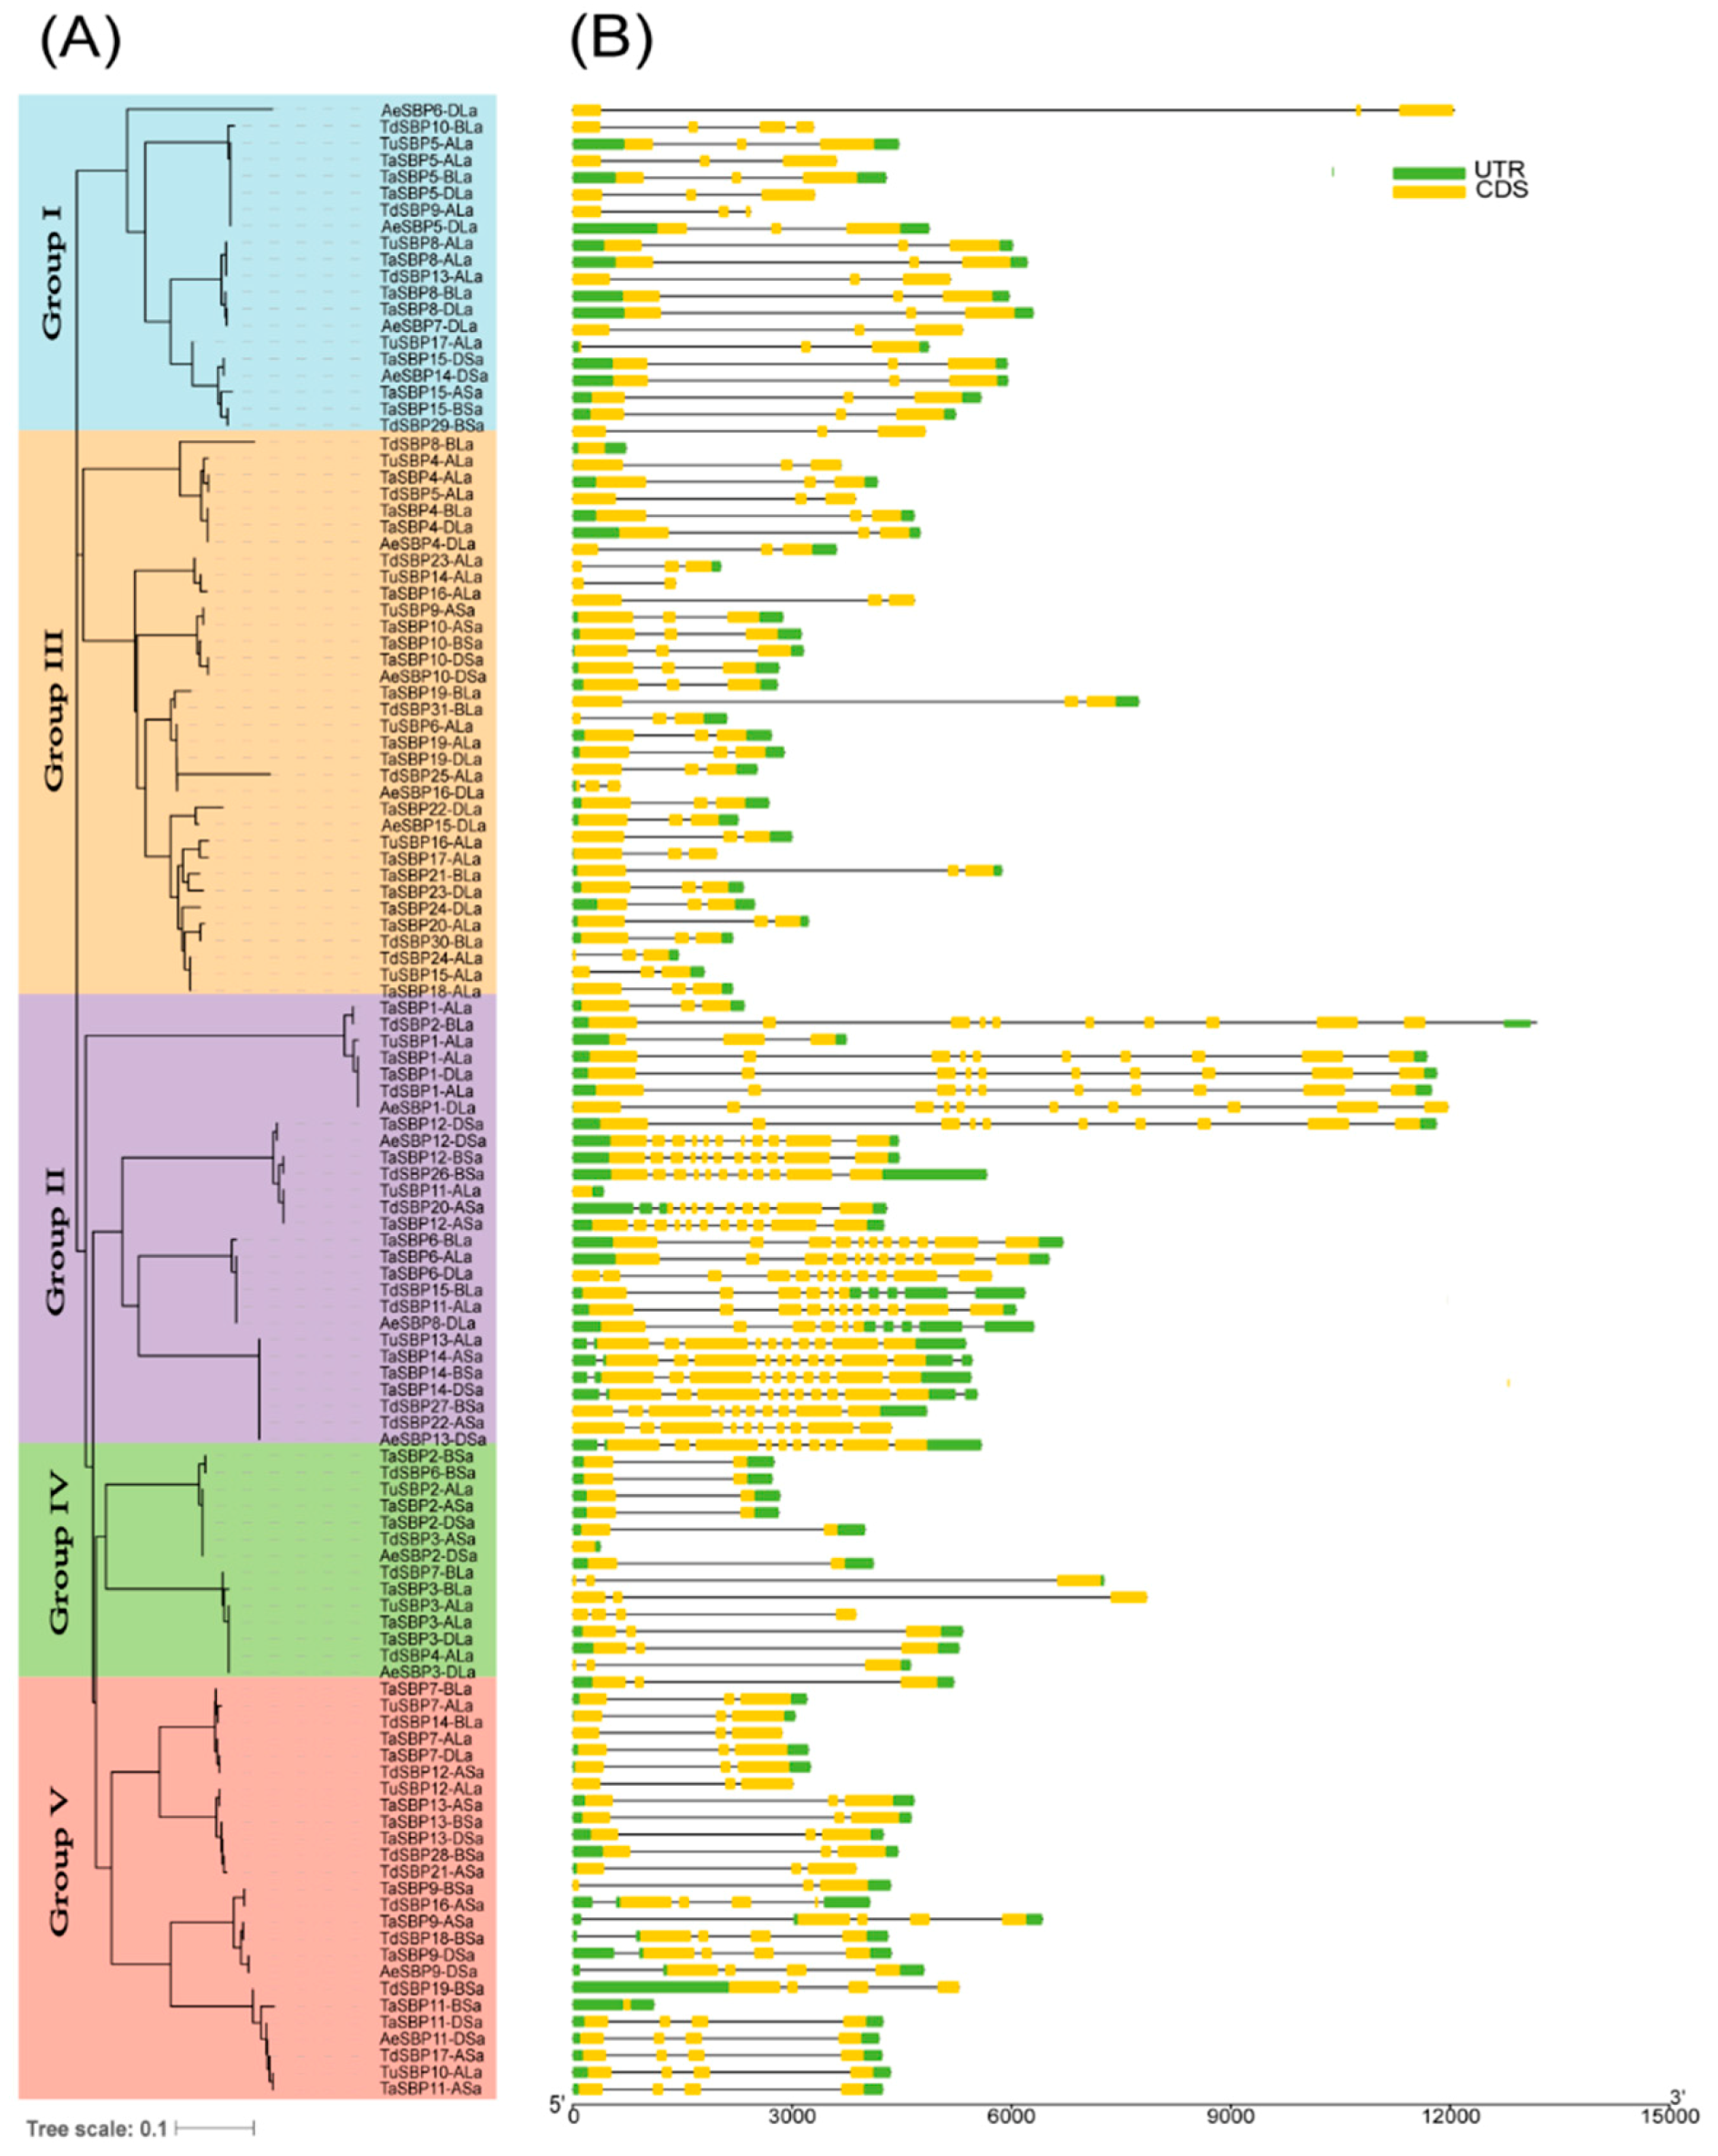
Figure 1. Comparative analysis of the phylogenetics, exon–intron structure, and conserved motifs of SBP family in wheat. (A) The phylogenetic tree of 120 SBP proteins (from Aegilops tauschii (16), Triticum urartu (17), Triticum dicoccoides (31), and hexaploid wheat (56, only protein translated from the splice variant “a” of each wheat SBP gene was considered here)) were constructed by using MEGA 7.0. (B) GSDS2.0 software was employed to generate the gene structure of 120 SBP proteins from Aegilops tauschii, Triticum urartu, Triticum dicoccoides, and hexaploid wheat. The green boxes are CDS, the black lines are introns and the yellow boxes are 5′Untranslated regions (UTRs) or 3′UTR.
Agronomy 09 00527 g001
Figure 2. Comparative analysis of the phylogenetics, exon–intron structure, and conserved motifs of SBP family in wheat. (A) The phylogenetic tree of 120 SBP proteins (from Aegilops tauschii (16), Triticum urartu (17), Triticum dicoccoides (31), and hexaploid wheat (56, only protein translated from the splice variant “a” of each wheat SBP gene was considered here)) were constructed by using MEGA 7.0. (B) Motif composition models of 120 SBP proteins. Different motifs are color-coded. The gene order in (B) is similar to (A).
Agronomy 09 00527 g002
Figure 3. Chromosomal localization of the TaSBPs. The light blue column represents the chromosome and the black dots represent the centromere. Different groups of SBPs are represented in different colors. Blue represents Group I, purple represents Group II, orange represents Group III, green represents Group IV, and red represents Group V. In addition, Chr represents Chromosome.
Agronomy 09 00527 g003
Figure 4. Chromosomal localization of the TuSBPs, TdSBPs, and AeSBPs: (A) chromosomal locations of TuSBP genes; (B) chromosomal locations of TdSBP genes; and (C) chromosomal locations of AeSBP genes. Colored columns represent chromosomes and the black dots represent the centromere. Different groups of SBPs are represented in different colors. Blue represents Group I, purple represents Group II, orange represents Group III, green represents Group IV, and red represents Group V. In addition, Chr represents Chromosome.
Agronomy 09 00527 g004
Figure 5. Orthologous relationships between wheat and its genome ancestors. Numbers along each chromosome box indicate sequence lengths in megabases. Lines between two chromosomes represent the syntonic relationships. The Triticum aestivum, Triticum urartu, Triticum dicoccoides and Aegilops tauschii chromosomes are shown in different color boxes and labeled Ta (red), Tu (purple), Td (green), and Ae (yellow). The red line in the figure is connected to gene pairs TaSBP6-DLa vs. TdSBP11-ALa.
Agronomy 09 00527 g005
Figure 6. Alignment of putative target areas for miR156. The three mismatched types are represented by blue, yellow, and purple. The colons are areas of complete match.
Agronomy 09 00527 g006
Figure 7. Cis-acting elements in the promoters of hexaploid wheat SBP genes. The different shades of red color represent the number of cis-acting elements.
Agronomy 09 00527 g007
Figure 8. Cis-acting elements in the promoters of SBP genes from Triticum urartu, Triticum dicoccoides and Aegilops tauschii. The different shades of red color represent the number of cis-acting elements.
Agronomy 09 00527 g008
Figure 9. Expression patterns of TaSBP genes under different abiotic stress, including drought stress (cultivars: Gemmiza 10; Giza 168; TAM 107), heat stress (cultivar: TAM 107), drought and heat combined stress (cultivar: TAM 107), cold stress (cultivar: Manitou), and phosphorous starvation (cultivar: Chinese Spring) (SBA numbers: PRJNA257938, PRJNA253535, PRJNA306536 and PRJDB2496). Blocks with colors indicate decreased (blue) or increased (red) expression levels. The gradual change of the color indicates different level of gene log2-transformed expression (fold change > 3 is significantly expressed).
Agronomy 09 00527 g009
Figure 10. Heat map of expression profiles for TaSBP genes across different stresses under different biotic stress, including Zymoseptoria tritici in leaf (cultivar: Riband), powdery mildew in leaf (cultivar: Riband), stripe rust in leaf (cultivars: Vuka and an Avocet introgression line containing the resistance gene Yr5), and Fusarium graminearum infection in anthesis (cultivar: Remus) (SBA numbers: PRJEB8798, PRJNA243835, PRJNA243835, PRJEB12497 and PRJEB12358). Blocks with colors indicate decreased (blue) or increased (red) expression levels. The gradually change of the color indicates different level of gene log2-transformed expression (fold change > 3 is significantly expressed).
Agronomy 09 00527 g010
Figure 11. The tissues expression of TaSBP genes at different growth stages in the Chinese Spring cultivar (SBA number: PRJEB25639). Blocks with colors indicate decreased (blue) or increased (red) expression levels. The gradually change of the color indicates different level of gene log2-transformed expression (fold change > 3 is significantly expressed).
Agronomy 09 00527 g011
Figure 12. The PI and MW of TaSBP proteins were predicted by ExPASy10. The five different subfamilies were indicated by different colors.
Agronomy 09 00527 g012
Figure 13. SBP-domain alignment of TaSBPs. Multiple alignment of the SBP domains of the 67 wheat sequences was obtained by DNAMAN6.0 software. Sequences LOGO view based on the result of sequence alignment was placed at the top of the figure. Zinc-binding sites and NLS structure are also labeled. Different colors represent the conservative degree of amino acids: black, 100% conserved; amaranth, 75–100% conserved; light blue, 50–75% conserved; yellow, 33–50% conserved; white, less than 33% conserved.
Agronomy 09 00527 g013
Figure 14. SBP-domain alignment of TuSBPs, TdSBPs, and AeSBPS: (A) SBP-domain alignment of TuSBPs; (B) SBP-domain alignment of TdSBPs; and (C) SBP-domain alignment of AeSBPs. Multiple alignment of the SBP domains of the SBP protein sequences was obtained by DNAMAN6.0 software. Sequences LOGO view based on the result of sequence alignment was placed at the top of the figure. Zinc-binding sites and NLS structure are also labeled. Different colors represent the conservative degree of amino acids: black, 100% conserved; amaranth, 75–100% conserved; light blue, 50–75% conserved; yellow, 33–50% conserved; white, less than 33% conserved.
Agronomy 09 00527 g014
Table 1. Details of the SBP transcription factor family in hexaploid wheat.
Gene NameAccession NumbersChrLocationExoCDSProSource of InformationGroup
TaSBP1-ALaTraesCS1A02G255300.1chr1A447623204–447635025102580859TaASPL9#II
TaSBP1-BLaTraesCS1B02G266100.1chr1B467540751–467553928102559852TaBSPL9#II
TaSBP1-BLbTraesCS1B02G266100.2chr1B467541883–46755392810861Identified in this studyII
TaSBP1-DLaTraesCS1D02G254700.1chr1D347199194–347210946102580859TaDSPL9#II
TaSBP2-ASaTraesCS2A02G232400.1chr2A276276336–2762791552579192TaASPL13#IV
TaSBP2-BSaTraesCS2B02G250900.1chr2B260765427–2607681802579192TaBSPL13#IV
TaSBP2-DSaTraesCS2D02G232800.1chr2D206632153–2066361522579192Identified in this studyIV
TaSBP3-ALaTraesCS2A02G413900.1chr2A670957294–67096262931050349TaASPL7#IV
TaSBP3-BLaTraesCS2B02G432700.1chr2B621960663–62196851331062353TaBSPL7#IV
TaSBP3-DLaTraesCS2D02G410700.1chr2D525512403–52551768931068355Identified in this studyIV
TaSBP4-ALaTraesCS2A02G502300.1chr2A730613571–73061773931239412TaASPL8#III
TaSBP4-BLaTraesCS2B02G530400.1chr2B725575939–72558061131227408TaBSPL8#III
TaSBP4-DLaTraesCS2D02G502900.1chr2D596550011–59655476231221406TaDSPL8#III
TaSBP4-DLbTraesCS2D02G502900.2chr2D596550011–5965547623407Identified in this studyIII
TaSBP5-ALaTraesCS3A02G432500.1chr3A673898993–67390260131248415Identified in this studyI
TaSBP5-BLaTraesCS3B02G468400.1chr3B713320663–71332495331245414Identified in this studyI
TaSBP5-DLaTraesCS3D02G425800.1chr3D538401064–53840437531260419Identified in this studyI
TaSBP6-ALaTraesCS4A02G359500.1chr4A632857804–632864321112883960Identified in this studyII
TaSBP6-BLaTraesCS5B02G512800.1chr5B677875145–677881852112901966TaBSPL6#II
TaSBP6-BLbTraesCS5B02G512800.2chr5B677875145–67788185211961Identified in this studyII
TaSBP6-DLaTraesCS5D02G513300.1chr5D537393493–537399223122889962TaDSPL6#II
TaSBP7-ALaTraesCS5A02G265900.1chr5A477584230–47758745331233410Identified in this studyV
TaSBP7-ALbTraesCS5A02G265900.2chr5A477584230–4775874533411Identified in this studyV
TaSBP7-BLaTraesCS5B02G265600.1chr5B450105102–45010830531188395Identified in this studyV
TaSBP7-BLbTraesCS5B02G265600.2chr5B450105198–4501083053396Identified in this studyV
TaSBP7-DLaTraesCS5D02G273900.1chr5D376936839–37694009331224407Identified in this studyV
TaSBP7-DLbTraesCS5D02G273900.2chr5D376936978–3769400933408Identified in this studyV
TaSBP8-ALaTraesCS5A02G286700.1chr5A494569538–49457575531293430TaASPL6/16#I
TaSBP8-ALbTraesCS5A02G286700.2chr5A494569538–4945757733436Identified in this studyI
TaSBP8-BLaTraesCS5B02G286000.1chr5B471401006–47140697831302433TaBSPL16#I
TaSBP8-DLaTraesCS5D02G294400.1chr5D391372552–39137885131299432Identified in this studyI
TaSBP8-DLbTraesCS5D02G294400.2chr5D391372552–3913788513426Identified in this studyI
TaSBP9-ASaTraesCS6A02G110100.1chr6A79267605–7927167131134377TaASPL3/14/18#V
TaSBP9-ASbTraesCS6A02G110100.2chr6A79267605–792716714475Identified in this studyV
TaSBP9-BSaTraesCS6B02G138400.1chr6B135858620–13586293141422473TaBSPL3/18#V
TaSBP9-DSaTraesCS6D02G098500.1chr6D62113576–6211838141422473TaDSPL3/18#V
TaSBP10-ASaTraesCS6A02G152000.1chr6A136541404–13654453131347448Identified in this studyIII
TaSBP10-BSaTraesCS6B02G180300.1chr6B200508894–20051205231329442Identified in this studyIII
TaSBP10-DSaTraesCS6D02G142100.1chr6D111567310–11157013331359452Identified in this studyIII
TaSBP11-ASaTraesCS6A02G155300.1chr6A143965449–1439696904987328Identified in this studyV
TaSBP11-BSaTraesCS6B02G183400.1chr6B204923634–2049278784984327Identified in this studyV
TaSBP11-DSaTraesCS6D02G145200.1chr6D115545817–1155500114978325Identified in this studyV
TaSBP12-ASaTraesCS7A02G208000.1chr7A170629912–170634171112541846TaASPL1#II
TaSBP12-BSaTraesCS7B02G115200.1chr7B133742358–133748024112538845TaBSPL1#II
TaSBP12-DSaTraesCS7D02G210400.1chr7D168423642–168428099112469822TaDSPL1#II
TaSBP12-DSbTraesCS7D02G210400.2chr7D168423642–16842809911847Identified in this studyII
TaSBP13-ASaTraesCS7A02G246500.1chr7A225631628–22563626131161386Identified in this studyV
TaSBP13-BSaTraesCS7B02G144900.1chr7B187777243–18778149131161386TaBSPL17#V
TaSBP13-BSbTraesCS7B02G144900.2chr7B187777243–1877817863385Identified in this studyV
TaSBP13-DSaTraesCS7D02G245200.1chr7D213786904–21379135431155384Identified in this studyV
TaSBP13-DSbTraesCS7D02G245200.2chr7D213786904–2137913543385Identified in this studyV
TaSBP14-ASaTraesCS7A02G249100.2chr7A231544001–23154946493387898TaASPL15#II
TaSBP14-ASbTraesCS7A02G249100.3chr7A231544001–23154946491113Identified in this studyII
TaSBP14-AScTraesCS7A02G249100.4chr7A231544001–23154946491123Identified in this studyII
TaSBP14-BSaTraesCS7B02G142200.1chr7B181033715–1810391671033901129TaBSPL15#II
TaSBP14-BSbTraesCS7B02G142200.2chr7B181033715–181039145101124Identified in this studyII
TaSBP14-DSaTraesCS7D02G248000.1chr7D219291031–2192965651033901129TaDSPL15#II
TaSBP14-DSbTraesCS7D02G248000.2chr7D219291031–219296577101114Identified in this studyII
TaSBP14-DScTraesCS7D02G248000.3chr7D219291031–219296577101124Identified in this studyII
TaSBP15-ASaTraesCS7A02G260500.1chr7A252715392–25272097831224407Identified in this studyI
TaSBP15-BSaTraesCS7B02G158500.1chr7B214070642–21407588131230409Identified in this studyI
TaSBP15-DSaTraesCS7D02G261500.1chr7D237410146–23741609231245414Identified in this studyI
TaSBP16-ALaTraesCS7A02G494800.1chr7A684292548–68429721931200399Identified in this studyIII
TaSBP17-ALaTraesCS7A02G494900.1chr7A685090082–68509595431185394Identified in this studyIII
TaSBP18-ALaTraesCS7A02G495000.1chr7A685212558–68521490631221388TaASPL4/10#III
TaSBP19-ALaTraesCS7A02G495100.1chr7A685227875–68523077031260419Identified in this studyIII
TaSBP19-ALbTraesCS7A02G495100.2chr7A685227875–6852307703418Identified in this studyIII
TaSBP19-BLaTraesCS7B02G402200.1chr7B668907244–66891498731254417Identified in this studyIII
TaSBP19-DLaTraesCS7D02G482500.1chr7D592857673–59286019831251317Identified in this studyIII
TaSBP20-ALaTraesCS7B02G402300.1chr7A668928550–66893074031173406Identified in this studyIII
TaSBP21-BLaTraesCS7B02G402400.1chr7B669139219–66914155431206401TaBSPL10#III
TaSBP22-DLaTraesCS7D02G482200.1chr7D592632237–59263449931227408TaDSPL5#III
TaSBP23-DLaTraesCS7D02G482300.1chr7D592677316–5926798053954390Identified in this studyIII
TaSBP24-DLaTraesCS7D02G482400.1chr7D592816284–59281950931167394Identified in this studyIII
Chr, Chromosomal Location; Exo, Exon; CDS, length of coding DNA sequence (bp); Pro, length of protein sequence (aa). # Reference [39].
Table 2. General information of SBP proteins selected for diploid and tetraploid wheat.
Gene NameAccession NumbersChrLocationExoCDSProSource of InformationGroup
TuSBP1-ALaTuG1812G0100002957.01.T01chr1A447915501–447927189102580859Identified in this studyII
TuSBP2-ALaTuG1812G0200002854.01.T01chr2A357384527–3573873612579192Identified in this studyIV
TuSBP3-ALaTuG1812G0200004639.01.T01chr2A647145178–6471490504801267Identified in this studyIV
TuSBP4-ALaTuG1812G0200005460.01.T01chr2A707789017–70779268731239412Identified in this studyIII
TuSBP5-ALaTuG1812G0300004828.01.T01chr3A676882033–67688649431248415Identified in this studyI
TuSBP6-ALaTuG1812G0400000984.01.T01chr7A671389265–67139198531257418Identified in this studyIII
TuSBP7-ALaTuG1812G0500002978.01.T01chr7A455468876–45547192031233410Identified in this studyV
TuSBP8-ALaTuG1812G0500003204.01.T01chr5A474168850–47417487031311436Identified in this studyI
TuSBP9-ASaTuG1812G0600001583.01.T01chr6A130811290–13081416931347448Identified in this studyIII
TuSBP10-ALaTuG1812G0600001622.01.T01chr6A136757763–1367621134987328Identified in this studyV
TuSBP11-ALaTuG1812G0700002205.01.T01chr7A166227361–16623165391785480Identified in this studyII
TuSBP12-ALaTuG1812G0700002579.01.T01chr7A221012709–22101737831161386Identified in this studyV
TuSBP13-ALaTuG1812G0700002627.01.T01chr7A229641959–2296473381033871128Identified in this studyII
TuSBP14-ALaTuG1812G0700005298.01.T01chr7A666539171–6665405792300100Identified in this studyIII
TuSBP15-ALaTuG1812G0700005339.01.T01chr7A671400175–6714023631221406Identified in this studyIII
TuSBP16-ALaTuG1812G0700005341.01.T01chr7A671555473–67155744131221407Identified in this studyIII
TuSBP17-ALaTuG1812S0001265400.01.T01chrUn1790–66613804267Identified in this studyV
TdSBP1-ALaTRIDC1AG038160.1chr1A449905748–449917720102580856Identified in this studyII
TdSBP2-BLaTRIDC1BG043410.1chr1B472706171–47270991631779860Identified in this studyII
TdSBP3-ASaTRIDC2AG030380.1chr2A238282797–2382831781382192Identified in this studyIV
TdSBP4-ALaTRIDC2AG059730.1chr2A663899405–6639040293784349Identified in this studyIV
TdSBP5-ALaTRIDC2AG070620.1chr2A723682186–72368605031149382Identified in this studyIII
TdSBP6-BSaTRIDC2BG034150.1chr2B269177236–26917996721087192Identified in this studyIV
TdSBP7-BLaTRIDC2BG063080.1chr2B618377307–6183845753799249Identified in this studyIV
TdSBP8-BLaTRIDC2BG076330.1chr2B721397248–721397971731318Identified in this studyIII
TdSBP9-ALaTRIDC3AG061260.1chr3A669762928–6697653603585195Identified in this studyI
TdSBP10-BLaTRIDC3BG068940.1chr3B726994175–72699746941092363Identified in this studyI
TdSBP11-ALaTRIDC4AG053710.1chr4A623528485–623534548113298962Identified in this studyII
TdSBP12-ASaTRIDC5AG019810.1chr5A241751264–24175427431218406Identified in this studyV
TdSBP13-ALaTRIDC5AG042970.1chr5A489480670–48948583731280429Identified in this studyI
TdSBP14-BLaTRIDC5BG043980.1chr5B457191664–45719452531182393Identified in this studyV
TdSBP15-BLaTRIDC5BG076500.1chr5B679130247–67913643663342494Identified in this studyII
TdSBP16-ASaTRIDC6AG014380.1chr6A78107952–7811437641842479Identified in this studyV
TdSBP17-ASaTRIDC6AG021720.1chr6A142480257–1424833593864264Identified in this studyV
TdSBP18-BSaTRIDC6BG019820.1chr6B138664345–13866870542347473Identified in this studyV
TdSBP19-BSaTRIDC6BG027420.1chr6B210397416–21039853011115255Identified in this studyV
TdSBP20-ASaTRIDC7AG026190.1chr7A168308982–16831339343421294Identified in this studyII
TdSBP21-ASaTRIDC7AG031600.1chr7A223119140–22312349131186288Identified in this studyV
TdSBP22-ASaTRIDC7AG032020.2chr7A229102299–2291066591033151104Identified in this studyII
TdSBP23-ALaTRIDC7AG069100.1chr7A680628704–6806307303789217Identified in this studyIII
TdSBP24-ALaTRIDC7AG069150.1chr7A681544947–6815467453999266Identified in this studyIII
TdSBP25-ALaTRIDC7AG069170.1chr7A681560236–6815608803447134Identified in this studyIII
TdSBP26-BSaTRIDC7BG016800.1chr7B138211281–1382117031423845Identified in this studyII
TdSBP27-BSaTRIDC7BG022390.1chr7B197125736–1971305811038751075Identified in this studyII
TdSBP28-BSaTRIDC7BG022920.1chr7B203851538–20385541131220386Identified in this studyV
TdSBP29-BSaTRIDC7BG025060.1chr7B230000670–23000548931230409Identified in this studyI
TdSBP30-BLaTRIDC7BG063530.1chr7B677708807–6777102543708188Identified in this studyIII
TdSBP31-BLaTRIDC7BG063560.1chr7B677720377–67772248531005227Identified in this studyIII
AeSBP1-DLaAET1Gv20619300.1chr1D352650035–352661850102580859Identified in this studyII
AeSBP2-DSaAET2Gv20486300.1chr2D208545838–2085499532579192Identified in this studyIV
AeSBP3-DLaAET2Gv20915400.2chr2D524298824–52430403831068355Identified in this studyIV
AeSBP4-DLaAET2Gv21102800.1chr2D595292761–5952963713894297Identified in this studyIII
AeSBP5-DLaAET3Gv20960100.2chr3D547095656–54710053331260419Identified in this studyI
AeSBP6-DLaAET4Gv20824900.1chr4D510058422–51007048031185394Identified in this studyI
AeSBP7-DLaAET5Gv20667300.1chr5D398586010–39859134231281426Identified in this studyI
AeSBP8-DLaAET5Gv21144000.1chr5D549430767–54943707661485494Identified in this studyII
AeSBP9-DSaAET6Gv20284700.1chr6D86357505–8636278741386462Identified in this studyV
AeSBP10-DSaAET6Gv20390500.2chr6D86362787–8636278731359452Identified in this studyIII
AeSBP11-DSaAET6Gv20396500.3chr6D139561288–1395655204978325Identified in this studyV
AeSBP12-DSaAET7Gv20522500.3chr7D169524973–169529438112544847Identified in this studyII
AeSBP13-DSaAET7Gv20612200.1chr7D221003305–2210088961033901129Identified in this studyII
AeSBP14-DSaAET7Gv20637900.1chr7D239178640–23918459531245414Identified in this studyI
AeSBP15-DLaAET7Gv21205900.1chr7D598534268–59853726731230396Identified in this studyIII
AeSBP16-DLaAET7Gv21206500.1chr7D598574981–59857766531251416Identified in this studyIII
Chr, Chromosomal Location; Exo, Exon; CDS, length of coding DNA sequence (bp); Pro, length of protein sequence (aa).