Article

Tuber Yield Formation and Sugar Composition of Yacon Genotypes Grown in Central Europe

1
Institute of Crop Science, University of Hohenheim, 70599 Stuttgart, Germany
2
Department of Biostatistics, Institute of Crop Science, University of Hohenheim, 70599 Stuttgart, Germany
*
Author to whom correspondence should be addressed.
Agronomy 2019, 9(6), 301; https://doi.org/10.3390/agronomy9060301
Submission received: 8 May 2019 / Revised: 4 June 2019 / Accepted: 6 June 2019 / Published: 11 June 2019
(This article belongs to the Section Innovative Cropping Systems)

Abstract

:
Yacon (Smallanthus sonchifolius) is a tuberous root crop native to the Andean region. The eatable tubers contain up to 70% fructooligosaccharides (FOS) on a dry matter (DM) basis. These FOS are not digestible by the human intestinal tract and do not cause an increase of blood glucose level. Therefore, the consumption of yacon tubers offers health promoting benefits. With regard to cultivation, little to no information about yield potential and FOS content as well as sugar composition of diverse genotypes is known. However, this information is crucial for the development of new health beneficial food products out of different genotypes of yacon. In the present study nine different genotypes were studied in a field experiment in 2017 and 2018 regarding their tuber yield formation, sugar yield, and sugar composition. The genotypes red-shelled (‘RG’), brown-shelled (‘BG’), and ‘Morado’ reached the highest tuber yields of 46.6, 43.5, and 41.6 t ha−1 FM, respectively. These three genotypes also had the highest sugar yields in the same order (2.2, 2.0, and 1.9 t ha−1). Considering the sugar composition and sugar content, these three genotypes were outstanding, with a sugar content up to 66% of DM (‘RG’, 2018). With regards to the development of possible food products, cv. ‘Peru’ can be considered as favorable for the fresh market due to high amounts of both monosaccharides and FOS. Genotypes ‘BG’, ‘RG’, and ‘Morado’ seem to offer various options for the food processing industry, due to their high amounts of FOS.

1. Introduction

The tuberous root crop yacon ((Smallanthus sonchifolius (Poepp. et. Endl.) H. Robinson)) is native to the Andean region and belongs to the family of Asteraceae. The highest diversity of yacon genotypes can be found in Peru and Bolivia [1]. In addition to its area of origin, yacon is cultivated in Brazil, Czech Republic, New Zealand, Japan, and Italy [2,3]. There have already been cultivation attempts in Germany in the early 1940s [3]. Basically yacon is a perennial plant. As it is not frost tolerant, it is grown as an annual crop in Central Europe and other regions with frosts [4]. Aboveground biomass can achieve a plant height of up to 2–2.5 m and consists of dark green leaves [4,5]. Below ground yacon produces eatable tuberous roots. On average, each plant achieves a tuber yield of 2–3 kg, sometimes reaching up to 5 kg [6,7,8]. The color of the tuber’s flesh and peel varies from white to yellow, red, purple, or brown [9]. Each tuber generally weighs between 200 and 500 g, but weights can reach up to 2000 g with a dry matter of 10–14% [5,10]. In contrast to other tuberous root crops, yacon stores carbohydrates in the form of fructooligosaccharides (FOS). These FOS are polysaccharides which cannot be digested by the human intestinal track and do not cause an increase of blood glucose level [11,12]. Therefore, the consumption of yacon products with high amounts of FOS offers health promoting benefits [13].
The main components of FOS in yacon are kestose (GF2), nystose (GF3), and fructofuranosylnystose (GF4) at amounts generally between 34 to 60% of dry matter (DM), but also considerably less depending on the cultivar [6,14,15]. Major differences between yacon and other FOS containing crops like Jerusalem artichoke and chicory are the shorter chain length of FOS in yacon. Jerusalem artichoke and chicory had noticeable higher chain lengths with a degree of polymerization (DP) > 10 [16]. Due to a decreasing bifidogenic effect with increasing DP, lower DP, like in yacon tubers, is preferable [17,18]. Furthermore, yacon contains phenolic compounds and flavonoids [11,13] which offer health promoting benefits when consumed. The tubers can be commercialized for the fresh market as a fruit or for the food processing industry. They can be processed as natural sweeteners in the form of syrup or powder or dried to chips [11,19]. As sugar composition and DP are highly relevant for the technological properties and potential resulting health benefits of the intended food products, it is important to examine potential differences of sugar composition between the genotypes. In general tubers with high amounts of FOS are more preferable because of greater health promoting benefits.
In general, yacon tubers show a wide range of FOS amounts and DP indicating that several factors impact sugar composition and yield formation. The yacon genotype can be considered as a major influencing factor [20]. Hence, it is mandatory to examine the sugar compositions and yield potential of several genotypes grown in Central Europe. With regards to sugar composition and bioactive compounds in general, only little information is found in literature related to the choice of the genotype. In addition little to no information, related to tuber yield formation, is available about cultivation in Central Europe. Both characteristics are decisive for the market potential of the genotypes. Depending on single tuber weight, and the amount of FOS and fructose as well as glucose, different marketing options as well as final food products could be possible. For fresh market purposes, size and weight of the tuber, and of course taste are decisive. For the processing industry, weight and size of tubers is not relevant, but sugar composition and therefore processing characteristics are. Amount of FOS should be as high as possible to offer maximum health promoting benefit.
Therefore, the aim of the present study was to investigate the potential of different yacon genotypes with regard to (i) tuber yield formation and (ii) sugar composition and sugar yield. Different yield parameters and sugar compositions will result in different sugar yield potentials and marketing options as well as food products.

2. Materials and Methods

2.1. Field Site and Experimental Design

Field trials were carried out in 2017 and 2018 at the experimental station Ihinger Hof of the University of Hohenheim (48°44’ N, 8°55’ E and 475 a.s.l.) in south-west Germany from May–November. Mean annual rainfall was 653.9 mm in 2017 and 252.9 mm in 2018. Average annual temperature amounted to 9.2 °C in 2017 and 10.2 °C in 2018. During the cultivation period the average temperature was 13.5 °C in 2017 and 16.1 °C in 2018 (Figure 1a,b).
The soil of the experimental fields was classified as a Vertic Cambisol with winter wheat as the preceding crop in both years [21]. The trials were set up as alpha design (Figure A1) with three replicates each with two incomplete blocks of five plots. Each plot was 5 × 4 m. The trial was laid out in ridges (60 × 45 cm; 44 cm between the ridges; 114 cm between centers of ridges). Ridges were formed by using a common asparagus ridge planting machine (Leofant, HMF-Hermeler Maschinenbau GmbH, Füchtorf, Germany). The ridges were directed from east to west and formed four weeks before planting. Each plot was comprised of two ridges and 14 plants (0.7 × 1.14 m) resulting in a final plant density of 12,531 plants ha−1. Nmin content in the soil was determined shortly before planting (VDLUFA, 2004) and amounted to 119 and 53 kg NO3 ha−1 in 2017 and 2018, respectively. Due to high amounts of Nmin in 2017, no additional nitrogen fertilizer was added. In 2018, 66 kg N ha−1 were applied as ENTEC 26 (EuroChem Agro GmbH, Mannheim, Germany) shortly before planting to reach a similar nitrogen amount as in the year before.
To prevent water stress, in particular in the first development phase after transplanting and during hot and dry periods in 2018, plants were additionally irrigated. In 2017, irrigation was carried out four times (26 and 30 of May, 20 and 22 of June) and in 2018 12 times (30 of July and 3, 6, 7, 8, 9, 10, 13, 15, 16, 21, and 23 of August) with 1.4 L per plant each time. Weed control was done manually until the plant population was established.

2.2. Treatments

Within the field trial ten different genotypes were tested, but one showed no emergence in the first year. The nine remaining genotypes were: brown-shelled (’BG’), red-shelled (‘RG’), ‘Morado’, ‘Rojo’, ‘New Zealand’, Cajamarca, ‘Peru’, ‘Late Red’, ‘Early White’, and ‘Purple’. Rhizomes for cultivation of seedlings were received from different gardeners and a network of sustainers for biodiversity (Helenion, Berlin, Germany and Arche Noah, Austria). After harvest in 2017, rhizomes were stored for the next year’s cultivation period according to the method described by Kamp et al. [22]. Rhizome pieces of each genotype were sliced into smaller pieces (20–40 g) with a sterile knife and then planted in square planters (9 × 9 × 9.5 cm) filled with a standard soil (classic, expert substrate, Einheitserde Werkverband e.V., Sinntal-Altengronau, Germany). Cultivation started six weeks before transplanting, on 7 of April in 2017 and 5 of April in 2018. Temperature in the greenhouse ranged from 15 °C at night to 21 °C during the day; humidity amounted in average to 65%. No artificial light was used for cultivation of seedlings. To avoid white bow ties and fungus gnats, sticky traps were placed above tables. Pots were irrigated every third day if required. Seedlings were transplanted into the field on 19 May 2017 and 17 May 2018. After transplanting, 6 kg ha−1 of slug pellet was applied manually (Arinex, ADAMA Deutschland GmbH, Cologne, Germany).

2.3. Field Measurements and Sample Preparation

Final harvest took place on 7 of November 2017 and 17 of October in 2018 (172 and 153 days after planting (DAP), respectively). Date of harvest was set immediately after the first frost to ensure a maximum utilization of the given vegetation period. For determination of tuber yield formation, six plants in the center of each plot were harvested. Plants were harvested manually by using a sickle and a digging fork. Afterwards, tubers were washed to remove soil residues. Weight of each single tuber was determined to assess dry matter. A bulked sample from each plot was frozen with liquid nitrogen (‒196 °C) and finally freeze dried. By freezing samples with liquid nitrogen, any enzymatic process was stopped and no changes in sugar composition were assumed. For further analysis, freeze dried samples were milled with a GRINDOMIX GM 200 (Retsch GmbH, Haan, Germany) two times at a speed of 10,000 turns min−1 for 10 s each. Sugar composition of tubers were analyzed by using high performance liquid chromatography (HPLC) using the method described by Kamp et al. [23]. To determine the overall sugar yield the percentage of total sugar was multiplied by tuber yield (DM).

2.4. Statistical Analysis

A mixed model approach was used and the following model was fitted to all traits. For traits with a single observation per plot (tuber yield per plot, tuber dry matter, and sugar components) the model was as follows:
y i j = μ +   b j +   a i + ( a b ) i j +   e i j
  y i j k l = μ   +   a j + r j k + b j k l +   τ i + ( τ a ) i j +   e i j k l
where μ is the general effect, b j is the fixed effect of the jth year, a i r j k is the fixed effect of the kth replicate in year j, b j k l is the random effect of the lth incomplete block in the jkth replicate, τ i is the main effect of the ith genotype, and ( a b ) i j and ( τ a ) i j is the fixed interaction effect of the ith genotype and jth year. e i j is the error of y i j with homogeneous or year-specific error variance. Studentized residuals were graphically checked for normal distribution and homogeneous variance.
After finding significant differences via the global F-test, significant differences were evaluated with a multiple t-test (Fisher´s least significant difference test) at a significance level of 5%. A letter display was used to present the results of multiple comparisons (Piepho 2004). Additionally, simple means were calculated for all traits for presentation purposes only.
For traits measured at each plant (number of tubers per plant and average single tuber weight), the model extended by a plot effect. The model is then:
y i j k l m = μ +   a j + r j k + b j k l +   τ i + ( τ a ) i j +   p i j k l +   e i j k l m        
where p i j k l is the random plot effect of the lth plot and e i j k l m is the error of the mth plant. All other variables are analogous to model (1). Statistical analysis were performed using the PROC MIXED procedure of the SAS system, version 9.4 (SAS Institute Inc., Cary, NC, USA). Figures were generated using SigmaPlot, version 13.0 (Systat Software GmbH, Erkrath, Germany), and Excel 2013 (Microsoft Corporation, Redmond WA, USA).

3. Results

3.1. Tuber Yield Formation
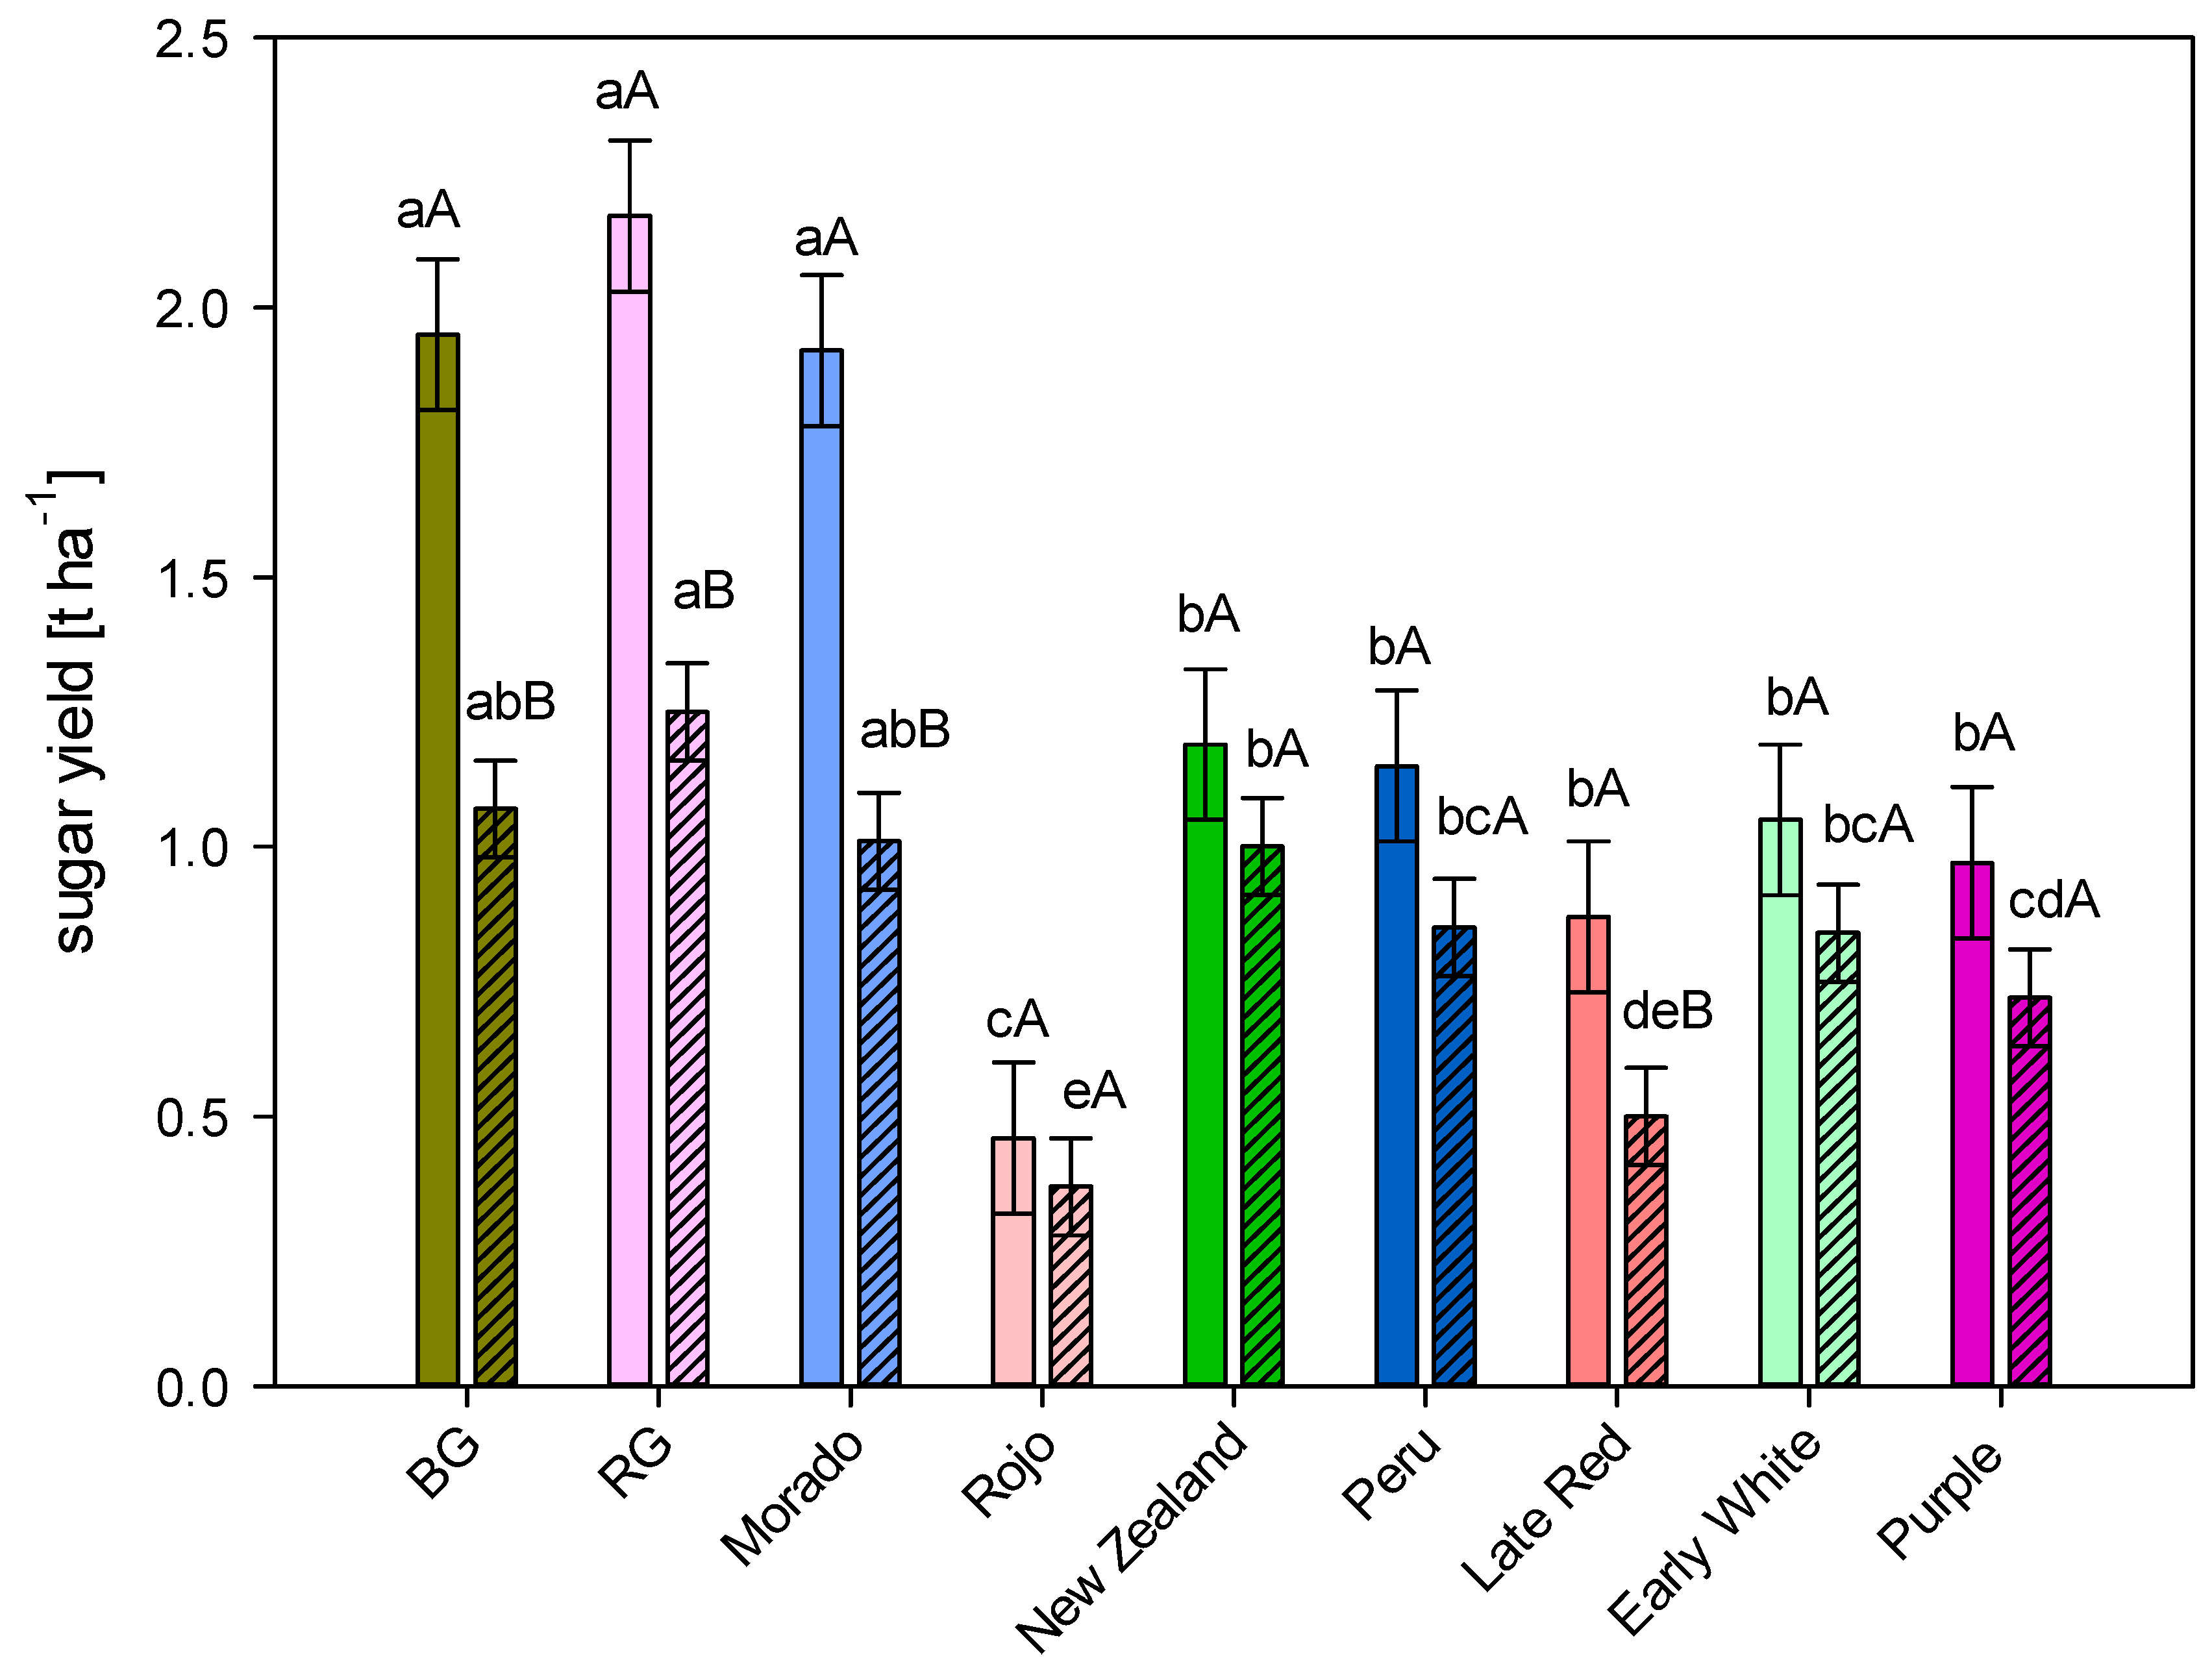
The parameters tuber yield (t ha−1 FM, DM) and tuber DM% and number of tubers per plant were significantly affected by genotype-by-year interactions (Table 1). Single tuber weight was not affected by this interactions, but by genotype and year. In 2017, tuber yield (FM t ha−1) ranged from 19.2 (‘Late Red’) to 46.6 t ha−1 (‘RG’). Genotypes ‘BG’, ‘RG’, and ‘Morado’ reached significantly higher tuber yields than the other six genotypes. In 2018, tuber yields ranged from 6.5 (‘Late Red’, ‘Rojo’) to 12.8 t ha−1 (‘BG’). Tuber yields of genotypes ‘Late Red’ and ‘Rojo’ were significantly lower than those of the other seven cultivars. In general, in 2018 tuber yield of all genotypes was significantly lower than in 2017. DM ranged from 11.0% (‘BG’) to 16.1% (‘RG’) and from 12.0% (‘Peru’) to 17.7% (‘New Zealand’) in 2017 and 2018, respectively. Genotypes ‘Rojo’, ‘New Zealand’, ‘Peru’, and ‘Purple’ had significantly higher tuber DM in 2018 than 2017. Genotypes ‘RG’ and ‘Morado’ had significantly higher DM than other genotypes (except ‘Late Red’ and ‘Purple’) in 2017. In 2018, genotypes ‘Morado’, ‘New Zealand’, and ‘Purple’ reached the significantly highest tuber DM. Regarding tuber yield (DM t ha−1), all genotypes reached significantly higher tuber yields in 2017 than in 2018. In 2017, genotypes ‘RG’ and ‘Morado’ significantly achieved the highest tuber yields. In 2018, genotype ‘New Zealand’ reached the highest tuber yield and differed significantly from all other genotypes except ‘RG’ and ‘Morado’.
Number of tubers per plant ranged in 2017 from 8.3 (‘Early White’) to 14.8 (‘RG’). Genotypes ‘RG’, ‘Morado’, and ‘New Zealand’ reached significantly higher numbers of tubers per plant than all other six genotypes, except ’BG’ which did not differ from ‘New Zealand’. In 2018, number of tubers per plant ranged from 5.1 (‘Late Red’) to 7.9 (‘New Zealand’). Except for ‘Rojo’ all genotypes reached significantly lower numbers of tubers per plant in 2018 than in 2017.
In contrast, average single tuber weights were significantly higher in 2017 than 2018 (Table A1). Weights ranged from 174.9 g (‘Late Red’) to 314.0 g (‘BG’) in 2017 and from 91.4 g (‘Rojo’) to 220.7 g (‘BG’) in 2018. Over both experimental years, genotypes ‘BG’, ‘Peru’, ‘RG’, and ‘Early White’ (descending order) reached significantly higher tuber yields than the other genotypes.

3.2. Sugar Yield

Sugar yield (t ha−1) was significantly affected by genotype × year interactions. In 2017, the genotypes ‘BG’, ‘RG’, and ‘Morado’ reached the significantly highest sugar yields and differed from all other genotypes. Genotype ‘RG’ reached the highest sugar yield with 2.2 t ha−1. ‘BG’ and ‘Morado’ had slightly lower amounts in the range of 2.0 and 1.9 t ha−1, respectively (Figure 2). ‘Rojo’ reached the lowest sugar yield of 0.5 t ha−1 and differed significantly from all other genotypes. The other genotypes ‘New Zealand’, ‘Peru’, ‘Late Red’, ‘Early White’, and ‘Purple’ did not differ significantly from each other and reached sugar yields in a similar range. In 2018, sugar yield ranged from 0.4 (‘Rojo’) to 1.3 t ha−1 (‘RG’). Genotypes ‘RG’, ‘BG’, and ‘Morado’ reached sugar yields in a similar range in decreasing order. The lowest sugar yield of 0.4 t ha−1 was reached by ‘Rojo’ and showed significant differences to all genotypes, except ‘Late Red’ which was also in a lower range with 0.5 t ha−1. Genotypes ‘Rojo’, ‘New Zealand’, ‘Peru’, ‘Early White’, and ‘Purple’ did not differ significantly between the two experimental years. The four genotypes ‘BG’, ‘RG’, ‘Morado’, and ‘Late Red’ reached significantly higher sugar yields in 2017 than 2018. All genotypes reached lower sugar yields in 2018 than in 2017.

3.3. Sugar Composition

The fructose and GF4 fractions were significantly affected by year × genotype interactions. The glucose, sucrose, and GF3 fractions were significantly affected by year and genotype in each case. GF2 was only affected by year (Table 2).
Amount of fructose ranged from 0.86% (‘RG’) to 5.91% (‘Peru’) and from 0.43% (‘Late Red’) to 2.89% (‘Rojo’) in 2017 and 2018, respectively. In 2017, ‘Peru’ and ‘Rojo’ (5.6%) reached the highest amounts of fructose and differed significantly from all other genotypes. In 2018, ‘Rojo’ and ‘BG’ (2.4%) reached the highest amounts of fructose und differed significantly from all other genotypes. All other seven genotypes did not differ from each other, but had significantly lower amounts of fructose than ‘Rojo’ and ‘BG’. The exception was ‘Peru’, which did not differ significantly from any genotype. In 2017, the genotypes ‘BG’, ‘Rojo’, ‘New Zealand’, and ‘Peru’ reached significantly higher amounts of fructose than in 2018. All other genotypes did not differ significantly between the years.
The amounts of glucose were significantly higher in 2017 than in 2018 and differed significantly between the genotype averages across the years (Table A1). In 2017, amounts ranged from 1.4 (‘RG’) to 5.5% (‘Peru’) and in 2018 from 1.3% (‘New Zealand’) to 4.4% (‘Early White’). Across years, genotypes ‘Rojo’, ‘Peru’, ‘Early White’, and ‘BG’ significantly reached the highest amounts of glucose and significantly differed partially from some of the other genotypes. The lowest amounts of glucose were reached by ‘Late Red’ with 1.5%.
Contrary to findings for the other monosaccharides, amounts of sucrose were significantly higher in 2018 than 2017. Genotypes ‘BG’, ‘Peru’, and ‘Early White’ reached the highest amounts of sucrose across both experimental years. ‘Late Red’ reached the lowest amount of sucrose (2.5%).
Considering the different fractions of FOS, amounts of GF2 were significantly higher in 2018 than 2017. In 2017, the amount of GF2 ranged from 1.3% (‘Rojo’) to 9.6% (‘BG’). Noticeably higher were the ranges. In 2018, the range of GF2 was from 10.4% (‘New Zealand’) to 24.0% (‘Peru’). The amount of GF3 was significantly higher in 2018 than in 2017. In 2017, amounts ranged from 1.7% (‘Rojo’) to 13.2% (‘BG’) and in 2018 from 11.4% (‘Rojo’) to 25.9% (‘RG’). Averages of genotypes across both experimental years showed significant differences. The genotype ‘Rojo’ reached significantly lower amounts of GF3 than all other genotypes. Furthermore, genotype ‘New Zealand’ differed significantly from ‘RG’. All other genotypes did not differ significantly from each other.
In 2017 GF4 ranged from 2.5% (‘Rojo’) to 9.0% (‘Morado’). ‘Rojo’ differed significantly from all other genotypes. All other genotypes were in a similar range and did not differ significantly from each other. In 2018, amounts ranged from 6.5% (‘Rojo’) to 15.3% (‘RG’). ‘RG’ reached the highest amounts of GF4 and differed significantly from all other genotypes. Similar to findings in GF2 and GF3, all genotypes reached significantly or noticeable higher amounts of GF4 in 2018 than 2017.
Total FOS were affected by year and by genotype. Similar to findings of single FOS, the amount of total FOS was significantly higher in 2018 than in 2017. In 2017, the amount of total FOS ranged from 5% (‘Rojo’) to 31.2% (‘BG’). In 2018, the range was from 30.6% (‘Rojo’) up to 58.3% (‘BG’). The average of genotypes across both experimental years showed that genotype ‘Rojo’ differed significantly from all other genotypes and reached the lowest amounts of total FOS. All other genotypes did not differ significantly from each other.
Total sugar amount was not affected by year nor by genotype. It ranged from 17.6% (‘Rojo’) to 44.5% (‘Peru’) and from 41.1% (‘Rojo’) to 66.0% (‘RG’) in 2017 and 2018, respectively. However there were no significant differences between the years, and all genotypes reached noticeable higher total sugar amounts in 2018 than in 2017.

4. Discussion

4.1. Tuber Yields

In 2017, tuber yields (t ha−1 FM) of the genotypes ‘RG’, ‘BG’, and ‘Morado’ were higher than the tuber yields reached under comparable climatic conditions in Czech Republic which ranged from 21.43 to 29.18 t FM ha−1 [24,25]. In general, tuber yields of yacon indicate a wide range depending on location, climatic conditions, and genotype, ranging from 13.4 to 90.0 t FM ha−1 [7,26]. In this regard, different planting densities used in various studies have to be taken into account. In the above described studies, plant densities were between 20,408 and 28,500 plants ha−1, which is noticeably higher than the plant density of 12,531 plants ha−1 in the present study [24,26]. Doo et al. reported that tuber yield increased with increasing plant density up to a plant density of 70 x 50 cm [27]. Therefore, tuber yields of the present study could be maximized by higher plant densities, even though yields were already quite high. Significant differences between tuber yields of various yacon genotypes were also reported by Fernández et al. and Kim and Koike et al. [24,28,29]. In the year 2018 of the present study, tuber yields of all genotypes were significantly lower, probably due to climatic conditions. During the cultivation period in 2018, temperatures were 2.6 °C higher and precipitation was 401 mm lower when compared to 2017. Especially the long-lasting period without significant rainfall events led to significantly lower tuber yields below expectations. Several other studies showed that an adequate precipitation of minimum 550 mm of water during the growing period is a key factor for exploiting the full yield potential of yacon [7,30]. This is similar to the findings of Fernández et al., who reported on average the lowest tuber yields in the year with the lowest precipitation [24]. This is also true for other tuberous root crops like Jerusalem artichoke and potato [31,32].
Determined tuber DM was within the normal range of 9.8 to 18.6% [14,33]. In accordance with lower tuber yields in 2018, DM content was similar or significantly higher in 2018 than 2017, which can also be attributed to the lower precipitation amount. The results are similar to the findings of Mastro et al., who also reported higher DM content in Jerusalem artichocke and chicory in years with lower precipitation [34]. Significant differences of DM content of yacon tubers between the genotypes were also reported in several other studies and seem to be a characteristic of each genotype [14,29,33].
Dry matter tuber yields (t ha−1 DM) were in a normal and partially above average range of 1.2 to 6.36 t ha−1. DM yields differed significantly between the years because of lower precipitation, as mentioned above. [7]. The genotype ‘RG’ especially attracted interest due to having the highest tuber yields (both FM and DM) and highest DM content. The DM content, and therefore DM tuber yield, is particularly important with regard to the intended processing. A high DM content is preferable due to higher outputs of sugar and dried products when considering e.g., powder, chips, or flour. For commercialization to the fresh market, the parameters number of tubers and average tuber weight are more important. With regards to other crops like sweet cassava or eggplant, there are clear restrictions for commercialization at the fresh market. Cassava must have a minimum weight of 300 g, and eggplant has to be uniform in size [35,36].
Currently, regulations for commercialization of yacon at fresh markets are really low with respect to size and weight [37]. With increasing demand and therefore increasing supply in fresh market, more regulations might arise. Besides the aspect of commercialization, number of tubers are a decisive factor for mechanization of harvesting. With increasing number of tubers per plant, the cut surface of each tuber decreases. While this is advantageous for harvest, because of an easier separation of tubers and rhizomes, it also meets commercialization regulations, as the cut surface is limited to a maximum size of 1 to 2.5 cm [37]. In general, the number of tubers per plant in the present study was in the normal range. Bredemann reached an average 14.4 tubers per plant in field trials in Germany [3]. Several other studies reported 6 to 12.5 tubers per plant [27,29]. However Douglas et al. achieved up to 27 tubers per plant, but with a higher plant density of 28,986 plants ha−1 [18]. Reasonable therefore are the increasing numbers of tubers per plant with increasing plant density [27]. Besides the plant density and precipitation, genotype is a relevant factor for the number of tubers per plant. All genotypes (except ‘Rojo’) had significantly lower number of tubers per plant in 2018, the year with lower precipitation. As the average single tuber weight did not show an effect of genotype × year interaction, it seems that plants compensate for lower precipitation by decreasing the number of tubers. This coincides with the findings of Douglas et al., who reported lower numbers of tubers per plant at lower precipitation [7]. Similar to that are the results of Onder et al. and Bélanger et al. who also reported a decreasing number of tubers with decreasing amount of water and a lower amount of tuber weight, respectively [38,39].
Average single tuber weights achieved in the present study were mainly above common values, ranging from 115 to 184 g, but similar to findings of Kamp et al., who reported single tuber weights up to 308 g in Central Europe [18,22,29]. Polreich reported a positive correlation between average single tuber weight and total tuber yield [40]. This goes along with the findings of the present study, as average single tuber weights across all genotypes were significantly lower in 2018 than 2017 as well as total tuber yields. Overall the study indicated significant differences between genotypes and the two experimental years.

4.2. Sugar Yield

Compared to other FOS containing crops, obtained sugar yields of the different genotypes were quite low. Jerusalem artichoke and chicory normally reach sugar yields ranging from 4.1 to 9.1 t ha−1 and 4 to 18 t ha−1, respectively [31,34]. This is primarily due to higher amounts of tuber yields. Similar to findings regarding the tuber yield formation in 4.1, sugar yield differed significantly between the genotypes as well. Genotypes ‘RG’, ‘BG’, and ‘Morado’ had the highest sugar yields in 2017 and showed also a huge decrease of sugar yield from 2017 to 2018. All other genotypes, except ‘Late Red’, showed no significant differences between the years. This might point to a sensitivity of these genotypes to water limiting conditions or, in the reverse direction, that the genotypes with significant differences between the years had a better water use efficiency. Precipitation is considered a key factor for tuber yield formation [24,41] and may be the major reason for the significant differences in sugar yield between the two experimental years. This is also true for Jerusalem artichoke und chicory [34,42]. Depending on the given climatic conditions some genotypes may be better adapted to drought and hot conditions than other genotypes. The given climatic differences of the Andean region with altitudes from sea level to 2000 m above sea level may result in different adaptations of the genotypes [43,44].
In general, sugar yield depends on the amount of tuber yield DM and sugar content. Therefore, both parameters have to be considered. Sugar yield was lower in years with lower precipitation due to lower tuber yields. However, the genotype ‘Rojo’ attracted attention due its significant lowest sugar yields, which was basically a result of low tuber yield, low DM%, and low sugar content. All other genotypes can be divided into two groups; ‘RG’, ‘BG’, and ‘Morado’ with high sugar yields and significant differences between the years, and all other genotypes with a similar sugar yield without significant differences between years (except ‘Late Red’).

4.3. Sugar Composition

The total sugar content of yacon tubers ranges commonly from 70% to 80% of DM, which is higher than the findings in the present study, but similar to findings of Kamp et al., who also reported total sugar contents ranging from 35% to 73% of DM, under comparable climatic conditions [6,11,23]. In general, more information on FOS content and monosaccharides than total carbohydrates are available. Reported FOS contents in literature ranged from 6.4% to 70% of DM, depending on genotype or cultivation site [6,10,33]. In general sugar fractions showed a wide range in the literature, because of different genotypes, cultivation practices, and storage conditions [2,14]. Reported ranges in literature are in range with the results of the present study. Also the FOS content of Jerusalem artichoke differed significantly between the genotypes [17]. This is similar to findings of the present study, where genotypes differed significantly across years. Higher FOS contents in 2018 can be explained by higher DM contents (3.1). This is similar to findings of Sprague et al., who reported higher sugar contents in Jerusalem artichoke in years with higher DM% due to lower precipitation and soil moisture [45]. Single fractions of FOS (GF2, GF3, and GF4) changed according to changes in total FOS content. Several findings in literature described a decreasing amount of total FOS with an increase of DP [2,15,46]. This is similar to findings of the present study, where in 2017, the year with lower FOS content, all genotypes had a higher percentage of FOS in GF3 or even GF4 (‘Rojo’). Whereas in 2018, the year with higher amounts of FOS, degree of polymerization approximately balanced between GF3 and GF2. This also points to a positive correlation between amount of sucrose and amount of FOS [2,8,47]. In 2018, amount of sucrose was significantly higher than in 2017 as well as the amount of FOS.
The amount of fructose was also widely dispersed and ranged from 0.6 to 21.6% of DM, depending on the chosen genotype [6,15,33]. In the present study, genotypes differed significantly in fructose content which ranged from really low (0.72% ‘Purple’ 2018) to rather high amounts (5.61% ‘Rojo’ 2017). All genotypes, except RG, had significantly higher amounts of fructose in 2017 than 2018. A similar trend was observed for glucose. In general, amounts of fructose reached in the present study were in a normal range from 0.9% to 9% of DM [6,15,33,46]. This is also true for sucrose, which normally ranged from 2.2 to 14% of DM [15,46]. The quantities of monosaccharides reached in the present study were similar to those reported by Khajehei et al., who also examined the genotypes ‘Early White’, ‘Late Red’, ‘Morado’, and ‘New Zealand’. The resulting order of genotypes regarding their amounts of fructose and glucose were similar to findings of Khajehei et al. [48]. Results in the present study indicated that mainly the genotypes with high amounts of fructose had the lowest amounts of total FOS. This is similar to findings of Herman et al., who reported a negative correlation between fructose and amount of fructans [33]. Overall, different sugar compositions may lead to different commercialization and food product development strategies. Genotypes with higher amounts of monosaccharides and FOS with average lower DP are preferable for the fresh market, because of the sweet taste and poor storability of FOS. During storage the amount of FOS decreases and the amount of monosaccharides duplicates [10]. The FOS contained in yacon tubers are really sensitive to storage conditions like temperature and humidity [49,50]. Therefore, genotypes like ‘Rojo’ and ‘Peru’ were preferable for the fresh market, because of already high amounts of monosaccharides at harvest and their sweet taste. During storage the amount of monosaccharides will further increase and health promoting benefits would potentially fade away. Besides sugar compositions, these genotypes were preferable for the fresh market due to the attractive color of the peel and products consisting thereof.
Beyond the appropriateness for the fresh market, the tested genotype ‘Peru’ offers both high amounts of monosaccharides and FOS which are beneficial due to a sweet taste and health promoting benefits. Therefore ‘Peru’ is considered to be a good choice for fresh market purposes regarding its sugar composition. However tuber yield was disregarded for this recommendation.
On the other side, the genotypes ‘BG’, ‘RG’, and ‘Morado’ seem to be potential good options for the processing industry, due to their high amounts of FOS. Certainly ‘Peru’ had high amounts of FOS, but predominant with lower DP.

5. Conclusions

The parameters tuber yield, sugar composition, and sugar content determine decisively the final sugar yield of yacon. The current study revealed that across all parameters (tuber yield, sugar composition, and sugar yield) the three genotypes ‘RG’, ‘BG’, and ‘Morado’ were outstanding and can be recommended for cultivation in Southwestern Germany due to highest amount of tuber yield, sugar yield, and FOS. The combination of high tuber yields and sugar content led to the highest sugar yields. Depending on the intended commercialization strategy, a certain genotype has to be chosen. The three genotypes ‘RG’, ‘Peru’, and ‘Morado’ are preferable for the fresh market, powder, or flour production because of lower single tuber weight and the color of peel. Red peel leads to optically attractive flour which can be commercialized in several ways. ‘BG’ was favorable for the processing industry. Also the fresh market could be possible, for example, for key accounts with larger demands, like gastronomy, etc.
With regard to sugar composition major differences in fructose and GF4 content were observed between genotypes. Genotypes with high amounts of fructose had lower amounts of GF4 and vice versa. Therefore different commercialization options are possible. In general, genotypes with higher amounts of monosaccharides and FOS with lower average DP seem to be favorable for fresh market purposes while genotypes with higher amounts of FOS and higher average DP can be recommended for the processing industry as they potentially withstand longer storage periods without total loss of quality.

Author Contributions

Conceptualization, L.K. and S.G.-H.; methodology, B.M. and L.K.; formal analysis, L.K.; investigation, L.K.; resources L.K. and S.G.-H.; data curation, L.K.; software, J.H; writing—original draft preparation, L.K.; writing—review and editing, S.G.-H.; visualization, L.K.; supervision, S.G.-H.; project administration, S.G.-H.; funding acquisition, S.G.-H.

Funding

This research was funded by the German Federal Ministry for Economic Affairs and Energy within the Central Innovation Program for SMEs, grant number 16KN050526.

Acknowledgments

The authors would like to thank the technical staff of the Experimental Station Ihinger Hof of the University of Hohenheim. The authors would also like to thank Fabian Görzgen from the department of biochemical and chemical engineering, TU Dortmund, for answering questions on sugar formation and composition.

Conflicts of Interest

The authors declare no conflict of interest. The funders had no role in the design of the study; in the collection, analysis, or interpretation of data; in the writing of the manuscript, or in the decision to publish the results.

Appendix A

Figure A1. α-Design of the field trials exemplary for the experimental year 2017 with three replicates and two blocks. For 2018 same design with new randomization were used. Replicates were complete, blocks were incomplete due to missing germination of one genotype. Each number represents one genotype. Genotype number 6 did not germinate and was therefore deleted from the analysis.
Agronomy 09 00301 g0a1
Table A1. Results of a multiple t-test at a significance level of 5% after finding significant differences via global F-test for the factor genotype across both experimental years. Same lower case letters indicate non-significant differences between genotypes.
GenotypeSingle Tuber Weight (g)Glucose (%)Sucrose (%)GF3 (%)Total FOS (%)
’BG’267.4a3.29ab5.12a16.29ab40.72a
‘RG‘223.7ac1.71c3.24bc18.56a41.37a
‘Morado’205.9bc2.38bc2.98bc16.04ab37.04a
‘Rojo’172.1cd3.71a3.04bc 6.55c17.83b
‘New Zealand’175.3cd2.19c2.58c13.30b30.61a
‘Peru’231.8ab4.56a5.44a15.16ab39.04a
‘Late Red’144.8d1.50c2.52c16.42ab35.60a
‘Early White’223.7ac3.67a4.10ab15.48ab34.63a
‘Purple’185.3bcd2.21bc3.22bc14.30ab31.05a
Table A2. ANOVA table (replication = REP; genotype = G; year = year; degree of freedom (DF) and p-value) carried out for sugar yield (t ha−1) according to Figure 2.
FactorDFp-Value for the F-test of the Corresponding Factor
Year × Rep40.1666
G8<0.0001
Year10.0002
Year × G80.0001

References

  1. Hermann, M. Andean Roots and Tubers: Ahipa, Arracacha, Maca and Yacon; International Plant Genetic Resources Institute: Rome, Italy, 1997; Volume 21, pp. 191–243. [Google Scholar]
  2. Ohyama, T.; Ito, O.; Yasuyoshi, S.; Ikarashi, T.; Minamisawa, K.; Kubota, M.; Tsukihashi, T.; Asami, T. Composition of storage carbohydrate in tubers of yacon (Polymnia sonchifolia). Soil Sci. Plant Nutr. 1990, 36, 167–171. [Google Scholar] [CrossRef]
  3. Bredemann, G. Über Polymnia Sonchifolia Poepp. et Endl. (P. edulis Wedd.), die Yacon - Erdbirne; Botanische Oeconomie: Hamburg, Germany, 1948; pp. 65–85. [Google Scholar]
  4. Zardini, E. Ethnobotanical notes on “Yacon” Polymnia sonchifolia (Asteraceae). Econ. Bot. 1991, 40, 72–85. [Google Scholar] [CrossRef]
  5. Fernández, E.C.; Viehmannova, I.; Bechyne, M.; Lachman, J.; Milella, L. The cultivation and phenological growth stage of yacon [Smallanthus Sonchifolius (Poepp. et Endl.) H. Robinson]. Agric. Trop. Et. Subtrop. 2007, 40, 71–77. [Google Scholar]
  6. Delgado, G.T.C.; Tamashiro, W.M.d.S.C.; Marostica, M.R., Jr.; Pastore, G.M. Yacon (Smallanthus sonchifolius): A functional food. Plant Foods Hum. Nutr. 2013, 68, 222–228. [Google Scholar] [CrossRef] [PubMed]
  7. Douglas, J.A.; Follett, J.M.; Douglas, M.H.; Deo, B.; Scheffer, J.J.C.; Littler, R.A.; Manley-Harris, M. Effect of environment and time of planting on the production and quality of yacon (Smallanthus sonchifolius) storage roots. N. Z. J. Crop. Hor. Sci. 2007, 35, 107–116. [Google Scholar] [CrossRef]
  8. Valentova, K.; Lebeda, A.; Dolezalova, I.; Jirovsky, D.; Simonovska, B.; Vovk, I.; Kosina, P.; Gasmanova, N.; Dziechciarkova, M.; Ulrichova, J. The biological and chemical variability of yacon. J. Agric. Food Chem. 2006, 54, 1347–1352. [Google Scholar] [CrossRef] [PubMed]
  9. Manrique, I.; Parraga, A.; Hermann, M. Yacon Syrup: Principles and Processing. Available online: http://cipotato.org/wp-content/uploads/2014/07/1919-Yacon_Syrup.pdf (accessed on 19 July 2014).
  10. Graefe, S.; Hermann, M.; Manrique, I.; Golombek, S.; Buerkert, A. Effects of post-harvest treatments on the carbohydrate composition of yacon roots in the Peruvian Andes. Field Crop. Res. 2004, 86, 157–165. [Google Scholar] [CrossRef] [Green Version]
  11. Lachman, J.; Fernández, E.C.; Orsák, M. Yacon [Smallanthus sonchifolia (Poepp. et Endl.) H. Robinson] chemical composition and use – a review. Plant Soil Environ. 2003, 49, 283–290. [Google Scholar] [CrossRef]
  12. Goto, K.; Fukai, K.; Hikida, J.; Nanjo, F.; Hara, Y. Isolation and Structural Analysis of Oligosaccharides from Yacon (Polymnia sonchifolia). Biosci. Biotechnol. Biochem. 2014, 59, 2346–2347. [Google Scholar] [CrossRef]
  13. de Almeida Paula, H.A.; Abranches, M.V.; de Luces Fortes Ferreira, C.L. Yacon (Smallanthus sonchifolius): A food with multiple functions. Crit. Rev. Food Sci. Nutr. 2015, 55, 32–40. [Google Scholar] [CrossRef]
  14. Campos, D.; Betalleluz-Pallardel, I.; Chirinos, R.; Aguilar-Galvez, A.; Noratto, G.; Pedreschi, R. Prebiotic effects of yacon (Smallanthus sonchifolius Poepp. & Endl), a source of fructooligosaccharides and phenolic compounds with antioxidant activity. Food Chem. 2012, 135, 1592–1599. [Google Scholar] [CrossRef] [PubMed]
  15. Fukai, K.; Miyazaki, S.; Nanjo, F.; Hara, Y. Distribution of carbohydrates and related enzyme activities in yacon (Polymnia Sonchifolia). Soil Sci. Plant Nutr. 1993, 39, 567–571. [Google Scholar] [CrossRef]
  16. Campbell, J.M.; Bauer, L.L.; Fahey, G.C.; Hogarth, A.J.C.L.; Wolf, B.W.; Hunter, D.E. Selected Fructooligosaccharide (1-Kestose, Nystose, and 1 F -β-Fructofuranosylnystose) Composition of Foods and Feeds. J. Agric. Food Chem. 1997, 45, 3076–3082. [Google Scholar] [CrossRef]
  17. Slimestad, R.; Seljaasen, R.; Meijer, K.; Skar, S.L. Norwegian-grown Jerusalem artichoke (Helianthus tuberosus L.): morphology and content of sugars and fructo-oligosaccharides in stems and tubers. J. Sci. Food Agric. 2010, 90, 956–964. [Google Scholar] [CrossRef] [PubMed]
  18. Douglas, J.A. Maximising fructo-oligosacharide production in yacon. Agron. N. Z. 2002, 32, 49–55. [Google Scholar]
  19. de Andrade, E.F.; Leone, R.d.S.; Ellendersen, L.N.; Masson, M.L. Phenolic profile and antioxidant activity of extracts of leaves and flowers of yacon (Smallanthus sonchifolius). Ind. Crop. Prod. 2014, 62, 499–506. [Google Scholar] [CrossRef]
  20. Leidi, E.O.; Altamirano, A.M.; Mercado, G.; Rodriguez, J.P.; Ramos, A.; Alandia, G.; Sørensen, M.; Jacobsen, S.-E. Andean roots and tubers crops as sources of functional foods. J. Funct. Foods 2018, 51, 86–93. [Google Scholar] [CrossRef] [Green Version]
  21. IUSS Working Group WRB. World Reference Base for Soil Resources 2006. Ein Rahmen für Internationale Klassifikation, Korrelation und Kommunikation. Erstes Update 2007. Deutsche Ausgabe; BGR: Hannover, Germany, 2008; ISBN 978-3-00-024824-5. [Google Scholar]
  22. Kamp, L.; Hartung, J.; Mast, B.; Graeff-Hönninger, S. Plant growth, tuber yield formation and costs of three different propagation methods of yacon (Smallanthus sonchifolius). Ind. Crop. Prod. 2019, 132, 1–11. [Google Scholar] [CrossRef]
  23. Kamp, L.; Hartung, J.; Mast, B.; Graeff-Hönninger, S. Impact of Nitrogen Fertilization on Tuber Yield, Sugar Composition and Nitrogen Uptake of Two Yacon (Smallanthus Sonchifolius Poepp. & Endl.) Genotypes. Agronomy 2019, 9, 151. [Google Scholar] [CrossRef]
  24. Fernández, E.C.; Viehmannová, I.; Bechyne, M.; Lachman, J.; Milella, L. Yacon [Smallanthus sonchifolius (Poeppig & Endlicher) H. Robinson]: A new crop in the Central Europe. Plant Soil Environ. 2006, 12, 564–570. [Google Scholar]
  25. Leemans, R.; Cramer, W. The IIASA Database for Mean Monthly Values of Temperature, Precipitation and Cloudiness on a Global Terrestrial Grid; Research Report; IIASA: Laxenburg, Austria, 1991; Volume 61, p. RR-91-018. [Google Scholar]
  26. Doo, H.S. Response of Different Seedlings to Growth and Yield in Yacon. Korean J. Crop Sci. 2002, 5, 356–360. [Google Scholar]
  27. Doo, H.S. Effect of Plant Density on Growth Response and Yield in Yacon. Korean J. Crop Sci. 2001, 10, 407–410. [Google Scholar]
  28. Kim, S.J. Domestic and Overseas Status and Future Trends of Yacon Production. Korean J. Int. Agric. 2012, 24, 417–424. [Google Scholar]
  29. Koike, A.; Murata, T.; Matsuda, Y.; Masuoka, C.; Okamoto, C.; Kabata, K. Cultivation and ensilage of yacon plants (Smallanthus sonchifolius [Poepp. & Endl.] H. Robinson) and the function of yacon silage. Grassl. Sci. 2009, 55, 6–10. [Google Scholar] [CrossRef]
  30. Cabrera, M.V. Manual del cultivo de yacon. Productores y mercados Del. Agro. De. La. Sierra. 2005. Available online: https://www.google.com/url?sa=t&rct=j&q=&esrc=s&source=web&cd=11&ved=2ahUKEwjIsLj8wN7iAhUF3aQKHceUBHgQFjAKegQIABAC&url=http%3A%2F%2Fwww.asocam.org%2Fsites%2Fdefault%2Ffiles%2Fpublicaciones%2Ffiles%2F74455093814a213d6976637f4f71ad5f.pdf&usg=AOvVaw3gvGyIMlYKr97e2OlelbDn (accessed on 10 June 2019).
  31. Losavio, N.; Lamascese, N.; Vonella, A.V. Water requirements and nitrogen fertilization in jerusalem artichoke (Helianthus tuberosus L.) grown under mediterranean conditions. Acta Hortic. 1997, 1, 205–209. [Google Scholar] [CrossRef]
  32. Müller, S.; Beer, K. The relationships between soil inorganic nitrogen levels and nitrogen fertilizer requirements. Agric. Ecosyst. Environ. 1986, 17, 199–211. [Google Scholar] [CrossRef]
  33. Hermann, M.; Freire, I.; Pazos, C. Compositional Diversity of the Yacon Storage Root. Impact Chang. World Program Rep. 1997, 98, 425–432. [Google Scholar]
  34. de Mastro, G.; Manolio, G.; Marzi, V. Jerusalem artichoke (Helianthus tuberosus L.) and chicory (Chicorium intybus L.): Potential crops for inulin production in the mediterranean area. Acta Hortic. 2004, 365–374. [Google Scholar] [CrossRef]
  35. FAO. Standard for Aubergines. 2018. Available online: http://www.fao.org/fao-who-codexalimentarius/codex-texts/list-standards/en/ (accessed on 10 June 2019).
  36. Brisco; Gracia. STANDARD FOR SWEET CASSAVA. CODEX STAN 238-2003. 2003. Available online: http://www.fao.org/fao-who-codexalimentarius/codex-texts/list-standards/en/ (accessed on 10 June 2019).
  37. FAO. Regional Standards for Yacon. 2017. Available online: http://www.fao.org/fao-who-codexalimentarius/codex-texts/list-standards/en/ (accessed on 10 June 2019).
  38. Onder, S.; Caliskan, M.E.; Onder, D.; Caliskan, S. Different irrigation methods and water stress effects on potato yield and yield components. Agric. Water Mgmt. 2005, 73, 73–86. [Google Scholar] [CrossRef]
  39. Bélanger, G.; Walsh, J.R.; Richards, J.E.; Milburn, P.H.; Ziadi, N. Nitrogen fertilization and irrigation affects tuber characteristics of two potato cultivars. Am. J. Potato Res. 2002, 79, 269–279. [Google Scholar] [CrossRef]
  40. Polreich, S. Establishment of a Classification Scheme to structure the Establishment of a Classification Scheme to structure the Post-Harvest Diversity of Yacon Storage Roots (Smallanthus sonchifolius (Poepp. & Endl.) H. Robinson). Master’ Thesis, University of Kassel, Kassel, Germany, 2003. [Google Scholar]
  41. Douglas, J.A. Research and Development of Yacon Production in New Zealand. Acta Hortic. 2005, 670, 79–85. [Google Scholar] [CrossRef]
  42. Meijer, W.J.M.; Mathijssen, E.W.J.M.; Borm, G.E.L. Crop characteristics and inulin production of jerusalem artichoke and chicory. Stud. Plant Sci. 1993, 1991, 29–38. [Google Scholar]
  43. FAO. Ecuador Country Profile. Available online: http://www.fao.org/countryprofiles/index/en/?iso3 = ECU (accessed on 10 April 2019).
  44. FAO. Peru Country Profile. Available online: http://www.fao.org/countryprofiles/index/en/?iso3 = PER (accessed on 10 April 2019).
  45. Sprague, H.B.; Farris, N.F.; Colby, W.G. Effect of Soil Conditions and Treatment on Yields of Tubers and Sugar from the American Artichoke (Helianthus tuberosus). J. Am. Soc. Agrono. 1935, 392–399. [Google Scholar] [CrossRef]
  46. Delgado, G.T.C.; Thomé, R.; Gabriel, D.L.; Tamashiro, M.S.C.; Pastore, G.M. Yacon (Smallanthus sonchifolius)-derived fructooligosaccharides improves the immune parameters in the mouse. Nutr. Res. 2012, 32, 884–892. [Google Scholar] [CrossRef]
  47. Lebeda, A.; Dolezalova, I.; Valentova, K.; Gasmanova, N.; Dziechciarkova, M.; Ulrichova, J. Yacon (Smallanthus sonchifolius) - A traditional crop of the Andean Indians as a challenge for the future - The news about biological variation and chemical substances content. Acta Hortic. 2008, 127–136. [Google Scholar] [CrossRef]
  48. Khajehei, F.; Merkt, N.; Claupein, W.; Graeff-Hoenninger, S. Yacon (Smallanthus sonchifolius Poepp. & Endl.) as a Novel Source of Health Promoting Compounds: Antioxidant Activity, Phytochemicals and Sugar Content in Flesh, Peel, and Whole Tubers of Seven Cultivars. Molecules 2018, 23. [Google Scholar] [CrossRef]
  49. Doo, H.S. Changes of chemical composition in tuberous root of yacon by different curing conditions. Korean J. Crop. Sci. 2000, 45, 79–82. [Google Scholar]
  50. Minamisawa, K. Fluctuations of oligofructan contents in tubers of yacon (Polymnia sonchifolia) during growth and storage. Jpn. Soc. Soil Sci. Plant Nutr. 1991, 43, 621–627. [Google Scholar]
Figure 1. Temperature (●) and precipitation (bars) at the trial site Ihinger Hof for the cultivation period of yacon in 2017 (a) and 2018 (b). Plotted are the average temperatures in degree Celsius and the total rainfall in mm in each month. Temperature and precipitation in May and November (2017) and May and October (2018) include days within the cultivation period only.
Agronomy 09 00301 g001
Figure 2. Sugar yield (t ha−1) for the two years (2017 monochrome and 2018 pattern) of the nine genotypes at harvest. Same lower case letters indicate no significant differences between the genotypes within one year. Same capital letters indicate no significant differences between one genotype across the years.
Agronomy 09 00301 g002
Table 1. Tuber fresh matter yield (t ha−1 FM), tuber dry matter (DM in %), tuber dry matter yield (t ha−1 DM), mean number of tubers (per plant), and average single tuber weight (g) for the two years (2017 and 2018) of the nine genotypes (’BG’, ‘RG’, ‘Morado’, ‘Rojo’, ‘New Zealand’, ‘Peru’, ‘Late Red’, ‘Early White’, and ‘Purple’) at harvest as mean value ± standard error.
GenotypeTuber Yield (t ha−1 FM)DM (%)Tuber Yield (t ha−1 DM)Number of Tubers (per Plant)Tuber Weight (g)
2017
BG43.54aA ± 3.311.01efB ± 0.54.68bA ± 0.411.1bcA ± 1.0314.00 ± 29.4
RG46.60aA ± 3.316.14aA ± 0.57.59aA ± 0.414.8aA ± 1.0265.32 ± 29.4
Morado41.66aA ± 3.315.50abA ± 0.56.44aA ± 0.414.2aA ± 1.0236.34 ± 29.3
Rojo22.94bcA ± 3.311.35eB ± 0.52.67dA ± 0.47.8dA ± 1.0252.75 ± 29.4
New Zealand30.66bA ± 3.313.41cdB ± 0.54.08bcA ± 0.413.1abA ± 1.0197.7 ± 29.4
Peru27.16bcA ± 3.39.40fB ± 0.52.58dA ± 0.48.5cdA ± 1.0288.17 ± 29.7
Late Red19.21cA ± 3.314.23bcA ± 0.52.76dA ± 0.49.3cdA ± 1.0174.9 ± 29.4
Early White23.71bcA ± 3.312.43deA ± 0.52.97cdA ± 0.48.3dA ± 1.0231.9 ± 29.4
Purple21.91bcA ± 3.314.39bcB ± 0.53.10cdA ± 0.49.7cdA ± 1.0202.99 ± 30.1
2018
BG12.75aB ± 1.014.03cA ± 0.61.76bcB ± 0.25.2cB ± 0.6220.72 ± 26.6
RG11.75aB ± 1.016.03bA ± 0.61.89abB ± 0.25.6bcB ± 0.6182.01 ± 26.0
Morado10.85aB ± 1.017.03abA ± 0.61.84abB ± 0.25.8bcB ± 0.6175.48 ± 26.0
Rojo6.55bB ± 1.013.46cdA ± 0.60.88eB ± 0.26.8abA ± 0.691.43 ± 26.6
New Zealand12.36aB ± 1.017.71aA ± 0.62.22aB ± 0.27.9aB ± 0.6152.8 ± 27.4
Peru11.36aB ± 1.012.02dA ± 0.61.35cdB ± 0.25.7bcB ± 0.6175.38 ± 26.0
Late Red6.46bB ± 1.015.84bA ± 0.61.01deB ± 0.25.1cB ± 0.6114.73 ± 26.0
Early White11.56aB ± 1.013.59cdA ± 0.61.57bcB ± 0.25.7bcB ± 0.6215.45 ± 26.0
Purple10.06aB ± 1.016.49abA ± 0.61.66bcB ± 0.25.7bcB ± 0.6167.6 ± 26.0
Results of statistical analysis
FactorDFp-value for the corresponding F test
Year*Rep40.43840.01870.43520.92080.9241
G1<0.00010.9366<0.0001<0.00010.0003
year1<0.0001<0.0001<0.0001<0.00010.0032
Year*G1<0.00010.0020<0.0001<0.00010.2237
ANOVA table (replication = Rep; genotype = G, year = year, degree of freedom (DF), and p-value) carried out for tuber yield (t ha−1 FM), tuber DM (%), tuber yield (kg ha−1 DM), mean number of tubers (per plant), and average single tuber weight (g). Within years, same lower case letters in one column indicate non-significant differences between genotypes at p < 0.05. Within each genotype, same capital letters in one column indicate non-significant differences between years at p < 0.05.
Table 2. Fructose, glucose, sucrose, kestose (GF2), nystose (GF3), and fructofuranosylnystose (GF4), total fructooligosaccharides (FOS) and total sugar content in % of DM for the two years (2017 and 2018) of the nine genotypes at harvest as mean value ± standard error.
GenotypeFructoseGlucoseSucroseGF2GF3GF4Total FOSTotal Sugars
2017
BG3.84bA ± 0.64.04 ± 0.64.00 ± 0.29.61 ± 0.913.21 ± 1.37.96acA ± 0.931.23 ± 2.941.43 ± 2.3
RG0.86cA ± 0.61.36 ± 0.61.97 ± 0.25.24 ± 0.911.21 ± 1.37.93acB ± 0.924.48 ± 3.028.67 ± 2.3
Morado1.13cA ± 0.62.58 ± 0.62.14 ± 0.25.10 ± 0.911.12 ± 1.38.98aB ± 0.925.58 ± 2.939.85 ± 2.3
Rojo5.61aA ± 0.63.97 ± 0.61.33 ± 0.21.30 ± 0.91.71 ± 1.32.47dB ± 0.95.05 ± 2.917.63 ± 2.3
New Zealand2.52bcA ± 0.63.08 ± 0.62.36 ± 0.25.19 ± 0.98.81 ± 1.36.78acB ± 0.920.68 ± 3.028.62 ± 2.3
Peru5.91aA ± 0.65.54 ± 0.64.34 ± 0.210.12 ± 0.912.23 ± 1.36.26cA ± 0.928.72 ± 3.044.52 ± 2.3
Late Red1.84cA ± 0.61.62 ± 0.61.98 ± 0.24.90 ± 0.912.61 ± 1.38.68abA ± 0.926.31 ± 3.031.76 ± 2.3
Early White2.39bcA ± 0.62.98 ± 0.62.96 ± 0.27.26 ± 0.912.57 ± 1.36.43bcA ± 0.925.81 ± 2.935.82 ± 2.3
Purple1.75cA ± 0.62.98 ± 0.62.97 ± 0.25.96 ± 0.911.25 ± 1.36.61bcB ± 0.923.77 ± 2.931.36 ± 2.3
2018
BG2.44aB ± 0.32.55 ± 0.56.23 ± 0.821.56 ± 4.519.37 ± 3.09.74deA ± 0.850.22 ± 8.062.01 ± 8.2
RG1.08bA ± 0.32.07 ± 0.54.51 ± 0.816.99 ± 4.525.91 ± 3.015.34aA ± 0.858.26 ± 8.066.02 ± 8.2
Morado0.86bA ± 0.32.18 ± 0.53.83 ± 0.814.51 ± 4.520.95 ± 3.013.05bA ± 0.848.49 ± 8.055.27 ± 8.2
Rojo2.89aB ± 0.33.45 ± 0.54.75 ± 0.812.54 ± 4.511.39 ± 3.06.49fA ± 0.830.62 ± 8.041.12 ± 8.2
New Zealand0.67bB ± 0.31.32 ± 0.52.80 ± 0.810.39 ± 4.517.78 ± 3.012.35bcA ± 0.840.54 ± 8.045.41 ± 8.2
Peru1.80abB ± 0.33.57 ± 0.56.54 ± 0.824.00 ± 4.518.09 ± 3.07.80dfA ± 0.849.37 ± 14.362.39 ± 8.2
Late Red0.43bB ± 0.31.37 ± 0.53.06 ± 0.813.66 ± 4.520.23 ± 3.010.75cdA ± 0.844.86 ± 8.049.62 ± 8.2
Early White1.27bA ± 0.34.35 ± 0.55.24 ± 0.816.28 ± 4.518.39 ± 3.08.26efA ± 0.843.44 ± 10.053.80 ± 8.2
Purple0.72bA ± 0.31.44 ± 0.53.48 ± 0.811.08 ± 4.517.36 ± 3.09.68deA ± 0.838.32 ± 8.043.40 ± 8.2
Results of statistical analysis
FactorDFp-Value for the F test of the corresponding factor
Year*Rep40.98280.97520.20290.40300.92090.91790.8986<0.0001
G1<0.00010.00020.00090.18130.0025<0.00010.02360.3929
year10.00060.04670.00140.00150.00090.00190.00110.0553
Year*G10.01800.07840.19400.93660.64210.00950.87700.6907
ANOVA table (replication = REP; genotype = G; year = year; degree of freedom (DF) and p-value) carried out for the sugar fractions GF4, GF3, GF2, sucrose, fructose, glucose, total FOS, and total sugar content in % of DM. Within years, same lower case letters in one column indicate no significant difference between genotypes at p < 0.05. Across years, same capital letters in one column indicate no significant differences between one genotype between the years at p < 0.05.

