Abstract
Teff is the only cultivated cereal crop from the genus Eragrostis and it is the major staple food of Ethiopians. In Ethiopia, the quality of teff and its market price are primarily determined by its grain color. The objective of this study was to evaluate the effects of soil physicochemical characteristics across multiple locations in the two main teff growing regions of Amhara and Oromia states in Ethiopia on teff grain color and nutritional quality of a single variety. Grain and soil samples were collected from 24 field sites cultivated with the popular teff variety ‘Quncho’ (DZ-Cr-387/RIL-355). The teff grain samples collected from the 24 locations were evaluated for grain color, proximate composition, amino acid composition, and grain mineral concentration and the soil samples were analyzed for their physicochemical properties. Sample location means were considered different p < 0.05. Teff grain color indices of hue (H), saturation (S), and brightness (V), grain proximate composition, amino acid composition, and mineral concentration differed among locations (p < 0.05). There were significant negative correlations between grain S color value and soil pH, SOC, Ca, Mg, S, and Na. Soils with greater pH, SOC, Ca, Mg, and S generally had lower S values and thus, whiter color teff grains. There were considerable variations in the measured parameters for soil and teff grain physicochemical properties. The results indicated an opportunity for management interventions necessary to obtain uniformity in grain color and chemical composition for the same variety of teff grown in the two major regions in Ethiopia.
1. Introduction
Teff [Eragrostis Tef (Zucc.) Trotter] is the only cultivated cereal crop from the genus Eragrostis [1,2,3,4]. It is believed that pre-semantic inhabitants of the Ethiopian highlands domesticated teff around 4000 BC as a food crop [1,5,6] and it has served as the major staple food for Ethiopians for thousands of years.
In Ethiopia, the main teff-producing areas have been concentrated in the Amhara and Oromia regional states (the northwestern and central highlands of Ethiopia). Teff cultivation in Amhara and Oromia regional states covered 1.45 (47.8%) and 1.14 million ha (37.6%) of land, respectively, for a combined 2.59 million ha or 87.5% of the total teff cultivation in Ethiopia during the 2017 to 2018 main growing season [7]. Teff grain production from these two main cultivated regions of Amhara and Oromia states were 2.6 (48.9%) and 2.04 million tons (38.6%), respectively, for a total of 4.64 million tons or 87.5% of the total teff production in Ethiopia during the 2017 to 2018 main growing season [7]. Teff grain production ranged from 0.84 to 1.75 tons per hectare annually in Ethiopia depending on location of cultivation and agronomic practices [7]. Almost all the teff grain produced in Ethiopia is mainly used for local consumption in the form of “injera” (a thin, malleable, with many eyes, fermented bubbly spongy type Ethiopian bread) [8].
The major determinants of quality variation of cereal grains are derived from the nutrient composition and physical attributes of the grain [9]. The grain color of teff varies from pale white to ivory white, light tan to dark brown to reddish-brown purple [10,11,12] and in Ethiopia, the quality of teff grain is determined primarily by its physical attribute of color [13,14]. There are four major categories of teff grain colors specified by the Ethiopian Standard Agency (ESA) and the grains are classified as very white (magna), white (nech), mixed (sergegna) and brown (key) teff [13]. In Ethiopia, grain color is a measure of quality that also dictates the market demand and value. The very white and white teff fetches the highest price and is consumed by the wealthiest individuals whereas, the brown teff is sold at a lower price to low-income communities [8,15,16,17]. In Ethiopia, the production area and soil type which is closely correlated with grain color, are intricately linked to the market price of teff grain [8,18,19]. For example, teff cultivated on black and brown soils in Ethiopia has brighter grain color than those produced on red soils and are most preferred by consumers and traders [19]. However, even with the same grain color, there has been a wide range of variability in the nutrient content reported for teff [20,21,22].
Further, teff has been proposed as an important dietary source of mineral nutrients to combat malnutrition for the populace of developing nations [22]. In particular, the concentrations of calcium, iron, copper, zinc, carbohydrates, and fiber are generally greater than those of other cereal crops [21,23]. Micronutrients such as iron and zinc are considered the most limiting nutrients for children in many communities in developing countries [24] and teff may be the ideal crop for biofortification as a sustainable and cost-effective strategy to curtailed micronutrient malnutrition that affects approximately 2 billion people globally [25,26]. Further, among female athletes from developing nations, only Ethiopian athletes are free of anemia and this was attributed to the consumption of teff [27]. Teff has the potential in reducing iron deficiency anemia diseases by its iron richness [21,28,29] and it is also reported to have a complete set of essential amino acids with excellent composition [21,30,31,32,33] and richer in lysine than most other cereals [34].
The qualitative value of teff as a gluten-free grain combined with its nutritional value and health benefits have attracted global interest in its consumption [14,35,36,37]. Compared to the other major cereal crops, the crude protein, crude fiber, fat and starch concentrations of teff grain are either similar or superior to those of maize, oat, sorghum, wheat and quinoa (false cereal) in general [38]. Globally, the demand for teff grain has increased over the last decade due to the many health benefits of this gluten-free product and as a result of the demand, the Ethiopian government has prohibited the export of teff grain raw material to ensure food security and protection of local markets in Ethiopia. However, the government of Ethiopia did not place a ban on value-added teff hence, teff bread (injera) is exported to the Middle East, Europe, and the United States of America [39].
It is possible that the reported variability in the nutrient content of teff in Ethiopia could be attributed to environmental factors (climatic and edaphic variations) rather than genetic variations. However, there are no studies that have reported on the influence of different environmental factors on variability in teff grain quality in Ethiopia. Most reported research focused on teff nutritional quality based on color [21,22,30,40] and did not address the influence of environmental factors on grain nutritional composition. Therefore, the objective of this study was to evaluate the effects of soil physicochemical characteristics across multiple locations in the main teff growing regions of Ethiopia on teff grain color and nutritional quality of a single variety.
2. Materials and Methods
2.1. Description of the Study Area
This study was carried out in 24 major teff producing areas of Amhara and Oromia regional states of Ethiopia (northwestern and central highlands of Ethiopia, respectively). The specific locations and known names listed in parentheses were Abrja (Denbia), Abshem (Debre-Elias), Adet 1, Adet 2, Akaki, Alemtena, Arerti 1 (Minjar), Arerti 2 (Minjar), Atsedemariam (Este), Bichena, Birzakani (Metekel), Bishoftu (Ad’a), Bitiejersalafo (Welenkomi), Demdengay (Gonj-Kollela), Fetlokuskuam (Yilmana Densa), Gejagedanba (Sebeta), Gumdri (Dangila), Simada (Simada), Kosheshila (Shebel), Kudmi (Mecha), Motta, Wondata (Bahir Dar), Yubodegabati (Dedi), and Zenzelima (Bahir Dar) (Figure 1).
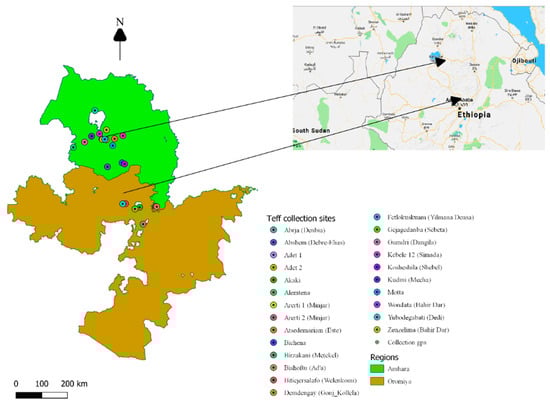
Figure 1.
Grain and soil collection sites in the two main teff growing regions of Amhara and Oromia states in Ethiopia.
The areas were selected based on their variability of altitude (1670–2570 m above sea level), soil types (Nitisols–Vertisols), annual rainfall amount (1000–1960 mm) and temperatures (Table 1). Maximum temperatures range from 39.5 °C at Debre Elias to 29 °C at Motta with a minimum temperature of 9.8 °C at Debre Elias to −1.5 °C at Dangla. Rainfall amount varies from 1964 mm (Debre Elias) to 779 mm (Bishoftu) (Table 1). The areas were also selected from the two regions based on the information gained from Addis Ababa and other regional markets surveyed [19] and from personal communication with researchers and zonal agricultural experts.

Table 1.
Altitude, rainfall, minimum and maximum temperatures of the two main teff growing regions of Amhara (northwestern highlands) and Oromia (central highlands) in Ethiopia.
2.2. Data Collection, Grain and Soil Nutrient Analysis
At each of the 24 field sites, the popular teff variety named ‘Quncho’ (DZ-Cr-387/RIL-355) was earmarked for grain collection due to its white grain color, adaptability to the different agro-ecological zones, and its widespread cultivation across Ethiopia [41]. The recommended fertilizer rate for Vertisols, in Ethiopia, is 60 kg N and 80 kg P2O5 ha−1 by Debre Zeit Agricultural Research Center and for Nitisols (red soils), is 40 kg N and 60 kg P2O5 ha−1 by Adet Agricultural Research Center (AARC) in Ethiopia. Diammonium phosphate (DAP) and urea fertilizer materials are the typical sources of the nutrients. While DAP is usually applied once at the time of sowing, split application of urea is the general N management practice, one half at sowing and the other at early tillering. However, in the study areas, the extent to which farmers follow these fertilizer recommendations is not verifiable.
Grain sampling was carried out at each of the selected field site (approximately 1 ha in size) and a total of five 1-m2 quadrat samples were collected randomly along a diagonal transect across the field at fixed steps intervals at the time of harvest or physiological maturity (November to December, 2017). The five quadrats samples from each field were then stored separately in a moisture-free area in preparation for seed cleaning. The samples were hand threshed inside cloth bags in order to reduce soil contamination. The threshed grain samples were then manually cleaned by sifting and winnowing to remove dust, chaff, and other materials.
Soil samples were randomly collected down to a depth of 20 cm from each field site at the time of grain sampling using a 1.9-cm diameter probe and composited. Further, independent undisturbed core soil samples were taken for bulk density determination to help in soil characterization. The collected samples for soil nutrient analysis were air-dried while those for bulk density determination were oven-dried at 110 °C for 24 h at the Adet Agricultural Research Center Soils Laboratory. The soil samples were then ground and sieved through a 2-mm screen before chemical analysis. The soil pH, soil organic carbon (SOC) and cation exchanging capacity (CEC) were determined at the same Laboratory. Total nitrogen (TN) was determined using the Kjeldahl method [42] at Horticoop Soil and Water lab, Bishoftu, Ethiopia. The soil color at each site was determined using the Munsell color chart in dry soil bases. Each sample was analyzed in triplicates for macro and micronutrients (phosphorus (P), potassium (K), calcium (Ca), magnesium (Mg), sulfur (S), iron (Fe), manganese (Mn), zinc (Zn), copper (Cu), molybdenum (Mo), and sodium (Na)) using the Mehlich 3 extraction method (0.2M CH3COOH, 0.25M NH4NO3, 0.015M NH4F, 0.013M HNO3, and 0.001M EDTA adjusted to pH 2.5) [43]. The soil samples were analyzed using inductively coupled plasma atomic emission spectroscopy (Spectro CIROS ICP–AES, Spectro Analytical Instruments, Kleve, Germany).
Grain color images were captured using a Tecno-Camon mobile 24 mm pixel camera (Techno Mobile, Hong Kong). The images were first analyzed using RGB (red, green, blue) color detector free software. The RGB color was then converted to HSV (hue, saturation, and value) by RGB to HSV color converter software. The preference for HSV color space was out of the ease of understanding color with the human eyes than other color spaces [44,45]. Ibraheem et al. [45] and Deswal and Sharma [44] described HSV color space as H (hue) measures the purity of a particular color, S (saturation) measures the degree of white color embedded in a specific color and V (value or brightness) detects the intensity of colors. They also noted that V can be used as a luminance which detects what the color brightness is (brightness/lightness or darkness). The value of H is in degree and the S and V values are in percent.
In preparation for nutrient analysis, 100 g of teff grain from each field site sample was ground separately using a RIRIHONG high-speed multifunction rotary grain grinder (Shanghai Yuanwo Industrial and Trade Co. LTD, Shanghai, China). One half (50 g) of the ground sample was used for nutrient analysis [43] at the Horticoop Soil and Water Laboratory, Bishoftu, Ethiopia and the other for composition analysis (crude fiber, fat, crude protein (CP), and starch analysis at the Ethiopian Agricultural Research Institute (Addis Ababa, Ethiopia). Grain proximate and amino acids composition were analyzed using 3 g of homogenized teff flour in duplicate. The flour samples were scanned using a Near Infrared Reflectance Spectrophotometer (NIRS) spinning system (FOSS, Model: NIRS system 5000, Hilleroed, Denmark). Samples were placed in ring cups and their spectra were recorded in reflectance mode in the range from 400 to 2500 nm, at 2 nm intervals as described by Agza et al. [46]. The prediction for the collected spectra was carried out using plant-based and aqua feed calibrations developed by the International Livestock Research Institute in collaboration with Ethiopian Institute of Agricultural Research. As described by Agza et al. [46] the coefficient of determination (R2) for the calibration and validation ranged between 0.93-0.99 and 0.93–0.98 with corresponding standard error values ranging between 0.03–0.25 and 0.04–0.37. The grain mineral elements determination was carried out using Mehlich 3 extraction method (0.2M CH3COOH, 0.25M NH4NO3, 0.015M NH4F, 0.013M HNO3, 0.001M EDTA and adjusted to pH 2.5) [43] and gas chromatography-mass spectrometry.
2.3. Statistical Analysis
Soil physicochemical parameters were not subjected to ANOVA because samples collected were composited for each location thus excluding replications. Therefore, location means for each soil physicochemical parameters were presented based on the triplicate analysis in the laboratory. Analysis of variance was performed to detect differences in grain parameters among the different locations and block (northwestern vs. central highlands) using PROC GLM in SAS software [47]. Location and block mean for grain nutrient and color data were separated using the Fisher’s protected least significant difference at alpha = 0.05. Pearson’s correlation coefficients among soil physicochemical and teff grain parameters were generated using the PROC CORR procedure in the SAS software [47].
3. Results
3.1. Soil Physicochemical Properties
Based on the Munsell color chart, soil color varied across the different sample collection sites in the two main teff growing regions of Ethiopia however, the majority were black colored soils (Table 2). Soil pH based on the numerical value did not vary widely, however, six out of the 24 locations were considered slightly acidic (Table 2). The CEC value varied widely among locations and for Abrja, Arerti 2, Bichena, and Simada the values were above 60 but for the Kudmi location, CEC was relatively low (Table 2). Both SOC and TN also varied across locations and the SOC values were considered high at the Birzakani, Gumdri, and Abshem locations relative to Wondata location (Table 2). Total N based on numerical value was highest at Abshem followed by Akaki location and some of the lowest values were obtained at Abrja, Atsedemariam and Kosheshila locations (Table 2).
Table 2.
Soil physicochemical parameters sampled during November 2017 at 24 field sites in the two main teff growing regions of Amhara and Oromia in Ethiopia.
In this study, the numerical values for mineral concentration varied across locations (Table 3). For example, the concentration of soil P ranked highest at the Bishoftu location (43 mg/kg) followed by Arerti 2, Alemtena (almost 24 mg/kg), and Arerti 1 (about 15 mg/kg) respectively, while the numerical values for P concentration at most other locations were relatively close (Table 3). The K concentration values showed wider variations at the different locations relative to P, and K concentration numerical values were greatest at Alemtena followed by Arerti 1, Arerti 2, and Bishoftu locations respectively and the lowest was from Kudmi location (Table 3). The Ca concentration numerical value was greatest at Kosheshila and lowest at Gumdri and Zenzelima locations while for Mg concentration, the numerical value was highest at Abrja and lowest at Abshem and Gumdri locations (Table 3). For S concentration, wide variations also occurred across locations based on numerical value and soil S concentration at Abrja, Adet 2, Akaki, Areti 1, Areti 2, Atsedema, Birzakani, Fetlokus, Gejageda, Kosheshila, Simada, Wondata, and Yubodegabati were among the lowest (Table 3). In relation to the concentration of soil Fe concentration, the greatest numerical value was obtained from soils collected from Bichena and lowest at Arerti 2 location (Table 3). There were also, differences in numerical value for all other soil micronutrient concentrations across the locations used in this study and there were wider variations in Mn, Zn, and Cu compared to the variation among locations for soil Mo concentration (Table 3). The numerical values for soil Na concentration varied across locations and were ranked highest at Abrja field site and lowest at Gumdri and Kudmi locations (Table 3).
Table 3.
Soil extractable mineral concentration sampled during November 2017 at 24 field sites cultivated with the teff variety Quncho in the two main teff cultivation regions of Amhara and Oromia in Ethiopia.
3.2. Teff Grain Physical and Chemical Quality
The grain of the teff variety Quncho sampled across the main regions of its cultivation in Ethiopia varied in color (Figure 2). There was a significant effect of location (p < 0.05) on teff grain color indices of hue (H), saturation (S), and brightness (V) in this study (Table 4). Based on the color space classification scheme, grains which showed high V and low S were generally very bright white and those with low V and high S values were generally darker in color based on Deswal and Sharma, [44] color classification. The pureness of the teff grain color represented by the H value was generally higher in the locations Adet 1, Akaki, and Alementa than most other locations (Table 4). In relation to the S values, teff grown in Abshem and Kudmi had the highest values among the different locations and were of a pale white color while the lowest S value was for teff grain collected from the Bishoftu location and the grains were very white (Table 4). Other locations that had teff grain classified as very white based on the S value were Abrja, Arerti 1, Arerti 2, Atsede Mariam, and Kosheshila (Table 4). Teff grain V value was greatest for teff grain collected from the Bishoftu location (brighter color) and lowest for grain sampled from Zenzelima location (darker color) while for all other locations, the values were intermediate (Table 4). Teff grown on red colored soils (Nitisols) had lower V and higher S values while teff grown on the black colored soils (Vertisols) had higher V and lower S values (Table 4). Pertaining to grain color of teff grown in the two main regions (northwestern highlands vs. central highlands) both the S (p = 0.004; SD = 5.3) and V (p = 0.001; SD = 3.7) color value were different. However, the H color value was not different (p = 0.237; data not shown) between the two main teff growing regions in Ethiopia. The greater grain S color value was obtained from teff grown in the northwestern highlands (39%) compared to teff grown in the central highlands (32%) and this indicates that the lower saturated grain color of teff was linked to locations within the central highlands while the higher saturated grain color was from locations within the northwestern highlands. The greater grain V value of 81% was obtained from teff grown in the central highlands compared to the northwestern highlands (75%) and is indicative of whiter grains from the central highlands of Ethiopia. In our study, there were significant negative correlations between grain S value and soil pH, SOC, Ca, Mg, S, and Na (Table 5). Therefore, the soils in our study with greater pH, SOC, Ca, Mg, and S generally exhibited lower S values and thus very whiter color teff grains were observed. For the V value, there were significant positive correlations with black soil color, pH, Ca, Mg, Na, and a negative association with SOC and S (Table 5).
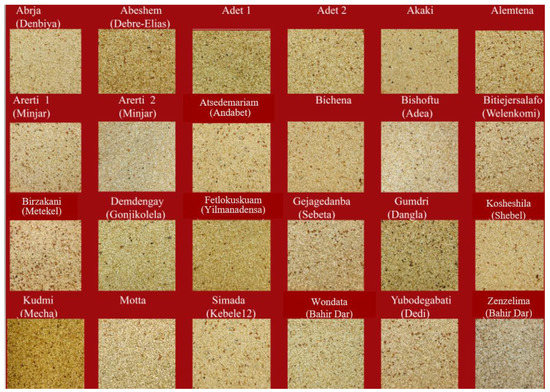
Figure 2.
Grain color of the teff variety Quncho collected from 24 field sites in the two main teff cultivation regions of Amhara and Oromia in Ethiopia.
Table 4.
Teff grain HSV (H, hue; S, saturation; V, value) color values and proximate composition (CP, crude protein) concentration for the variety Quncho collected from November (2017) to January (2018) at 24 locations in the two main teff cultivation regions of Amhara and Oromia in Ethiopia.
Table 5.
Correlation coefficients among soil physicochemical properties and HSV (H, hue; S, saturation; V, value) grain color value of the teff variety Quncho grown on 24 field sites in the main teff cultivation regions of Amhara and Oromia in Ethiopia during November of 2017.
In addition, there was some significant negative relationships between H color value and grain starch (r = −0.41; p < 0.05), S value and CP (r = −0.44; p < 0.05), V value and fiber concentration (r = −0.48; p < 0.05) but a significant positive association between S value and grain fat (r = 0.44; p < 0.05). The higher V value indicates brighter color and lower V value, darker color teff grain. Only the S value was significantly associated with the amino acids alanine (r = −0.50; p < 0.05), arginine (r = −0.45; p < 0.05), aspartic acid (r = −0.56; P < 0.01), methionine (r = −0.51; p < 0.05), serine (r = −0.46; p < 0.05), threonine (r = −0.48; p < 0.05), tyrosine (r = −0.44; p < 0.05) and valine (r = −0.46; p < 0.05). However, there was no significant correlation (p > 0.05; data not shown) between the grain HSV color space values and grain mineral concentrations in this study. For teff grain, the other qualitative traits evaluated were the proximate composition, amino acid composition, and concentration of the different mineral nutrients (P, K, Ca, Mg, S, Fe, Mn, Zn, Cu, B, Mo, and Na) across the 24 locations in the two main teff growing regions of Ethiopia. For grain proximate composition parameters of fiber, fat, crude protein, and starch, there was a main effect of location (p < 0.05) in this study (Table 4). Grain fiber concentration ranked highest at Zenzelima and lowest at Arerti 1, Bichena, Bitiejersalafo, Kudmi, and Yubodegabati locations (Table 4). While for grain fat concentration, teff grain from Abshem, Bitiejersalafo, and Gumdri locations were ranked among the highest and the lowest grain crude fat concentration was obtained from Birzakani location (Table 4). The grain CP concentration was highest at the Birzakani location and lowest at Simada location (Table 4). Teff grain sampled from the locations Adet 2, Alemtena, and Zenzelima were ranked highest in starch concentration and those collected from Abrja, Adet 1, and Demdengay locations were among the lowest in starch concentration (Table 4). Overall, there was no consistent trend where anyone location ranked highest in all the proximate composition parameters in this study which indicated how variable these proximate composition parameters were in this study. Among the proximate composition parameters, only crude fat was different (p = 0.009; SD = 4.4) between the two main teff growing regions and was greater for teff grown in the northwestern highlands (29.0 g/kg) relative to those grown in the central highlands (23.0 g/kg). The grain CP concentration was positively correlated with SOC, and TN but negatively associated with soil Mg, Fe, and Na (Table 6). Teff grain crude fiber concentration was positively correlated with TN and S, but negatively correlated with soil pH, K, Ca, Mg, and Na while grain fat concentration was only negatively correlated with SOC and positively associated with Cu (Table 6). However, grain starch had no significant associations with any of the soil physicochemical properties (Table 6). There was a significant effect (p < 0.05) of location on all 18 amino acids analyzed in the teff grain of this study (Table 7).
Table 6.
Pearson’s correlation coefficients among soil physicochemical properties, grain proximate parameters, and grain mineral nutrients for the teff variety Quncho grown on 24 field sites in the main teff cultivation regions of Amhara and Oromia states in Ethiopia during November of 2017.
Table 7.
Amino acids concentration for the teff variety Quncho collected from November (2017) to January (2018) at 24 locations in the two main teff cultivation regions of Amhara and Oromia in Ethiopia.
No one location ranked highest for all the 18 amino acids analyzed in the teff grain collected, however, teff grain collected from the Bishoftu location ranked highest for 12 out of the 18 amino acids evaluated (Table 7). Also, between the two main teff growing regions (northwestern vs. central highlands), none of the amino acids were different (p > 0.05). There was a location effect (p < 0.05) on teff grain minerals concentration in this study (Table 8). Among the macronutrients, grain P concentration was ranked highest for teff grown at Fetlokuskuam and Yubodegabati and lowest at Zenzelima location (Table 8). The grain K concentration followed a similar trend like P and grain Ca concentration was highest at the Yubodegabati location and lowest at Gejagedanba and Zenzelima locations (Table 8). The grain Mg concentration was highest at Fetlokuskuam and Yubodegabati locations and lowest at Zenzelima location while for grain S concentration, highest at Atsedemariam and lowest at Akaki and Zenzelima locations (Table 8). Additionally, the grain Na concentration ranked highest at Atsede Mariam, Bishoftu, and Simada but lowest at Akaki, Bichena, Gejagedanba, Wondata, and Zenzelima while all other locations were intermediate and also varied (Table 8). In relation to the teff grain micronutrients, Fe concentration was greatest at Abrja location and ranked lowest at Abshem, Alemtena, Arerti 1, Bichena, Birzakani, Bitiejersalafo, Demdengay, Gumdri, Kosheshila, Wondata, Yubodegabati, and Zenzelima locations (Table 8). There were differences in all other grain micronutrients concentration with wider variations in micronutrients concentration for B and Cu and the least variation occurred for Mo across locations (Table 8). Between the two main teff growing regions, grain Mg concentration differed (p = 0.011; SD = 12.1) and it was greater for teff grown in the northwestern highlands (160.2 mg/100 g) compared to those grown in the central highlands region (144.5 mg/100 g). There were trends for both grain P (p = 0.07; SD = 25.9) and grain S concentration (p = 0.06; SD = 2.9) difference between the two main teff growing regions. Both grain P (320.7 mg/100 g) and S (26.5 mg/100 g) for teff grown in the northwestern highlands region tended to be greater than those grown in the central highlands regions P (291.1 mg/100 g) and S (23.9 mg/100 g) respectively. For teff grain minerals concentration, the significant correlations that occurred with soil physicochemical parameters were all below the 50% threshold and indicated that other external variables would have played a more significant role in the variation of grain mineral concentration among locations (Table 6)
Table 8.
Grain mineral nutrients concentration for the teff variety Quncho collected from November (2017) to January (2018) at 24 locations in the two main teff cultivation regions of Amhara and Oromia in Ethiopia.
4. Discussion
The characterization of soil properties helps provide an understanding of the variation in crop production and quality in different agro-ecological zones [48]. While Na is not an essential nutrient element required for plant growth its presence in high concentration in the soil can hinder nutrient uptake, growth, and development of crop plants [49]. The common trend of spatial variation in soil physicochemical properties are generally the result of soil formation factors and variation in agricultural soil management in cultivated areas [50] and this may have been the principal factors responsible for the variation in soil physicochemical properties among the locations evaluated. Our results for teff grain color evaluated across multiple locations in the main teff growing regions of Ethiopia is in confirmation with the results of Wu et al. [51] who reported significant color variation in wheat grain from a single variety cultivated over diverse production conditions. Further, Baye [14] reported that the very white and white teff are grown on the vertisols of the central highlands of Ethiopia which corresponds to our results. The results suggested that there could be a direct relationship between grain nutrient and grain color of teff. Tańska et al. [52] reported that variation in grain color of wheat was reflected by changes in its chemical composition but not the environment which is in partial agreement with the results of our study. In addition, the accumulation of carotenoids and anthocyanins pigments in wheat grain accounted for the large variation in its grain color [52,53,54,55] and may have played a role in the grain color differences for the single variety of teff sampled across multiple locations in our study. Overall, the average of 63.5% of the variation in grain color can be attributed to the variation in the soil physicochemical properties that influenced several parameters that were correlated with grain color in this study (Table 5).
For the proximate composition parameters, the grain crude fiber, crude fat, CP, and starch concentrations were aligned with the range reported in several studies for different varieties of teff across different geographic locations [20,22,32,55]. This result is indicative of how these nutritional parameters are highly variable in space. In this study, the seven out of the 18 amino acids had significant correlations with soil P, while only four out the 18 correlated with Mg, and 10 out of the 18 correlated with Na (Table 9). However, with the exceptions of aspartic acid and soil P, and cysteine and soil Na, all other significant correlations were below the 50% threshold (Table 9) and indicates that other environmental variables may have played a role in the differences in teff grain amino acids concentration. The amino acids concentration of teff grain in this study were in line with those reported for the same variety of teff in a study by Daba [22]. For teff grain minerals concentration, the significant correlations that occurred with soil physicochemical parameters were all below the 50% threshold and indicated that other external variables would have played a more significant role in the variation of grain mineral concentration among locations (Table 6). In our study, high soil mineral concentration did not necessarily correspond to high grain mineral concentration particularly, the grain micronutrients of Fe and Zn showed no significant correlations with soil physicochemical properties and may be indicative of a dilution effect because of higher grain yield in those nutrient-rich locations similar to the trends reported by Fan et al. [56]. The grain mineral concentration in this study was similar to those reported for both white and red teff [57] but often times lower grain mineral concentration than that of the major cereal crop wheat [58,59]. These variabilities in the grain proximate composition parameters, amino acids, and mineral concentration are generally modified by the unique soil physicochemical characteristics, climatic conditions, and the type of agronomic management practices instituted at the location of crop plants cultivation [58,59,60].
Table 9.
Pearson’s correlation coefficients among soil physicochemical properties and grain amino acids for the teff variety Quncho grown on 24 field sites in the main teff cultivation regions of Amhara and Oromia states in Ethiopia during November of 2017.
5. Conclusions
Grain color of teff dictates its quality and demand in Ethiopia and was influenced by location for the same variety. In this study, teff grown on the red colored soils of the five locations in Amhara (Abshem, Adet 1, Kudmi, Motta, and Zenzelima), had higher S (saturation) and lower V (brightness) color space values, which indicates the production of pale white grains compared to the whiter grains produced on the black colored soils of several locations in both Amhara and Oromia regional states. The soil properties of pH, soil organic carbon, Ca, Mg, and S were strongly associated with grain S value, however, among those soil variables based on the correlation coefficient, soil S concentration had the strongest relationship with teff grain color S value and a similar trend occurred for grain V (brightness) value. The locations of Abshem, Adet 1, Gumdri, Kudmi, Motta, and Zenzelima with high soil S concentration were all in Amhara state which indicates that these locations produced pale white teff grains and for the lower soil S recorded in the other locations in both Amhara and Oromia regional states produced whiter teff grains based on the significant positive correlation between grain S color space value and soil S concentration. There was no strong association between grain proximate composition parameters (grain fiber, fat, CP, starch) and grain color in this study. The grain amino acid concentration of teff was only associated with grain color S value particularly, for aspartic acid and alanine. Grain crude fiber was strongly associated with soil pH and Ca but not crude fat, crude protein, and starch. Also, in this study, soil physicochemical properties had minimal influence on grain mineral concentration and since those relationships were below the 50% threshold level, it is indicative that other factors had played a more significant role in altering grain mineral nutrient concentration. Soil P, Mg, and Na were the only soil properties associated with grain amino acids concentration but none of these relationships were considered strong and therefore, suggested that other major factors were involved in determining the level of grain amino acid concentration present in teff grain. Based on the results of this study, grain color and nutrient concentration were influenced by location within the two regional states of Amhara and Oromia and this may help dictate management interventions necessary to obtain uniformity in grain color, chemical composition, and market equity for the same variety of teff in these two major teff cultivation regions in Ethiopia.
Author Contributions
A.A. Graduate student work on the development of the proposal, implementation of the project, data collection, data analysis, and manuscript preparation.; E.A., the conceptualization of project from proposal development to implementation on fieldwork, and editing.; B.Y., involved in proposal development and fieldwork. G.A., involved in proposal development, statistical advising, and editing. K.A., involved in proposal development and fieldwork. J.K.Q.S.; data analysis, reviewing, and writing of the manuscript, W.P.; review and editing, supervision, and funding acquisition.
Funding
This research was funded by the College of Agriculture, Biotechnology and Natural Resources, University of Nevada, Reno.
Acknowledgments
The authors would like to acknowledge Amhara Agricultural Research Institute, Agricultural Growth Program II (AGP II), Debre Zeit Agricultural Research Center, Adet Agricultural Research Center, Bahir Dar University, Ethiopia Institute of Agricultural institute quality lab, and University of Nevada Reno College of Agriculture Biotechnology and Natural Resources for their financial and logistic support to accomplish this study.
Conflicts of Interest
The authors declare no conflict of interest.
References
- Harlan, J.R.; De Wet, J.M.J.; Stemler, A.B.L. Plant. Domestication and Indigenous African Agriculture. In Origins of African Plant Domestication; Harlan, J.R., de Wet, J.M.J., Stemler, A.B.L., Eds.; Mouton Press: The Hague, Netherlands, 1976; pp. 3–19. [Google Scholar]
- NRC (National Research Council). Lost Crops of Africa: Grains; National Academy Press: Washington, DC, USA, 1996; pp. 215–534. [Google Scholar]
- Demissie, A. Teff genetic resources in Ethiopia. In Narrowing the Rift: Teff Research and Development, Proceedings of the International Workshop on Tef Genetics and Improvement, Addis Abba, Ethiopia, 16–19 October 2002; Hailu, T., Getachew, B., Sorrells, M., Eds.; Debre Zeit Agricultural Research Institute: location, 2000; pp. 27–31. [Google Scholar]
- Assefa, K.; Cannarozzi, G.; Girma, D.; Kamies, R.; Chanyalew, S.; Plaza-Wüthrich, S.; Blösch, R.; Rindisbacher, A.; Rafudeen, S.; Tadele, Z. Genetic diversity in tef [Eragrostis tef (Zucc.) Trotter]. Front. Plant. Sci. 2015, 6, 177. [Google Scholar] [CrossRef] [PubMed]
- Simoons, F.J. Some questions on the economic prehistory of Ethiopia. J. Afr. Hist. 1965, 6, 1–13. [Google Scholar] [CrossRef]
- Tesema, A. Variability of panicle characters of teff (Eragrostis Tef (Zucc.) Trotter) from South, North, East, West and Central Highlands of Ethiopia. In Teff: The Story of Ethiopia’s Biodiversity; Occasional Report No 5; Girma, A., Sintayehu, M., Eds.; Forum for Environment: Addis Ababa, Ethiopia, 2010. [Google Scholar]
- CSA (Central Statistical Agency of Ethiopia). Agricultural sample surveys from 2003/04 to 2017/18. In Area and Production for Major Crops; (Private Peasant Holdings, Meher Season); Central Statistical Agency of Ethiopia: Addis Ababa, Ethiopia, 2004–2018. [Google Scholar]
- Minten, B.; Tamru, S.; Engida, E.; Kuma, T. Using Evidence in Unraveling Food Supply Chains in Ethiopia: The Supply Chain of Teff from Major Production Areas to Addis Ababa; International Food Policy Research Institute/Ethiopia Strategy Support Program II: Addis Ababa, Ethiopia, 2013; p. 23. [Google Scholar]
- Morris, C.F. Grain Quality Attributes for Cereals Other than Wheat. In Encyclopedia of Food Grains, 2nd ed.; Wrigley, C., Corke, H., Seetharaman, K., Faubion, J., Eds.; Academic Press: city, country, 2016; pp. 257–261. [Google Scholar]
- Eba, T. Tef (Eragrostis tef) cultivars: Morphology and classification. Part II; Expt. Sta. Bull. No. 66; Addis Ababa University: Dire Dawa, Ethiopia, 1975. [Google Scholar]
- Roseberg, R.J.; Norberg, S.; Smith, J.; Charlton, B.; Rykbost, K.; Shock, C. Yield and quality of teff forage as a function of varying rates of applied irrigation and nitrogen. Klamath Experiment Station Annual Report; Klamath Experiment Station, Oregon State University: Klamath Falls, OR, USA, 2005; pp. 119–136. [Google Scholar]
- Gamboa, P.A.; van Ekris, L. Survey on the nutritional and health aspects of teff (Eragrostis tef). Javeriana.edu.co. Available online: http://educon.javeriana.edu.co/lagrotech/images/patricia_arguedas.pdf (accessed on 21 December 2018).
- ESA (Ethiopian Standard Agency). Teff seed Specification; ES 416: 2000; ESA: Addis Ababa, Ethiopia, 2012.
- Baye, K. Teff: nutrient composition and health benefits. Ethiopian Strategy Support Program Working Paper 67; International Food Policy Research Institute (IFPRI): Washington, D.C., USA; Ethiopian Development Research Institute (EDRI): Addis Ababa, Ethiopia, 2014. [Google Scholar]
- Ketema, S. Teff [Eragrostis Tef (Zucc.) Trotter]. Breeding, Genetic Resources, Agronomy, Utilization and Role in Ethiopian Agriculture; Institute of Agricultural Research: Addis Ababa, Ethiopia, 1993. [Google Scholar]
- Tadesse, G.; Shively, G. Food aid, food prices, and producer disincentives in Ethiopia. Am. J. Agric. Econ. 2009, 91, 942–955. [Google Scholar] [CrossRef]
- Demeke, M.; Di Marcantonio, F. Analysis of Incentives and Disincentives for Teff in Ethiopia; Technical Notes Series; MAFAP; FAO: Rome, Italy, 2013. [Google Scholar]
- FAO. Analysis of Price Incentives for Teff in Ethiopia; Technical notes series; MAFAP; Assefa, B., Demeke, M., Lanos, B., Eds.; FAO: Rome, Italy, 2015. [Google Scholar]
- Abewa, A.; Adgo, E.; Yitaferu, B.; Alemayehu, G.; Assefa, K.; Nyssen, J.; Cools, J. Perception of the Quality of the Food Grain Tef across the Value Chain in Ethiopia; Bahir Dar University: Bahir Dar, Ethiopia, 2019; Unpublished data. [Google Scholar]
- Bultosa, G. Physicochemical characteristics of grain and flour in 13 Tef [Eragrostis tef (Zucc.) Trotter]. J. Appl. Sci. Res. 2007, 3, 2042–2051. [Google Scholar]
- Abebe, Y.; Bogale, A.; Hambidge, K.M.; Stoecker, B.J.; Bailey, K.; Gibson, R.S. Phytate, zinc, iron and calcium content of selected raw and prepared foods consumed in rural Sidama, Southern Ethiopia, and implications for bioavailability. J. Food Compos. Anal. 2007, 20, 161–168. [Google Scholar] [CrossRef]
- Daba, T. Nutritional and soio-cultural values of teff (Eragrostis tef) in Ethiopia. Intern. J. Food Sci. Nutr. 2017, 2, 50–57. [Google Scholar]
- Letizia, S.; Gianna, F.; Tiziana, B. The gluten-free diet: Safety and nutritional quality a review. Nutrients 2010, 2, 16–34. [Google Scholar]
- Black, R.E.; Victora, C.G.; Walker, S.P.; Bhutta, Z.A.; Christian, P.; de Onis, M.; Ezzati, M.; Grantham-McGregor, S.; Katz, J.; Martorell, R.; et al. Maternal and child undernutrition and overweight in low-income and middle-income countries. Lancet 2013, 382, 427–451. [Google Scholar] [CrossRef]
- Bouis, H.E.; Welch, R.M. Biofortification—A sustainable sgricultural strategy for reducing micronutrient malnutrition in the global South. Crop Sci. 2010, 50, S20–S32. [Google Scholar] [CrossRef]
- Pucher, A.; Høgh-Jensen, H.; Gondah, J.; Hash, C.T.; Haussmann, B.I.G. Micronutrient density and stability in West African pearl millet—Potential for biofortification. Crop Sci. 2013, 54, 1709–1720. [Google Scholar] [CrossRef]
- Alaunyte, I.; Stojceska, V.; Plunkett, A.; Derbyshire, E. Dietary iron intervention using a staple food product for improvement of iron status in female runners. J. Intern. Soc. Sports Nutr. 2014, 11, 50. [Google Scholar] [CrossRef] [PubMed]
- Urga, K.; Narasimha, H.V.; Sasikala, B.V.; Vishwantha, S. Bioavailability of iron and zinc from tef in rats. Bull. Chem. Soc. Ethiopia 1998, 12, 95–103. [Google Scholar] [CrossRef][Green Version]
- Umeta, M.; West, C.E.; Fufa, H. Content of zinc, iron, calcium and their absorption inhibitors in foods commonly consumed in Ethiopia. J. Food Compos. Anal. 2005, 18, 803–817. [Google Scholar] [CrossRef]
- Jansen, G.R.; DiMaio, L.R.; Hause, N.L. Amino acid composition and lysine supplementation of teff. Cereal Proteins 1962, 10, 62–64. [Google Scholar]
- Piccinin, D.M. More about Ethiopian Food: Teff; University of Washington Harborview Medical Center: Seattle, WA, USA, 2002. [Google Scholar]
- Abebe, W.; Collar, C.; Ronda, F. Impact of variety type and particle size distribution on starch enzymatic hydrolysis and functional properties of tef flours. Carbohydr. Polym. 2015, 115, 260–268. [Google Scholar] [CrossRef] [PubMed]
- Campo, E.; Del Arco, L.; Urtasun, L.; Oria, R.; Ferrer-Mairal, A. Impact of sourdough on sensory properties and consumers’ preference of gluten-free breads enriched with teff flour. J. Cereal Sci. 2016, 67, 75–82. [Google Scholar] [CrossRef]
- Gebremariam, M.M.; Zarnkow, M.; Becker, T. Teff (Eragrostis tef) as a raw material for malting, brewing and manufacturing of gluten-free foods and beverages: A review. J. Food Sci. Technol. 2014, 51, 2881–2895. [Google Scholar] [CrossRef] [PubMed]
- Spaenij-Dekking, L.S.; Kooy-Winkelaar, Y.; Koning, K.F. The Ethiopian cereal teff in celiac disease. N. Engl. J. Med. 2005, 353, 16. [Google Scholar] [CrossRef]
- Hopman, G.D.; Dekking, E.H.A.; Blokland, M.L.J.; Wuisman, M.C.; Zuijderduin, W.M.; Koning, F.; Schweizer, J.J. Tef in the Diet of Celiac Patients in the Netherlands. Scand. J. Gastroenterol. 2008, 43, 277–282. [Google Scholar] [CrossRef]
- Bergamo, P.; Maurano, F.; Mazzarella, G.; Iaquinto, G.; Vocca, I.; Rivelli, A.R.; Enrica Falco, D.; Gianfrani, C.; Rossi, M. Immunological evaluation of the alcohol-soluble protein fraction from gluten-free grains in relation to celiac disease. Mol. Nutr. Food Res. 2011, 55, 1266–1270. [Google Scholar] [CrossRef]
- Hager, A.S.; Wolter, A.; Jacob, F.; Zannini, E.; Arendt, E.K. Nutritional properties and ultra-structure of commercial gluten-free flours from different botanical sources compared to wheat flours. J. Cereal Sci. 2012, 56, 239–247. [Google Scholar] [CrossRef]
- Lee, H. Teff, a rising global crop: Current status of teff production and value Chain. Open Agri. J. 2018, 12, 185–193. [Google Scholar] [CrossRef]
- Mengesha, M.H. Chemical composition of Teff (Eragrostis tef) compared with that of wheat, barley, and grain sorghum. Econ. Bot. 1966, 20, 268–273. [Google Scholar] [CrossRef]
- Assefa, K.; Aliye, S.; Belay, G.; Metaferia, G.; Tefera, H.; Sorrells, M.E. Quncho: the first popular tef variety in Ethiopia. Intern. J. Agri. Sustain. 2011, 9, 25–34. [Google Scholar] [CrossRef]
- Iswaran, V.; Marwaha, T.S. A modified rapid Kjeldahl method for determination of total nitrogen in agricultural and biological materials. Geobios 1980, 7, 281–282. [Google Scholar]
- Mehlich, A. Mehlich 3 soil test extractant: A modification of Mehlich 2 extractant. Commun. Soil Sci. Plan. Anal. 1984, 15, 1409–1416. [Google Scholar] [CrossRef]
- Deswal, M.; Sharma, N. A simplified review on fast HSV image color and texture detection and image conversion algorithm. Intern. J. Comput. Sci. Mob. Comput. 2014, 3, 1216–1222. [Google Scholar]
- Ibraheem, N.A.; Hasan, M.M.; Khan, R.Z.; Mishra, P.K. Understanding color models: A Review. ARPN J. Sci. Technol. 2012, 2, 265–275. [Google Scholar]
- Agza, B.; Bekele, R.; Shiferaw, L. Quinoa (Chenopodium quinoa, Wild.): As a potential Ingredient of Injera in Ethiopia. J. Cereal Sci. 2018, 82, 170–174. [Google Scholar] [CrossRef]
- SAS Institute Inc. SAS/STAT 9.4 Users’ Guide; SAS Institute: Cary, NC, USA, 2017. [Google Scholar]
- Tola, E.; Al-Gaadi, K.A.; Madugundu, R.; Zeyada, A.M.; Kayad, A.G.; Biradar, C.M. Characterization of spatial variability of soil physicochemical properties and its impact on Rhodes grass productivity. Saudi J. Biol. Sci. 2017, 24, 421–429. [Google Scholar] [CrossRef]
- Bains, S.S.; Fireman, M. Effect of exchangeable sodium percentage on the growth and absorption of essential nutrients and sodium by five crop plants. Agron. J. 1964, 56, 432–435. [Google Scholar] [CrossRef]
- Usowicz, B.; Lipiec, J. Spatial variability of soil properties and cereal yield in a cultivated field on sandy soil. Soil Till. Res. 2017, 174, 241–250. [Google Scholar] [CrossRef]
- Wu, J.; Carver, B.F.; Goad, C.L. Kernel color variability of hard white and hard red winter wheat. Crop Sci. 1999, 39, 634–638. [Google Scholar] [CrossRef]
- Tańska, M.; Buczek, J.; Jarecki, W.; Wasilewska, A.; Konopka, I. Grain morphology, texture and colour-related compounds of bread wheat cultivars in relation to cultivation regimes and growing location. Zemdirb. Agric. 2018, 105, 105–112. [Google Scholar] [CrossRef]
- Ficco, D.B.M.; Mastrangelo, A.M.; Trono, D.; Borrelli, G.M.; De Vita, P.; Fares, C.; Beleggia, R.; Platani, C.; Papa, R. The colours of durum wheat: a review. Crop. Pasture Sci. 2014, 65, 1–15. [Google Scholar] [CrossRef]
- Garg, M.; Chawla, M.; Chunduri, V.; Kumar, R.; Sharma, S.; Sharma, N.K.; Kaur, N.; Kumar, A.; Mundey, J.K.; Saini, M.K.; et al. Transfer of grain colors to elite wheat cultivars and their characterization. J. Cereal Sci. 2016, 71, 138–144. [Google Scholar] [CrossRef]
- Mezgebo, K.; Belachew, T.; Satheesh, N. Optimization of red teff flour, malted soybean flour, and papaya fruit powder blending ratios for better nutritional quality and sensory acceptability of porridge. Food Sci. Nutr. 2018, 6, 897–903. [Google Scholar] [CrossRef]
- Fan, M.-S.; Zhao, F.-J.; Fairweather-Tait, S.J.; Poulton, P.R.; Dunham, S.J.; McGrath, S.P. Evidence of decreasing mineral density in wheat grain over the last 160 years. J. Trace Elem. Med. Biol. 2008, 22, 315–324. [Google Scholar] [CrossRef]
- Dame, Z.T. Analysis of major and trace elements in teff (Eragrostis tef). J. King Saud Univ. –Sci. 2018, 1–4. [Google Scholar] [CrossRef]
- Hussain, A.; Larsson, H.; Kuktaite, R.; Johansson, E. Mineral composition of organically grown wheat genotypes: Contribution to daily minerals intake. Int. J. Environ. Res. Public Health 2010, 7, 3442–3456. [Google Scholar] [CrossRef] [PubMed]
- Jaskulska, I.; Jaskulski, D.; Gałęzewski, L.; Knapowski, T.; Kozera, W.; Wacławowicz, R. Mineral composition and baking value of the winter wheat grain under varied environmental and agronomic conditions. J. Chem. 2018, 2018, 1–7. [Google Scholar] [CrossRef]
- Murphy, K.M.; Hoagland, L.A.; Yan, L.; Colley, M.; Jones, S.S. Genotype × environment interactions for mineral concentration in grain of organically grown spring wheat. Agron. J. 2011, 103, 1734–1741. [Google Scholar] [CrossRef]
© 2019 by the authors. Licensee MDPI, Basel, Switzerland. This article is an open access article distributed under the terms and conditions of the Creative Commons Attribution (CC BY) license (http://creativecommons.org/licenses/by/4.0/).