Article

Evaluation of Yield-Based Low Nitrogen Tolerance Indices for Screening Maize (Zea mays L.) Inbred Lines

Key Laboratory of Biology and Genetic Improvement of Maize in Arid Area of Northwest Region, Ministry of Agriculture and Rural Affairs, College of Agronomy, Northwest A&F University, Maize Engineering & Technology Research Centre of Shaanxi Province, Yangling 712100, Shaanxi, China
*
Authors to whom correspondence should be addressed.
Agronomy 2019, 9(5), 240; https://doi.org/10.3390/agronomy9050240
Submission received: 5 March 2019 / Revised: 26 April 2019 / Accepted: 7 May 2019 / Published: 10 May 2019
(This article belongs to the Section Crop Breeding and Genetics)

Abstract

:
To screen the desired criterion to identify desirable genotypes and select genotypes best suited to limited nitrogen availability in order to facilitate the practice of low-nitrogen-tolerant breeding in maize, the response of 31 maize inbred lines, containing four control inbred lines (PH6WC, PH4CV, Zheng58, and Chang7-2) and others selected from the Shaan A and Shaan B heterotic groups cultivated at Northwest A&F University (Yangling, Shaanxi, China), were evaluated. The experiment was conducted following a split plot design with two replications during three growing seasons (2015, 2016, and 2017) under both high nitrogen (HN) and low nitrogen (LN) conditions at the Yulin and Yangling in Shaanxi Province, China. Seven screening indices, based on grain yield under two contrasting nitrogen (N) conditions, the stress susceptibility index (SSI), yield stability index (YSI), mean productivity (MP), geometric mean productivity (GMP), stress tolerance index (STI), harmonic mean (HM), and low nitrogen tolerance index (LNTI), were computed to assess the overall index that accurately screened the desirable genotypes. The results of the correlation analyses and principal component analysis showed that MP, GMP, HM and STI were correlated with grain yield significantly and positively under contrasting N conditions, and were able to accurately discriminate the desirable genotypes. Compared with the control inbred lines, many inbred lines selected from the Shaan A and Shaan B groups showed a higher LN tolerance. This shows that we can effectively improve the LN tolerance of maize inbred lines through LN screening. Based on the screening indices, the three-dimensional diagram and genotype and genotype × environment (GGE) biplots are agreed with this results, and we identified KA105, KB081, KA225, 91227, and 2013KB-47 as the desired genotypes that have the potential to be used to breed a high yield and stable hybrid.

1. Introduction

Maize (Zea mays L.) is not only an important cereal crop, is also an important forage, economic, and energy crop. The production of maize affects a large proportion of the world population. As a C4 plant, maize has a high photosynthetic efficiency and acquires considerable biomass under an appropriate nitrogen (N) supply [1]. Since the green revolution, farmers have tended to maximize N fertilization to increase crop yield [2]. The large application of N fertilizer is essential to the development of the maize plant and grain yield [3]. However, the excessive application of N fertilizer has created several environmental problems since the 2000s [4,5]. The excessive use of N fertilizer damage the ecological environment by causing ‘Algae blooms’ in lakes and ‘red tides’ in estuaries, as well as increasing the NO and NH3 emissions from farmlands [5,6,7,8].
N fertilizer waste results from the excessive application of N fertilizers for maize plants which have a lower nitrogen use efficiency (NUE) [9,10]. One possible method to ensure the NUE and meet the needs of increasing demands for a nitrogen efficient maize cultivar in the future involves the breeding of a low nitrogen (LN) tolerant cultivar, which could be created by crossing the LN tolerant inbred lines of maize. Breeding of LN tolerant varieties may maintain grain yield and decrease the amount of required N fertilizer.
Therefore, the need to screen for a LN tolerant cultivar has encouraged scholars to identify several reliable indices as the criteria for the LN tolerant genotype [11,12]. Researchers usually choose the relative grain yield performance genotypes under stress and normal conditions as the first selection factor to determine the desired genotypes [13]. Screening indices are mathematical expressions that consider the performance of plants under both stress and normal conditions. Different screening indices reflecting stress influence have been suggested based on the relative grain yield between the stress and normal conditions [14,15,16]. Rosielle and Hamblim [17] defined mean productivity (MP) as the average yield of a genotype under contrasting stress and optimal conditions. Fischer and Maurer [18] proposed the stress susceptibility index (SSI) for evaluating the yield stability and determining the changes in both potential and actual yield in variable environments. Fernandez [19] defined a new index, the stress tolerance index (STI), which can be used to identify genotype that produce a high yield under both stress and non-stress conditions. Another yield-based estimation of drought resistance is the harmonic mean (HM) [20,21]. Francisco et al. [16] suggested the use of the low nitrogen tolerance index (LNTI) to understand yield and to reflect the influence of a LN fertilizer. The researches on screening indices related to the different stressed conditions and variable test materials have been reported. Such as, Homa et al. [22] identified the GMP, MP, STI, and HM as the most suitable resistance indices to screen the salinity tolerance at the rice seedling stage. Khan et al. [10] researched 15 indices, including of GMP, MP, and STI, to identify the N tolerant genotype of wheat. Ganjeali et al. [23] used to identity a screening index to identify a drought tolerant genotype of chickpea. However, few articles have reported screening indices for LN tolerance in maize.
Genotype and genotype × environment (GGE) biplots have been widely applied in multi-environmental test data analysis [24,25,26]. GGE biplots are based on phenotype data that examine the environment (G), genotype (E), and the effect of G × E interactions [27]. GGE biplots are drawn based on principal component analysis (PCA) to graphically display the performance of the genotype by phenotype value and can accurately reflect the yield and stability of test varieties. The convenient and fast GGE system can improve research efficiency [28]. Bahrami et al. [29] used the GGE graphs to analyze the screening indices, to choose the desirable safflowers. Han et al. [30] analyzed the performance of fatty acids in 26 soybean cultivars by GGE biplots. Dehghani et al. [31] used the GGE biplots methodology to analyze yield and related traits in melon. However, no reports have been published on the application of GGE biplots to the study of screening LN tolerance in maize genotypes until now.
Herein, 31 inbred lines including four controls were planted under low nitrogen (LN) (0 kg/ha) and high nitrogen (HN) (180 ka/ha) at two locations over three years, and the related indices were calculated based on the yield under the two conditions. The goal was achieved by verifying the LN tolerant genotypes from a variety of inbred lines selected using the indices above and combining the GGE biplots. The desired genotypes were then identified for breeding a high-yield and high-NUE hybrid in the future. This study of the screening indices analysis provides a theoretical basis for the practice of LN tolerance breeding in maize.

2. Materials and Methods

2.1. Plant Materials and Field Experiment

According to the theory of domestic and international maize breeding, Shaan A and Shaan B heterotic groups were built employing the breeding strategy of two divergent heterotic groups, on the basis of the simplifying heterotic model, following seven rounds of optimization and upgrades from 2007 to 2015. The superior varieties were the basic materials used to adapt maize production in Shaanxi Province. [32]. Thirty-one maize inbred lines containing four elite inbred lines (PH6WC, PH4CV, Zheng58, and Chang7-2) as controls and other inbred lines selected from the Shaan A and Shaan B heterotic groups that were cultivated at Northwest A&F University were used to assess LN tolerance. Detailed information about the 31 inbred lines are provided in Table 1.

2.2. Phenotype Evaluation

These inbred lines were planted over three years (2015, 2016, and 2017) at the experimental farm located in Yangling (34°54′N, 108°7E, 472 m altitude, clay soil) and Yulin (34°16′N, 109°45′E, 1100 m altitude, sandy soil) at Shaanxi Province, China. The average daytime temperature was 12.9 °C and 8.3 °C in Yangling and Yulin, respectively. The soil nutrition, collected depths 0–20 cm, was measured as total N 0.92 g/kg (Yangling) and 0.98 g/kg (Yulin); Available potassium was 178 mg/kg (Yangling) and 180 mg/kg (Yulin); Available phosphorus was 14.63 mg/kg (Yangling) and 17.53 mg/kg (Yulin); the organic-M content was 17.04 g/kg (Yangling) and 15.47 g/kg (Yulin). The experiments were designed as a split plot design with N treatment as the main plot under each level of N fertilization conditions. Two levels of pure nitrogen were used: 180 kg/ha for HN and 0 kg/ha for LN. For the HN treatment, the fertilizers used before sowing, included urea (191 kg/ha), super phosphate (750 kg/ha), and potassium chloride (135 kg/ha). An additional 200 kg/ha of urea was used at the V9 stage. For the LN treatment, fertilizers were used as in the HN treatment, except with no N fertilizer. The 31 inbred lines were planted in two-row plots with two replications. Each row was 5m in length, with a 0.6-m spacing between the rows. The planting density was 66,667 plants ha−1. Field management was performed according to local standards.
The grain yield of each genotype was recorded to calculate the grain yield per ha−1 (kg) with an adjustment to a 14% moisture content. Based on the grain yield of every genotype under the LN and HN conditions, seven indices, SSI, YSI, MP, GMP, STI, HM, and LNTI, were computed. The HN experiment was considered to be non-stressed conditions and the LN experiment was considered to be stressed conditions. Different screening indices were calculated as follows.
The stress susceptibility index is [18]:
SSI = 1 Y s / Y p S I
S I = 1 Y m s Y m p
where Ys is the yield of the cultivar under LN conditions; Yp is the yield of cultivar under optimal condition; Yms and Ymp are the mean yields of all cultivar under stress and non-stress conditions, respectively; 1-(Ys/Yp) is the stress intensity; and SI is the stress intensity. Genotypes with SSI<1 are more resistant to low nitrogen.
The yield stability index is [33]:
YSI = Y s Y p
Genotypes with a high value of YSI are regarded as stable genotypes under both stressed and non-stressed conditions.
Mean productivity is [17]:
MP = Y p + Y s 2
The genotypes with a high value of this index are more desirable.
Geometric mean productivity is calculated as [19]:
GMP = Y p × Y s
Genotypes with a high GMP will be more desirable.
Stress tolerance index is calculated as [19]:
STI = Y p × Y s ( Y m p ) 2
Genotypes with a high STI are tolerant to low nitrogen.
The harmonic mean is as follows [20]:
HM = 2 × Y p × Y s Y p + Y s
Genotypes with a high value of this index are more desirable.
The low Nitrogen Tolerance Index is calculated as [16]:
LNTI = Y p Y s Y p
Genotypes with a low value of this index are more desirable.

2.3. Statistical Analysis

A combination analysis of variance (ANOVA) was performed for grain yield and the tolerance indices using the GLM procedure of SPSS (Statistical Product and Service Solutions) 22.0 [34]. Correlation among the seven screening indices and grain yield under contrasting fertilizer conditions was determined using Pearson analysis in SPSS 22.0. To identify the LN tolerance and high yielding genotypes, a three-dimensional (3D) diagram was drawn using originPro2017 (OriginLab Corporation, Northampton, MA, USA). PCA and GGE biplots based on the indices and yield of the six environments were drawn using the Genstat 19.0 (Beijing VSNC Statistics Software Co. Ltd., Beijing, China) [35]. The PROC MIXED procedure (SAS, Statistics Analysis System) [36] was used to assess the best linear unbiased prediction (BLUP) value of the genotypic effect for grain yield under different N treatments, and a mixed linear model for each line applied as follows [37]:
y i = μ + G i + E i + e i
where yi is the phenotypic value; μ is the total mean value of the total yield in all environments; Gi is the genotype effect; Ei is the environment effect; and ei is the random error. The genotype effect and environment effect were random effects, with the others assumed to be fixed.
The GEE biplots model is as follows [38]:
Y i j Y i = λ 1 ξ i 1 η i 1 + λ 2 ξ i 2 η i 2 + ε i j
where Yij is the mean value of the i genotype under environment j; Yj is the mean value of all genotypes under environment j; λ1 and λ2 is the singular value of the first principal component and the second principal component, respectively; ξi1 and ξi2 are the score of the i-th genotype on the first principal component and the second principal component, respectively; ηj1 and ηj2 are the score for the j environment on the first principal component and the second principal component, respectively; and εij represents the difference between the actual value and the first two principal component estimates.

3. Results

3.1. Phenotypes for the Seven Screening Indices and Grain Yield under HN and LN Treatments of 31 Inbred Lines

The results of the BLUP value for grain yield and different screening indices calculated are presented in Table 1. Compared with HN, the grain yield of all inbred lines decreased by varying degrees under the LN treatments (Table 1). GMP, MP, STI, and HM identified that genotypes KB081, PH6WC, KA105, and 91227 were the most tolerant. Genotypes KB081, KA227, KB020, KA105, 91227, and PH6WC were identified as having the least susceptibility per SSI and LNTI (Table 1). The results of the variance analysis of the combined data for the grain yield and screening indices for 31 maize inbred lines are presented in Table 2. We found a significant different between the three growing years and two locations. Grain yield and all screening indices were significantly different between all genotypes (p < 0.01), which indicated that different inbred lines performed differently in grain yield and all screening indices. That variation in all genotypes provide a basis screening indicator for LN treatments.

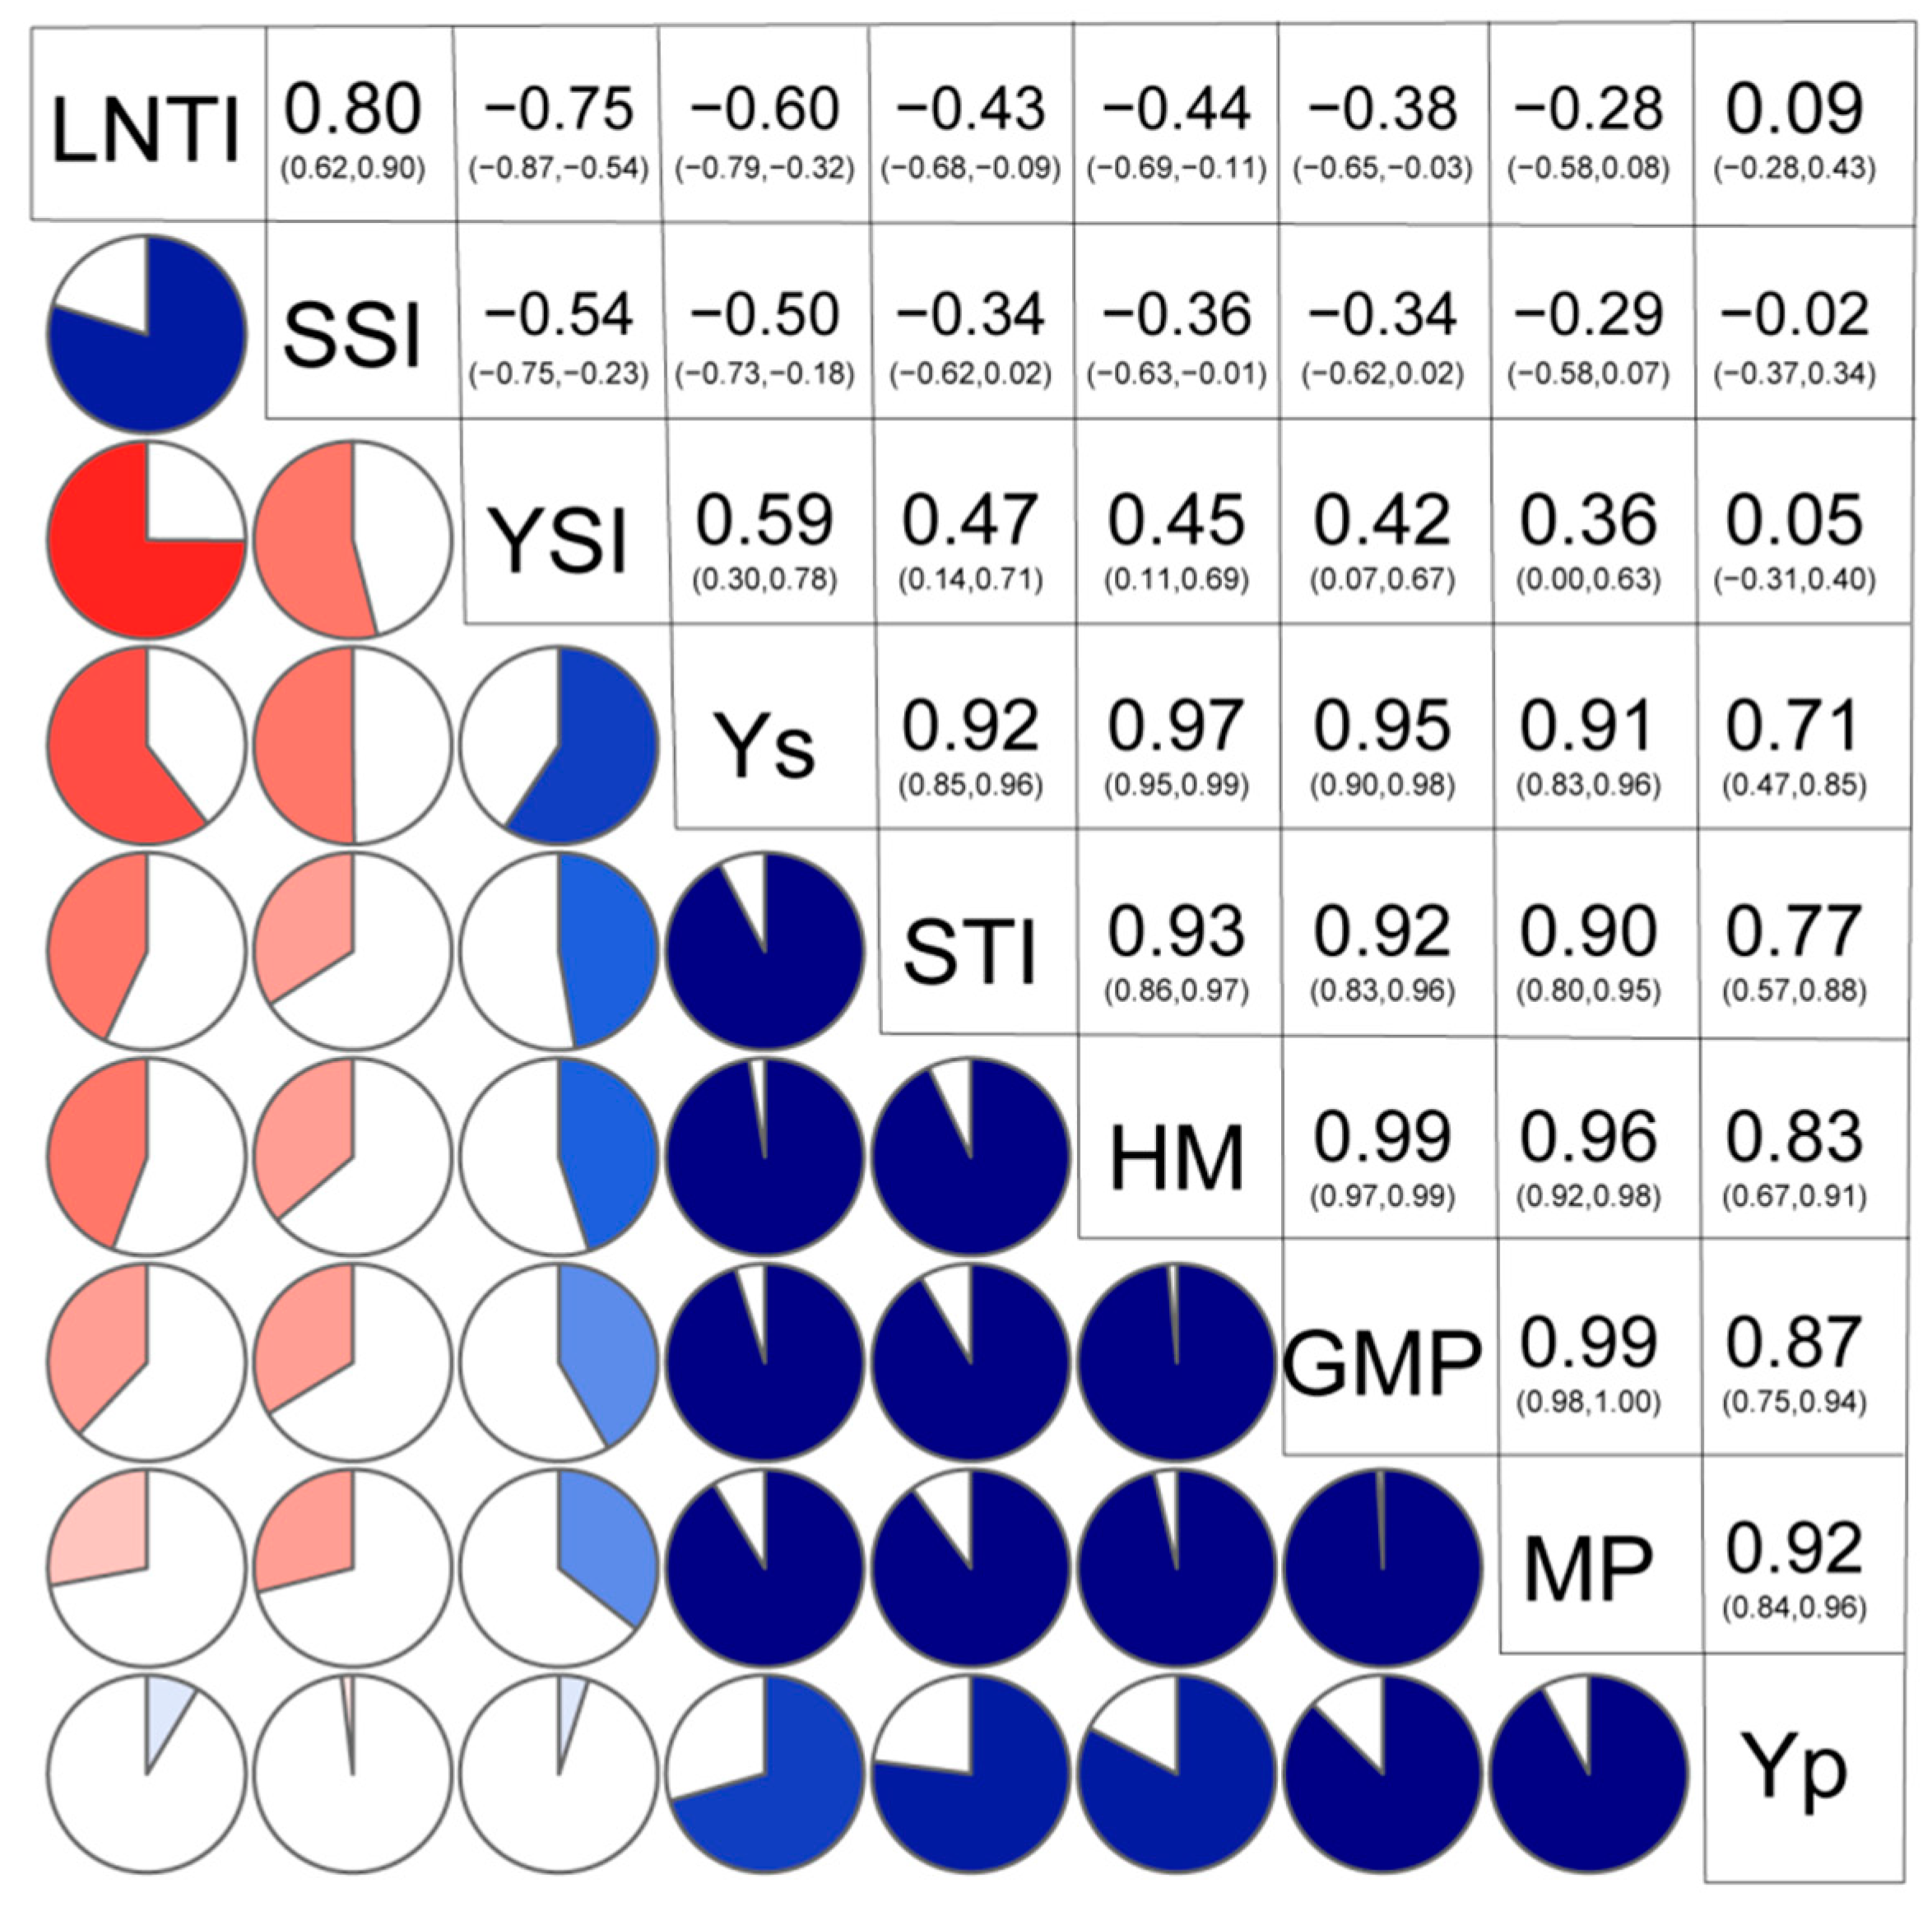
3.2. Correlation Analysis for the Seven Screening Indices and Grain Yield under HN and LN Treatments of 31 Inbred Lines

To select the best and most effective index as the selection criterion for discriminating the desirable genotypes, the correlation coefficients between the BLUP value of grain yield under HN (Yp) and LN (Ys) treatments and seven screening indices for 31 inbred lines were determined and are presented in Figure 1. Correlation analysis showed that Yp had a significantly positive association with MP (r = 0.92), GMP (r = 0.87), HM (r = 0.83) and STI (r = 0.77); And Ys had a significant positive relationship with MP (r = 0.91), GMP (r = 0.95), STI (r = 0.92), HM (r = 0.97), and YSI (r = 0.59), indicating that MP, GMP, HM, and STI were able to identify the most stable and productive genotypes under both the stressed and non-stressed conditions. The several indices were dealt with two major index groups: (1) selecting high-yielding lines (MP, GMP, STI, and HM) and (2) selecting most stable lines (SSI, YSI, and LNTI). After correlation analysis, the GGE biplots generated using Genstat 19.0 (Beijing VSNC Statistics Software Co,.Ltd, Beijing, China) 19.0, showed that MP, GMP, STI, and HM were associated positively Yp and Ys (Figure 2). Therefore, the analysis agreed with the results above.

3.3. PCA for Seven Screening Indices and Grain Yield under HN and LN Treatments of 31 Inbred Lines

The main components of attribute performance were analyzed using grain yield and endurance indices, both calculated based contrasting N calculated as 91.03% (Table 3 and Figure 2). As the first two components were interpretable (value > 1) and deleting the other components that had minimal effect on the variations (value < 1), the GGE biplot was drawn based on the first two components using BLUP data value for Yp, Ys, GMP, MP, STI, YSI, HM, LNTI, and SSI. The first component explained 68.14% of the variations and demonstrated strong correlations with Yp, Ys, GMP, MP, STI, and HM. This component could be called the group of great performance under both two N conditions which was able to discriminate the high grain yield in HN and LN conditions. The second component explained 22.89% of the variations, having a strong correlation with SSI, YSI, and LNTI in the LN condition or sensitivity to stress. The second component could be used to determine genotype sensitivity to LN condition. Therefore, selecting genotypes that have high PC1 and low PC2 are suitable for both HN and LN conditions. The results showed that the six genotypes KB081, KA105, PH6WC, 91227, 2013KB-47, and KA225 best reflected these qualities, and would thus have the best LN tolerance with high PC1, but low PC2 values.

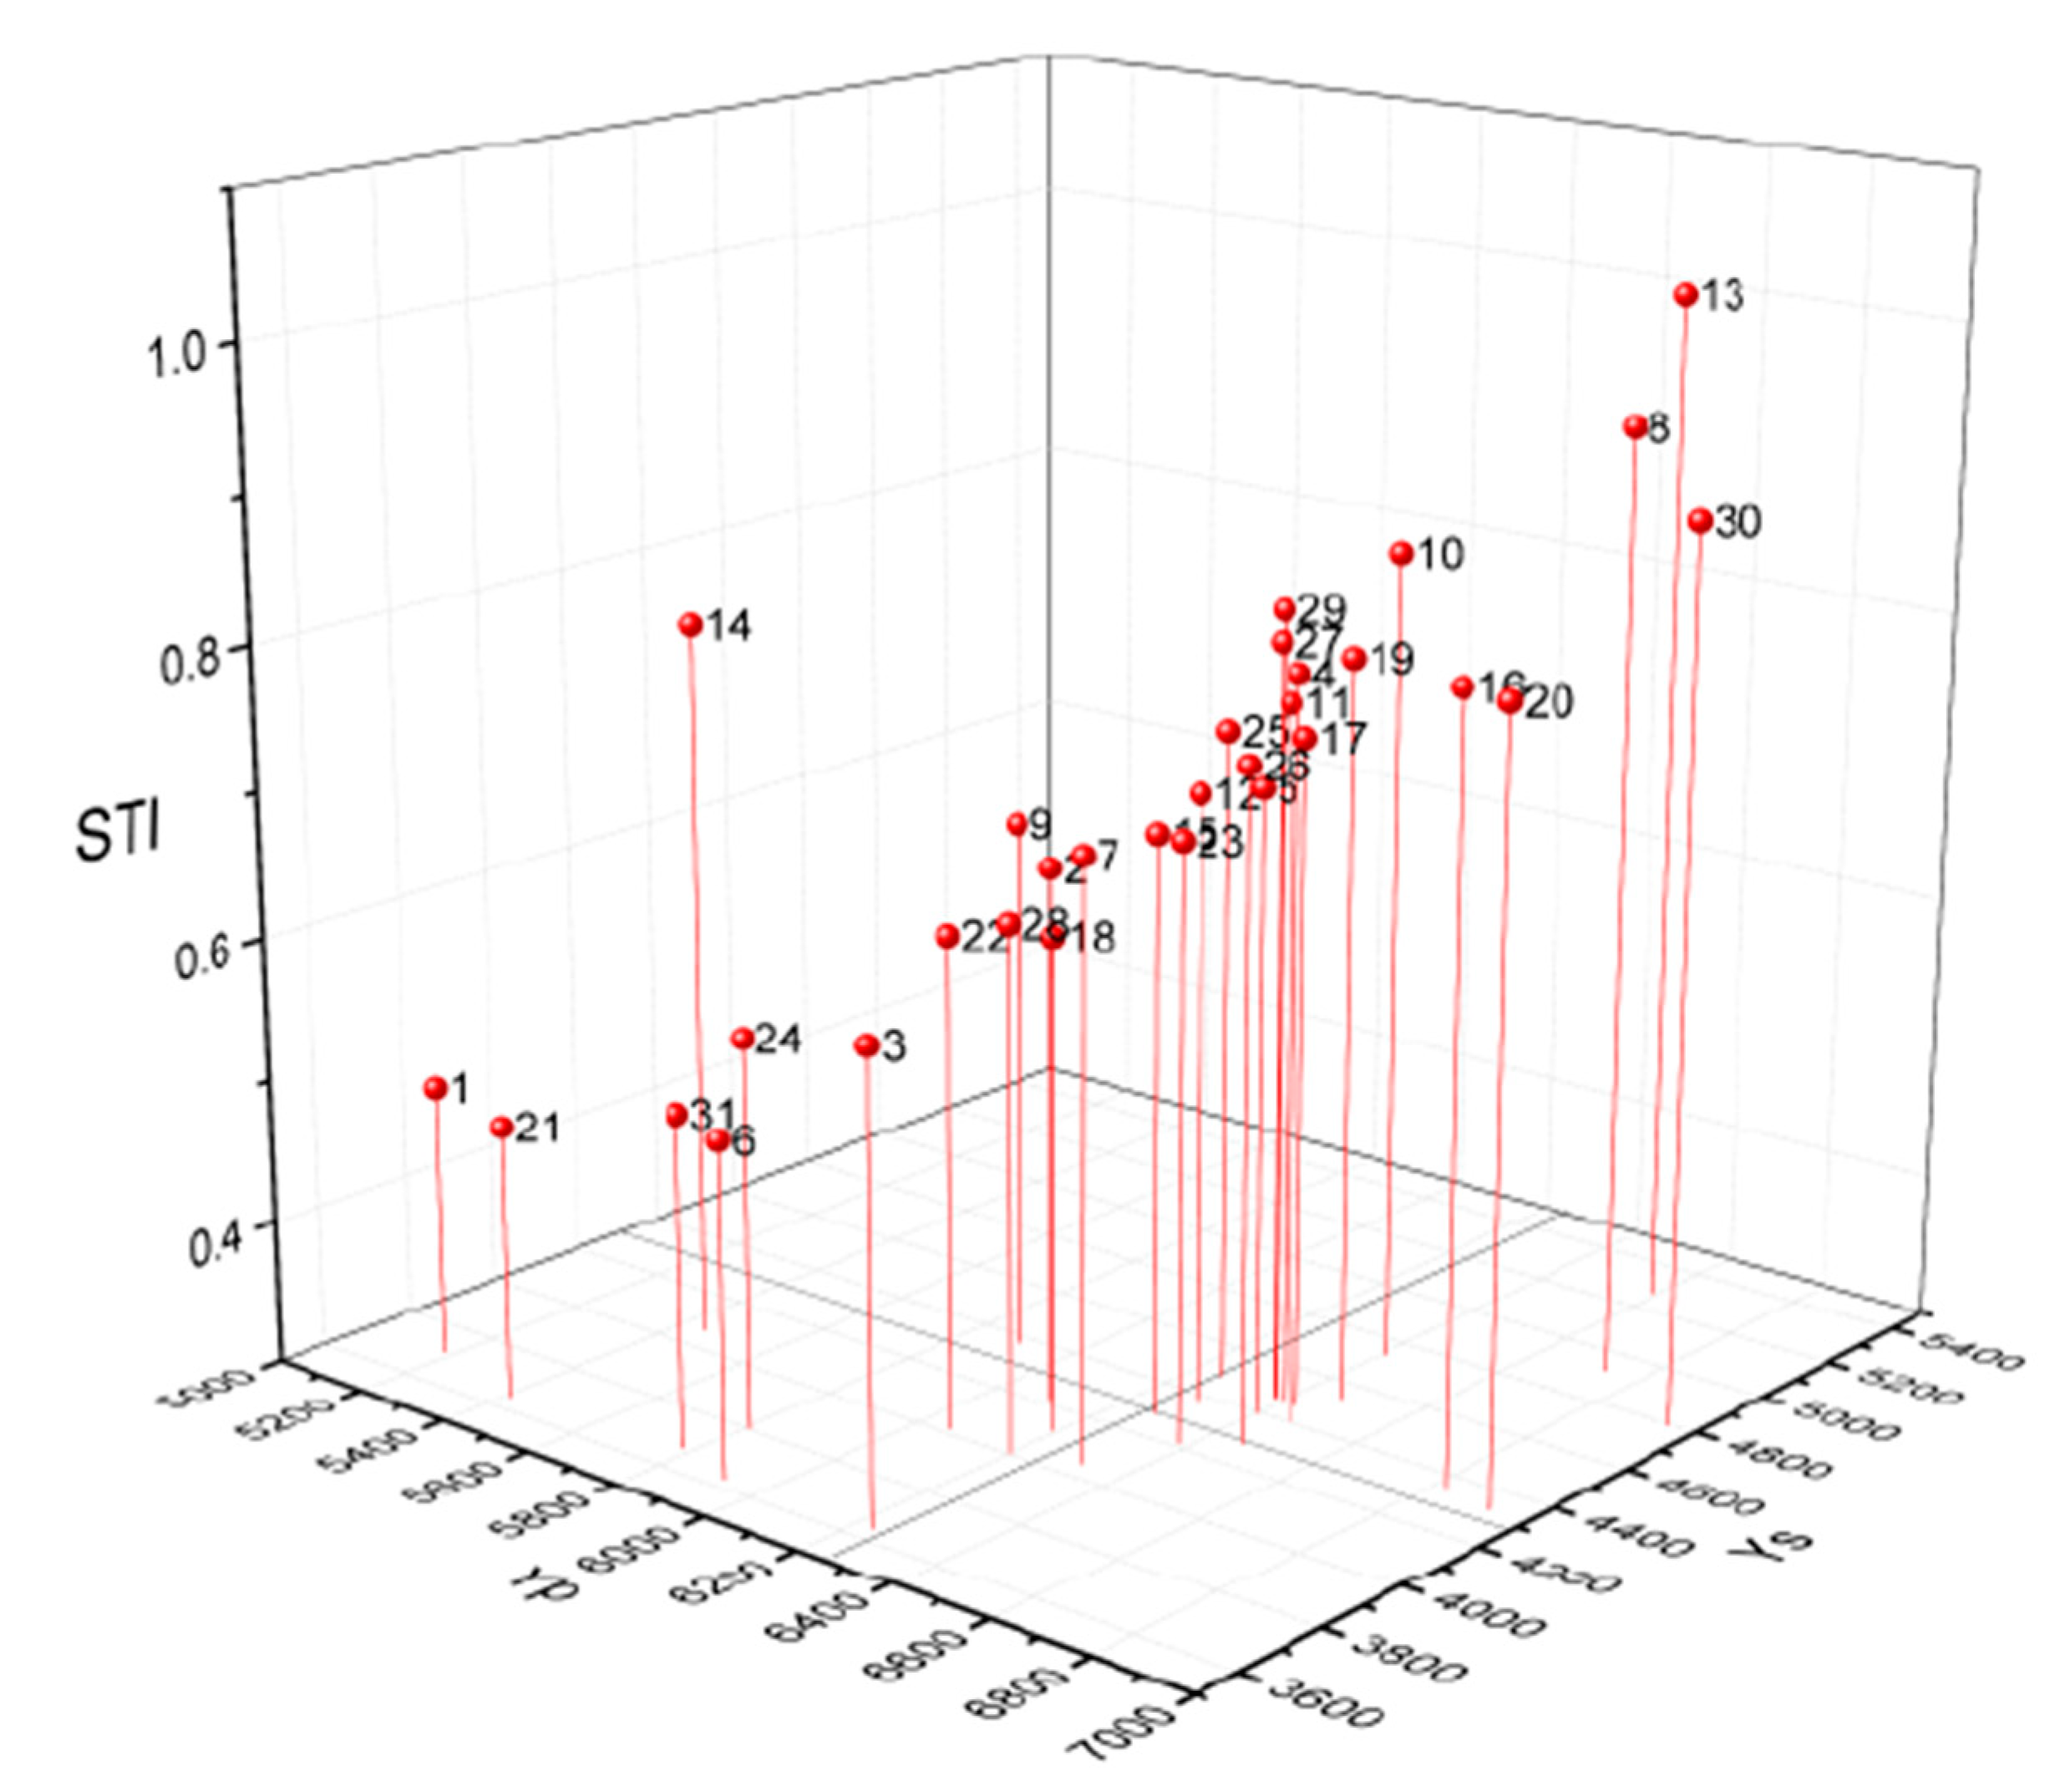
3.4. 3D Diagram for the STI Indices and Grain Yield under HN and LN Treatments of 31 Inbred Lines

Considering the positive correlation between the STI and Yp, Ys, and the character of stability in production for the value of STI, a 3D diagram based on STI was drawn to discriminate the 31 maize inbred lines according their performance (Figure 3). Based on the 3D diagram, KB081, KA225, 91227, 2013KB-47, PH6WC, and KA105 were identified as the target genotypes that produced a suitable STI value. These genotypes with a higher STI value were also located the first quadrant, which indicates a higher yield under HN and LN conditions. The results indicated these genotypes are dominant under both stressed and non-stressed environments and have the potential to breed more stable and high yielding hybrids. These results verify the evaluation function of the screening indices.

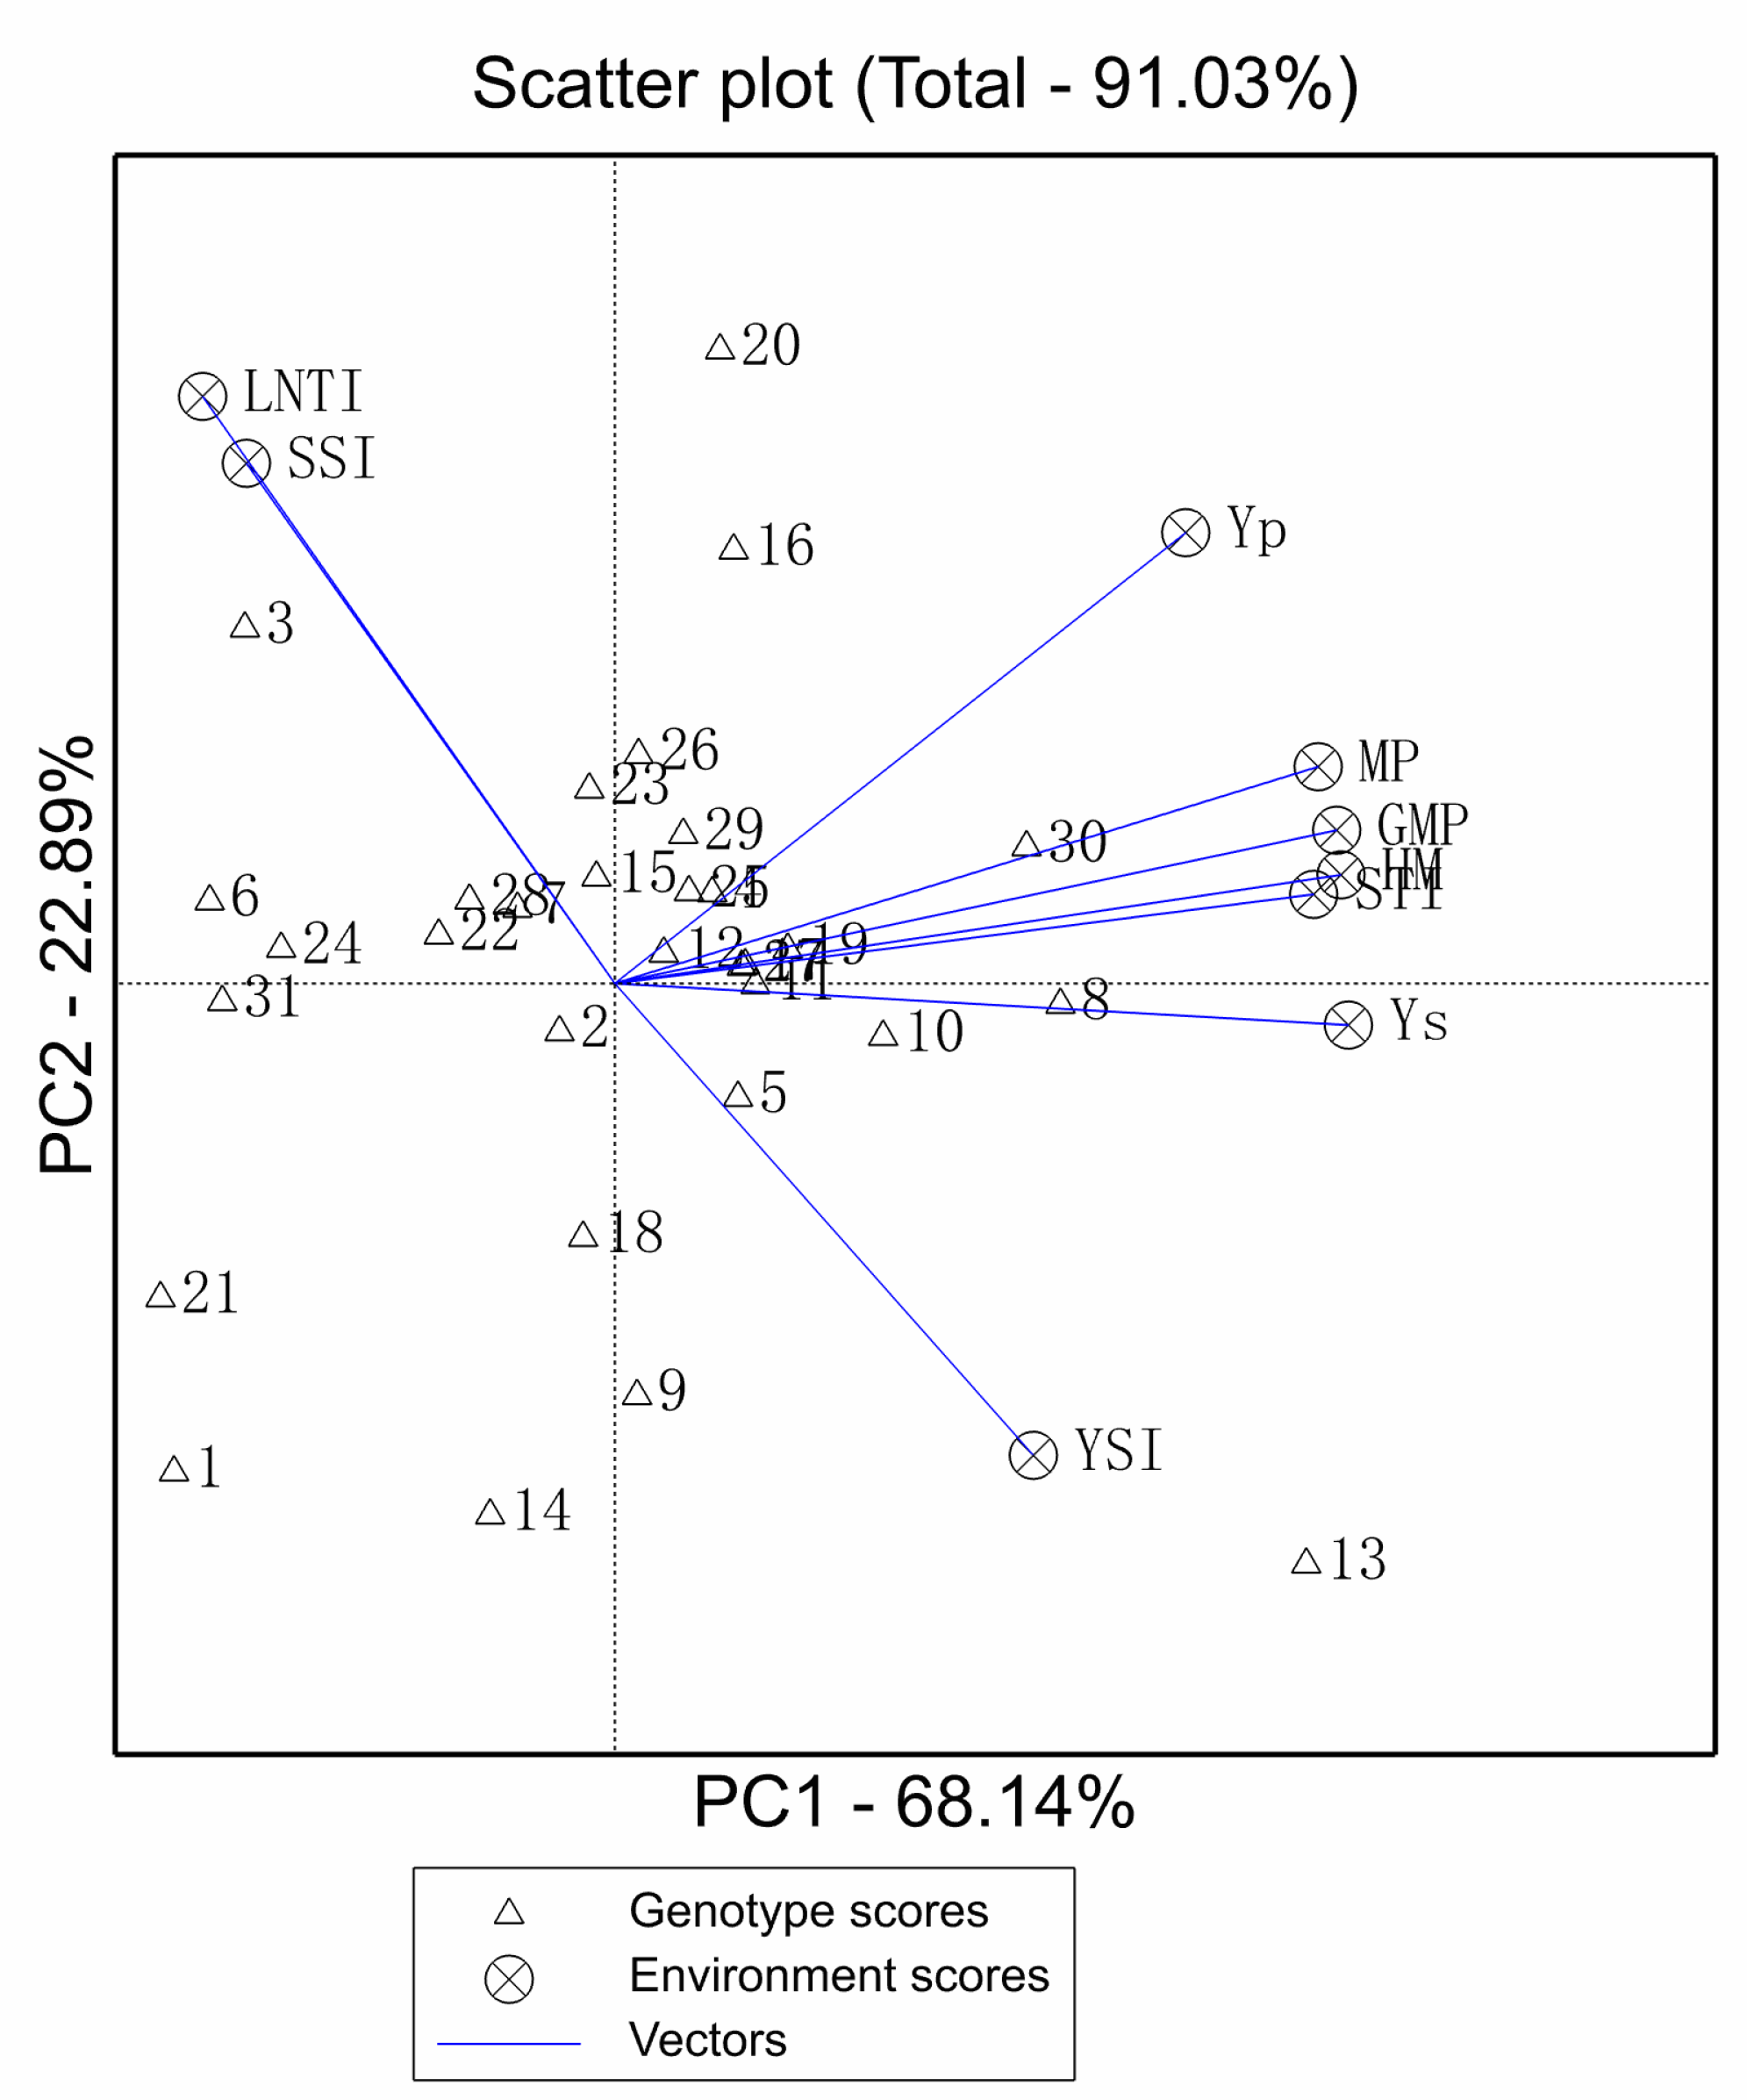
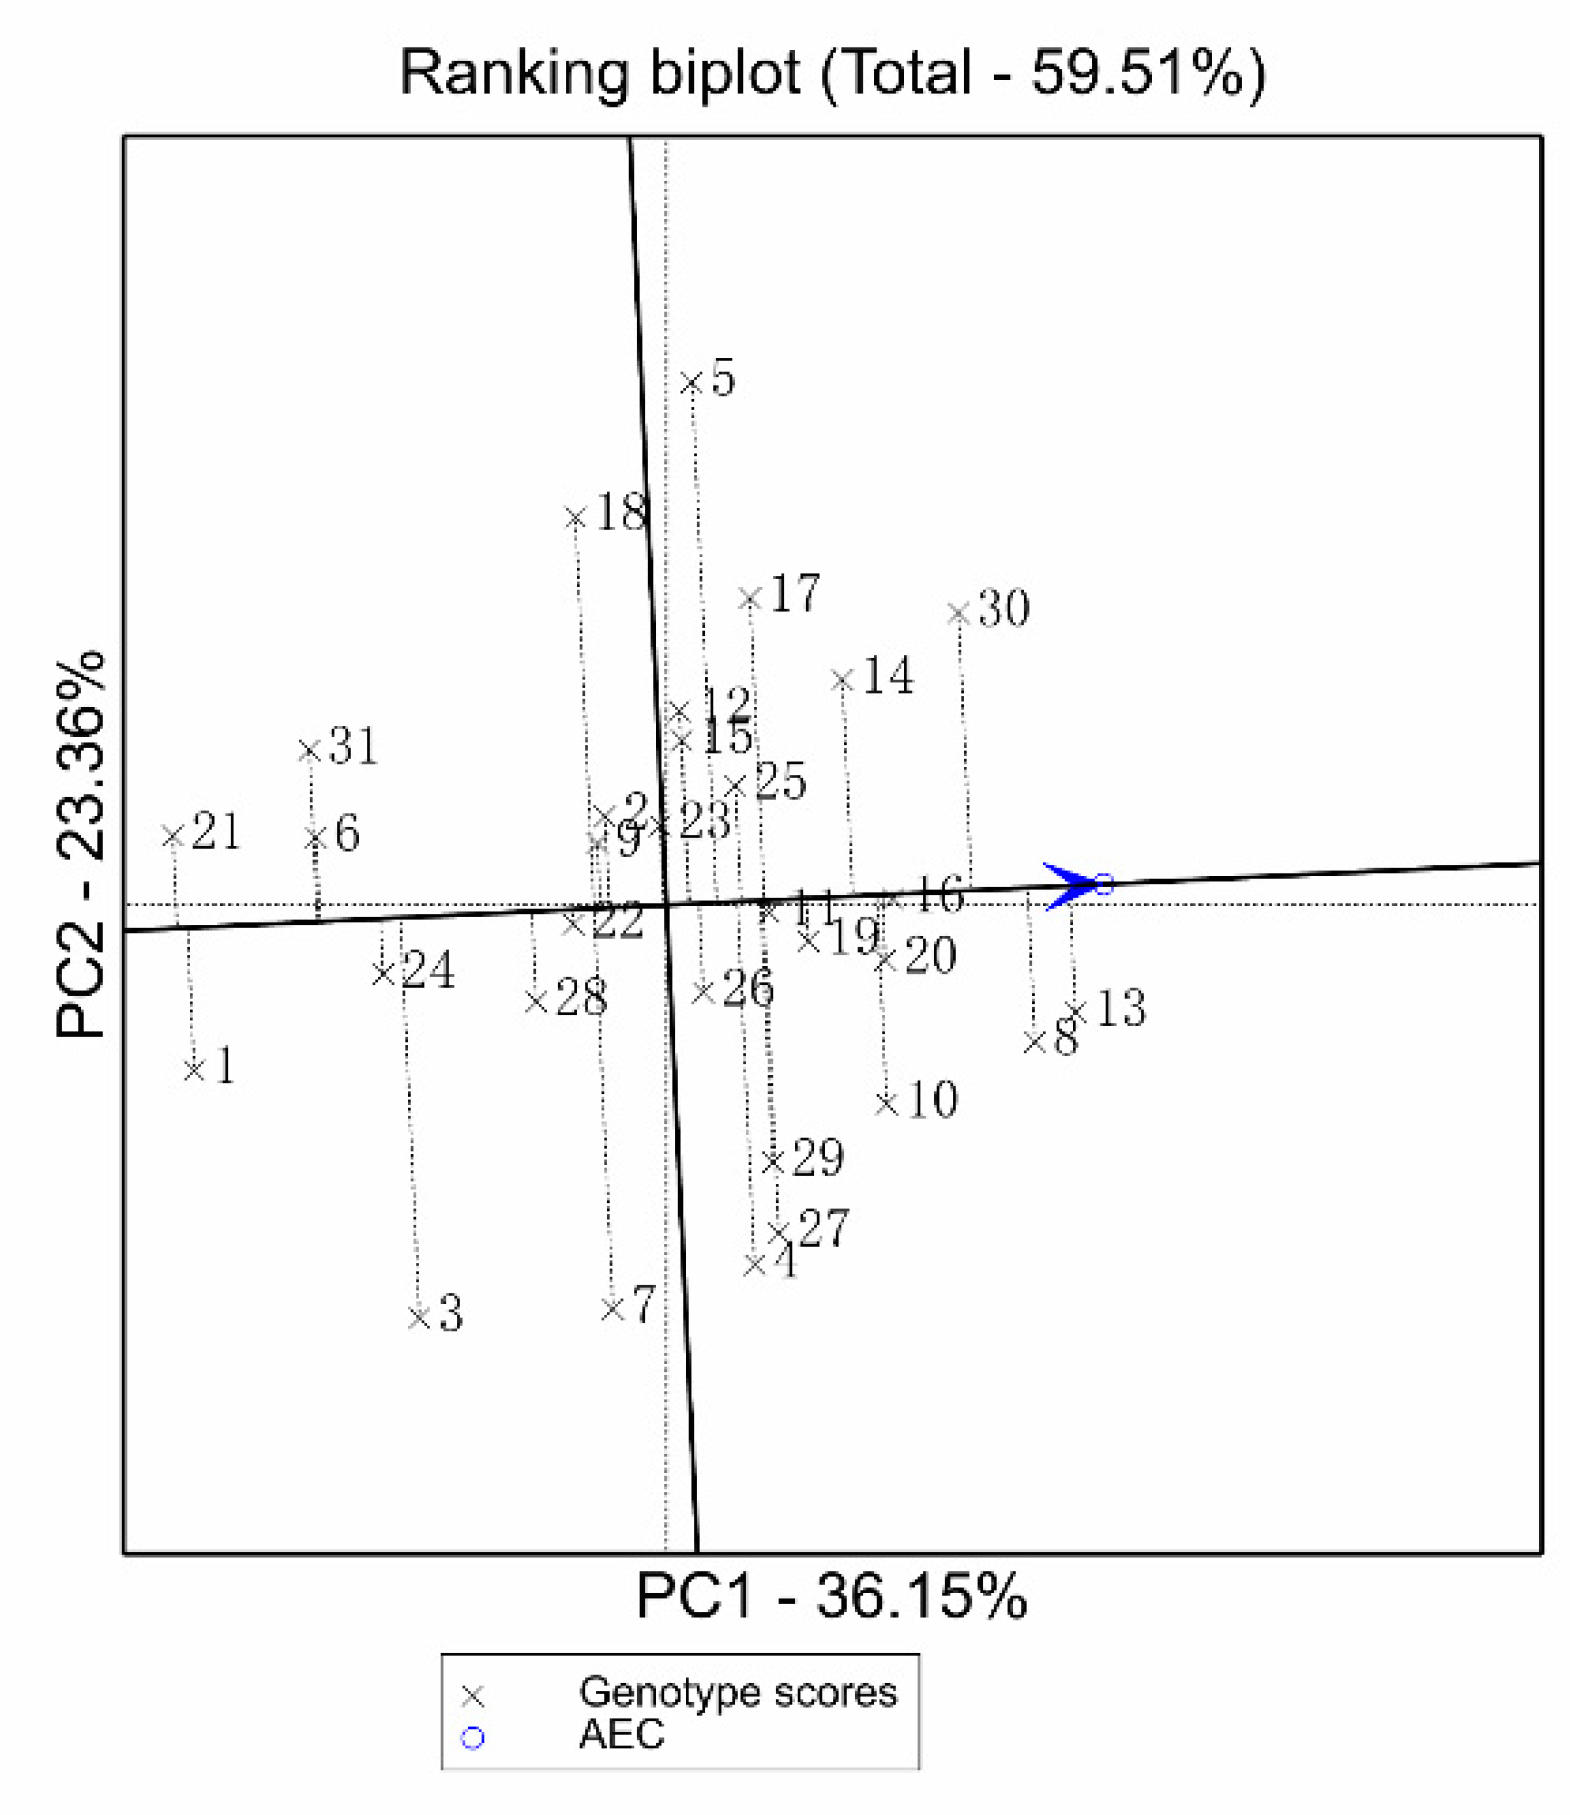
3.5. GGE Biplot for Seven Screening Indices and Grain Yield under HN and LN Treatments of 31 Inbred Lines

The yield and stability of maize inbred lines are shown in Figure 4. The GGE biplot was drawn using the value of Yp and Ys under all locations, all years, and containing 12 environments (HN+LN). The genotypes of PH6WC, KA105, KB081, KA225, 91227, and 2013KB-47 were located in front of the direction of the arrow, indicating that these genotypes could produce a high yield. However, KA008 and KB043 were located behind the direction of the arrow, implying that the two genotypes would produce the lowest grain yield. The stable inbred lines, which individually demonstrated good performance and stability, were observed in XCA-1, 91227, and 2013KB-37. The sensitive genotypes were identified as KA103, 2013KB-34, and KA064. In conclusion, the genotypes of PH6WC, KB081, 91227, 2013KB-37, and KA105 produce high values for high yield and yield stability. We discriminated the high-yielding and stable inbred lines that have the potential to breed desirable hybrids with great performance in both HN and LN conditions. The results of GGE biplot analysis agreed with the analysis of the screening indices, which verified the accuracy and efficiency of the assessment based on the index selected.

4. Discussion

4.1. Evaluation of Yield-Based Low Nitrogen Tolerance Indices

The general agreement is that the modern high yielding crop cultivars are more adaptable to HN conditions [38,39]. LN is regarded as an abiotic stress for the growth of maize plants, which hinders or limits the expression of their genetic potential in growth and development stages, thereby affecting the performance of grain yield [40]. Scholars have usually considered the accessions of maize were selected fittingly when maize plants were treated without or less N input [41]. In this study, seven screening indices, MP, GMP, STI, YSI, HM, SSI, and LNTI, were used to evaluate the different aspects of the performance of LN tolerance in 31 maize inbred lines. Geometric mean productivity (GMP) indicated the mean performance of a genotype across in the two environments of with and without N fertilizer [19]. The mean productivity index (MP) denotes as the mean grain yield in HN and LN environments. The definitions of GMP and MP imply that the two indices reflect the mean performance of yield under different N conditions, which could mistakenly identify the poor production and evaluate the genotype if the genotype had good production in one environment, but the poor in the other. Therefore, the selection of a desirable genotype using only GMP and MP is partial and could result in errors. Fernandez [19] reported that the stress tolerance index (STI) could be used to evaluate genotypes that have high production under both normal and stressed conditions. The STI depicts to performance under stress condition and Ymp, which is the mean yields of all cultivars under stressed and non-stressed conditions, which was considered to rectify the partial results shown above. Therefore, the STI value plays an important role in selection practice.
The genotype KB417 has a lower value of MP and GMP due to the low performance in grain yield, but a higher STI value, which implies that KB417 would be regarded as a genetic resource to provide the genetic variation for hybrids with stable yields. The value of the harmonic mean (HM) proposed high yield and stability to some extent [20]. By considering the high positive correlation between the GMP, MP, STI, and HM indices and grain yield under both HN and LN conditions, we confirmed that GMP, MP, HM, and STI together reflect the character of high yield and stable yield for maize plants. Similar results have been illustrated by other scholars in wheat, soybean, and rice [21,42,43,44].
Other results demonstrated a strong negative correlation between LNTI, SSI and grain yield under the LN condition. The SSI exhibited a degree of reduction in the grain yield under LN condition when compared to the grain yield under the HN condition [36]. The LNTI was proposed for evaluating the LN tolerant genotypes under stressed condition [16]. These indices show the sensitivity of maize inbred lines under LN conditions; meanwhile, there was no association with yield in optimal conditions. If the two indices used individually, then genotype are identified that could not response the stress under stressed conditions, the result is one-side. The SSI and LNTI could be used as supplementary indices, the similar results have been reported in other assays [18].

4.2. Analysis of the Low Nitrogen Tolerance Evaluation System for Maize

To use high NUE materials and screen for favorable genotypes, researchers have adopted a variety of methods to classify different maize varieties or inbred lines. Several analysis methods are available for evaluating LN tolerance and the NUE of maize inbred lines or hybrids. Fotyma et al. [45] concluded that crop N used could be grouped into agronomic efficiency and physiological efficiency. Whereas, Moll [46] suggested a NUE contained the uptake efficiency (UpE) and utilization efficiency (UtE), which reflect the ability of plants to absorb and accumulate nitrogen from soil and convert nitrogen into yield, respectively. Good et al. [47] identified the agronomic efficiency (AE), physiological efficiency (PE), and apparent recovery (AR) to reflect the response of plants to N fertilizer. The low nitrogen tolerant index (LNTI) and tolerant index (TI) were proposed to evaluate the efficiency of N use in different crops [16,18,48]. Previous studies of screening LN tolerant individuals have also focused on several physiological traits or agronomic traits, including root yield, sucrose content, starch content, leaf area, and above ground biomass [49]. Other researchers proposed different evaluation systems given different priorities in the study.
Many studies have been published regarding the search for suitable screening indicators to evaluate crop tolerance, but no agreement has been reached thus far [50]. The screening indices may provide another way to be screening. In our study, the BLUP value of the grain yield combined with PCA was used to select a LN tolerance index that could be used to evaluate the LN tolerant individuals, and five LN tolerant maize inbred lines were screened. The GGE biplot was also used to analyze the high yield and highly stable genotypes, which was completely consistent with the results of the analysis that was used to make selection based on the screening indices. The GGE biplot also screened out inbred lines that demonstrated special adaptability at different locations. The application of the GGE biplot method for N evaluation in maize inbred lines is still rare. Our research strengthens the support of the use of this method.

4.3. Selecting Low Nitrogen Tolerant Maize Accessions from Shaan A and Shaan B Groups

A good cultivar used in practice must produce both a high and stable yield to pursue economic interests. Our group has bred under LN and other abiotic stress conditions, with the purpose of choosing inbred lines with high and stable yields. Some inbred lines, such as 91227, have been proven successful [28,51]. Based on these successful inbred lines, we have approved more than 10 varieties including a national variety named Shaandan 609 (No. 2016001). These achievements show that our breeding strategy is efficient and feasible. In this study, 31 inbred lines chosen from the Shaan A and Shaan B groups were used to identify their LN tolerance. Using selection indices, a 3D diagram and GGE biplots verified, we identified the KA105, KB081, KA225, 91227, and 2013KB-47 as favorable genotypes with high quality performance under HN and LN conditions. These inbred lines can be used to provide the basic germplasm for our high-yield and low nitrogen breeding of maize in the future.

5. Conclusions

The results of this study suggest that the combination of the screening indices STI (stress tolerance index), MP (mean productivity), GMP (geometric mean productivity), and HM (harmonic mean) is suitable for determining genotypes with low nitrogen tolerance, as these indices consider the performance under optimal and limited nitrogen conditions. Based on a three-dimensional diagram and GGE biplots, we identified KA105, KB081, KA225, 91227, and 2013KB-47 as the desired genotypes that will provide the basic germplasm to breed high yield and stable yield maize hybrids.

Author Contributions

J.L. and J.X. conceived and designed the experiments; K.H., L.C. and Y.L., X.Z. performed the experiments; Z.Z., Z.F., and S.X. analyzed the data; Z.Z. wrote the paper.

Funding

This study was supported financially by the Key R&D Program of Science and Technology of Shaanxi Province (2017ZDCXL-NY-02-04), the Innovation Project of National Key R&D Program of China (2017YFD0101203), the National Natural Science Foundation of China (31301830), and the Innovation Project of Science and Technology of Shaanxi Province (2015KTZDNY01-01-01).

Conflicts of Interest

The authors declare no conflict of interest.

References

  1. Trachsel, S.; Leyva, M.; Lopez, M.; Suarez, E.A.; Mendoza, A.; Montiel, N.G.; Macias, M.S.; Burgueno, J.; San, V.F. Identification of tropical maize germplasm with tolerance to drought, nitrogen deficiency, and combined heat and drought stresses. Crop Sci. 2016, 56, 3031–3045. [Google Scholar] [CrossRef]
  2. Hirel, B.; Le-Gouis, J.; Ney, B.; Gallais, A. The challenge of improving nitrogen use efficiency in crop plants: Towards a more central role for genetic variability and quantitative genetics within integrated approaches. J. Exp. Bot. 2007, 58, 2369–2387. [Google Scholar] [CrossRef] [PubMed]
  3. Cai, H.; Chu, Q.; Gu, R.; Yuan, L.; Liu, J.; Zhang, X.; Chen, F.; Mi, G.; Zhang, F. Identification of QTLs for plant height, ear height and grain yield in maize (Zea mays L.) in response to nitrogen and phosphorus supply. Plant Breeding 2012, 131, 502–510. [Google Scholar] [CrossRef]
  4. Giles, J. Nitrogen study fertilizes fears of pollution. Nature 2015, 433, 791. [Google Scholar] [CrossRef] [PubMed]
  5. Galloway, J.N.; Townsend, A.R.; Erisman, J.W.; Bekunda, M.; Cai, Z.; Freney, J.R.; Martinelli, L.A.; Seitzinger, S.P.; Sutton, M.A. Transformation of the nitrogen cycle: Recent trends, questions, and potential solutions. Science 2008, 320, 889–892. [Google Scholar] [CrossRef] [PubMed]
  6. Zhu, Z.L.; Chen, D.L. Nitrogen fertilizer use in China-Contributions to food production, impacts on the environment and best management strategies. Nutr. Cycl. Agroecosyst. 2002, 63, 117–127. [Google Scholar] [CrossRef]
  7. Hakeem, K.R.; Ahmad, A.; Iqbal, M.; Gucel, S.; Ozturk, M. Nitrogen efficient rice cultivars can reduce nitrate pollution. Environ. Sci. Pollut. Res. 2011, 19, 607. [Google Scholar] [CrossRef]
  8. Liu, X.J.; Duan, L.; Mo, J.M.; Du, E.Z.; Shen, J.L.; Lu, X.K.; Zhang, Y.; Zhou, X.B.; He, C.E.; Zhang, F.S. Nitrogen depgosition and its ecological impacts in China: An overview. Environ. Pollut. 2011, 159, 2251–2264. [Google Scholar] [CrossRef] [PubMed]
  9. Wang, Z.B.; Wen, X.Y.; Zhang, H.L.; Liu, X.H.; Chen, F. Net energy yield and carbon footprint of summer corn under different N fertilizer rates in the North China Plain. J. Integr. Agric. 2015, 14, 1534–1541. [Google Scholar] [CrossRef]
  10. Khan, F.U.; Mohammad, F. Application of stress selection indices for assessment of nitrogen tolerance in wheat (Triticum aestivum L.). J. Anim. Plant Sci. 2016, 26, 201–210. [Google Scholar]
  11. Cerón-Rojas, J.J.; Crossa, J.; Toledo, F.H.; Sahagún-Castellanos, J. A predetermined proportional gains eigen selection index method. Crop Sci. 2016, 56, 2436–2447. [Google Scholar] [CrossRef]
  12. Dekkers, J.C. Prediction of response to marker-assisted and genomic selection using selection index theory. J. Anim. Breed. Genet. 2015, 124, 331–341. [Google Scholar] [CrossRef]
  13. Mohammadi, R.; Armion, M.; Kahrizi, D.; Amri, A. Efficiency of screening techniques for evaluating durum wheat genotYpes under mild drought conditions. Int. J. Plant Prod. 2010, 4, 11–24. [Google Scholar]
  14. Gavuzzi, P.; Rizza, F.; Palumbo, M.; Campaline, R.G.; Ricciardi, G.L.; Borghi, B. Evaluation offield and laboratory predictors of drought and heat tolerance in winter cereals. Can. J. Plant Sci. 1997, 77, 523–553. [Google Scholar] [CrossRef]
  15. Farshadfar, E.; Sutka, J. Multivariate analysis of drought tolerance in wheat substitution lines. Cereal Res. Commun. 2003, 31, 33–40. [Google Scholar]
  16. Francisco, M.; Pangirayi, T.; John, D. S1 selection of localmaize landraces for low soil nitrogen tolerance in Zambia. Afr. J. Plant Sci. 2010, 4, 67–81. [Google Scholar]
  17. Rosielle, A.A.; Hamblin, J. Theoretical aspects of selection for yield in stress and non-stress environment. Crop Sci. 1981, 21, 943–946. [Google Scholar] [CrossRef]
  18. Fischer, R.A.; Maurer, R. Drought resistance in spring wheat cultivars I. Grain yield responses. Aust. J. Agric. Res. 1978, 29, 897–912. [Google Scholar] [CrossRef]
  19. Fernandez, G.C.J. Effective selection criteria for assessing stress tolerance. In Proceedings of the International Symposium on Adaptation of Vegetables and Other Food Crops in Temperature and Water Stress, Taiwan, 13–18 August 1992. [Google Scholar]
  20. Kristin, A.S.; Senra, R.R.; Perez, F.I.; Enriquez, B.C.; Gallegos, J.A.A.; Vallego, P.R.; Wassimi, N.; Kelley, J.D. Improving common bean performance under drought stress. Crop Sci. 1997, 37, 43–50. [Google Scholar]
  21. Jafari, A.; Paknejad, F.; Alahmadi, M.J. Evaluation of selection indices for drought tolerance of corn (Zea mays L.) hybrids. Int. J. Plant Prod. 2009, 3, 33–38. [Google Scholar]
  22. Homa, I.; Habibollah, S.; Babak, R.; Shahpoor, A. Ecaluation of salt tolerance in rice (Oryza Sativa L.) cultivars and line with emphasis on stress tolerance indices. Nature 2013, 441, 1153. [Google Scholar]
  23. Ganjeali, A.; Porsa, H.; Bagheri, A. Assessment of Iranian chickpea (Cicer arietinum L.) germplasms for drought tolerance. Agric. Water Manag. 2011, 98, 1477–1484. [Google Scholar] [CrossRef]
  24. Horn, L.; Shimelis, H.; Sarsu, F.; Mwadzingeni, L.; Laing, M.D. Genotype-by-environment interaction for grain yield among novel cowpea (Vigna unguiculata L.) selections derived by gamma irradiation. Crop J. 2017, 6, 306–313. [Google Scholar] [CrossRef]
  25. Badu-Apraku, B.; Oyekunle, M. Genetic analysis of grain yield and other traits of extra-early yellow maize inbreds and hybrid performance under contrasting environments. Field Crops Res. 2012, 129, 99–110. [Google Scholar] [CrossRef]
  26. Tonk, F.A.; Ilker, E.; Tosun, M. Evaluation of genotype × environment interactions in maize hybrids using GGE biplot analysis. Crop Breed. Appl. Biotechnol. 2011, 11, 01–09. [Google Scholar] [CrossRef]
  27. Yan, W.; Hunt, L.A.; Sheng, Q.; Szlavnics, Z. Cultivar evaluation and mega-environment investigation based on GGE biplot. Crop Sci. 2000, 40, 597–605. [Google Scholar] [CrossRef]
  28. Yan, W.K.; Kang, M.S.; Ma, B.L.; Woods, S.; Cornelius, P.L. GGE Biplot vs. AMMI Analysis of GenotYpe-by-Environment Data. Crop Sci. 2007, 47, 641–653. [Google Scholar] [CrossRef]
  29. Bahrami, F.; Arzani, A.; Karimi, V. Evaluation of yield-based drought tolerance indices for screening safflower genotYpes. Agron. J. 2014, 106, 1219–1224. [Google Scholar] [CrossRef]
  30. Han, Y.P.; Zhao, X.; Teng, W.L.; Sun, M.M.; Zhang, H.J.; Li, W.B. Perform stability of fatty acids of soybean cultivar evaluated by GGE biplot. Soybean Sci. 2014, 33, 514–518. [Google Scholar]
  31. Dehghani, H.; Feyzian, E.; Mokhtar, J.; Abdolmajid, R.; Fenny, D. Use of GGE biplot methodology for genetic analysis of yield and related traits in melon (Cucumis melon L.). Can. J. Plant Sci. 2017, 92, 77–85. [Google Scholar] [CrossRef]
  32. Li, T.; Qu, J.Z.; Wang, Y.H.; Chang, L.G.; He, K.H.; Guo, D.W.; Zhang, X.H.; Xu, S.T.; Xue, J.Q. Genetic characterization of inbred lines from Shaan A and B groups for identifying loci associated with maize grain yield. BMC Genet. 2018, 19, 63. [Google Scholar] [CrossRef] [PubMed]
  33. Bouslama, M.; Schapaugh, W.T. Stress tolerance in soybean. Part 1: Evaluation of three screening techniques for heat and drought tolerance. Crop Sci. 1984, 24, 933–937. [Google Scholar] [CrossRef]
  34. Kirkpatrick, L.A.; Feeney, B.C. A Simple Guide to IBM SPSS: For Version 22.0; Cengage Learning: Boston, MA, USA, 2014. [Google Scholar]
  35. Emebiri, L.C.; Matassa, V.; Moody, D.B. GENSTAT Programs for Performing Muir’s Alternative Partitioning of Genotype-by-Environment Interaction. J. Hered. 2005, 96, 78–79. [Google Scholar] [CrossRef]
  36. SAS, Institute, Inc. SAS/STAT User’s Guide, Version 6; SAS Institute Inc.: Cary, NC, USA, 2010. [Google Scholar]
  37. He, K.H.; Chang, L.G.; Dong, Y.; Cui, T.T.; Qu, J.Z.; Liu, X.Y.; Xu, S.T.; Xue, J.Q.; Liu, J.C. Identification of quantitative trait loci for agronomic and physiological traits in maize (Zea mays L.) under high-nitrogen and low-nitrogen conditions. Euphytica 2018, 214, 15. [Google Scholar] [CrossRef]
  38. Akçura, M.; Partigoç, F.; Kaya, Y. Evaluating of drought stress tolerance based on selections indices in Turkish bread wheat landraces. J. Anim. Plant Sci. 2011, 21, 700–709. [Google Scholar]
  39. Dencic, S.; Kastori, R.; Kobiljski, B.; Duggan, B. Evaluation of grain yield and its components in wheat cultivars and landraces under near optimal and drought conditions. Euphytica 2000, 113, 43–52. [Google Scholar] [CrossRef]
  40. Rehman, S.; Harris, P.J.C.; Ashraf, M. Stress environments and their impact on crop production. In Abiotic Stresses: Plant Resistance through Breeding and Molecular Approaches; Food Products Press: New York, NY, USA, 2005; pp. 3–18. [Google Scholar]
  41. Ceccarelli, S.; Grando, S.; Impiglia, A. Choice of selection strategy in breeding barley for stress environments. Euphytica 1998, 103, 307–318. [Google Scholar] [CrossRef]
  42. Shiranirad, A.H.; Abbasian, A. Evaluation of drought tolerance in rapeseed genotypes under non stress and drought stress conditions. Notulae Bot. Horti Agrobot. Cluj-Napoca 2011, 39, 164–171. [Google Scholar] [CrossRef]
  43. Nouri, A.; Etminan, A.; Silva, J.A.T.; Mohammadi, R. Assessment of yield, yield-related traits and drought tolerance of durum wheat genotypes (Triticum turjidum var. durum Desf.). Aust. J. Crop Sci. 2011, 5, 8–16. [Google Scholar]
  44. Lyra, D.H.; de Freitas Mendonça, L.; Galli, G.; Alves, F.C.; Granato, Í.S.C.; Fritsche-Neto, R. Multi-trait genomic prediction for nitrogen response indices in tropical maize hybrids. Mol. Breed. 2017, 37, 80. [Google Scholar] [CrossRef]
  45. Fotyma, E.; Fotyma, M. The agronomical and physiological efficiency of nitrogen applied for arable crops in Poland. Fertil. Res. 1995, 43, 9–12. [Google Scholar] [CrossRef]
  46. Moll, R.H.; Kamprath, E.J.; Jackson, W.A. Analysis and interpretation of factors which contribute to efficiency of nitrogen utilization. Agron. J. 1982, 74, 562–564. [Google Scholar] [CrossRef]
  47. Good, A.G.; Shrawat, A.K.; Muench, D.G. Can less yield more? Is reducing nutrient input into the environment compatible with maintaining crop production? Trends Plant Sci. 2004, 9, 597–605. [Google Scholar] [CrossRef]
  48. Wu, Y.S.; Liu, W.G.; Li, X.H.; Li, M.S.; Zhang, D.G.; Hao, Z.F.; Weng, J.F.; Xu, Y.B.; Bai, L.; Zhang, S.H.; et al. Low-nitrogen stress tolerance and nitrogen agronomic efficiency among maize inbreds: Comparison of multiple indices and evaluation of genetic variation. Euphytica 2011, 180, 281–290. [Google Scholar] [CrossRef]
  49. Duan, W.; Wang, Q.; Zhang, H.; Xie, B.; Li, A.; Hou, F.; Dong, S.; Wang, B.; Qin, Z.; Zhang, L. Differences between nitrogen-tolerant and nitrogen-susceptible sweetpotato cultivars in photosynthate distribution and transport under different nitrogen conditions. PLoS ONE 2018, 13, e0194570. [Google Scholar] [CrossRef]
  50. Zhong, S.R.; Gong, S.Y.; Zhang, S.C.; Chen, R.X.; Liu, Q.Y.; Zhai, X.Q. Research progress on low nitrogen tolerance and nitrogen efficiency in crop plants. J. Nucl. Agric. Sci. 2018, 32, 1656–1663. [Google Scholar]
  51. Wang, B.X.; Wang, Y.H.; Chen, P.F.; Li, D.Y.; Feng, Z.Q.; Hao, Y.C.; Zhang, R.H.; Zhang, X.H.; Xue, J.Q. Combining ability of maize inbred lines from Shaan A Group and Shaan B group under different density conditions. Acta Agron. Sinica 2017, 43, 1328–1336. (In Chinese) [Google Scholar] [CrossRef]
Figure 1. Correlation coefficients and diagram between grain yield (Yp and Ys) and seven screening index values for the 31 inbred lines. Data above the diagonal are the correlation coefficients. Data below the correlation coefficients are the confidence intervals. The pie charts below the diagonal indicates the correlation size. The blue color in the clockwise pie charts indicates that the two variables are positively correlated, and the red color in the counterclockwise pie charts indicates that the variables are negatively correlated.
Agronomy 09 00240 g001
Figure 2. Drawing of the Genotype and genotype × environment (GGE) biplot based on the first (PC1) and the second (PC2) principal component for 31 inbred lines and different indices. Transform = 0, Scaling = 0, Centering = 2, and SVP = 2. Numbers assigned to the genotypes are:(1) KA008; (2) 2012KA-1; (3) KA064; (4) 2012KA -58; (5) KA103; (6) KA203; (7) 2013KA-34; (8) KA105; (9) KA227; (10) KA225; (11) XCA-1; (12)KA060; (13)KB081; (14) KB417; (15) KB109; (16)91227; (17)KB-7; (18) KB020; (19) 2013KB-37; (20) 2013KB-47; (21) KB043;(22)Z140588; (23) Z140580; (24) 2013HXB-4; (25) 2013ZZB-6; (26) 2014KB-54; (27) KB215; (28) Zheng58; (29) Chang7-2; (30) PH6WC; and (31) PH4CV. Dotted vertical and horizontal lines indicate points where the PC1 and PC2 axes had values of zero. Smaller vectors angles indicate a larger correlation value, a positive correlation exists, when the angle is less than 90°, and a negative correlation when greater than 90°.
Agronomy 09 00240 g002
Figure 3. Three-dimensional diagram for identifying LN tolerant genotypes based on Yp and Ys as well as the STI.
Agronomy 09 00240 g003
Figure 4. GGE biplot of high yield and stable maize inbred lines. Transform = 0, Scaling = 0, Centering = 2, and SVP = 1. The small circle represents the average environment and the straight line with an arrow is the average environment vector that points in the direction of greater performance. The vertical line drawn by the origin to the average environment vector represents the sensitivity of the participating inbred. From the point of the genotype to the average environment, the vector is perpendicular. The longer the perpendicular, the more sensitive the genotype. Conversely, the shorter the projection, the more stable the variety.
Agronomy 09 00240 g004
Table 1. Best linear unbiased prediction (BLUP) value for grain yield under high nitrogen (HN) (Yp) and low nitrogen (LN) (Ys) and seven screening index values for 31 inbred lines.
CodeGroup1GenotypeYp (kg ha−1)Ys (kg ha−1)GMPHMMPSTIYSILNTISSI
1Shaan AKA0085184.353705.164392.914306.594471.990.490.710.240.95
2Shaan A2012KA-16107.004214.435091.764989.915203.150.670.680.280.93
3Shaan AKA0646235.583636.094653.104399.804969.880.620.620.421.19
4Shaan A2012KA-586466.164400.155318.045180.475385.220.810.670.270.97
5Shaan AKA1036401.764393.075315.925203.675444.960.730.710.240.80
6Shaan AKA2035920.333626.734589.254397.794805.050.530.640.361.09
7Shaan A2013KA-346317.184047.094987.974789.975223.450.710.650.330.85
8Shaan AKA1056734.334923.365780.165698.235887.490.950.700.220.67
9Shaan AKA2275899.124370.325089.305009.215178.110.670.710.210.61
10Shaan AKA2256410.794740.255530.165450.855628.760.860.690.250.72
11Shaan AXCA-16399.934466.135372.685278.985481.750.780.700.260.90
12Shaan AKA0606291.864369.855267.455170.895377.200.720.690.271.00
13Shaan BKB0816591.795272.055918.445869.125995.131.010.980.150.55
14Shaan BKB4175450.834064.384727.304661.264792.660.800.760.190.87
15Shaan BKB1096274.734282.335179.445055.695323.330.700.690.301.09
16Shaan B912276824.744347.145441.655269.805630.590.830.650.361.07
17Shaan BKB-76433.134461.625368.645258.735496.270.760.680.270.84
18Shaan BKB0206194.174118.805043.454902.055198.030.640.690.250.63
19Shaan B2013KB-376472.234532.605406.495284.905552.750.810.700.260.92
20Shaan B2013KB-476929.634325.995500.275344.825678.260.830.660.381.37
21Shaan BKB0435411.193643.144411.334276.454555.110.490.660.290.88
22Shaan BZ1405886061.744016.024922.824783.605077.770.640.680.321.07
23Shaan BZ1405806382.424212.835198.925070.635342.110.710.660.321.06
24Shaan B2013HXB-45807.663800.684710.444585.854837.650.570.660.341.12
25Shaan B2013ZZB-66256.824484.765322.615240.095418.730.750.710.271.17
26Shaan B2014KB-546465.354276.595259.685120.535417.120.760.660.321.06
27Shaan BKB2156382.604463.205309.475185.885471.440.820.690.270.89
28ChecksZheng586198.424003.974972.654819.705140.920.660.650.330.94
29ChecksChang7-26378.994471.965147.365344.595244.570.840.660.301.02
30ChecksPH6WC6950.854795.115789.195675.065931.180.910.690.250.77
31ChecksPH4CV5782.553674.204591.154436.344759.620.530.670.341.10
1 Group indicates the population that the genotypes were selected. GMP: geometric mean productivity, HM: harmonic mean, MP: mean productivity, STI: stress tolerance index, YSI: yield stability index, LNTI: low nitrogen tolerance index, SSI: stress susceptibility index, the same below.
Table 2. Combined analysis of variance for the BLUP of grain yield under HN (Yp) and LN(Ys) and seven screening index values for 31 inbred lines.
Source of VariationDfF
YpYsSSISTIMPGMPYSIHMLNTI
Genotype (G)3012.053**7.192**3.037**20.545**11.36**13.301**2.334**10.524**2.616**
Year (Y)27.11**31.34**5.994**16.703**25.951**34.471**18.105**30.118**17.411**
Location (L)11012.76**4.196*0.764247.582**304.328**219.199**261.056**97.121**256.633**
G × Y601.65**1.1581.884**1.447*1.2691.544*1.435*1.436*1.477*
G × L309.969**5.114**6.958**14.068**8.32**8.421**4.586**6.957**4.481**
G × L × Y602.742**1.726**2.532**2.303**2.683**2.843**1.3072.366**1.31
* indicates difference at p < 0.05 level; ** indicates significant difference at p < 0.01 level. Df indicates degrees of freedom.
Table 3. Results of principal component analysis for grain yield under HN (Yp) and LN (Ys) and seven screening index values for 31 inbred lines.
Contribution to VariationCumulative PercentageYpYsGMPMPSTISSIYSIHMLNTI
————%——————kg ha−1——
PC168.1468.140.770.990.970.950.94−0.500.560.98−0.56
PC222.8991.030.61−0.060.210.290.120.70−0.640.150.79

