Article

Exploring Optimal Tillage Improved Soil Characteristics and Productivity of Wheat Irrigated with Different Water Qualities

by
Mahmoud F. Seleiman
1,2,*,
Ahmed M. S. Kheir
3,
Sami Al-Dhumri
4,
Abdulaziz G. Alghamdi
5,
El-Said H. Omar
3,
Hesham M. Aboelsoud
3,
Kamel A. Abdella
1 and
Waleed H. Abou El Hassan
6
1
Plant Production Department, College of Food and Agriculture Sciences, King Saud University, P.O. Box 2460, Riyadh 11451, Saudi Arabia
2
Department of Crop Sciences, Faculty of Agriculture, Menoufia University, 32514 Shibin El-kom, Egypt
3
Soils, Water and Environment Research Institute, Agricultural Research Center, Giza 12112, Egypt
4
Department of Biology, College of Science and Education, Taif University, Taif 21974, Saudi Arabia
5
Soil Science Department, College of Food & Agricultural Sciences, King Saud University, P.O. Box 2460, Riyadh 11451, Saudi Arabia
6
Water Management Research Institute, National Water Research Center, Delta Barrages 13621/5, Egypt
*
Author to whom correspondence should be addressed.
Agronomy 2019, 9(5), 233; https://doi.org/10.3390/agronomy9050233
Submission received: 15 April 2019 / Revised: 2 May 2019 / Accepted: 2 May 2019 / Published: 8 May 2019

Abstract

:
Irrigation with low water quality can adversely affect soil characteristics, optimal moisture for tillage, and crop productivity, particularly in arid and semi-arid regions. We determined the optimal moisture for tillage processing and the effects of optimal and wet tillage on physical and chemical soil characteristics and wheat productivity after irrigation with different water qualities (waste, saline, and highly saline water). We used the Atterberg limit to determine the suitable moisture content for tillage. Tillage at optimal moisture content improved soil characteristics by reducing soil salinity, sodicity, bulk density, shear strength, compaction, and increasing hydraulic conductivity compared to that of wet tillage. It also enhanced growth and productivity of wheat grown with low quality of water (i.e., fresh and waste water), resulting in higher grain yield and root weight at different growth stages than that of saline and highly saline water. In conclusion, tillage at optimal moisture content alleviates the impact of salinity through improving soil physical and chemical characteristics. Optimum tillage can be applied at 20 and 24 days from the previous irrigation in saline and highly saline soils, respectively. Irrigation with waste water resulted in a higher wheat grain yield than saline and highly saline water.

1. Introduction

Salinity and sodicity issues in either irrigation water or soil are considered a threat to the soil characteristics, microorganisms, agricultural crop productivity and global food security [1,2]. In addition, rapid human population growth with limited water resources is a critical and growing global issue. In Egypt (Figure 1), saline-sodic soils represent about 30 of the Northern Nile Delta region [3]. This region also suffers from limited fresh irrigation water, and depends mainly on waste and drainage water for the irrigation of food and fodder crops. Irrigated land in the Nile Delta of Egypt is about 9.8 M ha, and most of the soil in this region is alluvial and characterized by a heavy clay texture. Salinity and sodicity, due to the irrigation with low water quality and sea water intrusion, are the factors that cause soil degradation and create a threat to crop production [3].
Efforts to amend degraded soil involve the application of organic and chemical compounds [2,4] or creation of an appropriate drainage system [5]. Furthermore, the relationship among soil salinity, irrigation water quality and tillage time has not been examined under such conditions. The negative effects of soil tillage application at unsuitable soil moisture appear through forming a shallow hardpan layer in the soil. This layer can deteriorate soil physical properties, limit root growth, and consequently reduce crop productivity. Identifying the optimal soil moisture for tillage can reduce the consumed energy [6]. The appropriate soil moisture for optimal tillage can be determined by identifying the Atterberg limits (ALS). Atterberg limits include three main characteristics, which are the upper plastic limit (liquid limit, LL), lower plastic limit (plastic limit, PL), and friability index (FI) [7]. Therefore, ALS should be determined to identify the optimal soil moisture prior to tillage. Moreover, increasing salinity and sodicity in irrigation water resources, and thus in different soils, can have a direct impact on ALS and soil characteristics [8]. Consequently, it can affect crop productivity and quality. Thus, attention should be paid to a suitable assessment for the management of water resources issues [9].
Wheat (Triticum aestivum L.) is a cereal crop that is considered one of the most strategic crops worldwide [4,10]. Egypt produces about 50% of the total local consumption (20 M t) annually, and it is considered one of the largest wheat importing countries worldwide [11,12]. Wheat is cultivated on about 30% of the total irrigated agricultural land in the North Nile Delta of Egypt. The soil in this region of Egypt suffers from degradation as a result of the high salinity [2].
Therefore, the main objectives of the current research investigation were: (1) to identify suitable soil moisture for optimal tillage in different soils irrigated with numerous irrigation water qualities, and (2) to assess the impacts of tillage in optimal and wet moisture on soil physical and chemical characteristics as well as on wheat growth and productivity.

2. Materials and Methods

2.1. Experimental Design and Field Practices

Two factors were investigated (i.e., water quality and tillage treatments) in a factorial experiment to study their effect on soil characteristics and productivity of wheat (Triticum aestivum L., cv “Misr 1”) during two winter growing seasons in the North Nile Delta, Egypt. Four locations (Figure 1) were selected based on irrigation water quality (i.e., River Nile fresh water, waste water, saline drainage water, and highly saline drainage water), representing most irrigation water sources in this region. The second factor, tillage, included two treatments (i.e., wet and optimal tillage). The required soil moisture of wet and optimal tillage was derived from Figure 2 and Figure 3. Following the preceding crop, soils were irrigated, and moisture content was determined daily until the required moisture of wet tillage (LL) and optimal tillage (FI) was obtained (Figure 2; Figure 3). The type of tillage used in all locations was the conventional tillage, using the moldboard plow (30 cm depth) followed by laser land leveling. The optimum tillage derived from friability index was performed after 16, 16, 20 and 24 days from the last irrigation for locations irrigated with fresh, waste, saline and highly saline water respectively.
The experimental plot area was 10 m length × 10 m width (=100 m2). Wheat grains were sown with a rate of 140 kg ha−1 on 16th November and 18th November during 2016 and 2017 seasons, respectively. Fertilizers were applied as soil amendment at the rates of 180 kg N ha−1 on two equal doses before first and second irrigation, 35 kg P2O5 ha−1 during tillage process, and 55 kg K2O ha−1 as one dose directly before first irrigation. Weeds were controlled using Granstar 75% DF (tribenuron-methyl; 19.2 g ha−1) at 25 days after sowing (BBCH stage 13) [13], and Topic 15% WP (clodinafop-propargyl; 350 g ha−1) at 45 days after sowing (BBCH stage 30) [13].

2.2. Study Locations, Soil and Water Properties

The four different water resources were used in four different locations (Figure 1) as follows: fresh water (source: River Nile) as control; waste water (source: Gharbia main drain); saline water (source: Nashart drain), and; highly saline water (source: Omoum drain). The physical and chemical analysis of soil from each location are shown in Table 1. Soil texture was silty clay in the four locations. The preceding crop in all locations was rice in the first growing season and maize in the second season. The soil salinity (EC; dS m−1) and sodium adsorption ration (SAR; %) of irrigation water were: fresh, 0.45 and 3.0; waste, 1.21 and 5.5; saline, 7.50 and 13.2; and highly saline water, 7.80 and 16.5, respectively. In waste water, nitrate-nitrogen, ammonium-nitrogen, phosphate-phosphorus and potassium were 10.1, 5.0, 2.5 and 2.1 mg/L, respectively. From each location, three replications were assessed. Interestingly, all locations were restricted to the first climatic zone at high latitudes, confirming the similarity of weather conditions (Figure 2).
The Atterberg limit (ALS) characteristics were determined in different soils prior to cultivation in order to identify the suitable moisture content of tillage (friability range) under different soil qualities. Soil ALS as moisture content is presented in Figure 2, and converted hereafter to time elapsed after irrigation. After determining ALS for each soil, tillage was performed at two types of moisture content, i.e., at optimal and wet moisture content, to explore and assess the impacts of both tillage types on physical and chemical characteristics of soil as well as on crop productivity.
Scheduling of irrigation for all plots was applied based on 50% moisture depletion of soil available water. The applied irrigation water quantity was calculated by compensating soil moisture before the irrigation up to the field capacity. Leaching requirements (LR), according to [14], were calculated before the application of the irrigation (particularly ND and OD), as follows:
L R =   E C i w 5 ( E C e E C i w )
where: ECiW = salinity of water (dS m−1); and ECe = crop tolerance for soil salinity (dS m−1) based on the measured soil EC.
Applied irrigation was measured and controlled using a cut throat flume (20 × 90 cm) according to Early [15] using the following equations:
F r e e   f l o w   Q = C   × ( H a ) n
where: Q = Discharge in cumecs (1 cumecs = 10 m3); C = flow discharge coefficient = 0.74 for (20 × 90); n = constant = 1.84; Ha = water head at upper stream gauge.
S u b m e r g e d   f l o w   Q = C   ( H a H b ) n   ( log 10 S )
where: C = 0.413 for 20 × 90; Hb = water head at downstream gauge; n = 1.482 for CTF of 20 × 90; S = actual submergence fraction (Hb/Ha); if (Hb/Ha) ≤ 65% = free flow; if (Hb/Ha) ≥ 65% = sub-mergence flow.

2.3. Measurements

2.3.1. Soil Physical and Chemical Analysis

Before tillage, soil Atterberg limits (liquid limit, LL; plastic limit, PL, and; friability index, FI) were determined according to the standard methods of [16] for controling the required moisture of tillage treatments. The LL was determined by the Casagrande three-point method. Soil samples were saturated with distilled water, remolded and put in the dish of Casagrande apparatus. The sample was divided into two parts by a grooving tool. The dish was alternatively raised above the base by a crank and dropped freely into the base until the two sides of a groove come together. The number of blows required to do this was recorded. The linear relationship between the water content and the log of the number of blows was plotted, and the gravimetric water content corresponding to 25.0 blows was recorded as the LL [16,17]. The PL was determined by measuring the soil moisture content at which the soil crumbles, when it was rolled down to a thread of about 3.0 mm in diameter [16,17]. The FI was calculated as the difference between LL and PL.
Soil samples for different locations prior to sowing and at harvest were collected and analyzed for chemical analysis (EC and ESP) using standard method described by Cottenie [18], Burt [19], Nelson [20] (Table 1, Figure 4). Soil physical properties were analyzed using undisturbed soil samples as described by Garcia [21] and Klute [22]. Soil field capacity (FC) and wilting point (WP) were measured using pressure membrane apparatus by determining the moisture contents at 0.33 and 15 bars. Saturated hydraulic conductivity (Ks) was determined by a Guelph permeameter apparatus (Model 2800, Eijkelkamp Company, Goor, Netherlands) as described by Reynolds and Elrick [23] using the following equation:
K f s = ( 0.0041 ) ( Y )   ( R 2 ) ( 0.0054 ) ( Y ) ( R 1 )
where R1 = the rate of water level change in well (H1) set at 5 cm; R2 = the rate of water level change in well (H2) set at 10 cm; Y = the reservoir constant, when the inner reservoir in clay soil = 2.14 cm2.
Soil compaction as a function of penetration resistance was determined in the field capacity as described by Herrick and Jones [24]. Soil shear strength (SS) was also determined in the field using the van shear test [25] by inserting the van into the soil at a known depth and rotating it manually to measure the maximum torque (T max). Then, SS was calculated according the following equation:
C = T   max π   [ dh 2 2 + d 6 ] 3
where C = soil shear strength expressed as cohesiveness (N cm−2); d = diameter of the van (cm); h = the length of van (cm); T max = maximum torque (N.m).

2.3.2. Wheat Yield, Phenology, Water Productivity and Root Weight Density

At maturity, one m2 area from the middle of each experimental plot was harvested and weighed to obtain the total biomass (biological yield). Then, the grains of the harvested area of wheat plants were separated through a thresher machine, dried overnight in an oven at 70 °C and weighed to obtain the grain yield. The straw yield was obtained by subtracting the grain yield from biological yield. Furthermore, phenological development stages such as anthesis (days from sowing to heading, i.e., from sowing until 50% of spikes emerge completely from the flag sheath) and maturity (days from sowing until 50% of peduncles turned yellow) were recorded. Water productivity was calculated via dividing grain yield by the applied irrigation water. Roots were collected at different growth stages (i.e., tillering, anthesis, and maturity) using collecting soil cores [26] and measuring root characteristics. The core diameter was 8.0 cm and 10.0 cm in length. Then, the collected soil and roots were soaked in water and sieved through a 0.25 mm grid. The obtained roots were cleaned, and healthy roots (white or brown) were separated from dead roots and organic debris [27]. Finally, root weight density (mg roots cm−3 soil) was calculated according to Li [26].

2.4. Statistical Analysis

Data obtained from the effects of different water resources and tillage methods on wheat and soil characteristics were subjected to an ANOVA using PASW statistics v. 21.0 (IBM Inc., Chicago, IL, USA). Standard error of mean (S.E.M.) was obtained from analysis of variance table.

3. Results

3.1. Suitable Moisture of Optimal and Wet Tillage in Soils Irrigated with Different Water Qualities

Soil LL and PL were higher in saline water (ND) and highly saline water (OD) irrigation than that of soil irrigated with fresh (MY) and waste water (GMD) (Figure 2). The lowest FI was obtained from soil irrigated with waste water in comparison to other soils (Figure 2). Liquid limit (LL) increased by 1.0, 4.3, and 10.7%, and PL increased by 3.4, 9.5, and 22.7%, while FI decreased by 1.2, 4.7, and 10.0% for soils irrigated with waste, saline, and highly saline water, respectively, in comparison to that of the control (fresh water). This indicates that non-saline and saline sodic soils irrigated with low water quality could be optimally tilled when soil moisture was between 15.3 and 17.0%. On the other hand, wet tillage could be achieved when soil moisture ranged from 46.5–51.5% for non-saline and saline sodic soils irrigated with different low water qualities (Figure 2). As farmers cannot control the suitable soil moisture of tillage, we converted FI into elapsed days following previous irrigation (Figure 3). In this case, the suitable time of optimum tillage could be applied at 16, 16, 20, and 24 days after previous irrigation for soils irrigated with fresh, waste, saline, and highly saline water, respectively (Figure 3).

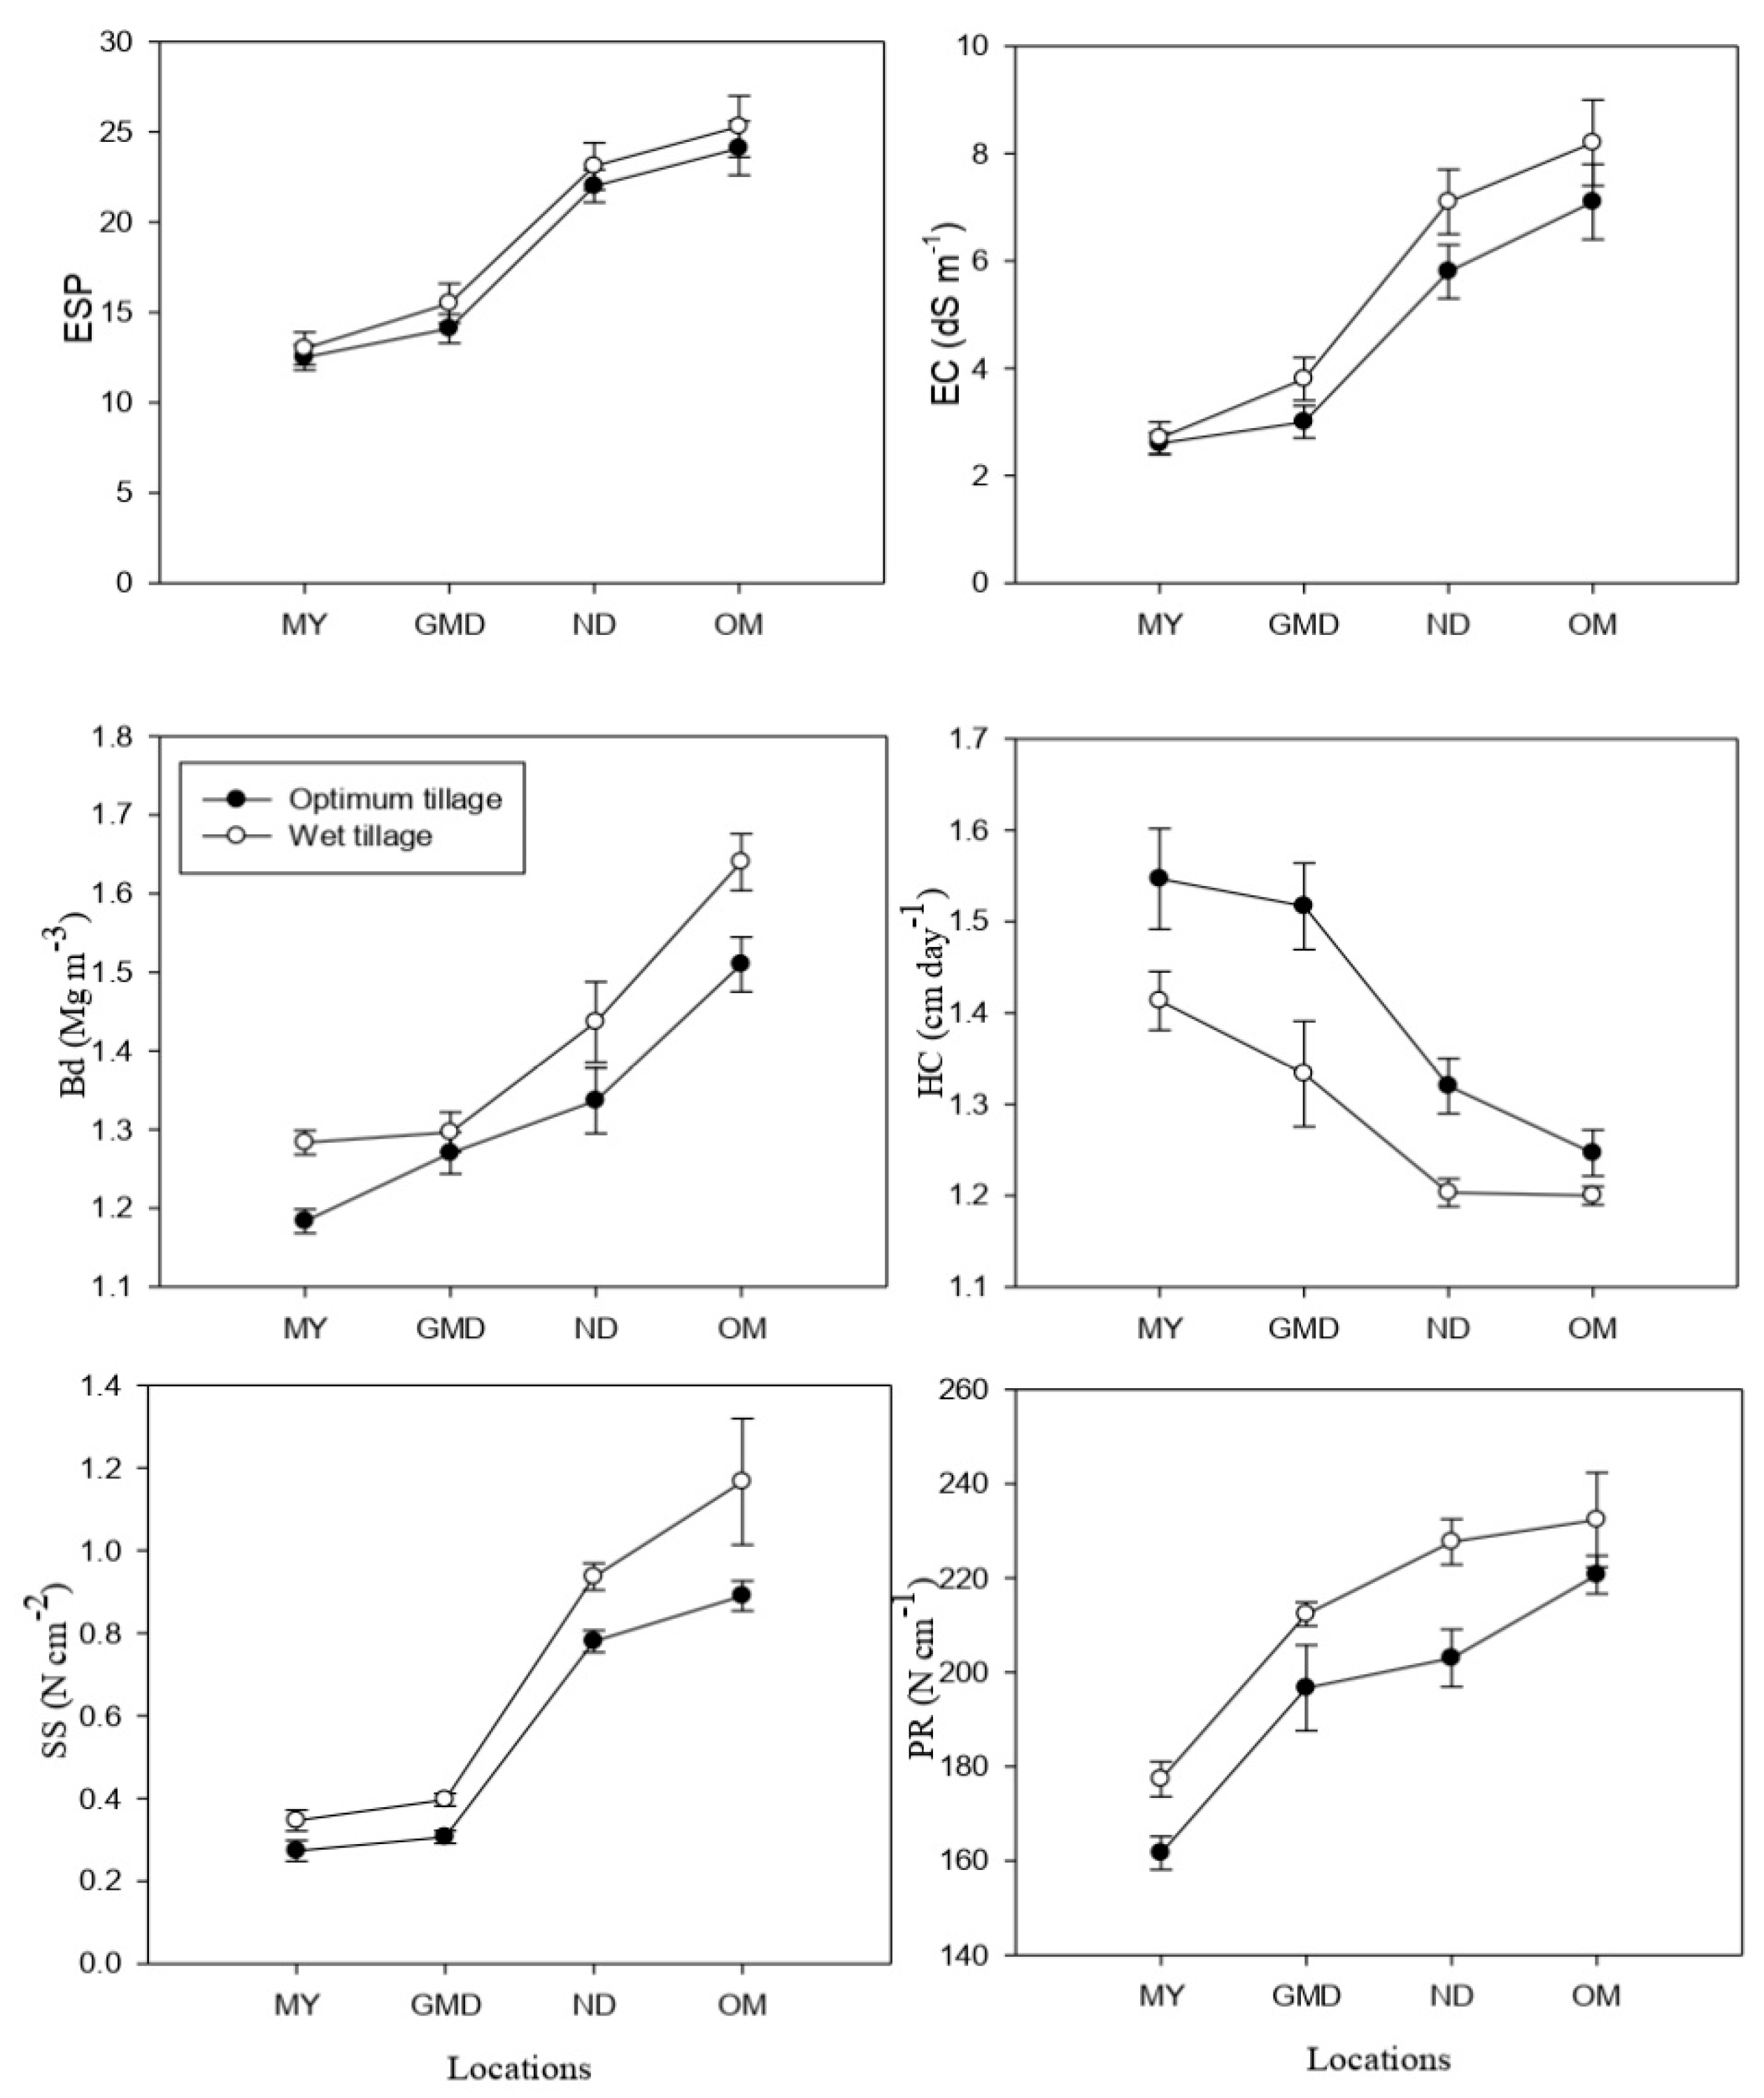
3.2. Effect of Wet and Optimal Tillage on Soil Chemical and Physical Characteristics Irrigated with Different Water Qualities

Tillage process and irrigation with low water quality resulted in a significant (p ≤ 0.05) influence on soil chemical and physical characteristics (Figure 4), representing the importance of tillage at the optimal moisture for improving such characteristics compared to that of the wet tillage process. Application of irrigation with high salinity and sodicity resulted in an increase in soil electrical conductivity (EC), exchangeable sodium percentage (ESP), bulk density (Bd), shear strength (SS), and penetration resistance (PR), but with a decrease in soil hydraulic conductivity (HC). However, application of fresh water resulted in the highest positive impact on soil properties, followed by the irrigation with waste water.
Tillage application at the optimal moisture resulted in a significant (p ≤ 0.05) improvement in soil physical and chemical characteristics with all irrigation sources in comparison to that of wet tillage application (Figure 4). In soil treated with optimal tillage, soil salinity (EC) was reduced by 4.1, 17.1, 13.0, and 10.0% when fresh, waste, saline, and high salinity water was applied in comparison to that of the initial soil salinity prior to wheat sowing, respectively (Figure 4). Similarly, soil ESP decreased by 1.6, 2.0, 2.2, and 2.8% when fresh, waste, saline, and high salinity water was applied in comparison to the initial soil salinity prior to wheat sowing, respectively.

3.3. Growth and Yield Characteristics of Wheat Irrigated with Different Water Qualities

Tillage at optimal soil moisture content resulted in a significant (p ≤ 0.01) increase in grain yield ha−1, biological yield ha−1, number of days from sowing to heading and maturity, root weight at tillering, heading, and maturity stages by 21.0, 21.2, 3.9, 5.7, 15.3, 25.0, and 29.6% in comparison to that of wet tillage, respectively (Table 2). Moreover, irrigation water applied and water productivity were higher by 4.5 and 15% with optimal tillage than that of wet tillage, respectively.
The highest grain yield and root weights at different growth stages were obtained when wheat plants were irrigated with fresh water followed by waste water in comparison to plants irrigated with saline or highly saline water (Table 2). However, the highest applied irrigation water and the lowest water productivity were obtained when saline and high saline water were applied (Table 2). The interaction effects between tillage and water resources factors were not significant (p ≥ 0.05), except with root weight at maturity.

4. Discussion

Determining the optimum moisture content for tillage is very important for obtaining good tilth with low energy requirements, particularly in the regions that suffer from limited water resources. Atterberg limits are very important for soil physics studies, as can specify the suitable moisture content for tillage process. Moreover, LL and PL could be correlated with other soil engineering characteristics such as soil compressibility, shrinking, and swelling as well as permeability. Also, salinity and sodicity of soil and/or low quality of irrigation water can have a negative impacts on Atterberg limits and related characteristics. High salinity in soil can cause a reduction in Atterberg limits due to the reduction in the double layer thickness, zeta potential, and water content [28]. In addition, the repulsive forces in soil microstructure are reduced in response to the reduction of distance among particles as a result of salinity action [29]. This can cause prevailing Van der Waals attractive force, increasing capillary stress between particle boundaries and creating aggregation [30]. In contrast, Na+ ion, in the form of either SAR in irrigation water or ESP in soil, can lead to an increase in ALS due to the dispersion action of Na+, consequently increasing the double layer thickness. Therefore, LL and PL increased with increasing soil ESP (Table 1) and water SAR. Moisture content of ALS was converted into days elapsed after irrigation to facilitate the control of farmers by exposing soil for the intensive irrigation and determining soil moisture daily. Then, curves expressing the relationship between time (days) and moisture content were drawn (Figure 3). Thus, moisture content in LL and PL were converted into time elapsed following irrigation. Our data showed that the longest period where optimal tillage in soil can be applied was 20 and 24 days after irrigation with saline and highly saline water, respectively, compared with soils irrigated with fresh or waste water. At such time, soils are likely to show an optimal friability when tilled at 17.0, 16.8, 16.2, and 15.3% of moisture content for soil irrigated with fresh, waste, saline, and high saline water, respectively.
The highest EC, ESP, Bd, SS, and PR, and the lowest HC in soils irrigated with waste water and saline water may be due to irrigation with low water quality for decades, leading to a high level of salinity [31,32]. Tillage at optimal moisture content improved soil characteristics in the current investigation. This can be due to the improvement of soil structure with optimal friability and good tilth, consequently enhancing the efficiency of leaching and drainage [33]. On the contrary, wet tillage deteriorated soil properties, as the soil was susceptible to compaction with high moisture content [34], causing waterlogging and negative efficiency through either leaching or drainage.
Irrigation with low water quality resulted in a reduction in grain yield, phenology characteristics, and water productivity (Table 2). This could be due to the osmotic potential of salinity in the soil solution, which can be associated with an equivalent reduction in both nutrient absorbance and transpiration [35,36]. In addition, salinity and sodicity induced by irrigation water caused deterioration in soil physical characteristics via increasing the bulk density, compaction, and shear strength, and decreasing hydraulic conductivity (Figure 4), restricting root weight density (Table 2). Increased application of irrigation water in soils irrigated with saline- and highly saline water compared to those irrigated with fresh water could be mainly attributed to the additional water requirements due to leaching in saline soils. Consequently, water productivity in saline soils was less than that of non-saline soils due to the increment of irrigation water applied and the reduction in wheat yield. Tillage at optimal moisture content improved soil physical and chemical characteristics, representing likely improvements in wheat yield and water productivity under different water resources. Although irrigation water applied in optimal tillage was higher than that in wet tillage, water productivity was higher in optimal tillage due to the subsequent increase in the grain yield (Table 2).
The four different locations were varied in the productivity of wheat in terms of grain and biological yield (Table 2). The highest grain yield ha−1 was obtained from Meet Yazeed and Gharbia Main Drain, while the lowest grain yield ha−1 was obtained from Nashart Drain and Omoum Drain. The highest reduction in grain yield that was obtained from Nashart Drain and Omoum Drain could be due to the highest EC and ESP of soil and water. In addition, it can be due to the lowest N and P availability of water and soil in these locations compared with the other two locations (Table 1). High salinity level in soil can interfere with biological uptake of the essential nutrients and water uptake, consequently it can disturb the physiological functions needed for plant growth and productivity [1].

5. Conclusion

The optimal moisture for suitable and optimal tillage was found to be between 15–17% for the soils that were irrigated with fresh, waste, saline, and highly saline water. Application of tillage at these soil moisture levels improved physical and chemical soil characteristics, wheat grain yield and water productivity. Meanwhile, tillage in wet moisture content increased soil compaction and deteriorated soil properties causing degradation and crop failure. Irrigation of wheat with waste water resulted in higher grain yield than that obtained from plants irrigated with saline or high saline water. However, further research is required to check the concentration of micro-elements in grain wheat as a result of irrigation with waste water.

Author Contributions

M.F.S., A.M.S.K., E.-S.H.O.: Conceptualization, methodology, collecting data, formal analysis, statistical analysis, writing first draft preparation, review and editing; S.A.-D., A.G.A., H.M.A., K.A.A., W.H.A.E.H.: writing and review and editing; statistical analysis, water analysis and characteristics.

Funding

The authors extend their sincere appreciation to the Deanship of Scientific Research at King Saud University for supporting the work through College of Food and Agriculture Sciences Research Center.

Acknowledgments

Soils, Water, and Environment Research Institute (SWERI) Agricultural Research Centre (ARC) is acknowledged for the technical support of the study.

Conflicts of Interest

The authors declare no conflict of interest.

References

  1. Butcher, K.; Wick, A.F.; Desutter, T.; Chatterjee, A.; Harmon, J. Soil salinity: A threat to global food security. Agron. J. 2016, 108, 2189–2200. [Google Scholar] [CrossRef]
  2. Seleiman, M.F.; Kheir, A.M.S. Maize productivity, heavy metals uptake and their availability in contaminated clay and sandy alkaline soils as affected by inorganic and organic amendments. Chemosphere 2018, 204, 514–522. [Google Scholar] [CrossRef] [PubMed]
  3. Mohamed, N.N. Management of salt-affected soils in the Nile Delta. Nile Delta 2016, 55, 265–295. [Google Scholar] [CrossRef]
  4. Seleiman, M.F.; Kheir, A.M.S. Saline soil properties, quality and productivity of wheat grown with bagasse ash and thiourea in different climatic zones. Chemosphere 2018, 193, 538–546. [Google Scholar] [CrossRef] [PubMed]
  5. Coucheney, E.; Eckersten, H.; Hoffmann, H.; Jansson, P.E.; Gaiser, T.; Ewert, F.; Lewan, E. Key functional soil types explain data aggregation effects on simulated yield, soil carbon, drainage and nitrogen leaching at a regional scale. Geoderma 2018, 318, 167–181. [Google Scholar] [CrossRef]
  6. Dextera, A.R.; Bird, N.R.A. Methods for predicting the optimum and the range of soil water contents for tillage based on the water retention curve. Soil Tillage Res. 2001, 57, 302–312. [Google Scholar] [CrossRef]
  7. Atterberg, A. Über die physikalische Bodenuntersuchung und über die Plastizität der Tone [On the investigation of the physical properties of soils and on the plasticity of clays]. Internationale Mitteilungen für Bodenkunde 1911, 1, 10–43. [Google Scholar]
  8. Ajalloeian, R.; Mansouri, H.; Sadeghpour, A.H. Effect of saline water on geotechnical properties of fine-grained soil. Electron. J. Geotechn. Eng. 2013, 18, 1419–1435. [Google Scholar]
  9. Singh, A. Assessment of different strategies for managing the water resources problems of irrigated agriculture. Agric. Water Manag. 2018, 208, 187–192. [Google Scholar] [CrossRef]
  10. FAOSTAT. Wheat Sector Review-Egypt. Report 21; FAOSTAT: Rome, Italy, 2015. [Google Scholar]
  11. FAOSTAT. FAOSTAT Wheat Production Statistics. 2016. Available online: www.fao.org/faostat/en/#data/TP (accessed on 1 April 2019).
  12. Asseng, S.; Kheir, A.M.S.; Kassie, B.T.; Hoogenboom, G.; Abdelaal, A.I.N.; Haman, D.Z.; Ruane, A.C. Can Egypt become self-sufficient in wheat? Environ. Res. Lett. 2018, 13, 094012. [Google Scholar] [CrossRef]
  13. Meier, U. BBCH-Monograph: Growth Stages of Mono-and Dicotyledonous Plants, 2nd ed.; Federal Biological Research Centre for Agriculture and Forestry: Berlin, Germany, 2001. [Google Scholar]
  14. Ayers, R.S.; Westcot, D.W. Water Quality for Agriculture; FAO Irrigation and Drainage Paper 29; Food and Agriculture Organization of the United Nations: Rome, Italy, 1985; p. 174. [Google Scholar]
  15. Early, A.C. Irrigation Scheduling for Wheat in Punjab, Centasci Prog. Optimum Use of Water in Agriculture, Report 17, Layllpur, Pakistan, 1975; Volume 3–5, 115–127. [Google Scholar]
  16. Casagrande, A. Research on the Atterberg limits of soils. Public Roads 1932, 13, 121–130. [Google Scholar]
  17. Campbell, D.J. Liquid and plastic limits. In Soil and Environmental Analysis, Physical Methods; Smith, K.A., Mullins, C.E., Eds.; Dekker Inc.: New York, NY, USA, 2001; pp. 349–375. [Google Scholar]
  18. Cottenie, A.; Verloo, P.M.; Kiekens, L.; Velghe, G.; Camerlynck, R. Chemical Analysis of Plant and Soils; Lab Anal Agrochem, State Univ: Gent, Belgium, 1982. [Google Scholar]
  19. Burt, R. Soil Survey Laboratory Methods Manua; USDA—NRCS: Linoln, Nebraska, 2004. [Google Scholar]
  20. Nelson, D.W.; Sommers, L.E. Total carbon, organic carbon and organic matter. In Methods of Soil Analysis. Part 3. Chemical Methods; Spark, D.L., Page, A.L., Helmke, P.A., Loeppert, P.N., Soltanpour, P.N., Tabatabai, M.A., Johnson, C.T., Sumner, M.E., Eds.; ASA/SSSA: Madison, WI, USA, 1996; pp. 961–1010. [Google Scholar]
  21. Garcia, C. Soil Water Engineering Laboratory Manual; Department of Agricultural and Chemical Engineering, Colorado State University: Fort Collins, CO, USA, 1978. [Google Scholar]
  22. Klute, A. Methods of Soil Analysis. Part 1: Physical and Mineralogical Methods, 2nd ed.; ASA, SSSA, Inc, Publisher: Madison, WI, USA, 2002. [Google Scholar]
  23. Reynolds, W.D.; Elrick, D.E. Hydraulic Conductivity of Saturated Soils, Constant Head Method. In Methods of Soil Analyses, Part 4, Physical Methods; Book Series 5; Soil Science Society of America: Madison, WI, USA, 2002; pp. 694–700. [Google Scholar]
  24. Herrick, J.E.; Jones, T.L. A dynamic cone penetrometer for measuring soil penetration resistance. Soil Sci. Soc. Am. J. 2002, 66, 1320–1324. [Google Scholar] [CrossRef]
  25. ASTM. Sym.Van Shear Testing Soils; American Society for Testing Materials Spec Tech Publ: Philadelphia PA, USA, 1956; p. 193. [Google Scholar]
  26. Li, Q.Q.; Dong, B.D.; Qiao, Y.Z.; Liu, M.Y.; Zhang, J.W. Root growth, available soil water, and water-use efficiency of winter wheat under different irrigation regimes applied at different growth stages in North China. Agric. Water Manag. 2010, 97, 1676–1682. [Google Scholar] [CrossRef]
  27. Gregory, P.J. Root growth and activity. In Physiology and Determination of Crop Yield; Boote, K.J., Bennett, J.M., Sinclair, T.R., Paulsen, G.M., Eds.; American Society of Agronomy: Madison, WI, USA, 1994; pp. 65–93. [Google Scholar]
  28. Mahasneh, B.Z. Dead Sea water as a soil improvement agent. Electron. J. Geotech. Eng. 2004, 9. Available online: http://www.ejge.com/2004/Ppr0401/Ppr0401.htm (accessed on 1 April 2019).
  29. Mansour, Z.M.; Taha, M.R.; Chik, Z. Fresh-brine water effect on the basic engineering properties of lisan marl-Dead Sea- Jordan. J. Appl. Sci. 2008, 8, 3603–3611. [Google Scholar] [CrossRef]
  30. Gorakhki, M.R.H.; Bareither, C.A. Effects of Salinity on the Geotechnical Characterization of Fine-Grained Soils and Mine Tailings. Geotech. Test. J. 2016, 39, 1–14. [Google Scholar] [CrossRef]
  31. FAOSTAT. Water Quality for Agriculture. Irrigation and Drainage Paper 29; FAOSTAT: Rome, Italy, 1985. [Google Scholar]
  32. Hillel, D.; Braimoh, A.K.; Vlek, P.L.G. Soil degradation under irrigation. In Land Use and Soil Resources; Braimoh, A.K., Vlek, P.L.G., Eds.; Springer: Dordrecht, The Netherlands, 2008. [Google Scholar] [CrossRef]
  33. Maharjana, G.R.; Prescherb, A.; Nendel, C.; Ewerta, F.; Mboha, C.M.; Gaisera, T.; Seidel, S.J. Approaches to model the impact of tillage implements on soil physical and nutrient properties in different agro-ecosystem models. Soil Tillage Res. 2018, 180, 210–221. [Google Scholar] [CrossRef]
  34. Nayanaka, V.G.D.; Mapa, R.B. Use of atterberg limits for structure and tillage management of five great soil groups of Sri Lanka. In Proceedings of the Peradeniya Univ International Research Sessions, Balangoda, Sri Lanka, 4–5 July 2014; p. 430. [Google Scholar]
  35. Qiu, R.; Liu, C.; Wang, Z.; Yang, Z.; Jing, Y. Efects of irrigation water salinity on evapotranspiration modifed by leaching fractions in hot pepper plants. Sci. Rep. 2017, 7, 7231. [Google Scholar] [CrossRef]
  36. Tripler, E.; Shani, U.; Mualem, Y.; Ben-Gal, A. Long-term growth, water consumption and yield of date palm as a function of salinity. Agric. Water Manag. 2011, 99, 128–134. [Google Scholar] [CrossRef]
Figure 1. Map of the studied locations at North Nile Delta of Egypt. Four locations were irrigated from different water sources. MY= Meet Yazeed (fresh water); GMD = Gharbia Main Drain (waste water); ND = Nashart Drain (saline water); and OD = Omoum Drain (highly saline water).
Agronomy 09 00233 g001
Figure 2. Soil Atterberg limits (liquid limit LL, plastic limit PL, friability index PI) for the studied soils before wheat cultivation. Four locations were irrigated from different water sources. MY= Meet Yazeed (fresh water); GMD = Gharbia Main Drain (waste water); ND = Nashart Drain (saline water); and OD = Omoum Drain (highly saline water).
Agronomy 09 00233 g002
Figure 3. Liquid and plastic limits as days elapsed following irrigation for different locations. MY = Meet Yazeed (fresh water); GMD = Gharbia Main Drain (waste water); ND = Nashart Drain (saline water); and OD = Omoum Drain (highly saline water).
Agronomy 09 00233 g003
Figure 4. Chemical and physical characteristics of soil irrigated with different water qualities under optimal and wet tillage systems. EC = Electrical conductivity; ESP = exchangeable sodium percentage; Bd = bulk density; HC = hydraulic conductivity; SS = shear strength; PR = penetration resistance; MY= Meet Yazeed (fresh water); GMD = Gharbia Main Drain (waste water); ND = Nashart Drain (saline water); and OD = Omoum Drain (highly saline water).
Agronomy 09 00233 g004
Table 1. Physical and chemical analysis of soil in all studied locations prior to conducting the experiments. A = Particle size distribution (%); B = Physical soil properties; C = Chemical soil properties.
A
LocationSandSiltClayTexture
MY153253Clay
GMD173350Clay
ND9.03655Clay
OD7.03756Clay
B
LocationFC (%)WP (%)AW (%)Bd (mg m−3)HC (cm d−1)SS (N cm−2)PR (N cm−1)
MY4322211.121.550.26165
GMD4422221.251.560.29190
ND4020201.351.290.65205
OD3818201.551.250.78226
C
LocationAvailable N (mg kg−1)Available P (mg kg−1)Available K (mg kg−1)OM (%)EC (dS m−1)ESPpH
MY68.511.5255.51.52.512.77.8
GMD75.513.3268.41.63.614.48.1
ND55.710.2245.31.46.722.58.0
OD50.29.0233.81.17.924.88.2
EC = soil electrical conductivity; ESP = soil exchangeable percentage; Bd = soil bulk density; HC = saturated hydraulic conductivity; SS = shear strength; PR = soil penetration resistance; OM = soil organic matter; FC = soil field capacity; WP = permanent wilting point; AW = soil available water. MY = Meet Yazeed; GMD = Gharbia Main Drain; ND = Nashart Drain; OD = Omoum Drain.
Table 2. Effect of tillage and different irrigation water sources on wheat yields, phenology, irrigation water characteristics, and roots weight.
TreatmentsYield (kg ha−1)Days after Sowing TillApplied Irrigation Water (m3 ha−1)Water Productivity (kg m−3)Roots Weight (mg cm−3) at
GrainBiologicalHeadingMaturityTilleringHeadingMaturity
Tillage (T)
Optimal tillage6983.420950.299.8154.14139.21.700.881.431.22
Wet tillage5761.717285.296.0147.43960.41.470.761.150.94
S.E.M77.9233.80.510.4523.30.020.020.020.024
Water Sources (WS)
Fresh Water8121.024363.0103.5157.03789.22.141.021.631.30
Waste Water6975.320926.0100.5152.34008.51.730.831.431.17
Saline Water5920.617762.096.0148.14130.41.420.761.150.99
High SalineWater4473.313420.091.6145.64271.11.040.670.950.87
S.E.M110.2330.70.720.632.90.030.020.0380.03
ANOVA
T******************
WS******************
T × WSNSNSNSNSNSNSNSNS*
S.E.M. = Standard error of means; NS, p ≥ 0.05; * p ≤ 0.05; ** p ≤ 0.01. Meet Yazeed (fresh water); Gharbia Main Drain (waste water); Nashart Drain (saline water); and Omoum Drain (highly saline water).

