Production and Cultivated Area Variation in Cereal, Rice, Wheat and Maize in China (1998–2016)


Abstract
:1. Introduction
2. Materials and Methods
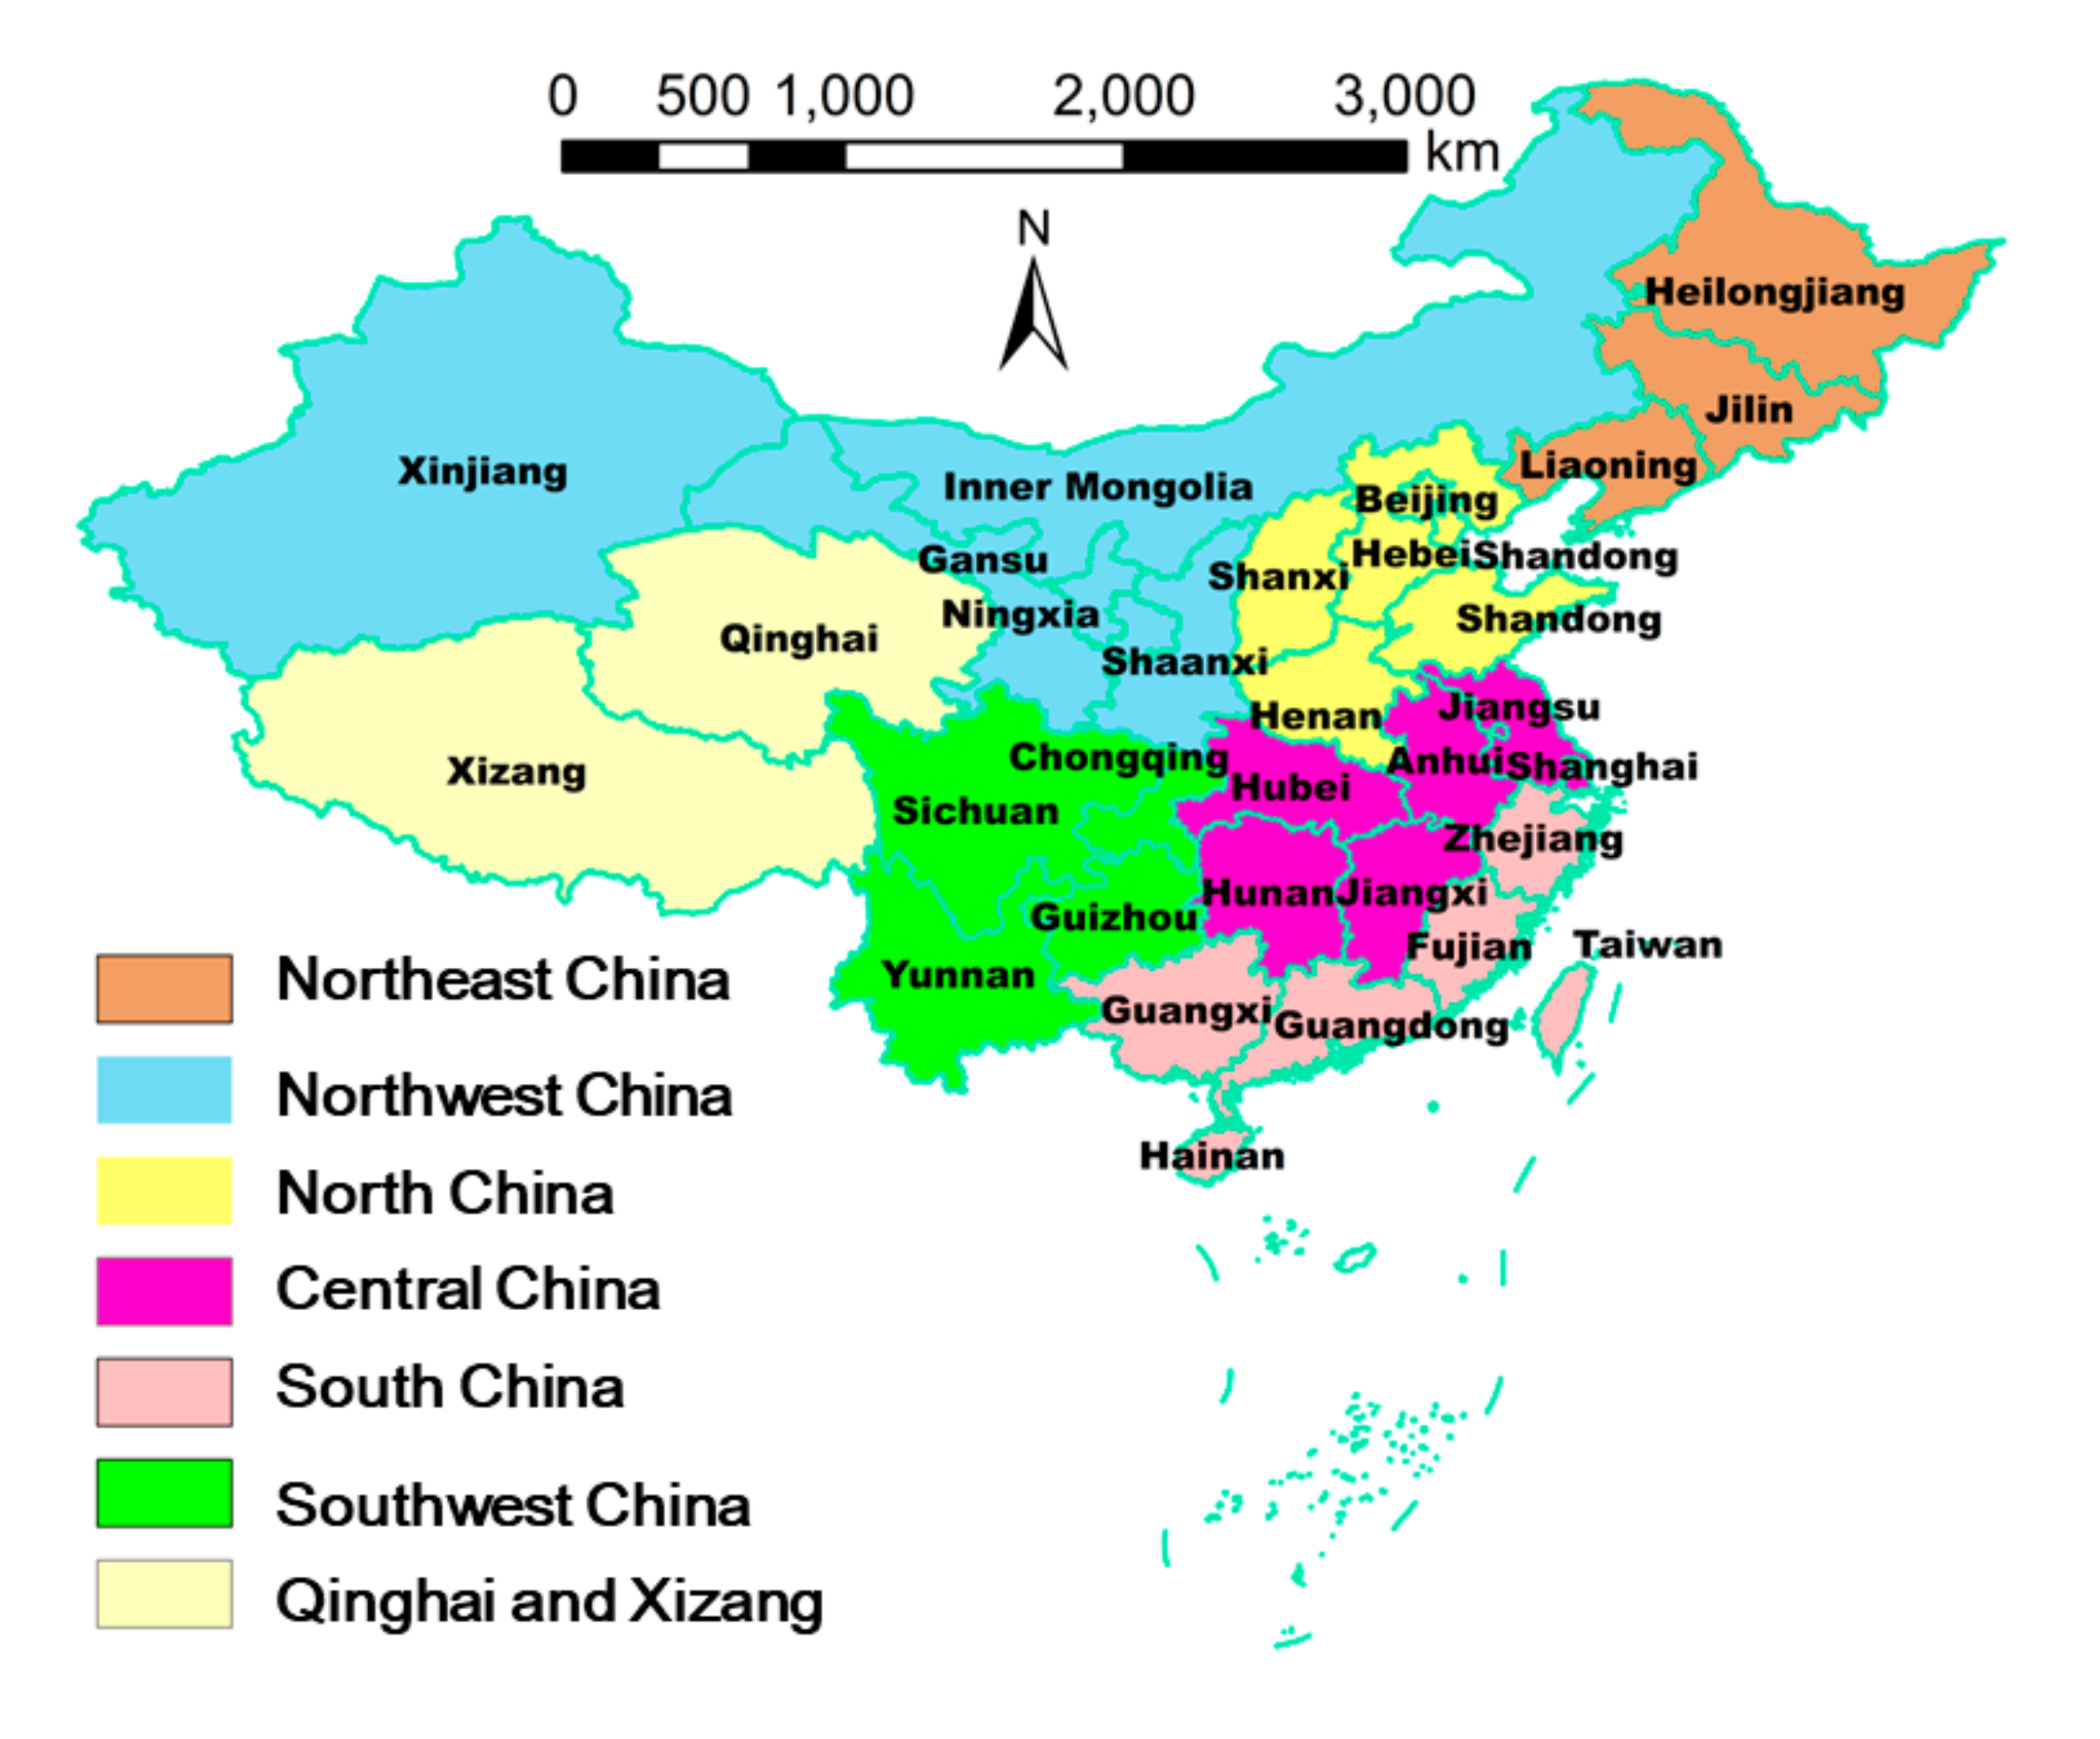
2.1. Study Region
2.2. Data Source and Collection
2.3. Data Analyses
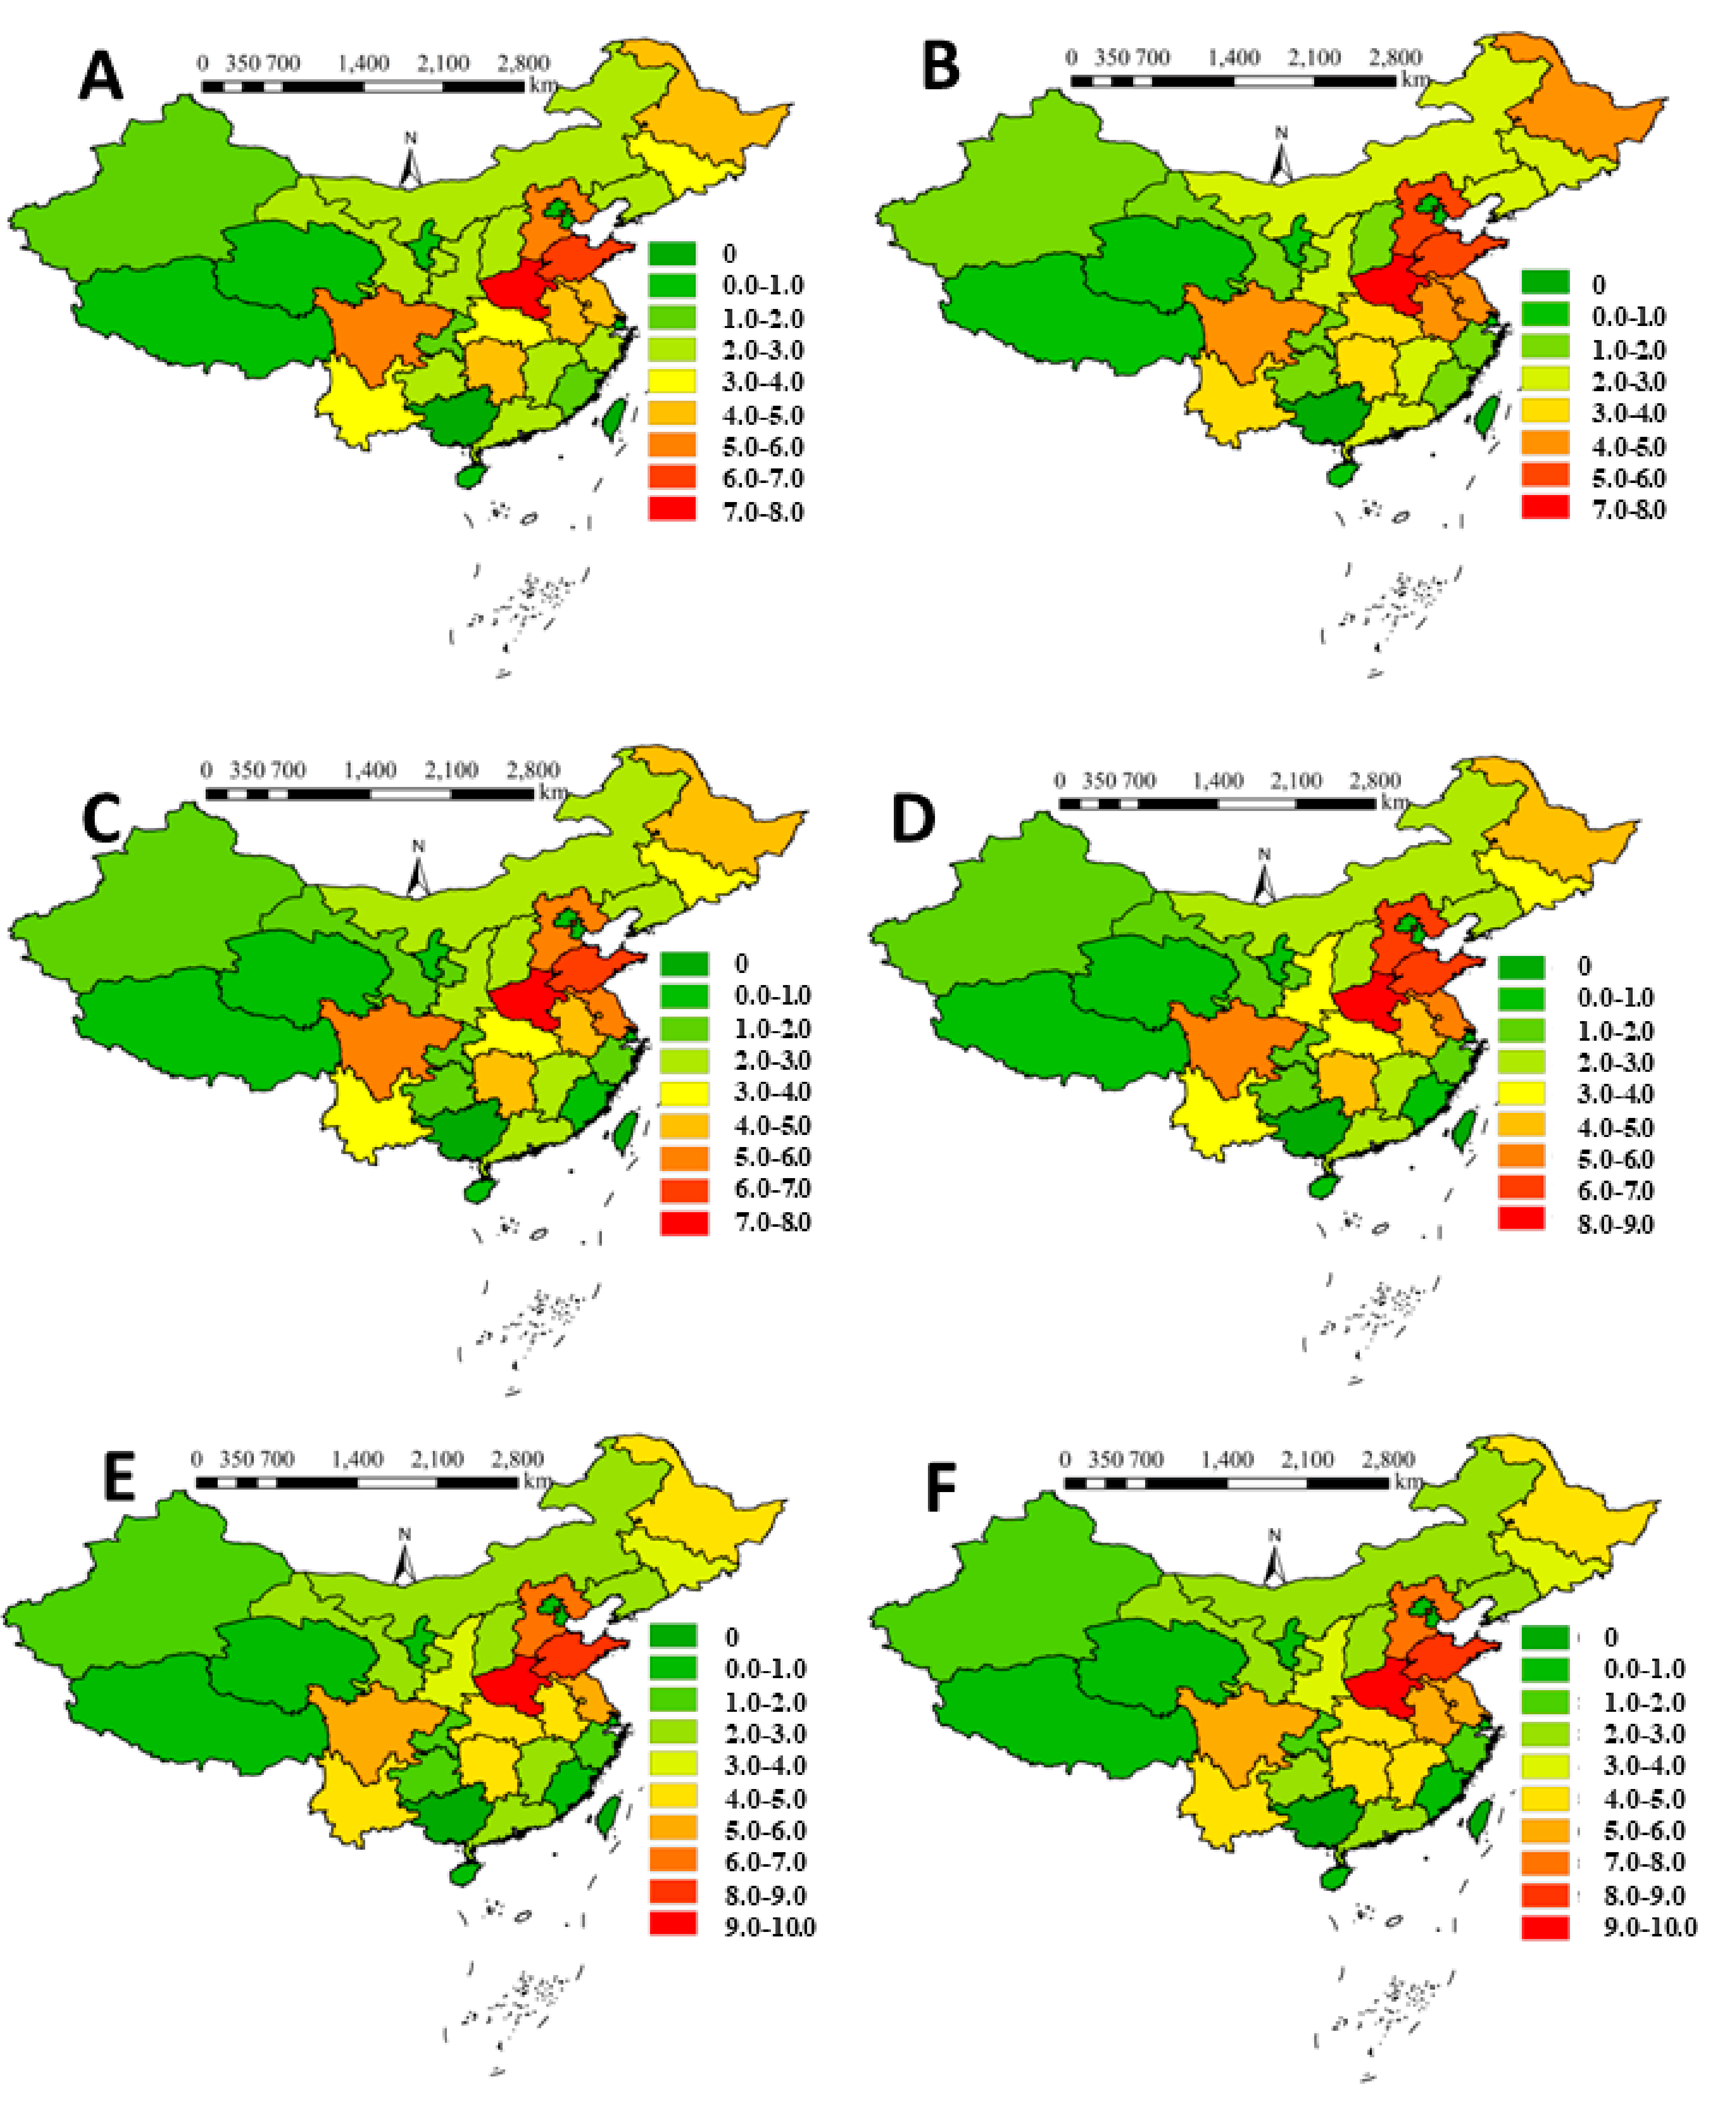
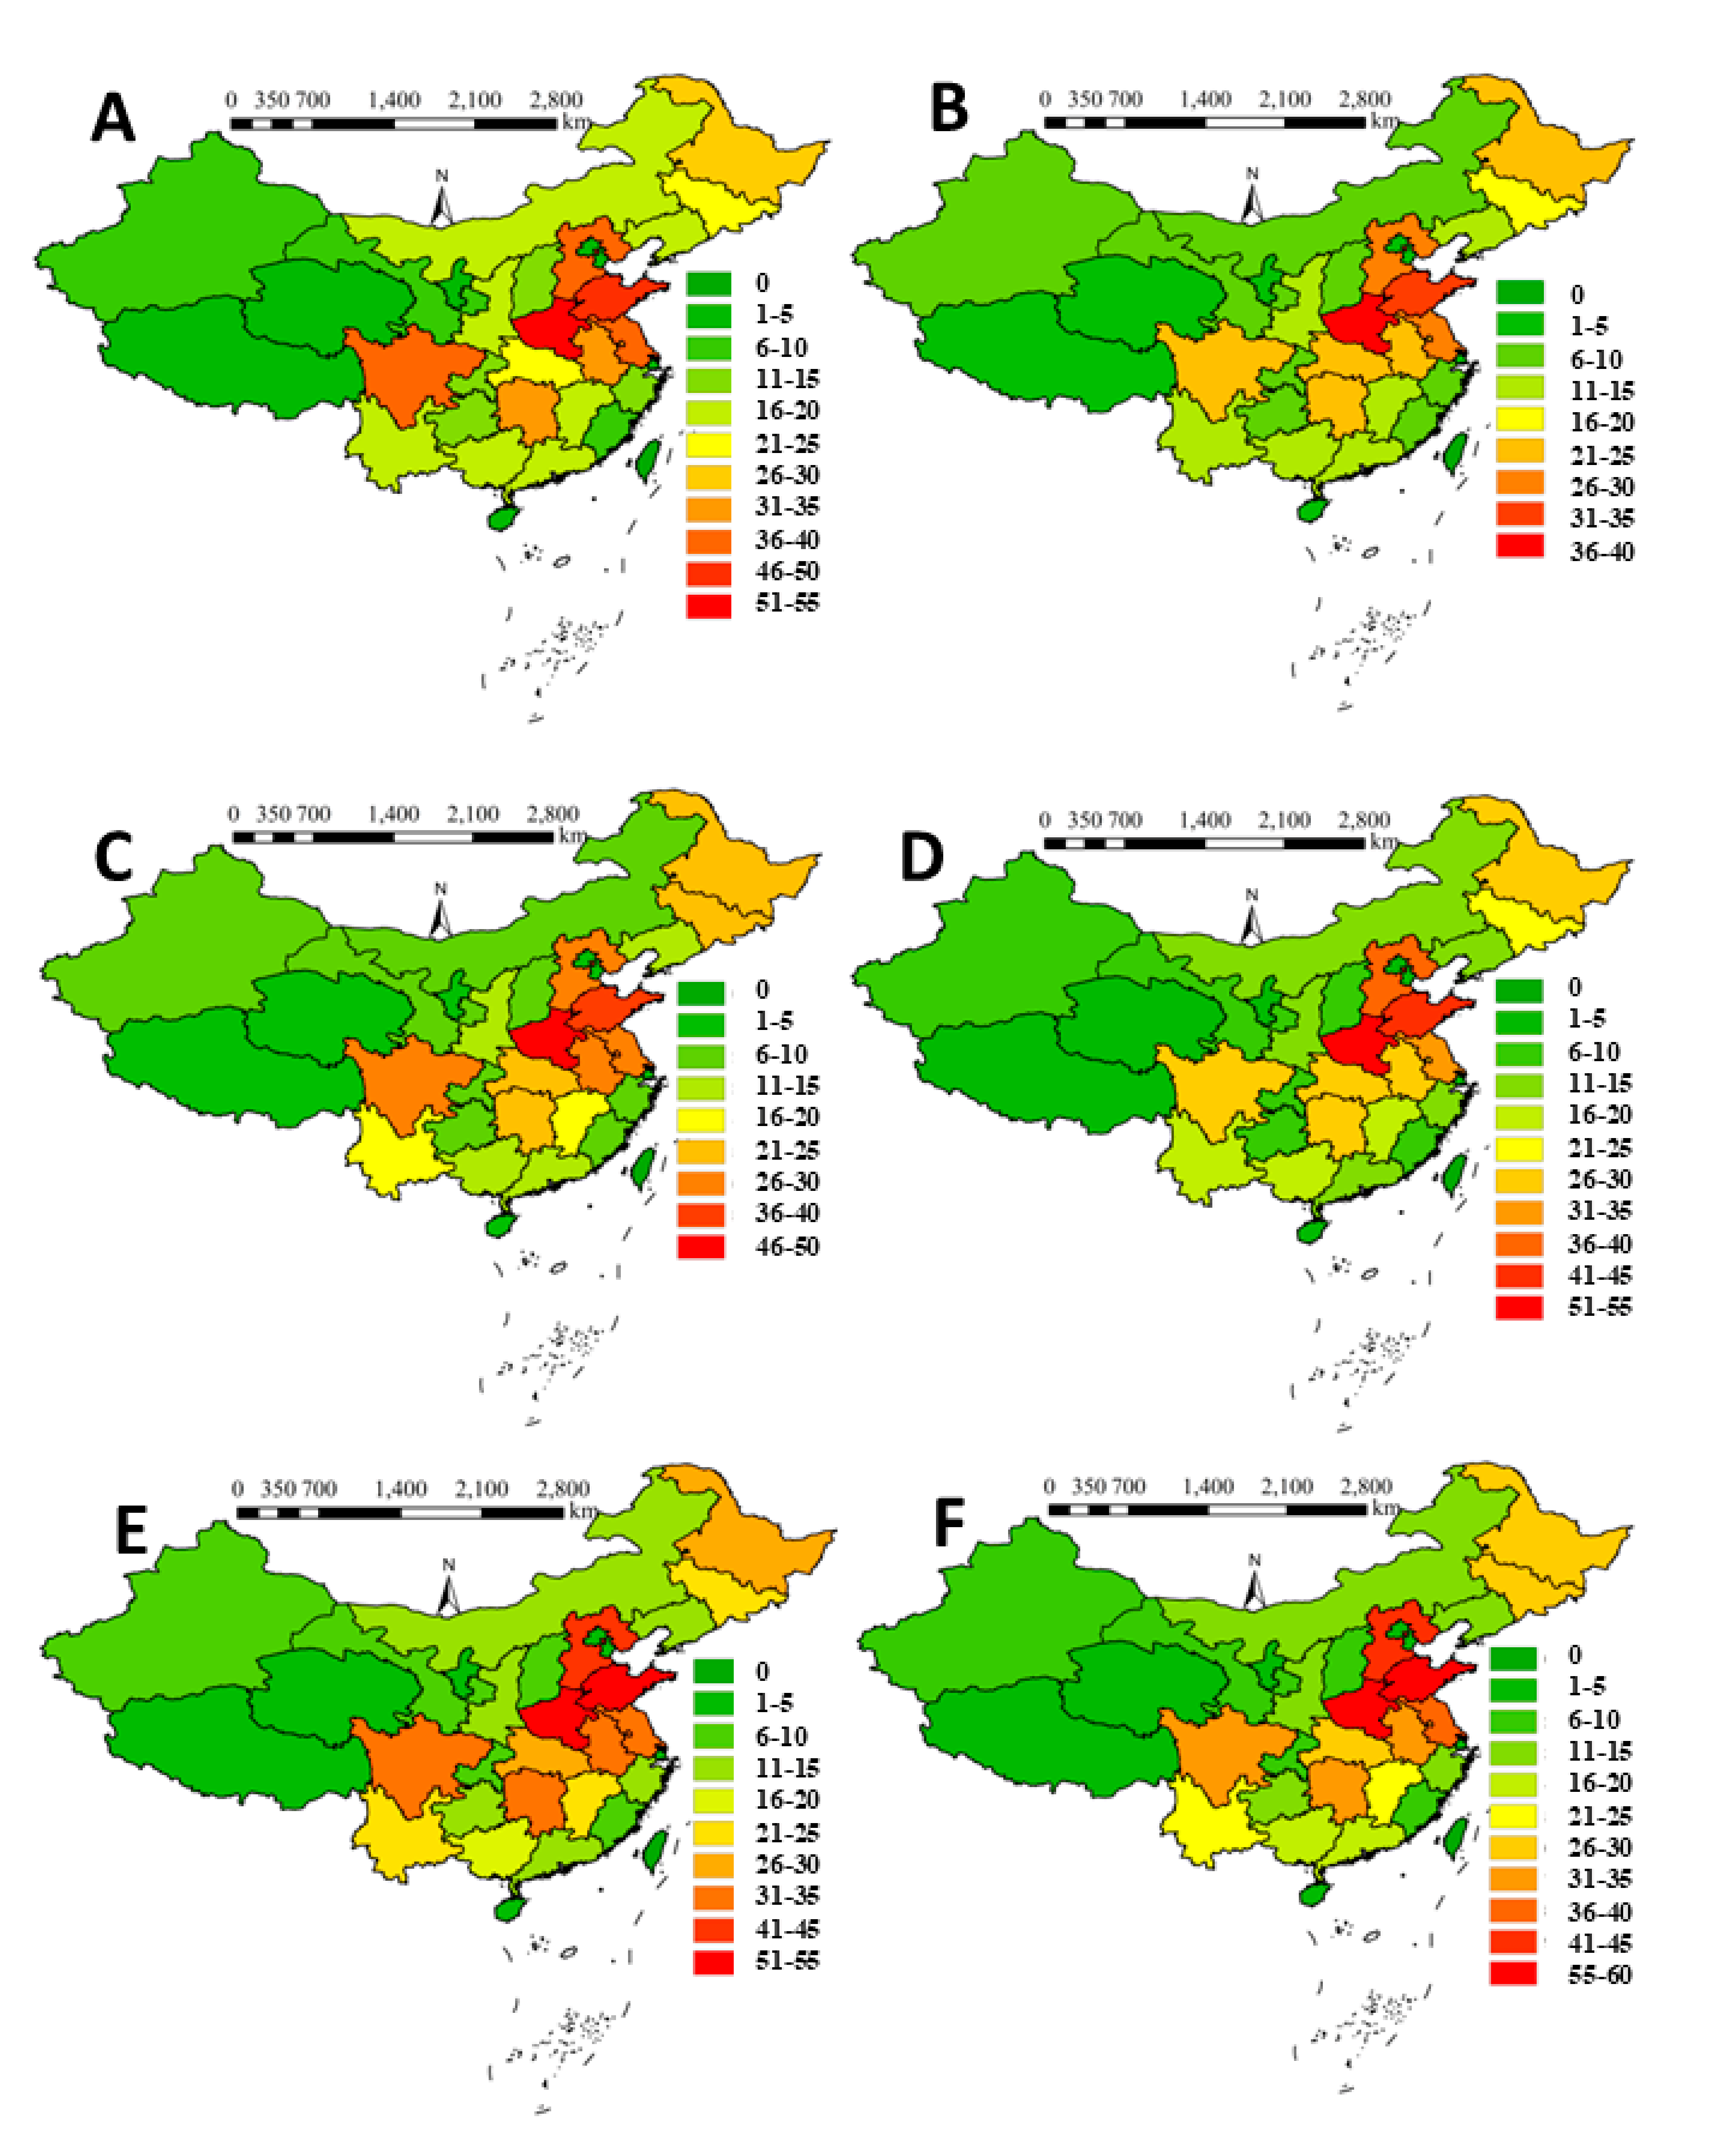
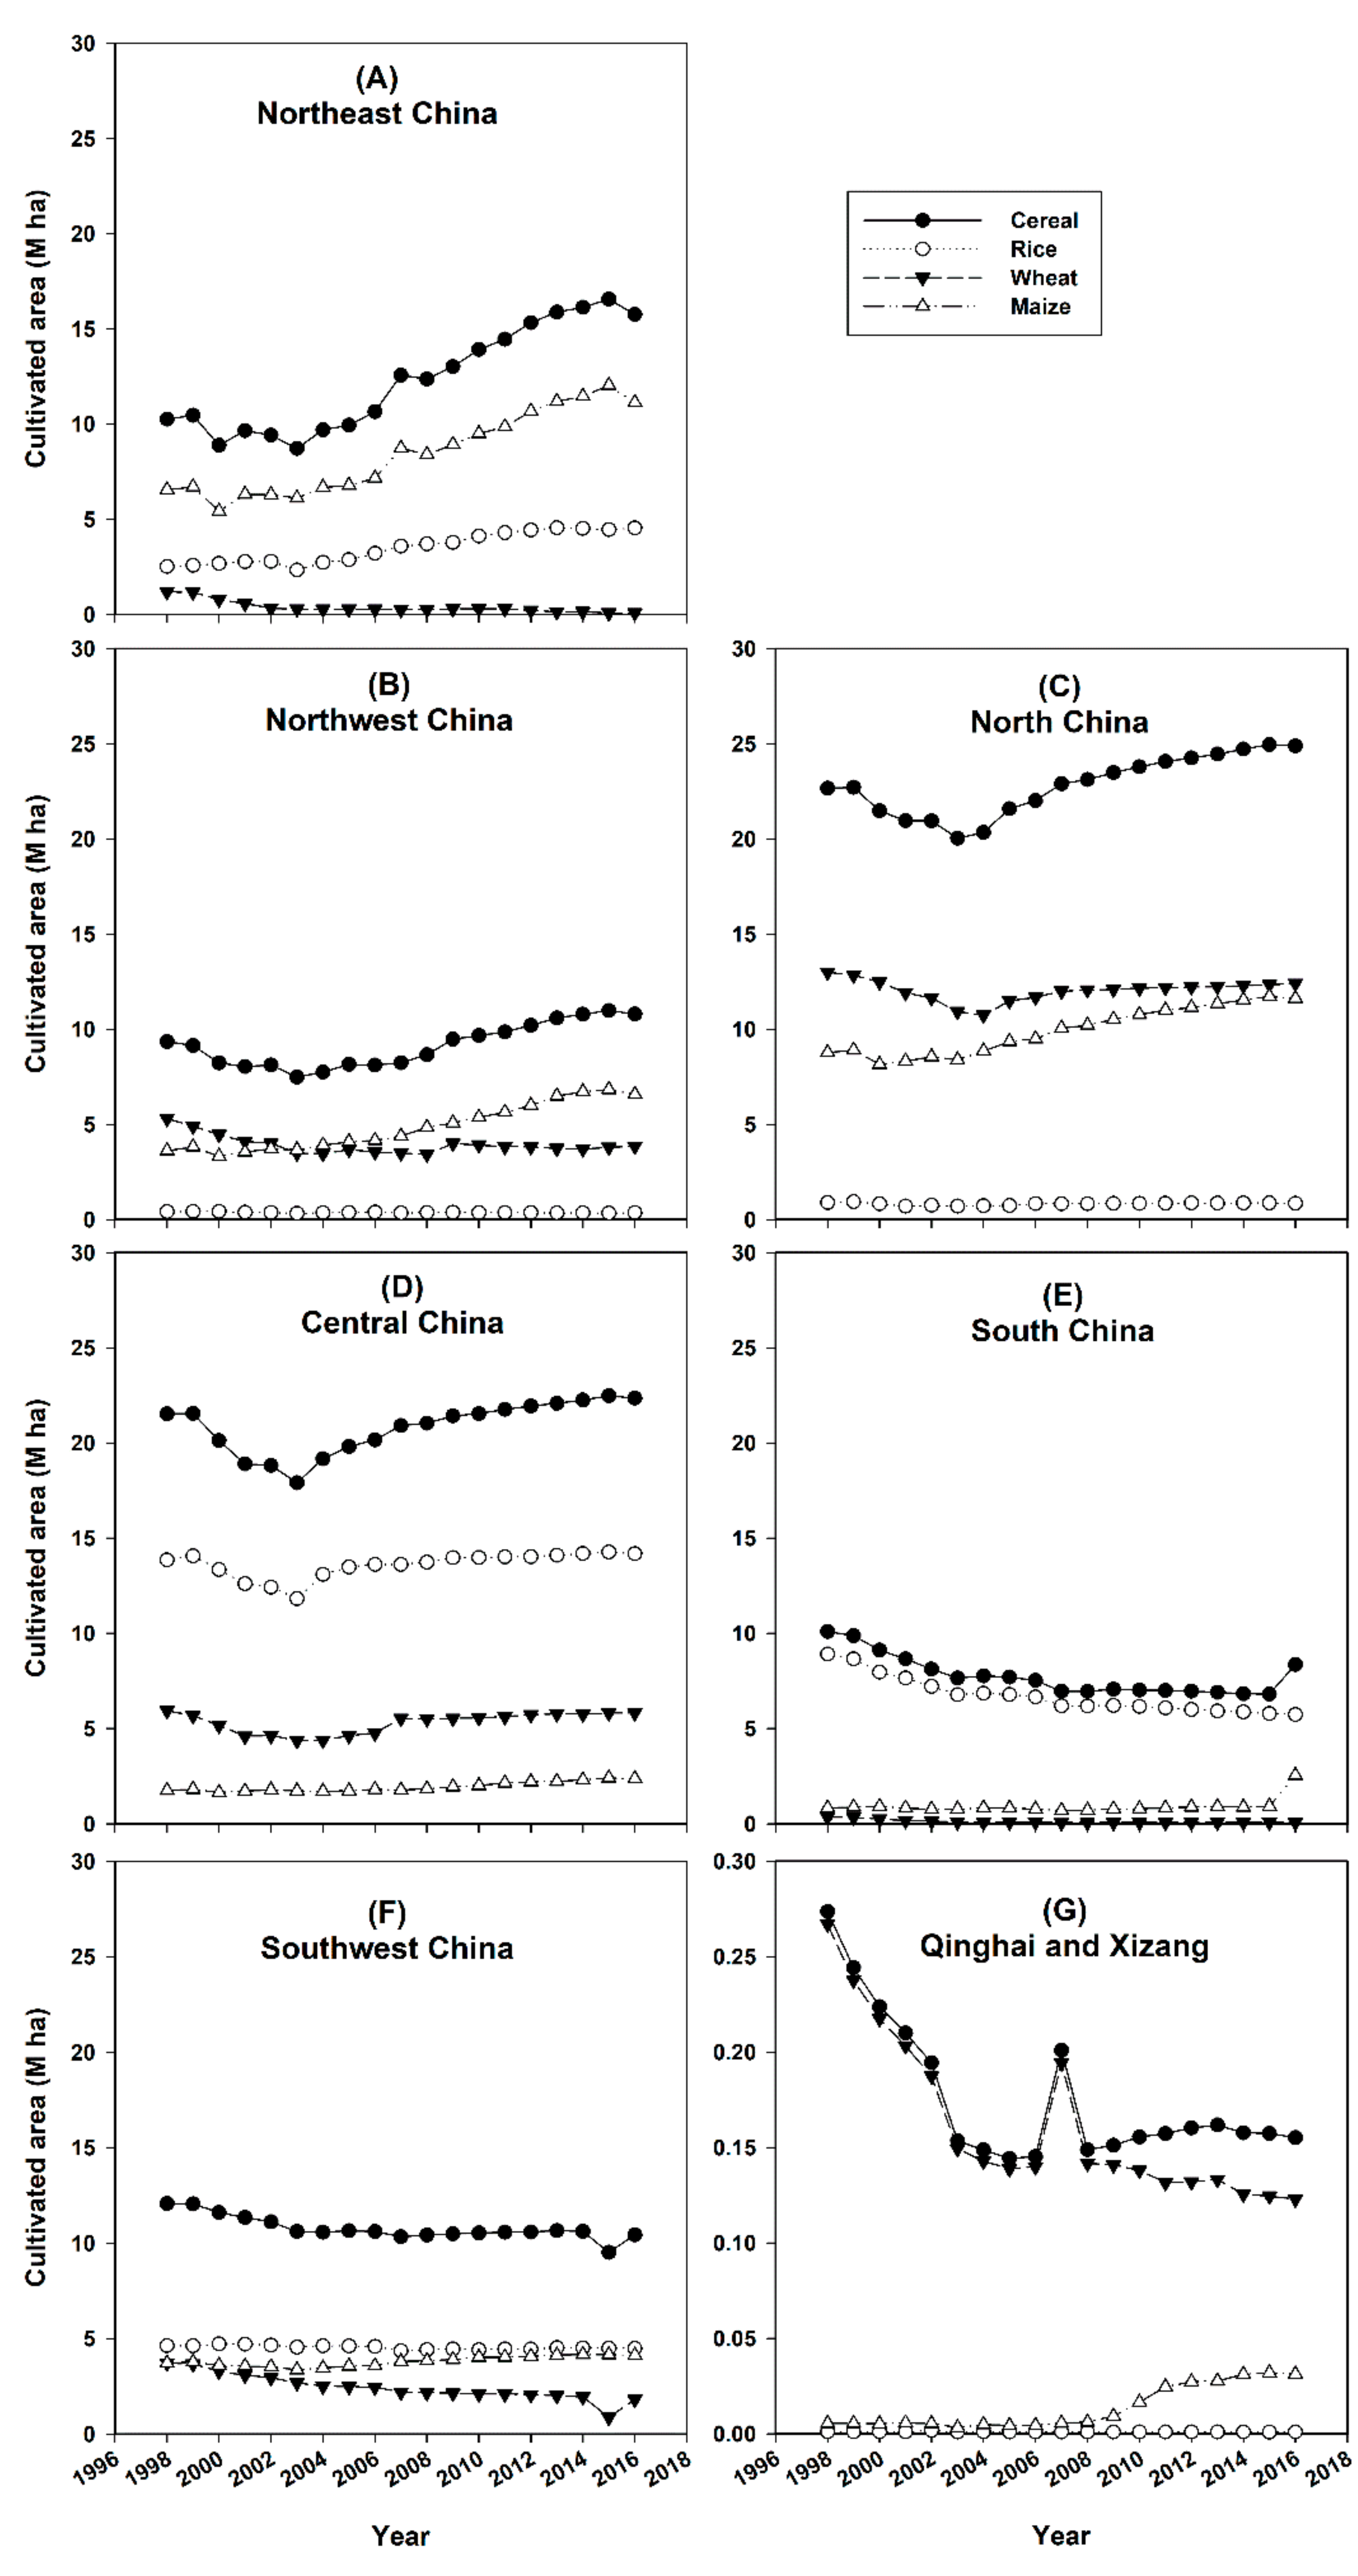
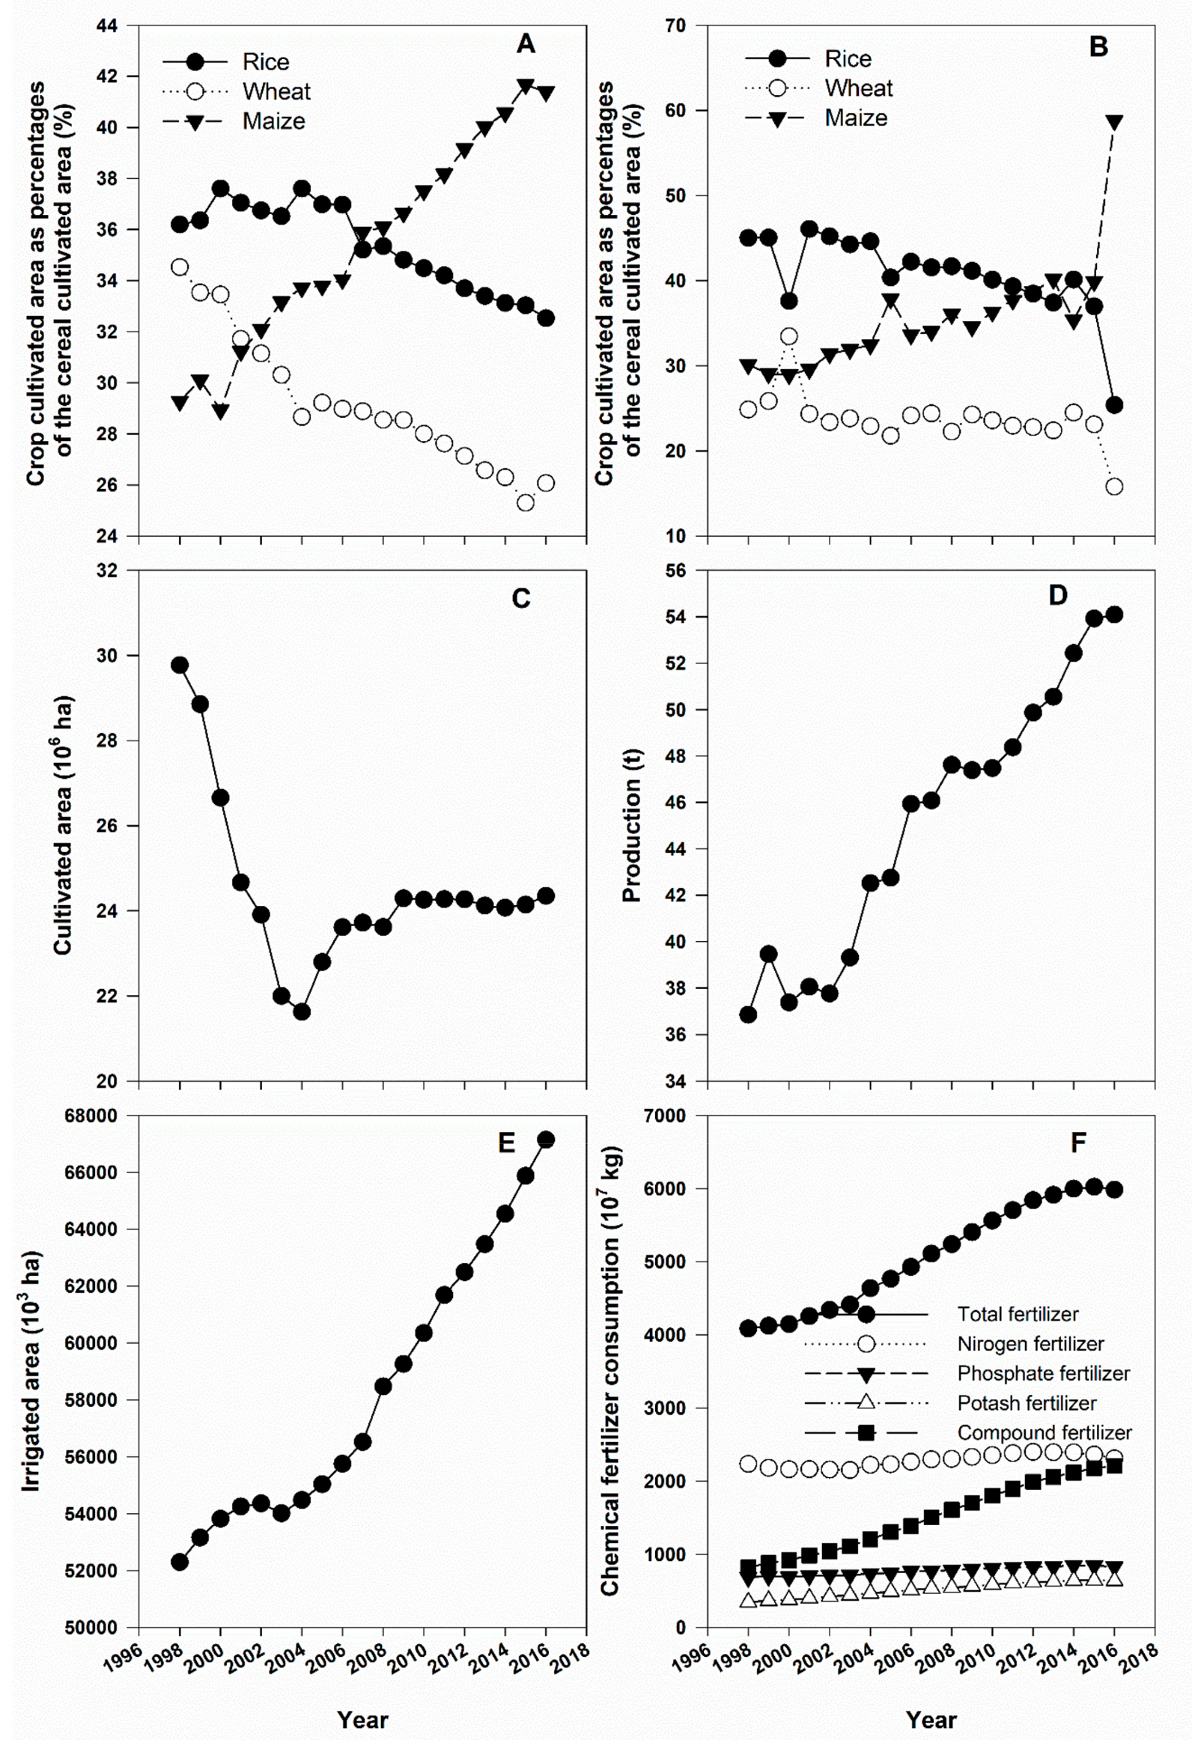
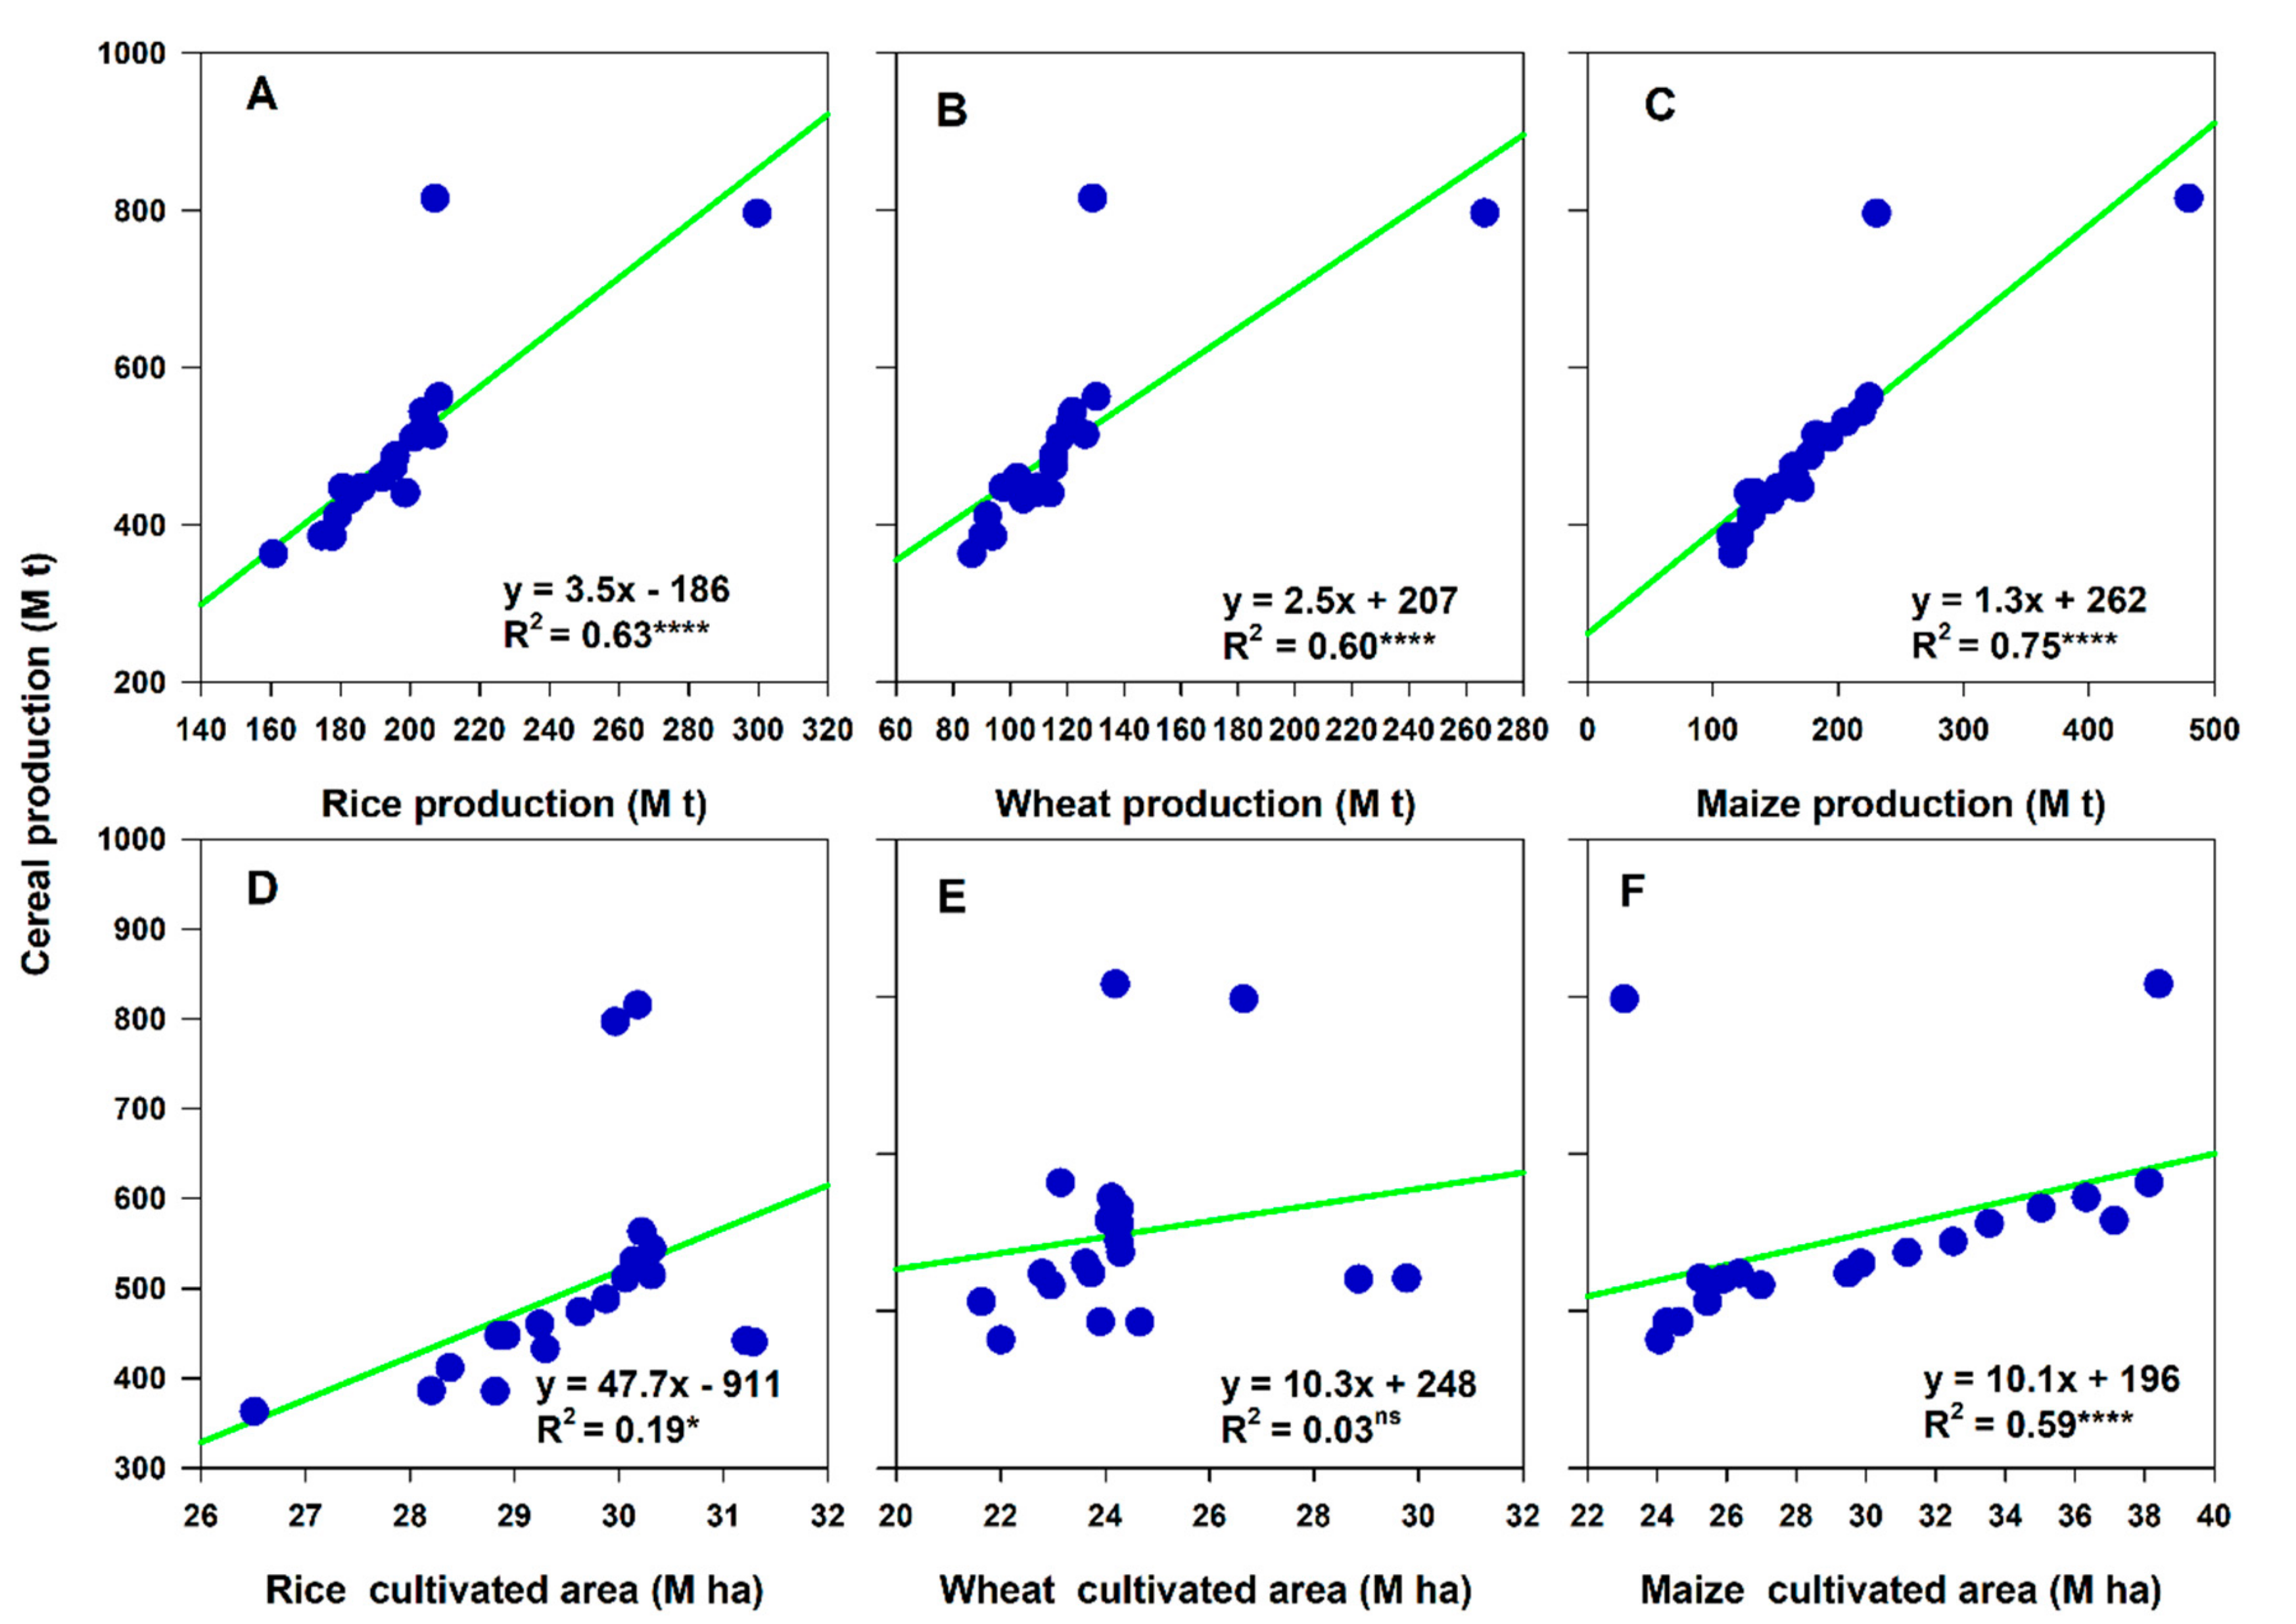
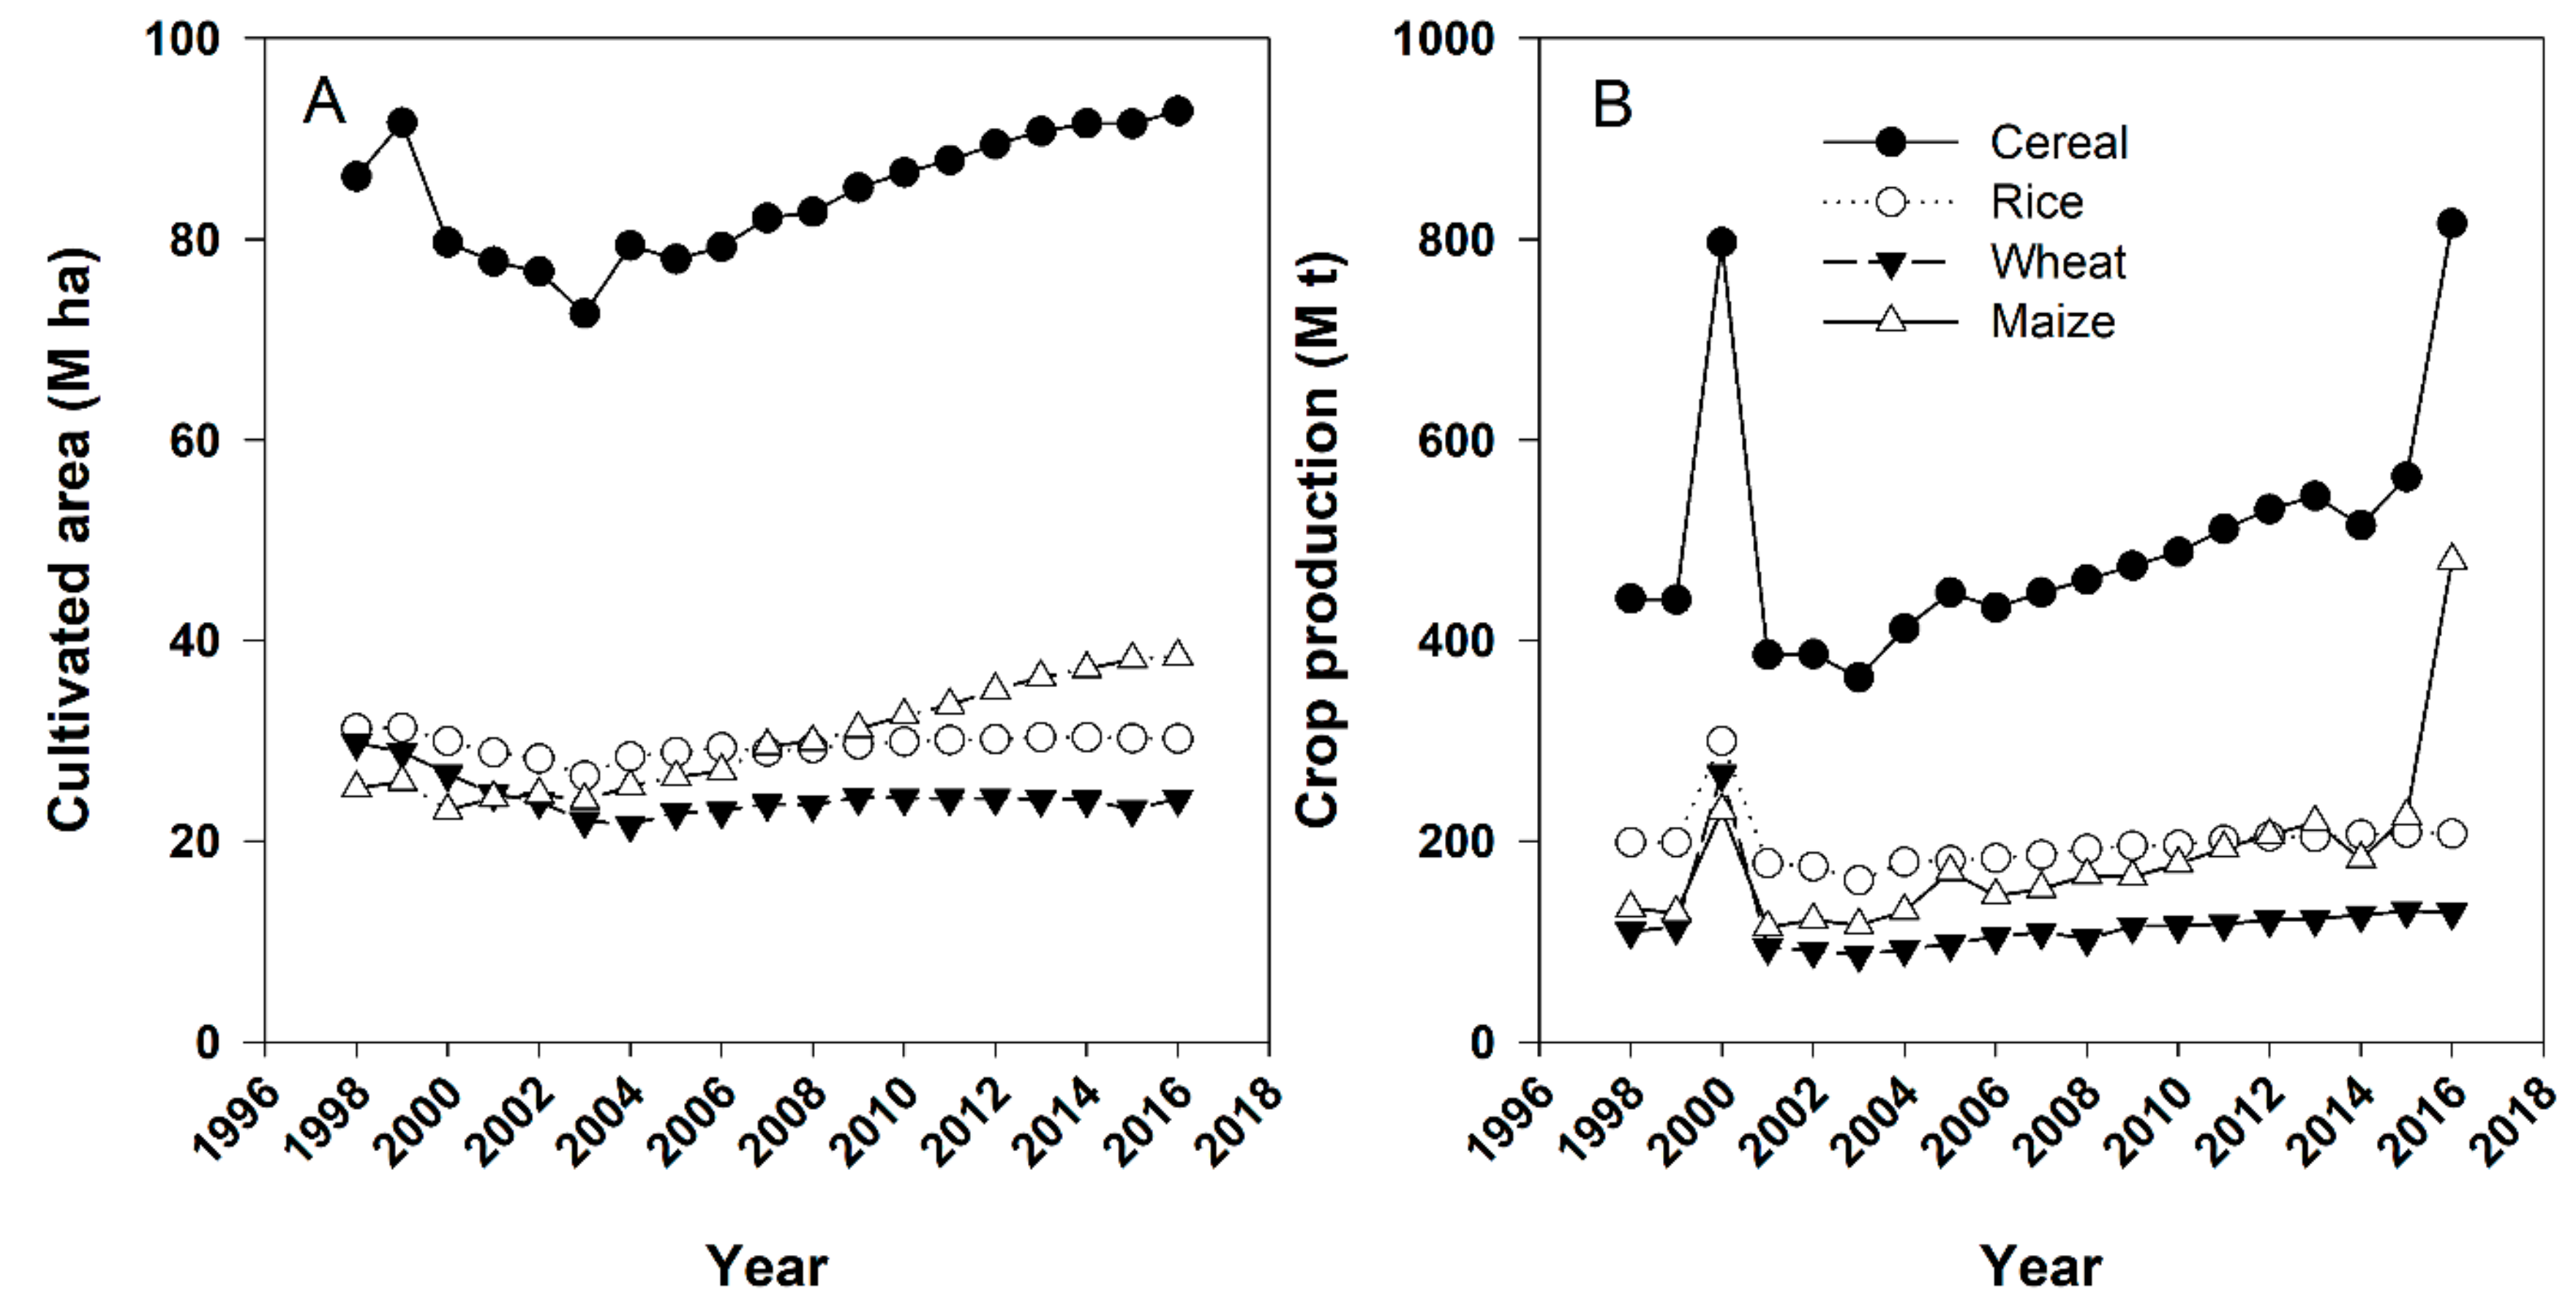
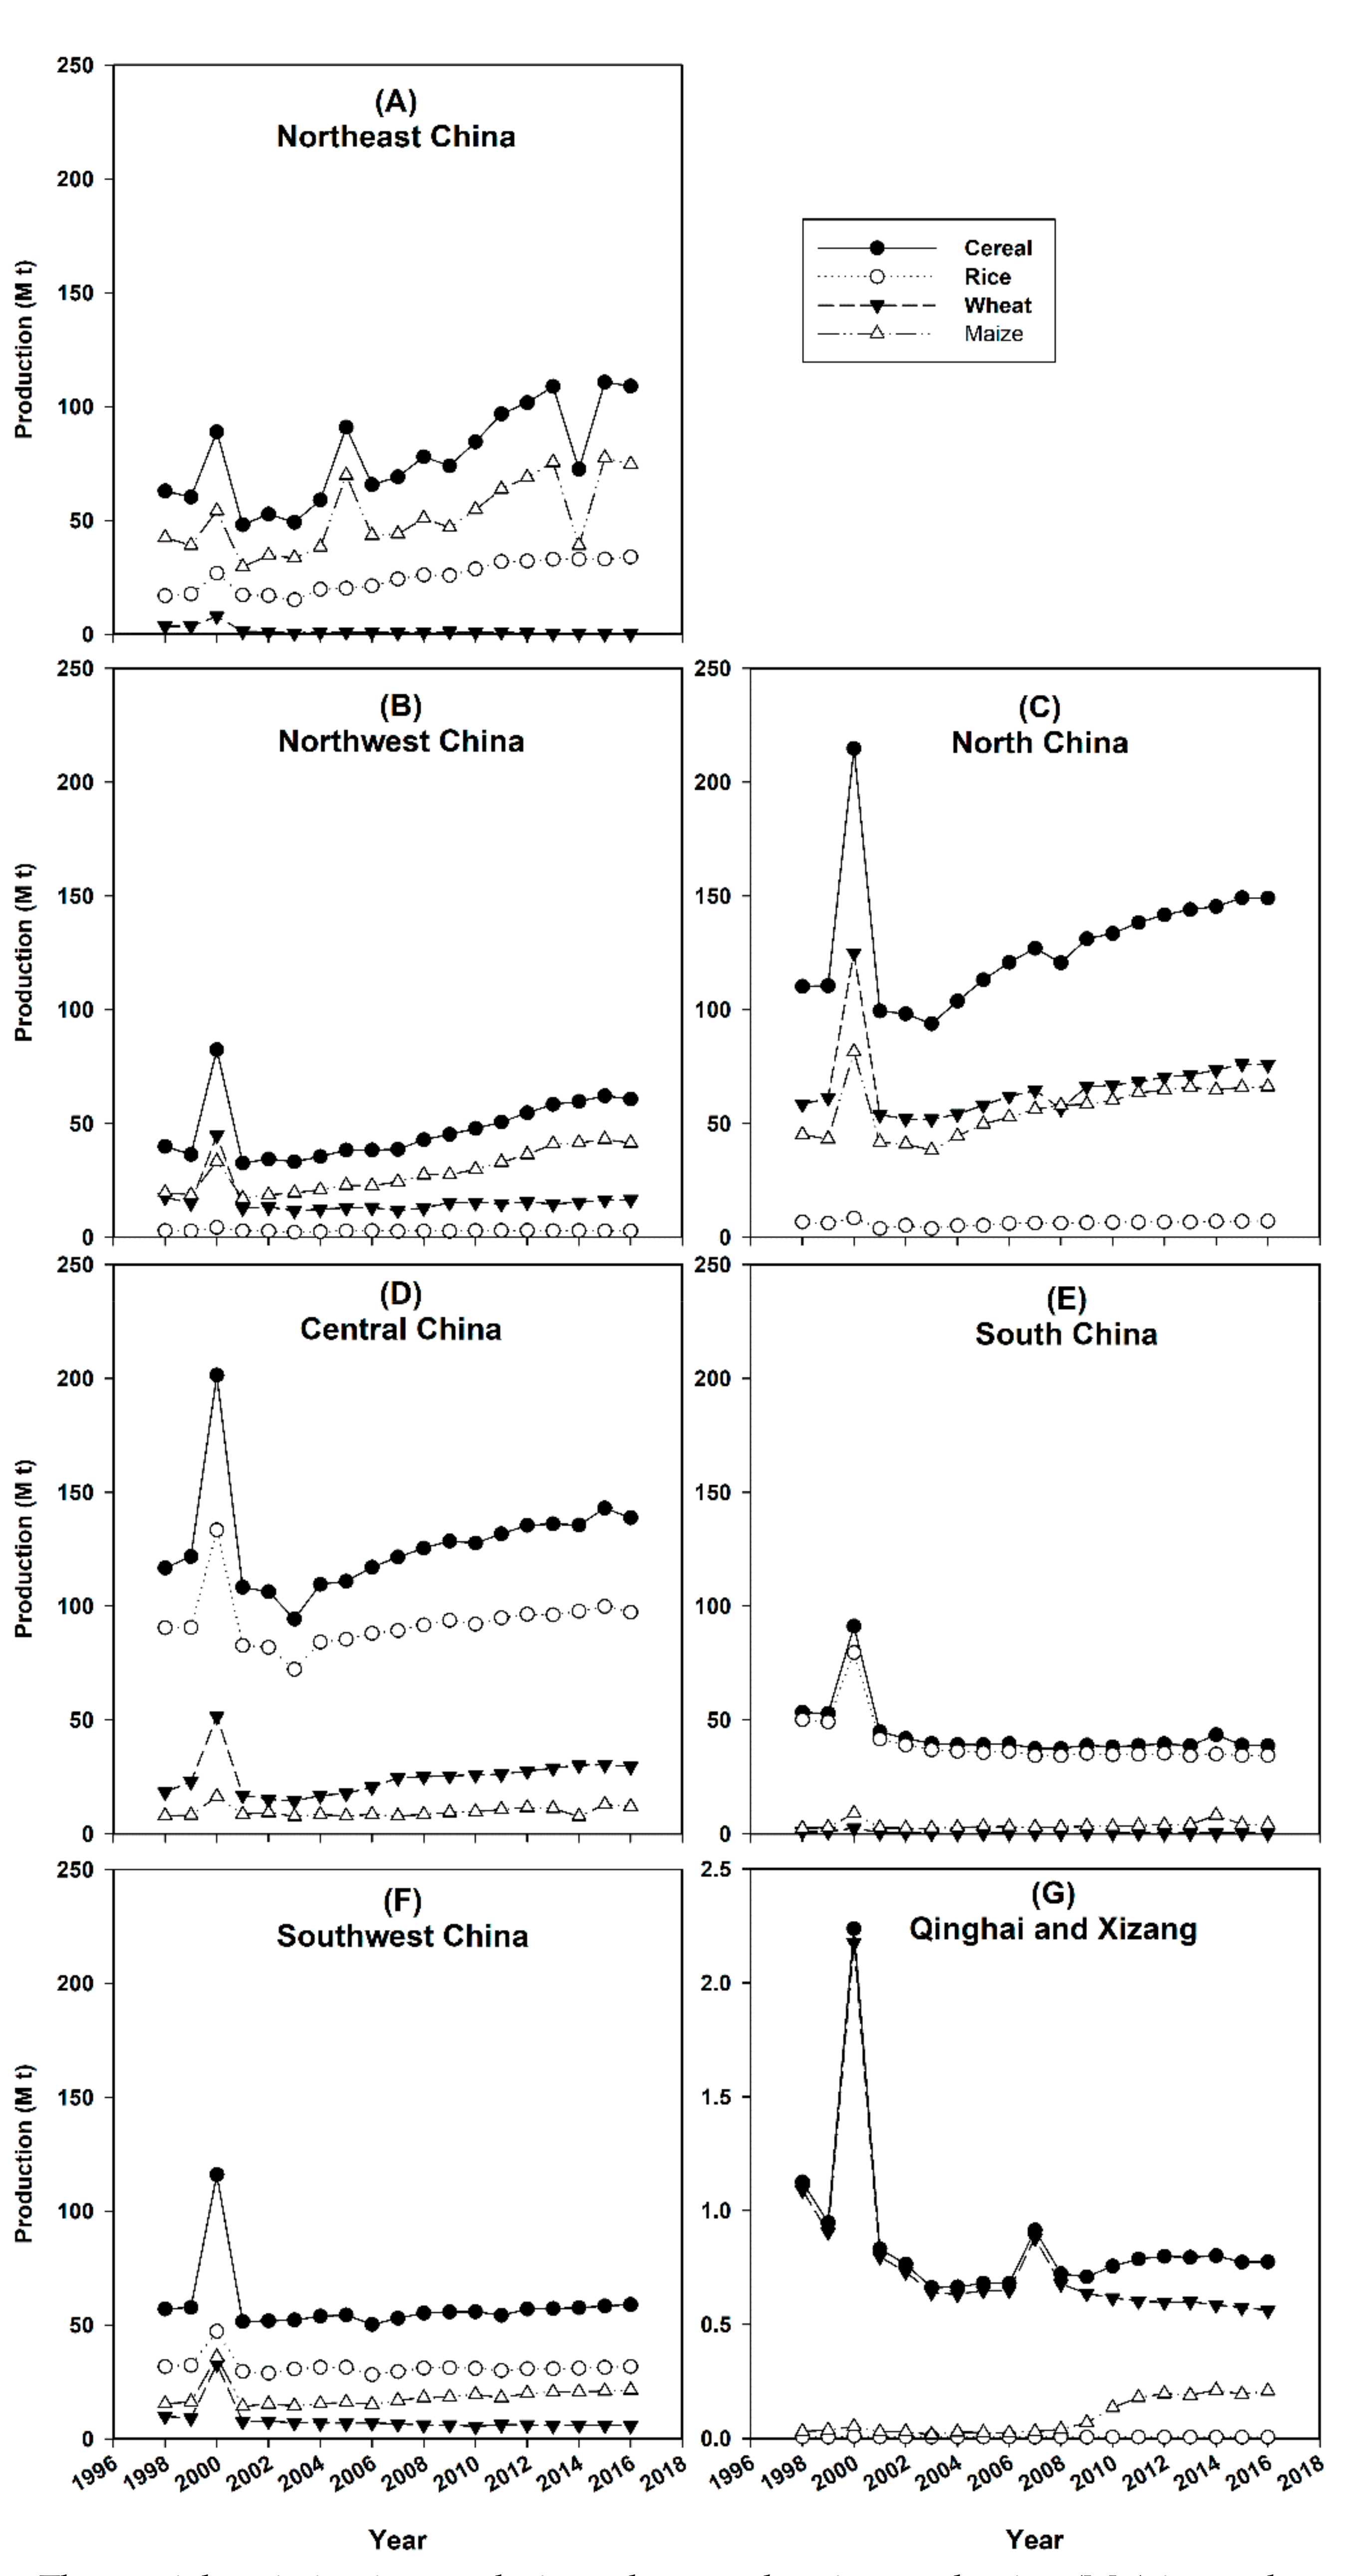
3. Results
3.1. Temporal Variation
3.2. Spatial-Temporal Variation
4. Discussion
5. Conclusions
Author Contributions
Funding
Acknowledgments
Conflicts of Interest
References
- Borg, J.; Kiær, L.P.; Lecarpentier, C.; Goldringer, I.; Gauffreteau, A.; Saint-Jean, S.; Barot, S.; Enjalbert, J. Unfolding the potential of wheat cultivar mixtures: A meta-analysis perspective and identification of knowledge gaps. Field Crop Res. 2018, 221, 298–313. [Google Scholar] [CrossRef]
- FAO. FAOSTAT-Agriculture, Food and Agricultural Organizations of the United Nations. 2014. Available online: http://faostat3.fao.org/browse/Q/QC/E (accessed on 26 May 2018).
- Nelson, G.; Rosegrant, M.; Palazzo, A.; Gray, I.; Ingersoll, C.; Robertson, R.; Tokgoz, S.; Zhu, T.; Sulser, T.; Ringler, C.; et al. Food Security, Farming and Climate Change to 2050: Scenarios, Results, Policy Options; International Food Policy Research Institute (IFPRI): Washington, DC, USA, 2000; p. 155. [Google Scholar]
- Reynolds, M.P.; Braun, H.J.; Cavalieri, A.J.; Chapotin, S.; Davies, W.J.; Ellul, P.; Feuillet, C.; Govaerts, B.; Kropff, M.J.; Lucas, H.; et al. Improving global integration of crop research. Science 2017, 357, 359–360. [Google Scholar] [CrossRef] [PubMed]
- Davis, K.F.; Rulli, M.C.; Seveso, A.; D’Odorico, P. Increased food production and reduced water use through optimized crop distribution. Nat. Geosci. 2017, 10, 919–924. [Google Scholar] [CrossRef]
- Wang, Z.; Li, J.; Li, Y. Effects of drip system uniformity and nitrogen application rate on yield and nitrogen balance of spring maize in the North China Plain. Field Crop Res. 2014, 159, 10–20. [Google Scholar] [CrossRef]
- Lv, S.; Yang, X.; Lin, X.; Liu, Z.; Zhao, J.; Li, K.; Mu, C.; Chen, X.; Chen, F.; Mi, G. Yield gap simulations using ten maize cultivars commonly planted in Northeast China during the past five decades. Agric. For. Meteorol. 2015, 205, 1–10. [Google Scholar] [CrossRef]
- Wang, Y.; Zhang, Y.; Ji, W.; Yu, P.; Wang, B.; Li, J.; Han, M.; Xu, X.; Wang, Z. Cultivar mixture cropping increased water use efficiency in winter wheat under limited irrigation conditions. PLoS ONE 2016, 11, e0158439. [Google Scholar] [CrossRef] [PubMed]
- Gao, Z.; Liang, X.; Lin, S.; Zhao, X.; Zhang, L.; Zhou, L.; Shen, S.; Zhou, S. Supplemental irrigation at tasseling optimizes water and nitrogen distribution for high-yield production in spring maize. Field Crop Res. 2017, 209, 120–128. [Google Scholar] [CrossRef]
- Guo, J.; Wang, Y.; Blaylock, A.D.; Chen, X. Mixture of controlled release and normal urea to optimize nitrogen management for high-yielding (>15 mg ha−1) maize. Field Crop Res. 2017, 204, 23–30. [Google Scholar] [CrossRef]
- Wang, Y.; Zhao, Z.; Li, J.; Zhang, M.; Zhou, S.; Wang, Z.; Zhang, Y. Does maize hybrid intercropping increase yield due to border effects? Field Crop Res. 2017, 214, 283–290. [Google Scholar] [CrossRef]
- Lazzaro, M.; Costanzo, A.; Bàrberi, P. Single vs. multiple agroecosystem services provided by common wheat cultivar mixtures: Weed suppression, grain yield and quality. Field Crop Res. 2018, 221, 277–297. [Google Scholar] [CrossRef]
- Wang, Y.; Zhang, Y.; Zhang, R.; Li, J.; Zhang, M.; Zhou, S.; Wang, Z. Reduced irrigation increases the water use efficiency and productivity of winter wheat-summer maize rotation on the North China Plain. Sci. Total Environ. 2018, 618, 112–120. [Google Scholar] [CrossRef] [PubMed]
- Yan, P.; Chen, Y.; Sui, P.; Vogel, A.; Zhang, X. Effect of maize plant morphology on the formation of apical kernels at different sowing dates and under different plant densities. Field Crop Res. 2018, 223, 83–92. [Google Scholar] [CrossRef]
- Tong, C.; Hall, C.A.S.; Wang, H. Land use change in rice, wheat and maize production in China (1961–1998). Agric. Ecosyst. Environ. 2003, 95, 523–536. [Google Scholar] [CrossRef]
- Zhou, D.; An, P.; Pan, Z.; Zhang, F. Arable land use intensity changes in China from 1985 to 2005: Evidence from integrated cropping systems and agro-economic analysis. J. Agric. Sci. 2012, 150, 179–190. [Google Scholar] [CrossRef]
- Xie, H.; Zou, J.; Jiang, H.; Zhang, N.; Choi, Y. Spatiotemporal pattern and driving forces of arable land-use intensity in China: Toward sustainable land management using emerge analysis. Sustainability 2014, 6, 3504–3520. [Google Scholar] [CrossRef]
- Zhang, Y.; Wang, Y.; Niu, H. Spatial-temporal variations in the areas suitable for the cultivation of rice and maize in China under future climate scenarios. Sci. Total Environ. 2017, 601, 518–531. [Google Scholar]
- Meng, Q.; Chen, X.; Lobell, D.B.; Cui, Z.; Zhang, Y.; Yang, H.; Zhang, F. Growing sensitivity of maize to water scarcity under climate change. Sci. Rep. 2016, 6, 19605. [Google Scholar] [CrossRef] [PubMed]
- NBS. China’s National Bureau of Statistics. 2017. Available online: http://www.stats.gov.cn/tjsj/ndsj/zgnj/2000/L24c.htmhttp://faostat3.fao.org/browse/Q/QC/E (accessed on 19 April 2018).
- SAS Institute Inc. SAS/STAT® 13.1 User’s Guide; SAS Institute Inc.: Cary, NC, USA, 2013. [Google Scholar]
- Gao, Z.; Liu, J.; Zhuang, D. The dynamic change of the gravity center of the farmland area and the quality of the farmland ecological background in China. J. Nat. Res. 1998, 13, 17–22. [Google Scholar]
- Wang, Q.; Halbrendt, C.; Johnson, S.R. Grain production and environmental management in China’s fertilizer economy. J. Environ. Manag. 1995, 47, 283–296. [Google Scholar] [CrossRef]
- Cui, Z.; Zhang, F.; Chen, X.; Dou, Z.; Li, J. In-season nitrogen management strategy for winter wheat: Maximizing yields, minimizing environmental impact in an over-fertilization context. Field Crop Res. 2010, 116, 140–146. [Google Scholar] [CrossRef]


| Region | Area | Crop | Annual Rainfall (mm) | Annual Mean Temperature (°C) |
|---|---|---|---|---|
| Northeast China | Heilongjiang, Jilin, and Liaoning province | Rice, maize, wheat, soybean | 200–1000 | 8–11 |
| Northwest China | Xinjiang Uygur Autonomous Region, Gansu province, Ningxia Autonomous Region, Shaanxi province, Inner Mongolia Autonomous Region | Maize, wheat, potato, rice, cotton | 20–400 | 7–14 |
| North China | Beijing, Tianjin, Hebei, Henan, Shandong, and Shanxi province. | Maize, wheat | 400–1000 | 8–13 |
| Central China | Hubei, Hunan, Jiangsu, Jiangxi, Anhui, and Shanghai province | Rice, wheat, maize, rape | 533–1381 | 13–15 |
| South China | Zhejiang, Fujian, Guangdong, Guangxi, Hainan and Taiwan province; Hong Kong and Macao Special Administrative Region | Rice, maize | 1400–2000 | 17–24 |
| Southwest China | Yunnan, Guizhou, Chongqing, and Sichuan province | Maize, wheat | 1000–1460 | 15–18 |
| Qinghai and Xizang region | Qinghai province, Tibetan Autonomous Region | Wheat, maize | 200–510 | 6–9 |
© 2019 by the authors. Licensee MDPI, Basel, Switzerland. This article is an open access article distributed under the terms and conditions of the Creative Commons Attribution (CC BY) license (http://creativecommons.org/licenses/by/4.0/).
Share and Cite
Wang, Y.; Gao, F.; Gao, G.; Zhao, J.; Wang, X.; Zhang, R. Production and Cultivated Area Variation in Cereal, Rice, Wheat and Maize in China (1998–2016). Agronomy 2019, 9, 222. https://doi.org/10.3390/agronomy9050222
Wang Y, Gao F, Gao G, Zhao J, Wang X, Zhang R. Production and Cultivated Area Variation in Cereal, Rice, Wheat and Maize in China (1998–2016). Agronomy. 2019; 9(5):222. https://doi.org/10.3390/agronomy9050222
Chicago/Turabian StyleWang, Yunqi, Fuli Gao, Guoying Gao, Jianyun Zhao, Xiaoge Wang, and Rui Zhang. 2019. "Production and Cultivated Area Variation in Cereal, Rice, Wheat and Maize in China (1998–2016)" Agronomy 9, no. 5: 222. https://doi.org/10.3390/agronomy9050222
APA StyleWang, Y., Gao, F., Gao, G., Zhao, J., Wang, X., & Zhang, R. (2019). Production and Cultivated Area Variation in Cereal, Rice, Wheat and Maize in China (1998–2016). Agronomy, 9(5), 222. https://doi.org/10.3390/agronomy9050222