Article

Food Phosphorus Flows in a Low-Income, Food- and Phosphorus-Deficient Country

1
Key Lab of Urban Environment and Health, Institute of Urban Environment, Chinese Academy of Sciences, 1799 Jimei Road, Xiamen 361021, China
2
International School, University of Chinese Academy of Sciences, Beijing 100049, China
3
Xiamen Key Lab of Urban Metabolism, Institute of Urban Environment, Chinese Academy of Sciences, Xiamen 361021, China
4
College of Food and Biological Engineering, Jimei University, Xiamen 361021, China
5
Department of Resources and Environmental Sciences, Quanzhou Normal University, 398 Donghai Street, Quanzhou 362000, China
*
Authors to whom correspondence should be addressed.
Agronomy 2019, 9(5), 212; https://doi.org/10.3390/agronomy9050212
Submission received: 16 March 2019 / Revised: 19 April 2019 / Accepted: 22 April 2019 / Published: 26 April 2019

Abstract

:
We present a quantitative analysis of phosphorus (P) flows that characterize the food production-consumption system metabolism in a low-income, food, and phosphorus deficient country, using Comoros, a small African island state, as an example from the year 2000 to 2011. The data were interpreted in terms of the connections between crop production, livestock breeding, human consumption, and soil stock, using the substance flow analysis (SFA) model. We found that the total P input into Comoros totaled 132.37 t in 2000 and 270.60 t in 2011, whereas the total P output totaled 567.40 t in 2000 and 702.29 t in 2011. Farmers in Comoros are cropping with little or no P input, resulting in a soil P deficiency; it varied from 435.03 t in 2000 to 431.69 t in 2011. In addition, the Phosphorus Use Efficiencies (PUEs) of plant and animal production in Comoros were 131.80% and 14%, respectively, in 2011. This is the first SFA of a small island state, and the lack of a closed P loop is a major issue for the country in terms of P security and this has not changed between 2000 and 2011. This study proposes crucial solutions for improving the PUE through recycling and reusing animal manure, human excreta, and household solid organic waste.

1. Introduction

Phosphorus (P), although it plays a crucial role in food production, is a limited resource and does not have a substitute. P fertilizer is obtained from mined phosphate rock, and the reserves of this rock are both limited and unequally distributed. A limited number of five countries, led by Morocco, China and the U.S., control more than 85% of the world’s share of minable P [1]. The application of P fertilizer for food production begun around the mid to late 19th century [2], and, currently, human populations, especially in Asia and Latin America (central and South-America), have increased the use of P fertilizer to increase crop yields [3]. In contrast, Europe and North America actually have had declining P application in the last few decades, and Africa has not yet seen an increase and requires an increased yield [3]. In addition to the P consumption, the UN’s Food and Agriculture Organization (FAO) reported that the world P fertilizer demand is estimated to be 41,151,000 t and is expected to reach 45, 858,000 t by 2020 [4].
However, resource scarcity and water pollution are both significant concerns emerging globally with the P eutrophication of surface waters from runoff due to over-application. P causing eutrophication occurs not only in coastal waters [5,6,7] but also in inland waters [8]. As for P scarcity, there are many debates over how long P will last. For example, Smil [9] estimated that, at the current rate of consumption, phosphate reserves will be depleted within 50–100 years. Steen [10], in his study of P availability in the 21st century, estimated that the P reserve will reach more than 100 years before it runs out. Furthermore, farmers’ accessibility to and the affordability of P fertilizer vary from one country to another [11], despite its importance in increasing crop yields. For example, lower-income and food-deficient countries have financial limitations that restrict access to P fertilizer, whereas industrialized countries (including N. America, Western and Eastern Europe) and Southern Asia (including China and India) account for more than 80% of the global P fertilizer consumption [12].
Obsteiner et al. [12], who developed the P trilemma, grouped three types of countries according to their P consumption: rich P consumers, poor P consumers, and P producers. In African countries in general, and in Sub-Saharan African in particular, farmers are cropping with little or no P fertilizer inputs [13,14], making the P fertilizer consumption the lowest in the world [2,15].
Comoros, a small, lower-income and food deficient African island country is no exception to this challenge even though agriculture is the dominant sector of its economy, generating 40% of its GDP, 90% of its fiscal revenues, and 80% of its jobs [16]. However, because of inefficient agricultural practices (little or infrequent use of P fertilizer), food production is insufficient to satisfy the national need [17,18], meeting only about 60% [19] of demand and importing the remainder. Currently, the agricultural productivity is being exacerbated as the nation imports almost all of its rice requirements [20]. It should be noted, however, that fishery and seafood catch provide significant sources of protein; land-based agriculture is not the sole source of food for the population. Nevertheless, enhancing agricultural production output is one of the most significant challenges facing Comoros, and it is urgent to analyze the food production-consumption P flows and explore how the Phosphorus Use Efficiency (PUE) within this small island nation can be improved. The objective of this study was, therefore, to analyze the food P flows both in food production and consumption systems and explore the potential for PUE improvement.
The substance flow analysis (SFA) approach has many advantages (for example, diagnosing problems after identifying and quantifying the potential measures of resources recovery) and has been widely used to quantify P flow within a well-defined system, where the scale varies according to the study design. It could be a regional design, such as that used by Webeck et al. [21] and by Ott and Rechberger [22]. It could be at the national scale (Antikainen et al. [23], Neset et al. [24], Matsubae-Yokoyama et al. [25], Ghani and Mahmood [26], Cooper and Carliell-Marquet [27], Li et al. [28]; Senthilkumar et al. [29], and Seyhan [30]), the provincial scale [31], or the city scale (Thitanuwat et al. [32], Yuan et al. [33], Li et al. [34], Qiao et al. [35], and Cui et al. [36]). Contrary to these studies, which were predominantly done in rich P consumer or P producer countries), the current study is the first to analyze P metabolism in both food production and consumption systems in a low-income, food- and phosphorus-deficient small island country, using Comoros as an example. The results could be used as a first step toward addressing the P balance for sustainable P management.
In low-income and food-deficient small island countries in general, and Comoros in particular, statistical and specific data for different domains are difficult to obtain. These data constraints could be seen as disadvantages to applying the SFA in those specific countries, which have some data uncertainties. Nevertheless, this study set out to analyze the food P flow and address the potential for improving the PUE. Further, this study attempted to answer the following questions: (1) how much P does Comoros use in food production and consumption, (2) what are the P sustainability issues of Comoros, as an example of a small island state, and how have they changed as the economy has changed, and (3) what are the possibilities for improving the PUE in this example country?

2. Materials and Methods

2.1. Description of the Study Area

We chose Comoros as an example of a small, low-income and food-deficient island country. Comoros is classified among the Least Developed Countries (LDCs), with a population of 575,660 inhabitants in 2003 [37], and an estimated Gross Domestic Product (GDP) of US $646 per capita in 2000 and US $1446 in 2011 (https://data.worldbank.org/country/comoros). It is located at the entry of the Mozambique Channel between northern Madagascar and Mozambique, and is made up of four islands: Grande Comore (1146 km2), Anjouan (424 km2), Moheli (290 km2), and Mayotte (374 km2). As the sovereignty of Comoros is limited to three of these islands (excluding Mayotte), our study defined only those three islands as being within the administrative boundaries of Comoros (Figure 1).
Comoros’ geographical isolation makes it a good choice for applying SFA to quantify the P flows because there is no unknown or uncalculated P flowing into it via land erosion from other countries in Sub-Saharan Africa. Additionally, Comoros has no phosphate mines, so it has to rely on fertilizer imports. Between 1975 and 1994, the phosphate fertilizers imported into Comoros consisted of aid from various countries, primarily Japan. From 1994 up to now, however, the government has contracted a private agency, the Centrale d’Achat des Professionnels Agricole des Comores (CAPAC) (the English translation of CAPAC: Purchasing Center for Agricultural Inputs), to import agricultural inputs, such as P fertilizers, pesticides, and seeds.
The Comorian food production system is a simple network and agricultural techniques are simple (including little or no P input). Food crops are grown by farmers for subsistence and yields are low. For example, rice yields in 1984 were estimated to 300 kg ha−1 and, currently, production has almost ceased. With regards to cash crops, the agribusiness is currently based on three main agricultural export products: vanilla, ylang ylang, and cloves. Comoros is the world’s leading country in term of quantity and quality of ylang ylang essential oil: it supplies more than 60% of the world’s ylang ylang oil market, which is a distinctive, essential oil for expensive perfumes [38].

2.2. Phosphorus-Flow Analytical Model

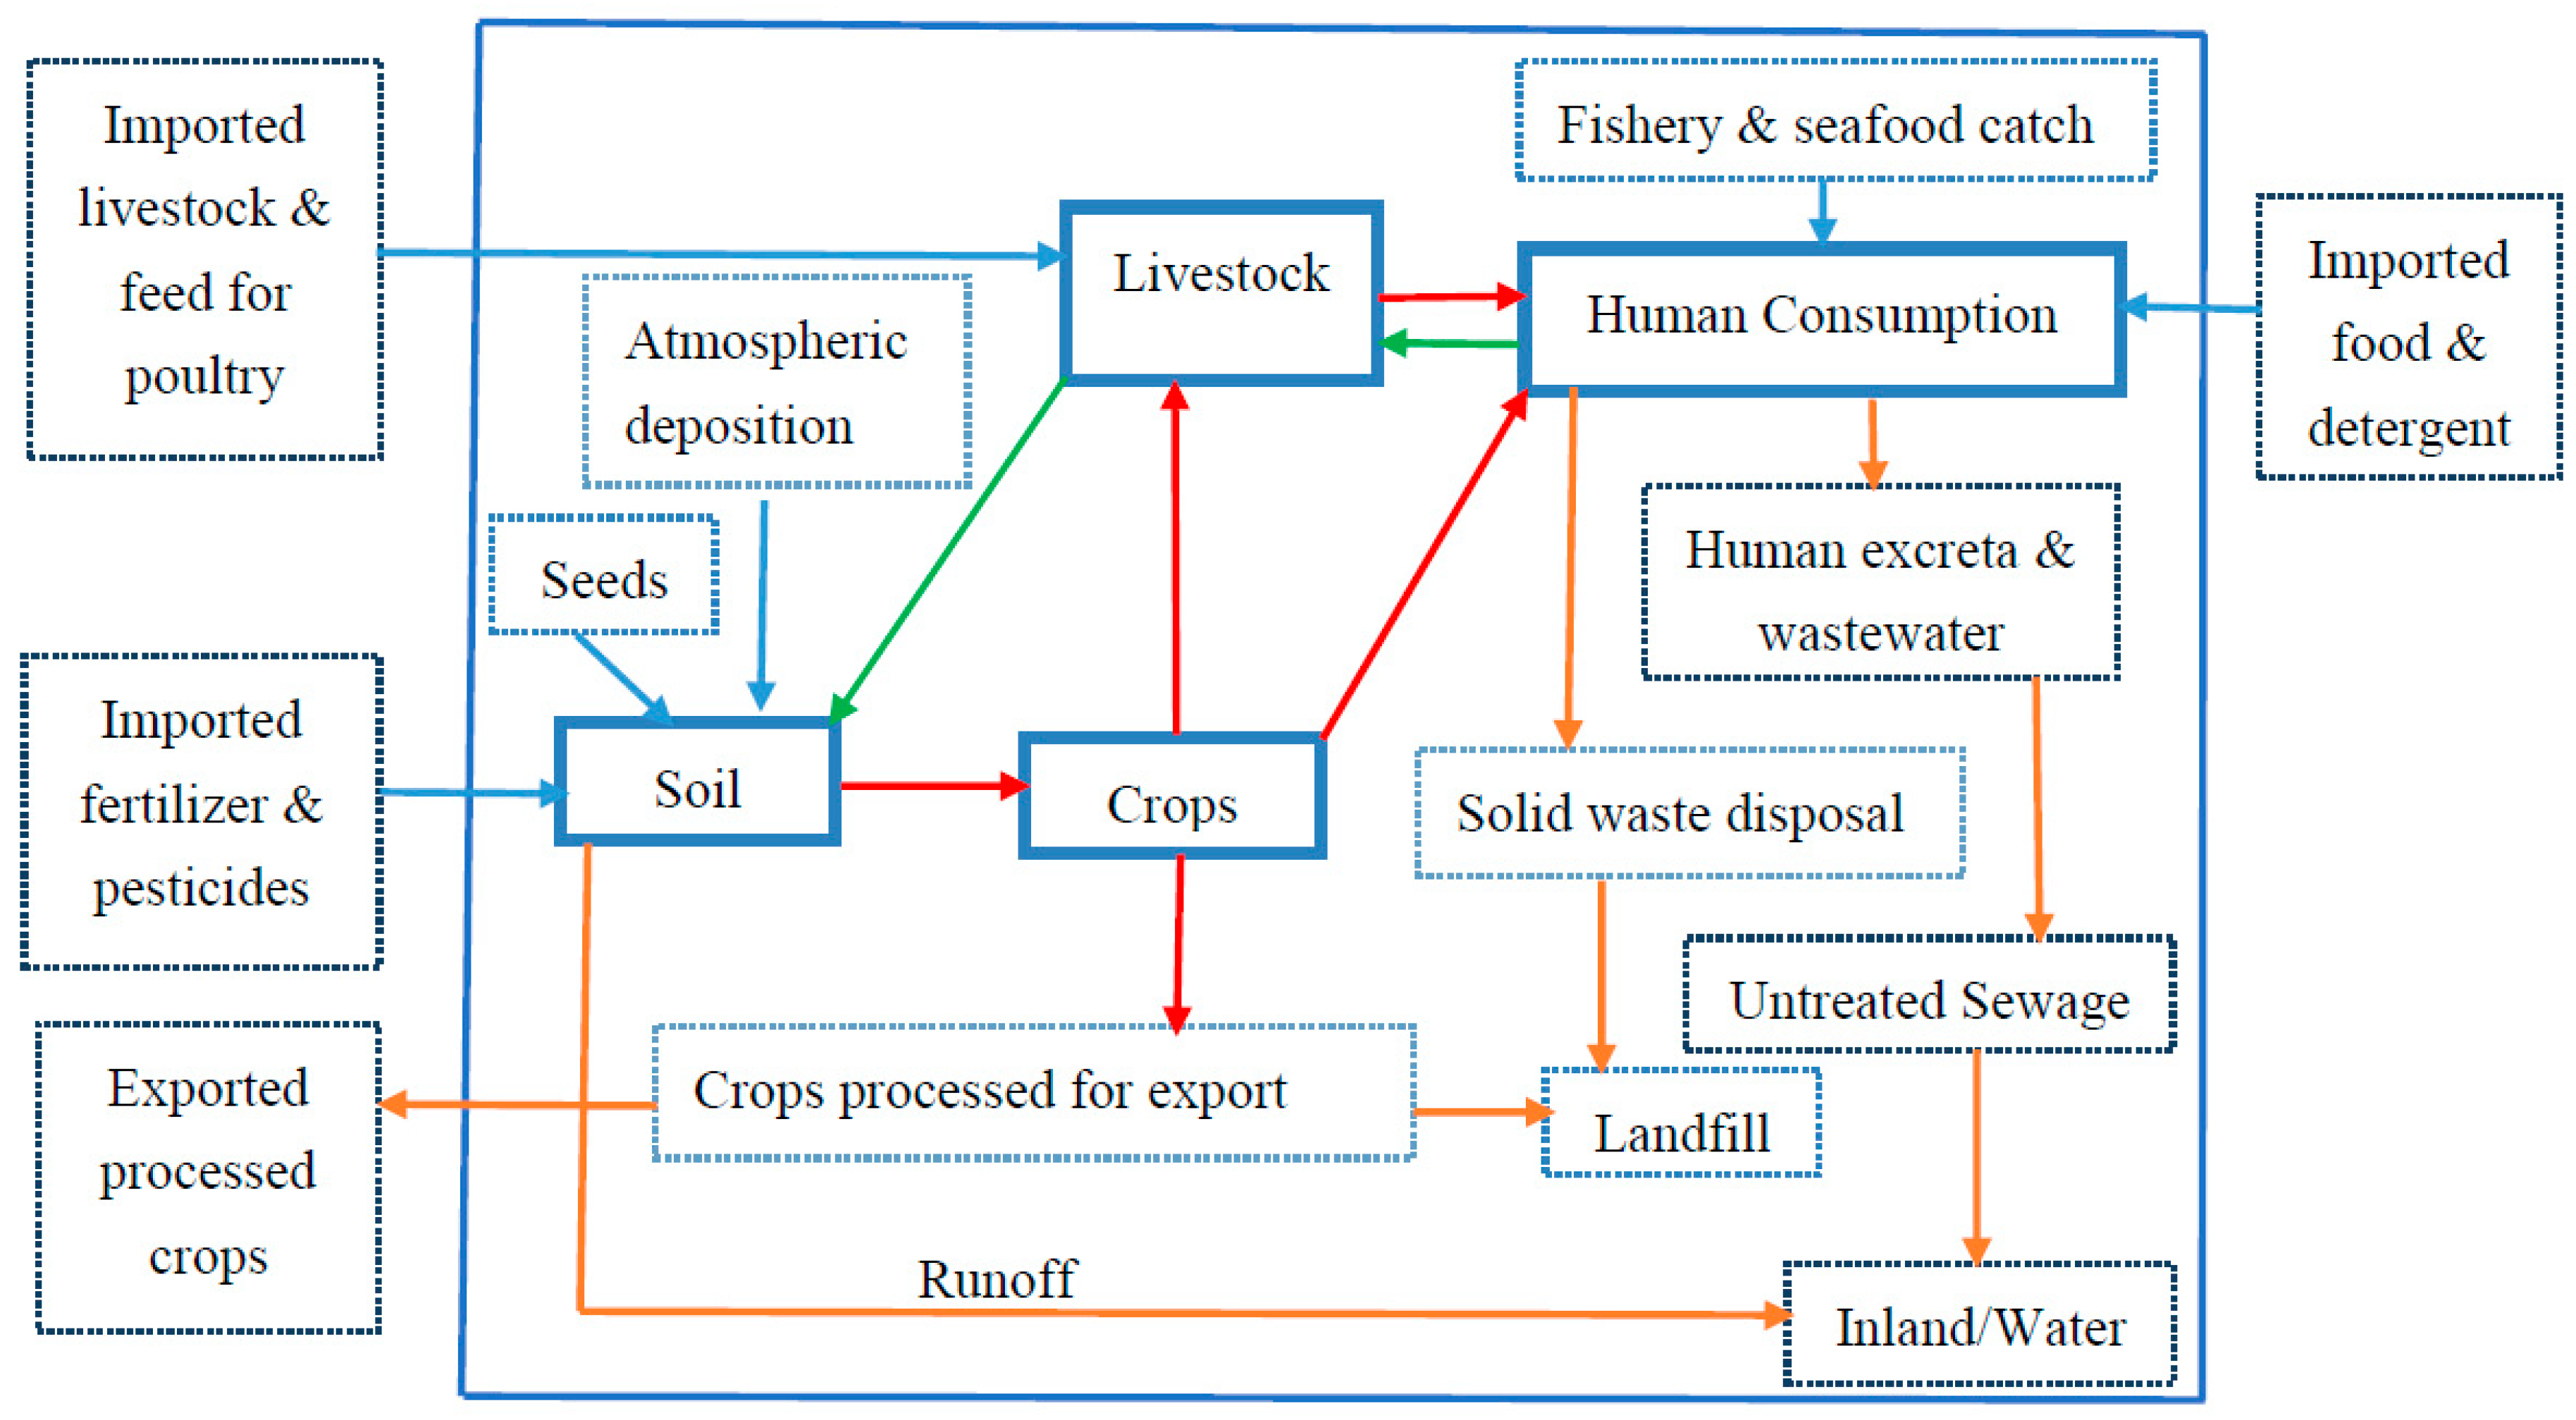
We designed a P-metabolism model matching the reality of these systems in Comoros. Hence, considering the limited data availability, instead of calculating P flows for each island, we calculated P flows by assuming that the three islands made up an archipelago country, with one boundary: the intertidal zone surrounding the three islands. We then divided the food production and consumption system into four subsystems (see Figure 2): the soil subsystem, the crop subsystem, the livestock subsystem, and the human consumption subsystem.
The soil subsystem included atmospheric deposition, seeds, surface runoff, livestock manure, fertilizers, and pesticides (see Figure 2). The crop subsystem was comprised of the pastures for livestock, the plant-based foods, and the agricultural products processed for exports. The livestock subsystem consisted of poultry, cattle, sheep, and goats. We considered both urban and rural populations in the human consumption subsystem as one group, even though the food consumption patterns may differ from one island to another. For example, the island of Moheli (see Figure 1) is considered to be the most active producer of food of Comoros [39]. People who are living on Moheli consume more starchy foods, vegetables and bananas, and fish as a source of protein, whereas those on Grande Comore and Anjouan consume more wheat flour and rice, chicken, and meat as a source of protein. The fishery and seafood catch refers to the quantity caught yearly from the sea and input to the national market. Figure 2 below presents the Comorian P framework.

2.3. Calculation Methods

This study used the SFA model as the methodology for calculation. SFA is a systematic assessment of the flows and stocks of substances within a system defined in space and time [40]. For the data collection from national sources, we collected them from May to June, 2016, in Comoros through investigation (interviews), fieldwork, and online systems. We interviewed the three agricultural and livestock breeding directorates on each island, the National Institute of Agricultural and Fisheries Research (known in French as the Institut National de Recherche Agricole et de la Pêche (INRAP)), the Directorate of the CAPAC, and the sea-port customs, in order to get the unpublished data related to P fertilizer (P2O5). We then did field investigation research on the local livestock breeding on each island, to get more information and data on the livestock feeding systems and sources. And finally, we downloaded the annual reports of the central bank of Comoros to get the trade statistics data [41].
After data collection (some of the data were collected from existing literature: see supplementary materials for methods and data: Tables S1 and S2). For example, we used the P contained in the household organic waste data of Kampala, Uganda from Komakech et al. [42] to calculate the P contained in the household organic waste of Comoros because the food consumption patterns between Comoros and Uganda are similar (i.e., based on the green banana, cassava, and other starchy foods, chicken, and meat). We then calculated the P concentrations, P flows, and P stocks, using the law of mass conservation. We used the E-Sankey software for drawing graphs.

2.3.1. P Concentration

We calculated total P in each product using the equation below:
P = A C
where P is the P content of materials, A is the amount of materials, and C is the content rate of the materials.

2.3.2. Soil P Deficiency

We calculated the soil P deficiency using the following equation:
S o i l   P   d e f i c i e n y = i = n n s o i l   P   o u t p u t   i i = 1 I s o i l   P   i n p u t   i  
where n is the number of outputs (total harvest plus runoff) and I is the number of inputs (atmospheric deposition, seeds, manure, and imported fertilizers and pesticides).

2.3.3. PUE in Plant and Animal Production

We calculated the plant and livestock production efficiency as indices for assessing the efficiency of P metabolism in the plant and livestock subsystems. The plant production efficiency was calculated as the ratio of the plant-based P output to the P input to agricultural soil production subsystem. We calculated it, by using the following equation:
P l a n t   p r o d u c t i o n   e f f i c i e n c y = 100 % ( o u t p u t   P   i n p u t   P )
where output P is the total harvest (plant-based food P and crops processed for export P), and input P is the sum of imported fertilizer and pesticides P, animal manure recycling P, atmospheric deposition P, and seed P).
The animal production efficiency was calculated as the ratio of the animal-based food P output to the P input to the livestock production subsystem. We calculated it, by using the equation below:
L i v e s t o c k   p r o d u c t i o n   e f f c i e n c y = 100 %   ( o u t p u t   P i n p u t   P )
where output P is the animal-based food P and input P is the sum of the pasture P and the garbage-based feed P.

2.4. Data Sources

Data were collected from two main sources in this study: national (government reports, survey questionnaires, literature, and interviews: see Section 2.3. for calculation methods) and international (FAO, the United Nations Development Program (UNDP), the International Monetary Fund (IMF), and the World Bank (WB)). For both 2000 and 2011, the sources of the data were the same, and there was not a big difference in its quality.

3. Results

3.1. Overall Comorian P Metabolisms

Figure 3a,b illustrates the P flows through the food production and consumption system in Comoros for the years 2000 and 2011, respectively. As demonstrated in Figure 3a, the total P input for the entire country in 2000 was 132.37 t, broken down as follows: imported fertilizer and pesticides (44.00 t P); imported food (including livestock) and detergents (39.00 t P); fishery and seafood catch (33.00 t P); and agricultural seeds (including atmospheric deposition) (16.37 t P). The total P output in the year 2000 was 567.40 t, mainly from P discharged to the water (415.75 t) and landfills (151.05 t). The P from imported fertilizers and pesticides increased slightly from 44.00 t in 2000 to 88.00 t 2011. Comoros has no phosphate mines and it imports all P-related materials.
A comparison of Figure 3a and Figure 3b reveals that P outputs increased slightly, from 567.40 t in 2000 to 702.29 t in 2011. Although the amount of P discharged to the water from livestock decreased from 58.75 to 46.73 t from 2000 to 2011, there has still been an upward trend in the system as a whole. The total P discharged to the water from the human consumption subsystem increased slightly, from 227.00 t to 296.00 t, because of the rapid growth in food consumption brought about by population growth. As the country has no proper garbage treatment system, the P from garbage goes directly to landfills and, from there, to sewage and to the water.
The large fraction of P generated from livestock manure (110.75 t in 2000 and 125.73 t in 2011), and used as soil fertilizer is divided as follows: 26.0 t in 2000 and 39.50 in 2011 was used on the croplands, and 84.75 t in 2000 and 86.23 t in 2011 was used on the grasslands during the grazing of animals.
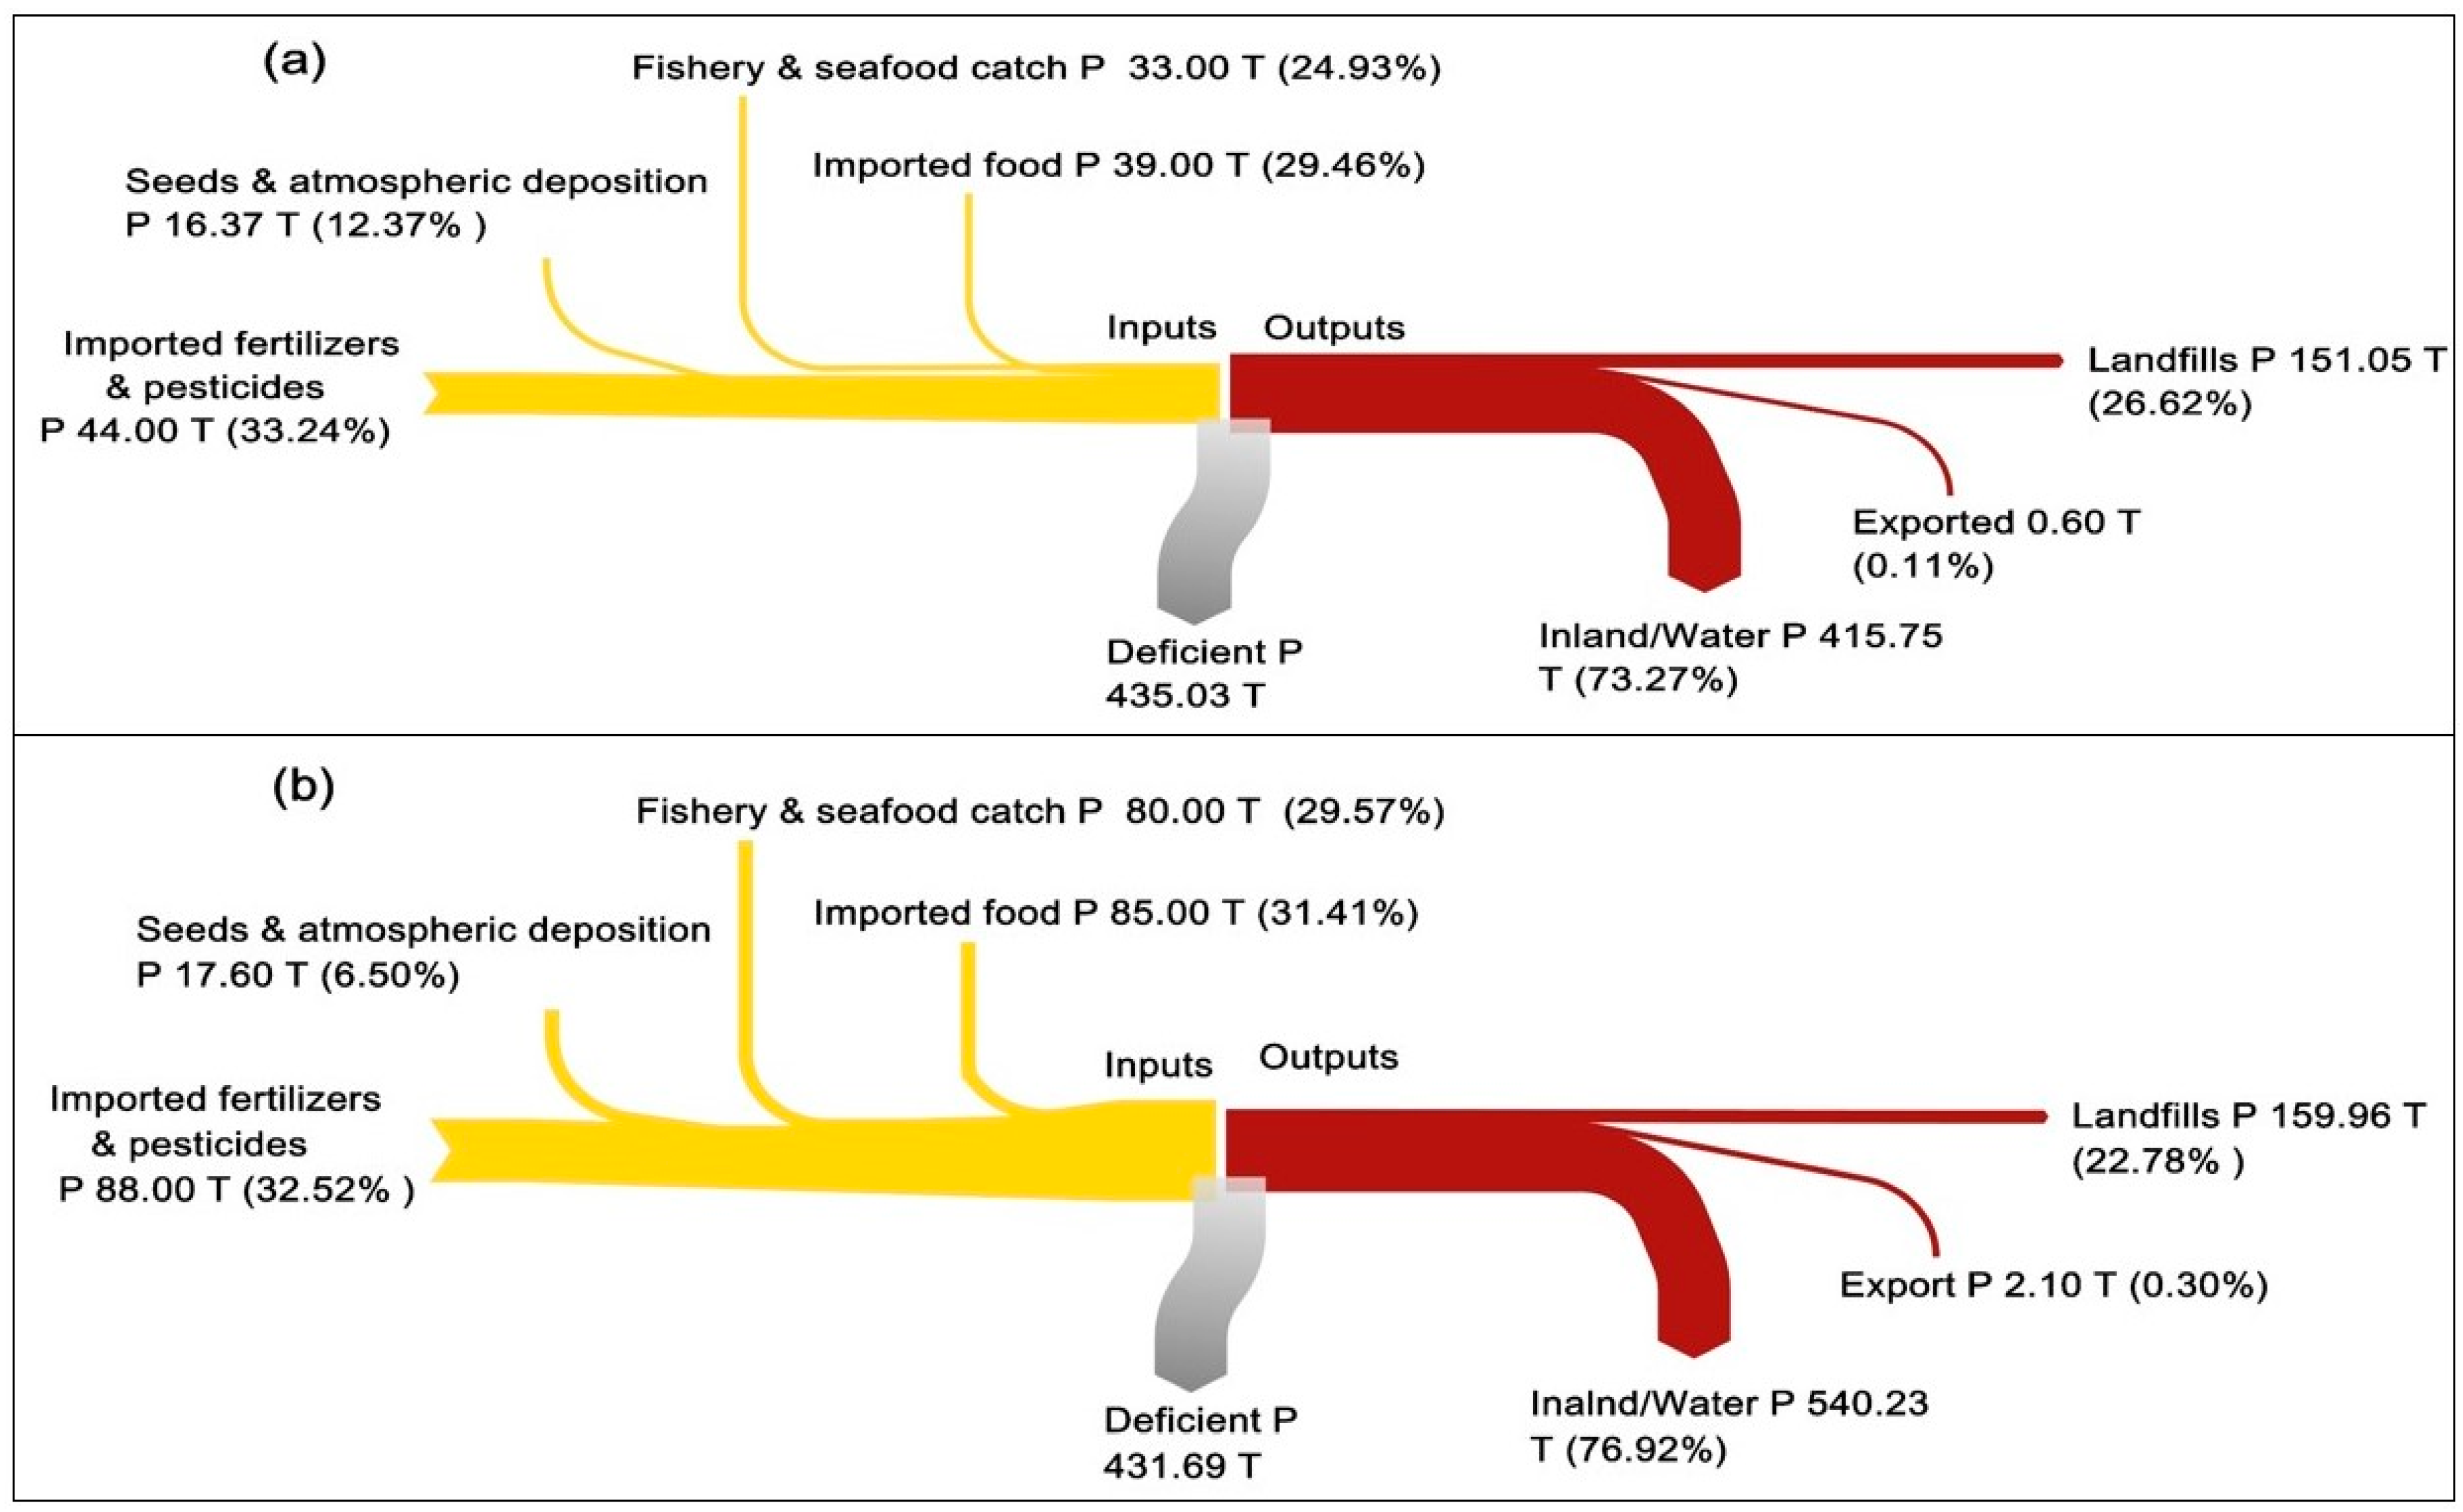
Figure 4a,b gives an overview of the total P inputs and outputs in the entire system in 2000 and 2011, respectively. The largest P inputs were from imported fertilizer and pesticides (44.00 t in 2000 and 88.00 t in 2011), followed by imported food (39.00 t in 2000 and 85.00 t in 2011), and fishery and seafood catch (33.00 t in 2000 and 80.00 t in 2011), while the significant P outputs were mainly to water (415.75 t in 2000 and 540.23 t in 2011) and landfills (151.05 t in 2000 and 159.96 t in 2011). The P deficiency decreased slightly from 435.03 t in 2000 to 431.69 t in 2011. It is evident that the imported P (in food, fertilizer, and pesticides) dominated the P input, accounting for 62.70% and 63.93% of total input in 2000 and 2011, respectively. This is the characteristic of P flow in a food- and P-deficient country, distinct from the P flow in other counties like Australia, a rich P consumer (0.46% and 69.30% for imported food and imported fertilizer, respectively), and China, a vital producer of P(2.00% and 0.90% for imported food and imported fertilizer, respectively) (see Table S3).
In summary, as can be seen in Figure 3 and Figure 4, there were both little change between 2000 and 2011 and a lack of a closed loop in the P flow.

3.2. P Flows in the Subsystems

For the livestock subsystem, the P from animal-based food increased from 15.00 t in 2000 to 25.00 t in 2011, due to an increase in imported livestock. Small landholder farmers, with their lack of financial resources and technical and management capacities failed to satisfy the local needs, and the country, therefore, increased the import of all sorts of animal-based food (from live bovines to bovine meat, from powdered to liquid milk, and from live chickens to chicken products). The local livestock production was, thus, weakened and could not compete with imported livestock products. The increase in imported livestock products for human consumption was coupled with a rise in P discharged to the water and landfills as a result of increased food consumption. These discharges of P will be an environmental concern in the future as the increase in P discharged to the water may lead to water pollution in the water body. The P from untreated manure dropped slightly, from 58.75 t in 2000 to 46.73 t in 2011, evidently because of the reduction in local livestock production. The P from garbage-based feed increased negligibly, from 17.35 t in 2000 to 17.38 t in 2011.
For the crop subsystem, the total P inflow, which was mainly from harvests, dropped slightly, from 476.15 t in 2000 to 465.52 t in 2011, because of the reduction of P in plant-based food for human consumption. At the same time, the amount of P from plant-based foods in Comoros declined by approximately 17.60 t from 2000 to 2011. The decline was mainly in staple foods produced for local consumption, but, considering the continuing population growth, it is clear that food production has become increasingly insufficient to satisfy the nation’s needs.
For the soil subsystem, when we looked, first, at the amount of fertilizer and pesticides consumed in 2000 and 2011 at the national scale (Figure 3), it was evident that the country had applied very little fertilizer on the agricultural soil. For example, when we divided the difference between the P fertilizers and pesticides consumed between 2011 and 2000 by 12 (the length between the study years), we got a yearly P increase of 3.66 t. Therefore, effective countermeasures against this soil P deficit are essential as the soil P is a crucial part of high-yield agriculture. Those countermeasures could encourage the intensification of fertilizer input, thus reducing the P loss and maximizing the recycling and reusing of the domestically-available P fertilizer resources. The ideal way for Comoros to attain this goal would be to channel financial means into technologies that would allow for recycling the P in this small island country. However, Comoros, being a LDC, regional and international aids would likely be required.
On the human consumption subsystem side, there was a slight P increase between the P inflows and outflows during our study period. This increase was caused by the rise in P from imported foods and detergents (28.00 t to 66.00 t), and fisheries and seafood (33.00 t to 80.00 t). However, the P from plant-based foods declined from 319.00 t in 2000 to 301.40 t in 2011. Although there was a slight P increase in the human consumption subsystem, P from plant-based foods in 2000 was estimated to be 319.00 t at the national scale, making the P from plant-based foods equal to 0.58 kg per capita. The main reason for this small amount of P was that the country had spared no efforts in the attempt to feed its population by importing food instead of by improving the agricultural sector and boosting local production. Furthermore, the majority of the Comorian population (approximately 71%) lives in rural areas, where, because of the lack of standard sanitation facilities, they use latrine toilets, where feces and urine remain in holes in the ground for long periods of time. Hence, the P from these excreta have never been either collected or recycled, and P from this untreated sewage is increasing along with population growth. Moreover, according to our calculations, approximately 150.65 t in 2000 and 158.56 t in 2011 of P remained in the landfills. The increase of the total P flow from human consumption to the landfills was due to fast growing population and urbanization. The annual urban growth rate in Comoros is estimated to be 6.5%, which is higher than the annual population growth rate of 2.7% [37]. This urban population growth induced a change in diet for people living in the urban areas in Comoros (especially in the three capital cities of each island: Fomboni, Moroni, and Mutsamudu), where people consume more imported foods (all sorts of livestock), wheat flour, and rice. In turn, these changes in diet increase the P loaded to the landfills.

3.3. PUE in Animal and Plant Production

The PUE in animal production and plant production (see Figures S6 and S7) varied from 8.64% to 14% and 187% to 131.80% in 2000 and 2011, respectively. There was an increase of 5.36% in PUE for animal production and a large decrease of 55.2% of PUE for plant production over 11 years. The PUE results reveal that there is an urgent need for enhancing the PUE in Comoros. This means that the national P recovery should be maximized and fully managed. This P recovery will present a significant effect on the local situation (see Section 4.1, which focuses on the estimation of the national P recoverable).

4. Discussion

4.1. Recovery of P for Improving PUE in Comoros

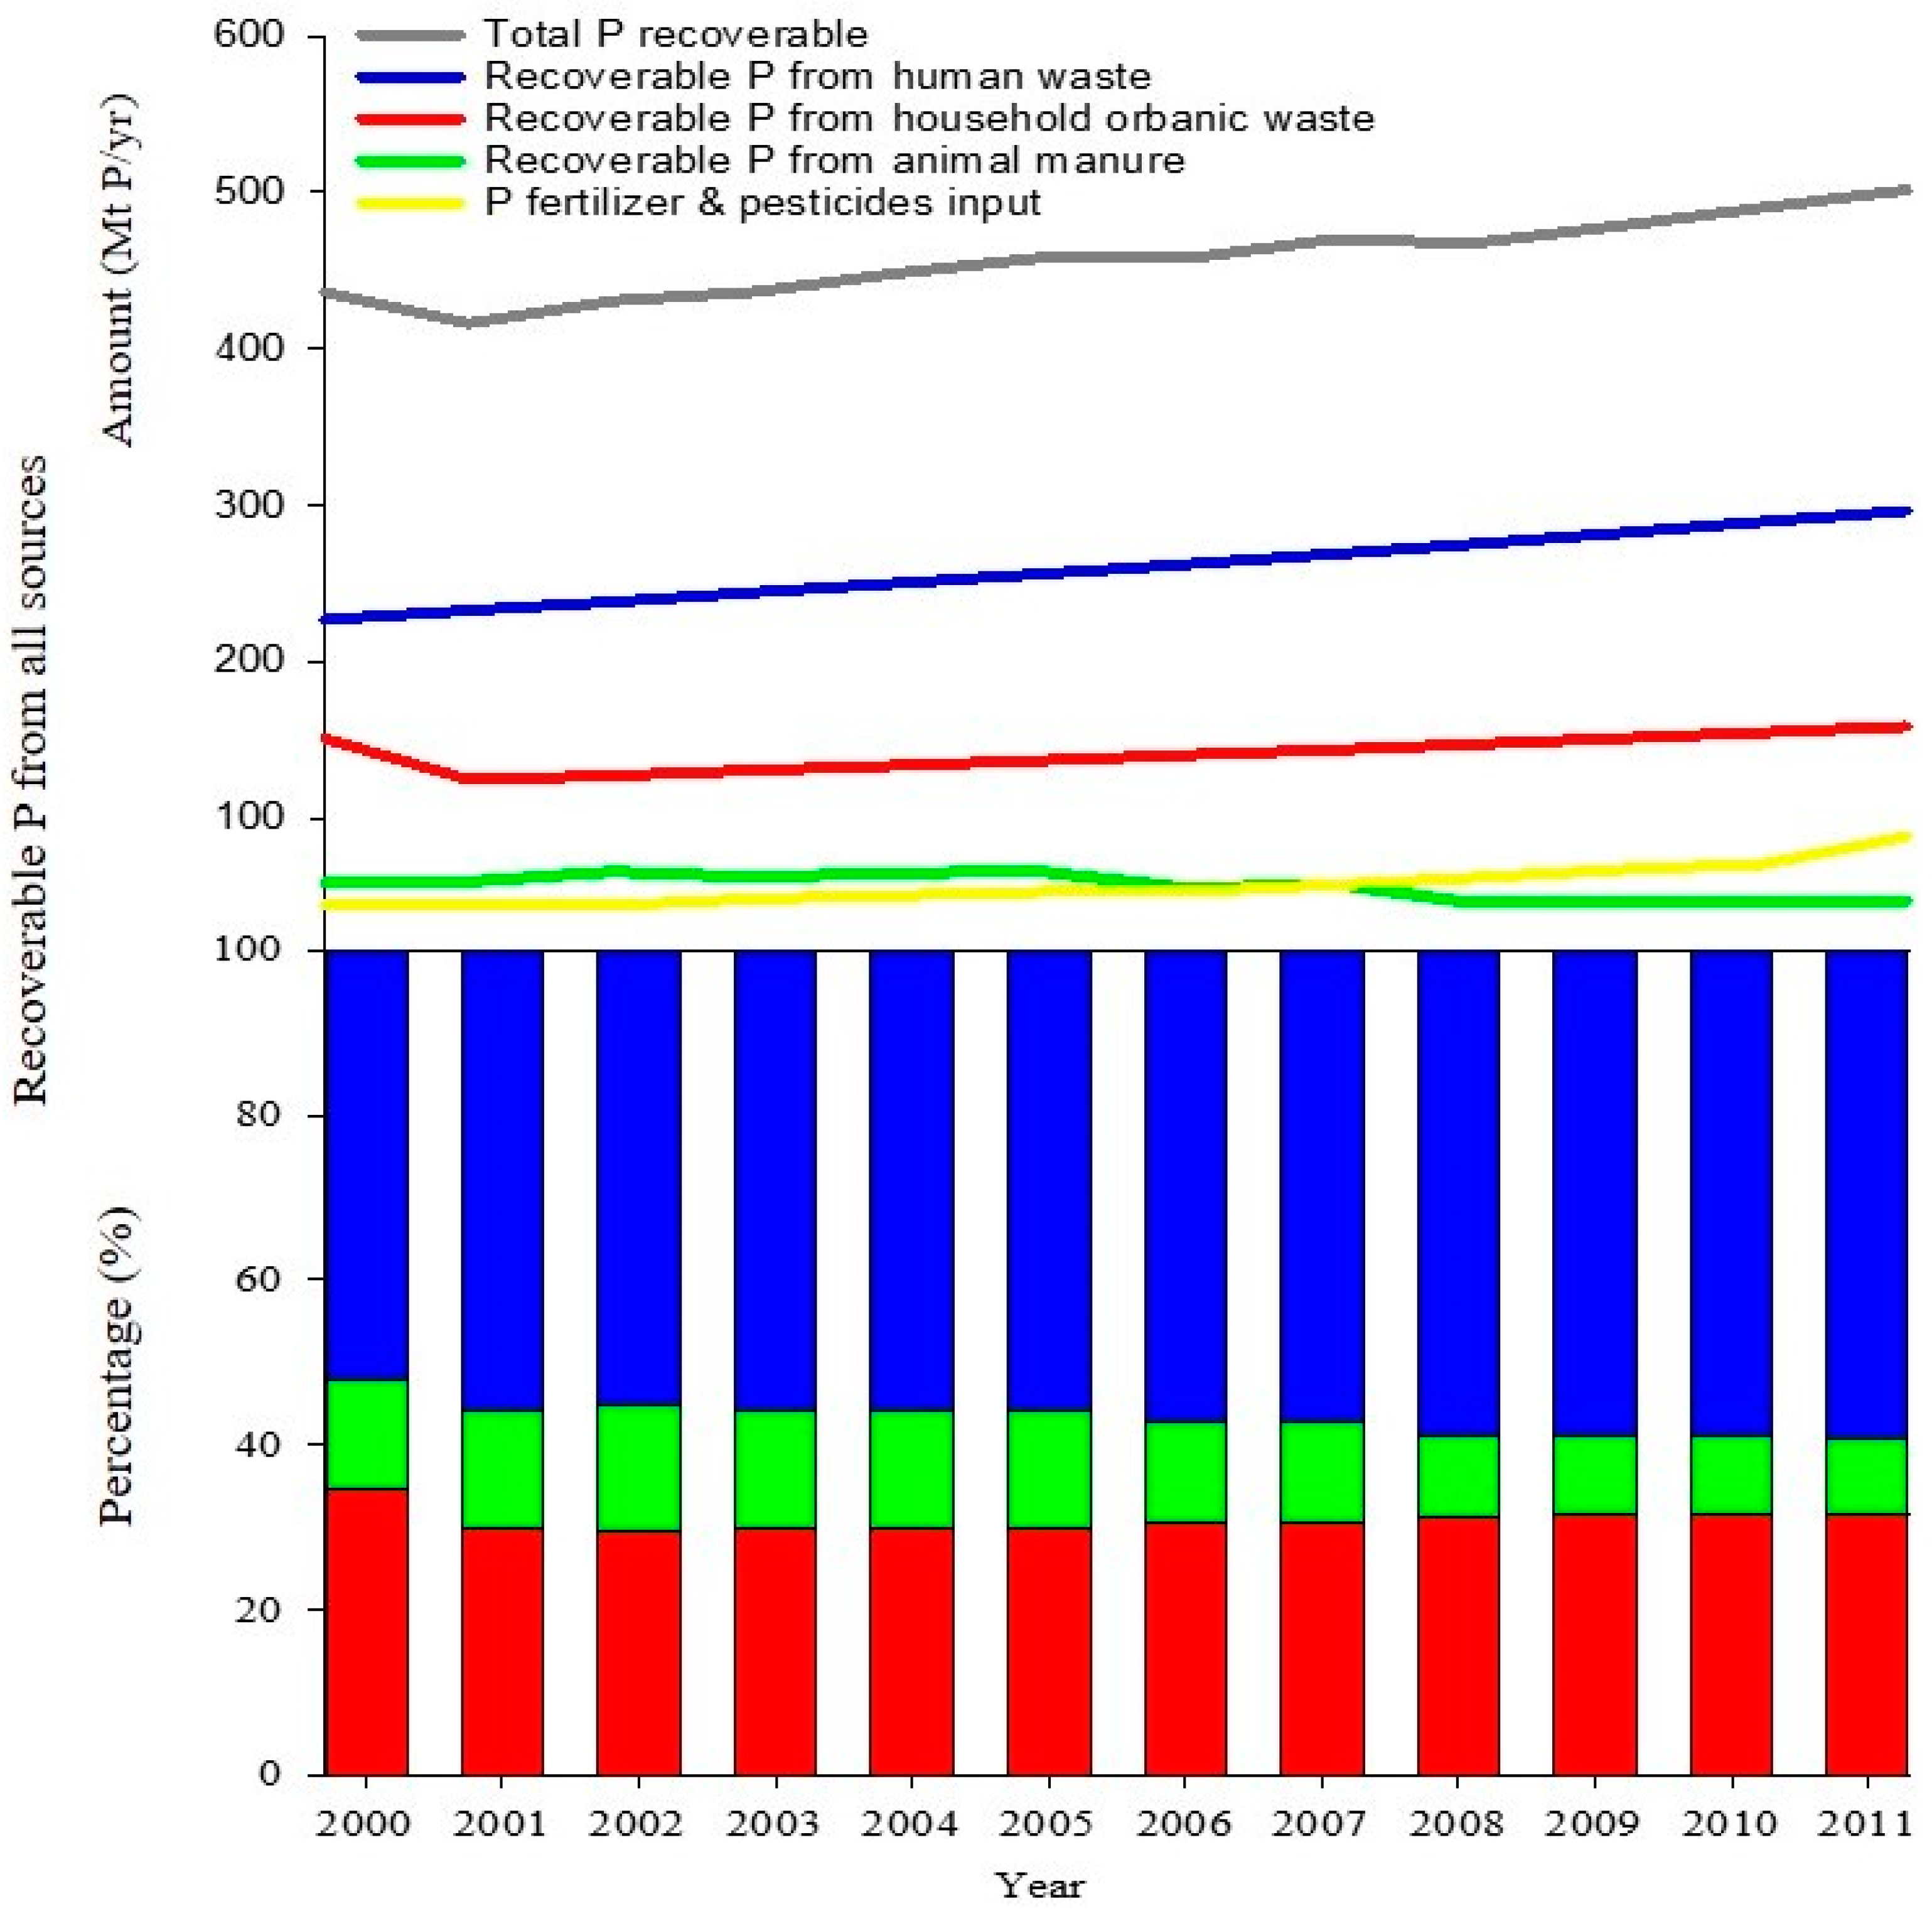
Figure 5 displays the total amount and percentages of recoverable P from waste in Comoros. Interestingly, this study found that the country has tremendous opportunities for improving its P input to agricultural land. The difference between the total P fertilizer and pesticides input, from 2000 (44.00 t) to 2011 (88.00 t) and the total amount of recoverable P in 2000 (436.27 t) and 2011(501.71 t), suggests that Comoros to highly consider recycling and reusing the P from these wastes.
The total recoverable P increased from 436.27 t in 2000 to 501.71 t in 2011. Overall, the largest recoverable P amount came from human waste, which varied from approximately 52.01% (227 t) in 2000 to 59.09% (296 t) in 2011, followed by household organic waste, which varied from 34.53% (150.65 t) in 2000 to 31.60% (158.56 t) in 2011, and animal manure, which varied from 13.46% (58.75 t) in 2000 to 9.31% (46.73 t) in 2011. A detailed analysis of each source and the amount of recoverable P is given in the Supplemental materials (Figures S1–S4).
In summary, SFA demonstrated that Comoros had a severe soil P deficiency because of a lack of closed loop P. This means that, if Comoros could maximize the recycling and reuse of the total amounts of P that are annually wasted in the food production-consumption systems, the country would not need huge amounts of money to buy expensive P fertilizers (the cost of NPK fertilizer in Grande Comore was 500 CF/kg, 600 CF/kg in Anjouan, and 750 CF/kg in Moheli (417.186 CF (Comorian francs) = $1 USD on 12 June 2018)). For example, the total recoverable P in 2000 was 436.27 t, which was almost 10-times higher than the total amount of P fertilizer (44 t) input in that year, giving evidence to our argument. Taking into account the growth of this resource, Figure 5 shows that Comoros has rich and growing supplies of animal manure, household organic waste, and human waste that could be used to improve livestock and waste management, and as a source of P fertilizer.
In term of opportunities, recycling P, especially from sewage, would be beneficial for Comoros, not only as a source for P fertilizers, but it could also improve the health of the population by allowing them to access to proper sanitation. Improving access to proper sanitation will have a significant contribution because, according to the World Health Organization’s (WHO) country cooperation strategy paper, in 2015, only 35.8% of the population were using improved sanitation facilities; the remaining 64.2% were still using improper ones [43]. However, it is highly unlikely that the Comorian government could reach that long-term goal without any foreign aid, from techniques to finances.

4.2. Agricultural Production Subsystem and Soil P Deficiency in Comoros

The Comorian agriculture sector could be divided into two sectors: food crops and cash crops. Food crops, including gardening, are subsistence-based agriculture, produced on higher lands, and provide products for self-consumption for the domestic population. The products are mainly vegetables, legumes, beans, grains, bananas, coconuts, starches and roots. Meanwhile, the cash crops are produced along the coastal areas (at approximately 400 meters of elevation from sea level), and are mainly based on three agricultural commodities—vanilla, cloves, and ylang ylang—destined for export [17].
Regarding fertilizer consumption, food crop production (including gardening and agriculture of tomatoes, cabbage, carrots, lettuce, green paper, etc.) is the only sector that consumes P fertilizer for production. Figure S5, demonstrates that the fertilizer consumption in Comoros was estimated to be 1.92 kg ha−1 in 2000, which is very small compared to other countries (Table S4) (e.g., Japan: 353 kg ha−1; Germany: 285 kg ha−1; France: 258 kg ha−1; USA: 109 kg ha−1) [44].
The total P fertilizer outflows are higher than the total P inflows in the soil subsystem (see Figure 2a,b), meaning that the P budget is negative and is increasing yearly, causing a soil P deficiency. This study estimated the soil P deficiency was approximately 435.03 t in 2000 and 431.69 t in 2011. The total P inflows were mainly from manure, atmospheric deposition, seeds, and imported fertilizer and pesticides, while the main P outflows were from total harvest and soil runoff. This limited application of P fertilizer in Comoros had negative consequences on food productivity (a decrease in crop production per capita), making Comoros a more extensive food deficient island country. However, there was a neglected amount of fertilizer through the mineralization of P from soil organic matter applied by a small number of farmers in Anjouan Island, a project initiated by Dahari, a Non-Governmental Organization (NGO) (probably since 2013) [45].
On the other hand, the runoff rose from 130.00 t in 2000 to 197.50 t in 2011. Comorian soil is naturally fragile and susceptible to erosion and degradation, due to the high rate of deforestation (approximately 500 ha per year) and the inappropriate exploitation of higher altitudes [46]. The yearly amounts of P blown away from the soil could likely act as a pollutant to water bodies, especially the ocean.

5. Conclusions

Using Comoros as a case study, this article developed a profound and comprehensive analysis of the food P flows for a low-income, food- and P-deficient small island country. Our results have estimated the P flows, P deficits, P discharged to water and landfills, and soil P deficiency. We found that cropping with little or no P fertilizer input on the agricultural soil, coupled with intensive runoff, depleted the soil nutrients and led to a soil P deficiency.
This first SFA study of a small island state revealed that the lack of a closed P loop is a major issue for the country, in terms of P security, which has not changed between 2000 and 2011. The enhancement of the PUE through maximizing the recycling and reusing of P is crucial in those specific countries.
This study has identified and estimated how to improve the PUE by recycling and reusing the P from animal manure and human and household organic waste. The total recoverable P is more than 10-times higher than the P fertilizer, including pesticides, applied to the agricultural soil in the year 2000. From our calculations, it was clear that there are tremendous opportunities for improving the PUE through P fertilizers derived from those wastes, making them an extremely cost-effective tool.

Supplementary Materials

The following are available online at https://www.mdpi.com/2073-4395/9/5/212/s1. Supplemental materials for methods and data (parameters and detailed descriptions) are provided in spreadsheets. Figure S1: Illustration of the total amount of P from animal manure, from 2000 to 2011, in Comoros, Figure S2: Illustration of the amount of recoverable P from animal manure, from 2000 to 2011, in Comoros, Figure S3: Quantification of the amount of recoverable P from household solid organic waste, Figure S4: Estimation of the amount of recoverable P from human excreta, from 2000 to 2011, in Comoros, Figure S5: The P fertilizer consumption per hectare on the arable land in Comoros, in 2000 and 2011, Figure S6: Estimated the phosphorus use efficiency (PUE) in plant production in Comoros, in 2000 and 2011, Figure S7: Estimation of the PUE in animal production in Comoros in 2000 and 2011, Table S1: Parameters and detailed description of P flows in food production and consumption systems in 2000. N: number Q: quantity and volume; and X:P concentration, Table S2: Data, sources, and equations for 2000, Table S3: Comparison of the characteristics of P flow between Australia, China, and Comoros, Table S4: Comparison of total P input per capita on the agricultural land, for different countries.

Author Contributions

Conceptualization, T.S.K. and S.C.; Methodology, T.S.K. and G.B; Software, T.S.K.; Validation, S.C. and T.S.K.; Formal Analysis, T.S.K.; Investigation, T.S.K.; Resources, Y.H.; Data Curation, T.S.K. and S.X; Writing—Original Draft Preparation, T.S.K.; Writing—Review & Editing, T.S.K., C.H and S.C.; Visualization, T.S.K.; Supervision, S.C.; Project Administration, S.C.; Funding Acquisition, S.C.

Funding

This research was funded by the National Key Research and Development Program of China [2017YFC0506606], the National Natural Science Foundation of China [31500391, 41801215], the Fujian Provincial Natural Science Foundation of China [2017J01660], and the Chinese Academy of Sciences’ Third World Academy of Sciences (CAS-TWAS) president’s fellowship program for developing countries.

Acknowledgments

We would like to thank the editor and the two anonymous reviewers for their valuable comments on the manuscript. We would like also to thanks all the interviewees and employees of the three agricultural and livestock breeding directorates on each island, and the INRAP and CAPC managers who agreed to conduct direct oral interviews and provide crucial information and data on the NPK.

Conflicts of Interest

The authors declared that they have no conflict of interest.

References

  1. USGS. Phosphate Rock Statistics and Information. 2010. Available online: http://minerals.usgs.gov/minerals/pubs/mcs/2009/mcsapp2009.pdf (accessed on 3 September 2018).
  2. Cordell, D.; Drangert, J.; Stuart White, S. The story of phosphorus: Global food security and food for thought. Glob. Environ. Change 2009, 19, 292–305. [Google Scholar] [CrossRef]
  3. Sattari, S.Z.; Bouwman, A.F.; Giller, K.E.; Van Ittersum, M.K. Residual soil phosphorus as the missing piece in the global phosphorus crisis puzzle. Proc. Natl. Acad. Sci. USA 2012, 109, 6348–6353. [Google Scholar] [CrossRef] [Green Version]
  4. FAO. World Fertilizer Trends and Outlook to 2020. 2015. Available online: http://www.fao.org/3/a-i6895e.pdf (accessed on 2 January 2018).
  5. Oliveira, M.; Machado, A.V. The role of phosphorus on eutrophication: A historical review and future perspectives. Environ. Technol. Rev. 2013, 2, 117–127. [Google Scholar] [CrossRef]
  6. Kitsiou, D.; Karydis, M. Coastal marine eutrophication assessment: A review on data analysis. Environ. Int. 2011, 37, 778–801. [Google Scholar] [CrossRef] [PubMed]
  7. Seitzinger, S.; Mayorga, E. Chapter 7.3: Nutrients Inputs from River Systems to Coastal Waters. In IOC-UNESCO and UNEP (2016). Large Marine Ecosystems: Status and Trends; United Nations Environment Programme: Nairobi, Kenya, 2016; pp. 179–195. [Google Scholar]
  8. Nyenje, P.M.; Foppen, J.W.; Uhlenbrook, S.; Kulabako, R.; Muwanga, A. Eutrophication and nutrient release in urban areas of sub-Saharan Africa—A review. Sci. Total Environ. 2010, 408, 447–455. [Google Scholar] [CrossRef] [PubMed]
  9. Smil, V. Phosphorus in the Environment: Natural Flows and Human Interferences. Ann. Rev. Energy Environ. 2000, 25, 53–88. [Google Scholar] [CrossRef]
  10. Steen, I. Phosphorus availability in the 21st Century: Management of the non-renewable resource. Phosphorus Potassium 1998, 217, 25–31. [Google Scholar]
  11. Cordell, D.; White, S. Life’s Bottleneck: Sustaining the World’s Phosphorus for a Food Secure Future. Annu. Rev. Environ. Resour. 2014, 39, 161–188. [Google Scholar] [CrossRef]
  12. Obersteiner, M.; Peñuelas, J.; Ciais, P.; Van der Velde, M.; Janssens, I.A. The phosphorus trilemma. Nature Geosci. 2013, 6, 897–898. [Google Scholar] [CrossRef]
  13. Van der Velde, M.; See, L.; You, L.; Balkovič, J.; Fritz, S.; Khabarov, N.; Obersteiner, M.; Wood, S. Affordable Nutrient Solutions for Improved Food Security as Evidenced by Crop Trials. PLoS ONE 2013, 8, E60075. [Google Scholar] [CrossRef] [PubMed]
  14. Vlek, P.L.G. The Role of Fertilizers in Sustaining Agriculture in Sub-Saharan Africa; International Fertilizer Development Center-Africa (IFDC-Africa), B.P. 4483: Lomb, Togo, 1990; p. 327. [Google Scholar]
  15. Druilhe, Z.; Barreiro-Hurle, J. Fertilizer Subsidies in Sub-Saharan Africa. 2012. Available online: http://www.fao.org/3/a-ap077e.pdf (accessed on 12 January 2016).
  16. World Bank. Comoros Agricultural Sector Memorandum. 1984. Available online: http://documents.worldbank.org/curated/en/559711468246336466/pdf/multi-page.pdf (accessed on 20 September 2018).
  17. Document de Stratégie de Croissance et de Réduction de la Pauvreté; Commissariat General au Plan: Moroni, Union Des Comores, 2005; Available online: https://www.comores-online.com/mwezinet/projets/images/dscrprevise101005.pdf (accessed on 10 February 2017).
  18. Document de Stratégie de Croissance et de Réduction de la Pauvreté; Commissariat General au Plan: Moroni, Union Des Comores, 2009; Available online: http://extwprlegs1.fao.org/docs/pdf/com149192.pdf (accessed on 17 January 2017).
  19. FAO. Comoros and FAO: Partnering for Sustainable Agricultural Development and Food and Nutrition Security. 2015. Available online: http://www.fao.org/3/a-ax422e.pdf (accessed on 7 November 2017).
  20. NIP. National Implementation Plan for the Stockholm Convention. Moroni: Stockholm Convention on the Persistent Organic Pollutants (POPs). 2006. Available online: https://www.google.com/url?sa=t&rct=j&q=&esrc=s&source=web&cd=1&ved=2ahUKEwixi9upi-3hAhVT-WEKHWYWCyAQFjAAegQIAhAB&url=http%3A%2F%2Fchm.pops.int%2FPortals%2F0%2Fdownload.aspx%3Fd%3DUNEP-POPS-NIP-Comoros-1.English.pdf&usg=AOvVaw2awOgX7QXltaGbsSmTxX06 (accessed on 11 January 2017).
  21. Webeck, E.; Matsubae, K.; Nakajima, K.; Nansai, K.; Nagasaka, T. Phosphorus Flows in the Asian Region. Glob. Environ. Res. 2015, 19, 9–17. [Google Scholar]
  22. Ott, C.; Rechberger, H. The European phosphorus balance. Resour. Conserv. Recycl. 2012, 60, 159–172. [Google Scholar] [CrossRef]
  23. Antikainen, R.; Lemola, R.; Nousiainen, J.I.; Sokka, L.; Esala, M.; Huhtanen, P.; Rekolainen, S. Stocks and flows of nitrogen and phosphorus in the Finish food production and consumption system. Agric. Ecosys. Environ. 2005, 107, 287–305. [Google Scholar] [CrossRef]
  24. Neset, S.T.-S.; Bader, H.-P.; Shneidegger, R.; Lohm, U. The flow of phosphorus in food production and consumption-Linköping, Sweden, 1870-2000. Sci. Total Environ. 2008, 396, 111–120. [Google Scholar] [CrossRef] [PubMed]
  25. Matsubae-Yokoyama, K.; Kubo, H.; Nakajima, K.; Nagasaka, T. A Material Flow Analysis of Phosphorus in Japan. J. Ind. Ecol. 2009, 13, 687–705. [Google Scholar] [CrossRef] [Green Version]
  26. Ghani, L.A.; Mahmood, N.Z. Balance Sheet for Phosphorus in Malaysia by SFA. Aust. J. Basic Appl. Sci. 2011, 5, 3069–3079. [Google Scholar]
  27. Cooper, J.; Carliell-Marquet, C. A substance flow analysis of phosphorus in the UK food production and consumption system. Resour. Conserve. Recycl. 2013, 74, 82–100. [Google Scholar] [CrossRef]
  28. Li, B.; Boiarkina, I.; Young, B.; Yu, W. Substance flow analysis of phosphorus within New Zealand and comparison with other countries. Sci. Total Environ. 2015, 527, 483–492. [Google Scholar] [CrossRef]
  29. Senthilkumar, K.; Nesme, T.; Mollier, A.; Pellerin, S. Conceptual design and quantification of phosphorus flows and balances at the country scale: The case of France. Glob. Biogeochem. Cycles 2012, 26, GB2008. [Google Scholar] [CrossRef]
  30. Seyhan, D. Country-scale phosphorus balancing as a base for resources conservation. Resour. Conserv. Recycl. 2009, 53, 698–709. [Google Scholar] [CrossRef]
  31. Yuan, Z.; Liu, X.; Wu, H.; Zhang, L.; Bi, J. Anthropogenic phosphorus flow analysis of Lujiang County, Anhui province, Central China. Ecol. Model. 2011, 222, 1534–1543. [Google Scholar] [CrossRef]
  32. Thitanuwat, B.; Polprasert, C.; Englande, A.J., Jr. Quantification of phosphorus flows throughout the consumption system of Bangkok Metropolis, Thailand. Sci. Total Environ. 2015, 542, 1106–1116. [Google Scholar] [CrossRef] [PubMed]
  33. Yuan, Z.; Shi, J.; Wu, H.; Zhang, L.; Bi, J. Understanding the anthropogenic phosphorus pathway with substance flow analysis at the city level. J. Environ. Manag. 2011, 92, 2021–2028. [Google Scholar] [CrossRef] [PubMed]
  34. Li, S.; Yuan, Z.; Bi, J.; Wu, H. Anthropogenic phosphorus flow analysis of Hefei City, China. Sci. Total Environ. 2010, 408, 5715–5722. [Google Scholar] [CrossRef] [PubMed]
  35. Qiao, M.; Zheng, Y.-M.; Zhu, Y.-G. Material flow analysis of phosphorus through food consumption in two megacities in northern China. Chemosphere 2011, 84, 773–778. [Google Scholar] [CrossRef] [PubMed] [Green Version]
  36. Cui, S.; Xu, S.; Huang, W.; Bai, X.; Huang, Y.; Li, G. Changing urban phosphorus metabolism: Evidence from Longyan city, China. Sci. Total Environ. 2015, 536, 924–932. [Google Scholar] [CrossRef] [PubMed]
  37. RGPH. Recensement Général de la Population et de l’Habitat des Comores. 2003. Available online: http://www.inseed.km/ (accessed on 2 February 2018).
  38. International Trade Centre. Ylang-Ylang oil—A Review of production from Comoros. 2015. Available online: http://www.intracen.org/uploadedFiles/intracenorg/Content/Exporters/Market_Data_and_Information/Market_information/Market_Insider/Essential_Oils/Monthly%20report%20August%202015.pdf (accessed on 3 November 2017).
  39. FAO. Project d’appui à la Commercialisation Produits Agricoles-Promotion des filières Prioritaires et des Activités Structurantes Innovantes. 2005. Available online: http://www.fao.org/3/a-af206f.pdf (accessed on 12 December2018).
  40. Brunner, P.H.; Rechberger, H. Practical Handbook of Material Flow Analysis. Int. J. Life Cycle Assess. 2004, 9, 337–378. [Google Scholar] [CrossRef]
  41. Banque Centrale des Comores (BCC). Rapport Annuel, 2005. 2005. Available online: http://www.banque-comores.km/DOCUMENTS/Rapport_annuel_2005.pdf (accessed on 12 January 2016).
  42. World Health Organization (WHO). Country Cooperation Strategy—Comoros. 2016. Available online: https://apps.who.int/iris/bitstream/handle/10665/137153/ccsbrief_com_en.pdf;jsessionid=05CECE3C79C38D3B5BA70C01095BE672?sequence=1) (accessed on 15 November 2018).
  43. Komakech, A.J.; Banadda, N.E.; Kinobe, J.R.; Kasisira, L.; Sundberg, S.; Gebresenbet, G.; Vinnerås, B. Characterization of municipal waste in Kampala, Uganda. J. Air Waste Manag. Assoc. 2014, 64, 340–348. [Google Scholar] [CrossRef] [PubMed] [Green Version]
  44. Motesharezadeh, B.; Etesami, H.; Bagheri-Novair, S.; Amirmokri, H. Fertilizer consumption trend in developing countries vs. developed countries. Environ. Monit. Assess. 2017, 189, 103. [Google Scholar] [CrossRef]
  45. Dahari. Rapport Annuel 2014. 2015. Available online: https://daharicomores.org/wp-content/uploads/2015/04/Dahari-rapport-annuel-2014.pdf (accessed on 15 February 2019).
  46. FAO. L’irrigation en Afrique en Chiffres-Enquête AQUASTAT. 2005. Available online: http://www.fao.org/nr/water/aquastat/countries_regions/COM/COM-CP_fra.pdf (accessed on 2 November 2017).
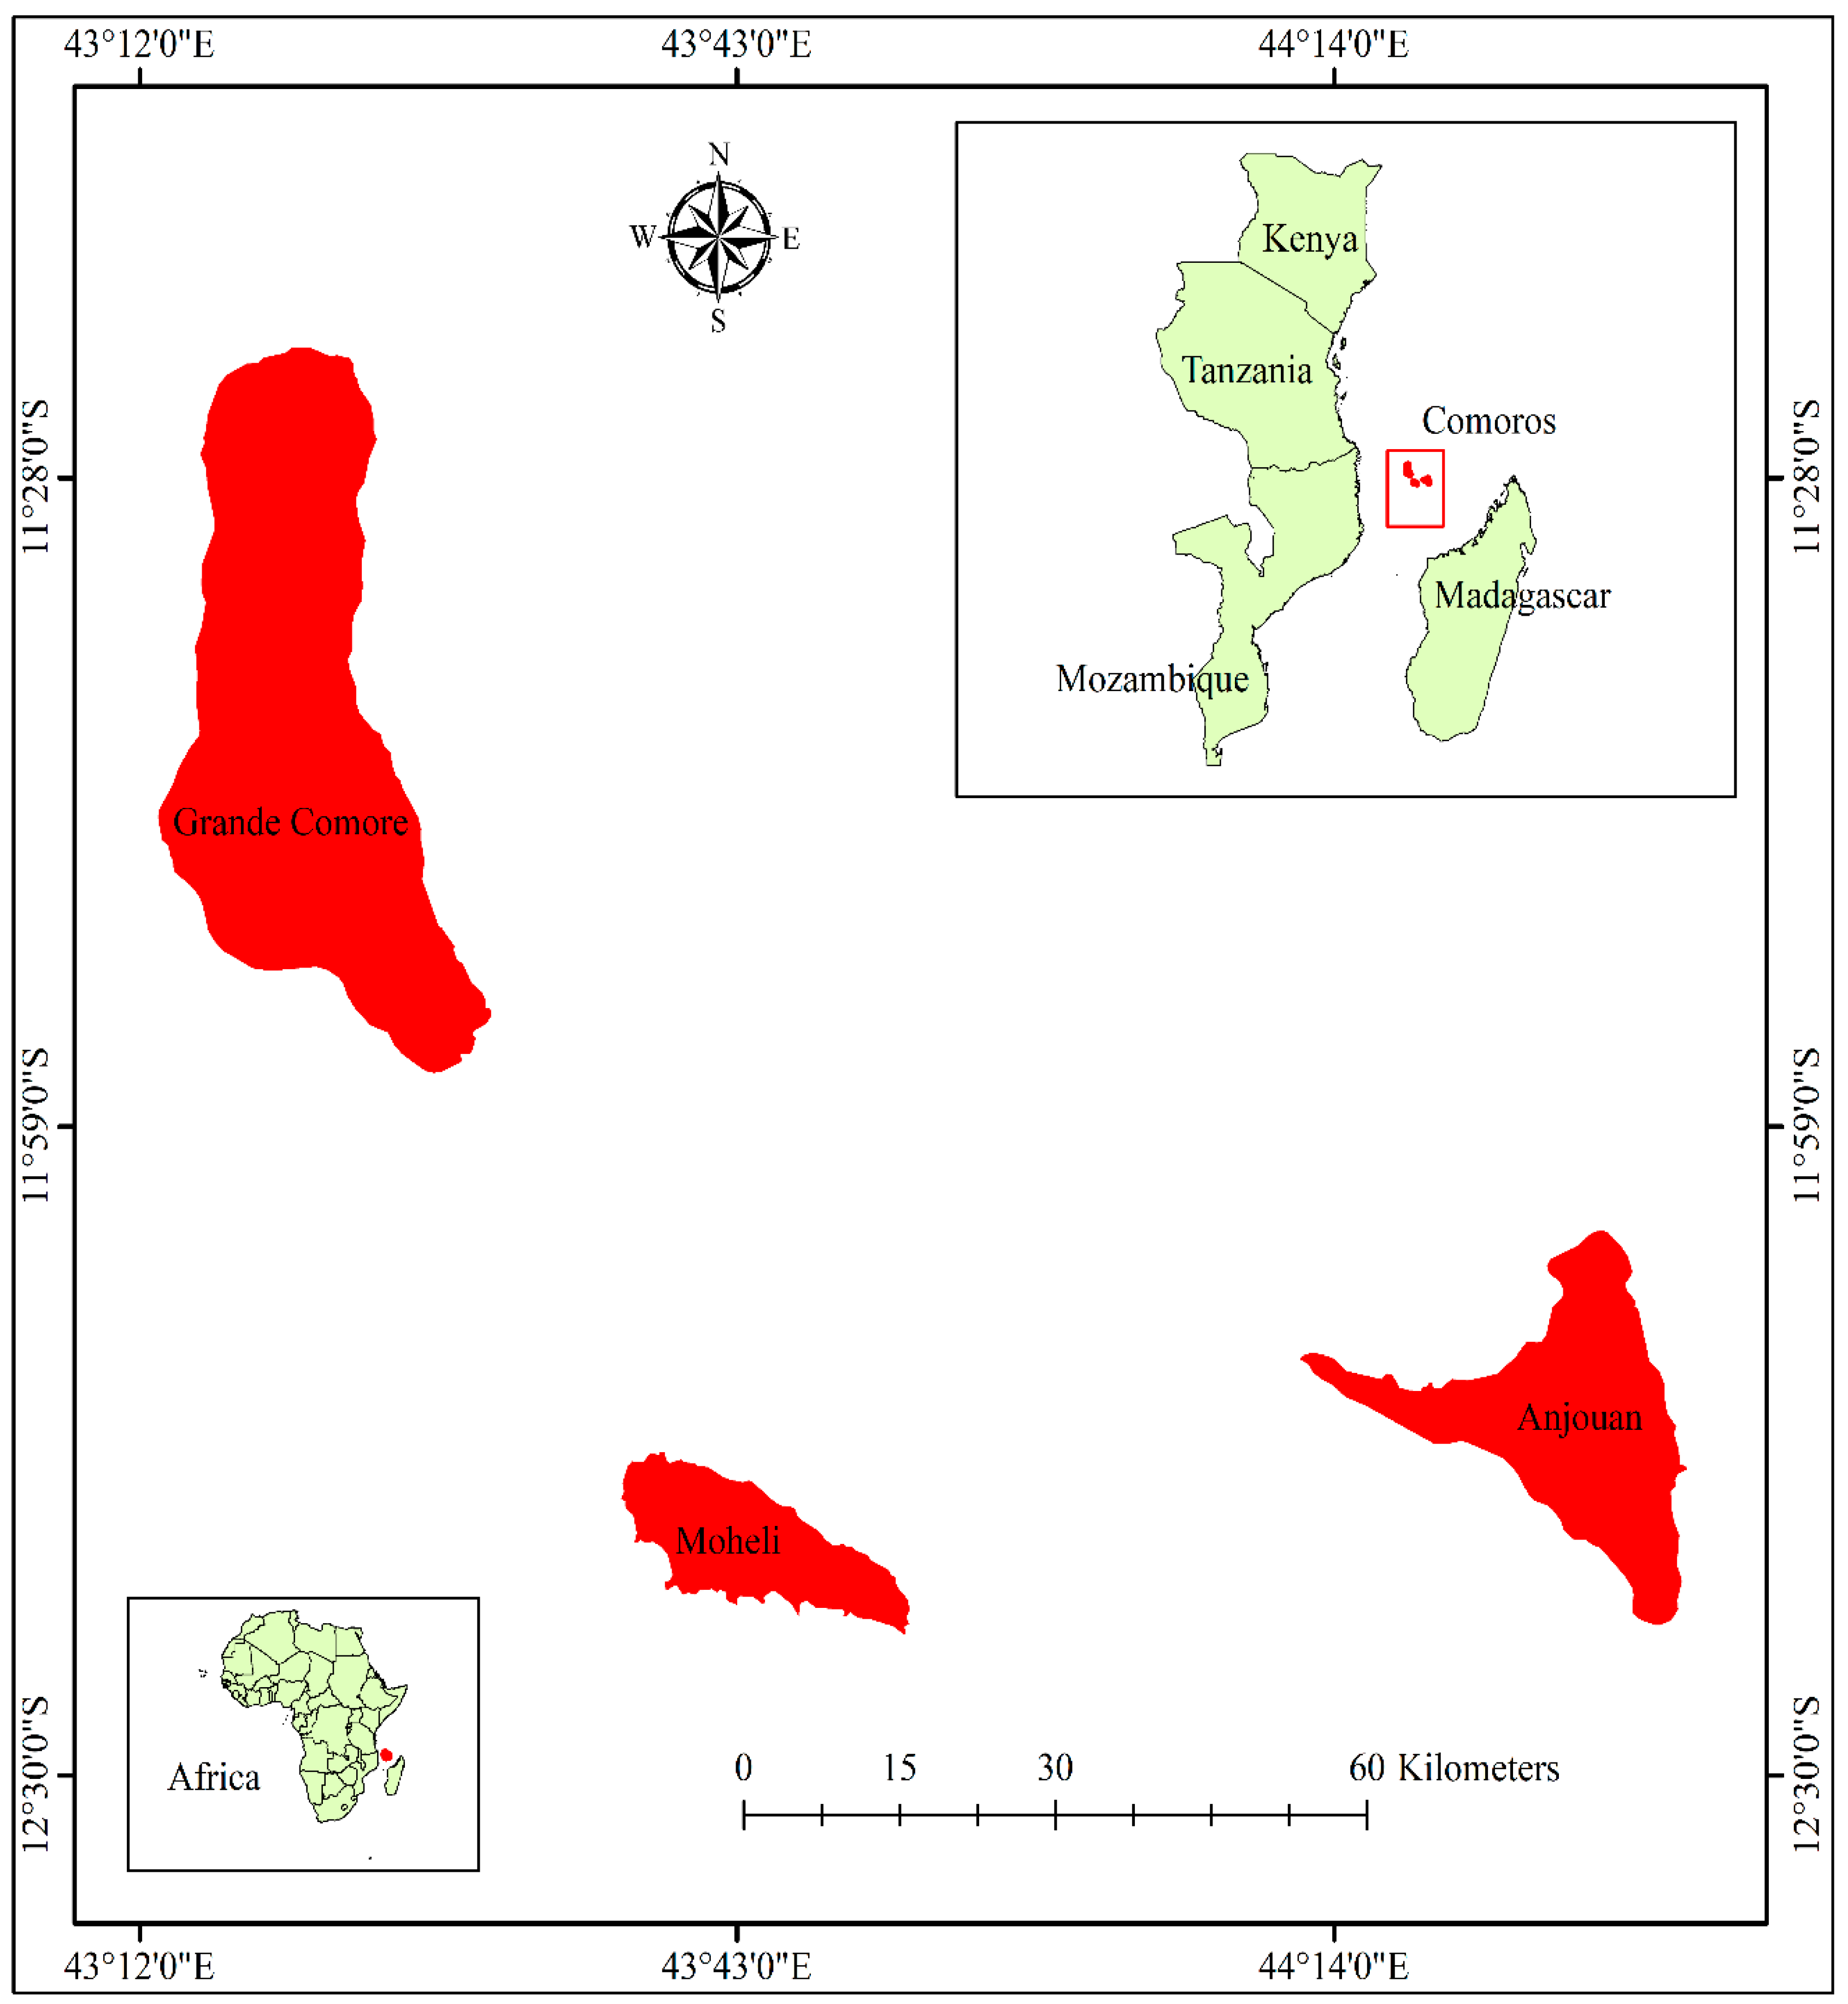
Figure 1. Map of the study are in red.
Agronomy 09 00212 g001
Figure 2. Framework for the P flow model through the food production and consumption system of Comoros. Boxes show subsystem processes. Arrows represent input and output flows. Blue arrows indicate P input flows; green arrows, recycling P flows; red arrows, P internal flows between subsystems; and orange arrows, P output flows.
Agronomy 09 00212 g002
Figure 3. P flows through the food production and consumption system of Comoros in (a) 2000 and (b) 2011 (unit: t P). Arrows are sized relative to the magnitude of the flow, with a size of four as the lower flow threshold for small streams. Orange arrows are P output flows, blue arrows, P input flows, green arrows, recycling P flows internal to the system, and red arrows, P internal flows between subsystems. The large black-outlined boxes show the physical boundary of the country.
Agronomy 09 00212 g003
Figure 4. Detailed P inputs and outputs for the overall system in (a) 2000 and (b) 2011.
Agronomy 09 00212 g004
Figure 5. Recoverable P in Comoros for the period from 2000 to 2011. The upper portion represents the volume of P recovered from animal manure, household organic waste, and human waste sources. The lower portion represents the percentages for each source.
Agronomy 09 00212 g005