Review

Using Plant Phenomics to Exploit the Gains of Genomics

1
Crop Improvement Division, ICAR-Indian Institute of Pulses Research, Kalyanpur-Kanpur 208024, India
2
World Vegetable Center South Asia/Central Asia, ICRISAT Campus, Patancheru-Hyderabad 502324, India
3
SK University of Agricultural Sciences & Technology, Main Campus, Chatha, Jammu 180009, India
4
World Vegetable Center, P.O. Box 42, Shanhua, Tainan 74199, Taiwan
5
Department of Genetics and Plant Breeding, Banda University of Agriculture and Technology, Banda 210001, India
6
Department of Botany, Panjab University, Chandigarh 160014, India
7
Department of Biotechnology, Yeungnam University, Gyeongsan, Gyeongbuk 38541, Korea
*
Authors to whom correspondence should be addressed.
Agronomy 2019, 9(3), 126; https://doi.org/10.3390/agronomy9030126
Submission received: 29 January 2019 / Revised: 27 February 2019 / Accepted: 5 March 2019 / Published: 7 March 2019

Abstract

:
Agricultural scientists face the dual challenge of breeding input-responsive, widely adoptable and climate-resilient varieties of crop plants and developing such varieties at a faster pace. Integrating the gains of genomics with modern-day phenomics will lead to increased breeding efficiency which in turn offers great promise to develop such varieties rapidly. Plant phenotyping techniques have impressively evolved during the last two decades. The low-cost, automated and semi-automated methods for data acquisition, storage and analysis are now available which allow precise quantitative analysis of plant structure and function; and genetic dissection of complex traits. Appropriate plant types can now be quickly developed that respond favorably to low input and resource-limited environments and address the challenges of subsistence agriculture. The present review focuses on the need of systematic, rapid, minimal invasive and low-cost plant phenotyping. It also discusses its evolution to modern day high throughput phenotyping (HTP), traits amenable to HTP, integration of HTP with genomics and the scope of utilizing these tools for crop improvement.

1. Introduction

The world population is expected to grow to 8.30 billion by the end of 2030 and surpass 9 billion by the end of 2050. Meeting the food, energy, and water demands of this population and of the livestock, including cattle, poultry, piggery, etc. which indirectly support it is a daunting task for the farmers, scientists and policymakers. To feed the world population, the crop yields are required to grow at an annual rate of 2.4%, while the current growth rate is lagging at 1.3%. The yields are stagnating in up to 40% of the area under cereal cultivation globally [1]. This targeted growth rate of crop yield needs to be achieved when global agriculture is already encountering climatic changes such as an increase in seasonal temperatures at all latitudes, recurring droughts, an increase in atmospheric carbon dioxide concentration and predicted changes in rainfall patterns [2]. Further, changes in the disease and insect-pest scenario and a shift in the prevalence of biotic and abiotic stresses among regions and production systems also pose a serious threat to agricultural production. Therefore, addressing these challenges requires the development of ‘climate-resilient varieties of crop plants [3,4] by connecting genotypes with phenotypes so that the fullest potential of a genotype can be realized in given environments. The application of genomics in agriculture can be made more efficient and meaningful by emphasizing upon the usage of phenotyping/phenomics in crop plants [5].
Farmers and plant breeders have been selecting the best genotypes based upon their phenotype for a very long time. However, the traditional phenotyping methods deal with either one or few specific plant characteristics at a given time and do not allow a thorough functional analysis of constituent traits linking genotype with the phenotype. Furthermore, the invasive, labor-dependent and time-intensive nature of phenotyping for many traits make measuring these traits in segregating generations difficult, thereby, delaying selection to later generation and decreasing the breeding efficiency. In plant breeding, field experiments at multiple locations are indispensable to evaluate the adaptability of new candidate genotypes and to examine the pattern of genotype × environment interaction [6]. Plant phenotyping needs to generate high-quality quantitative data on the dynamic response of a genotype to the environment to adapt to the needs of modern breeding. Increased accuracy, precision, and throughput at all levels, while reducing costs and minimizing labor through automation, remote sensing, data integration, and experimental design, is the trend in modern plant phenotyping [7].
Many next generation and high throughput plant phenotyping platforms (HTPPs) were developed [8] to measure trait values accurately and assess variation among individuals after realizing the need for rapid and precise phenotyping of multiple traits. Consequently, HTPPs enabled better approaches to address the relationship between traits, plant development, growth and reproduction under various conditions [9,10]. The strides in plant phenotyping have been so swift that high-throughput phenotyping using non-invasive technologies is now a rapidly advancing field [11,12]. This is based on various imaging techniques to record plant structure, estimate biomass, and analyze phenology, plant health, tissue water relations, transpiration, photosynthetic activity, and others. The phenotyping systems can operate in a field setting or in a controlled environment, where plants are automatically weighed and watered. Low-cost, automated and semi-automated methods for data acquisition and analysis are now being developed [13] that cost effectively provide physiological and morphological data. These HTPPs collect accurate observations using modern tools with high precision and automation and allow simultaneous analysis of the massive generated data. This leads to a better understanding of the whole phenome of the plant under a wide range of environmental and growth conditions. This review focuses on the advancements in plant phenomics including the high throughput phenotyping and its implications in increasing breeding efficiency and speeding up cultivar development in crop plants.

2. Advent of Phenomics

The word ‘phenome’ indicates the phenotype of a plant as a whole [14]. It also refers to the expression of the genome in a given environment [15]. At the same time, a phenotype encompasses a set of traits that can be observed by direct inspection or by using analytical tools and can also be described as an interaction between the genotype and the environment [16,17].
Plant phenotyping is an age-old practice as plants were selected based on physical observations since time immemorial by the farmers and later by the plant breeders. The early humans used to look out for the most attractive and nutritious fruits, seeds and tubers. This selection inadvertently helped propagation of specific species and varieties. Gradually, it became a known practice for selecting the best genotype after studying phenotypic expression in different environments. This eventually led to the inadvertent selection of the best types and establishing them in local environments and using them in hybridization programs leading to the development of further improved genotypes [18,19] for traits of human interest. However, phenotyping is far more tedious and time-consuming than genotyping owing to the variations caused by environmental interactions and other changes [5]. The genotype, the environment and their interactions (G × E) influence quantitative traits in a complex and dynamic manner [20] and therefore each phenotype responds differentially to the given environment. During the middle of the 20th century phenotyping was used by ecologists to study phenotypic plasticity. They suggested the role of the genotype and environmental conditions in the expression of plant phenotypes under which it develops [21,22]. Subsequently, developments in ecology concerning phenotyping led to trait-based approaches, in which phenotypic characteristics of a broader range of different species are evaluated, either in the field [23] or under laboratory conditions [24,25]. They were used to derive different strategies by which the ecological niche of species could be described [24] and to analyze the interdependence of various traits [26].
All recent developments in plant phenotyping are driven by the technological advancements in imaging sensors, robotics and software pipelines for analysis of images and the data. Therefore, based on the available technologies, phenotyping was classified into four groups [17]. RGB (red-blue-green) imaging or laser triangulation for measuring size, morphology, architecture or growth of plants and their canopies; thermal imaging to phenotype temperature and other indicators; spectral reflectance/fluorescence of leaves, plants or canopies for investigation of their pigments and biophysical/biochemical parameters; and studies of the root system to understand their architecture and physiology. Plant phenomics uses a set of recordings and analytical tools for quantitative measurement of several phenotypes, yielding high-dimensional phenotypic data of an organism. The data recording and observation tools may be as simple as a scale to measure plant height or pod length or as complex as a high throughput phenotyping platform (HTPP) using sensor-based data capture, computerized automation, robotics, and a high-end informatics pipeline analyzing high-resolution real-time data.

3. Phenotyping Bottlenecks

There has been impressive progress in molecular profiling and next-generation sequencing technologies in crop plants in the past two decades leading to the deciphering of a multitude of plant genomes besides development of numerous genomic resources and molecular technologies. These resources have found numerous applications in crop science such as marker-assisted breeding, association studies and genome-wide selection which may be deployed to increase the breeding efficiency in crop plants. However, phenotyping techniques did not develop at a competitive pace to connect genotypes with phenotypes. Integration of new molecular tools towards dissection of complex quantitative traits has remained a major constraint due to our limited ability to phenotype the plants accurately and efficiently. Therefore precise phenotyping under natural conditions is still a major bottleneck in most of the varietal improvement programmes [7].
The quality of phenotyping data developed through experiments depends to a great extent on the prevailing environmental conditions in which plants are grown [27]. However, regardless of the cost and precision of a phenotyping platform, the field variation may increase the error, thereby masking important genetic variation for key traits and reducing repeatability [28]. It has been observed that natural field conditions for experimentation are often highly heterogeneous and there is little or almost no control over the environment. Visual observations and manual recording of data further increase the chance of errors and therefore increase the probability of identifying false positives. Greenhouse conditions are also not ideal as they do not adequately imitate the natural field conditions [29] and offer experimental bias due to biased effects of light and temperature gradients [30]. Moisture extraction from the soil in the field is slower than in pot culture due to the limited container volume, leading to faster depletion of soil moisture in pots [31]. Even in more ‘nature-like’ conditions such as net houses or protected fields, plants are mostly grown in isolation in single pots or small plots as compared to a field, where these are cultivated in larger plots or cluster, having border plants and a ‘closed’ canopy resulting in crucial differences in plant development [30]. In any case, most of the above situations, how perfect they are, cannot be extrapolated in real field situations and most of the times these tend to remain variable in one or the other environmental parameter as compared to the field.
Irregular monitoring of environmental and soil variables, especially at remote experimental places, also aggravates the phenotypic bottleneck. Many times, a few stresses may also go unnoticed while concentrating on the major stresses which are specifically targeted for evaluation. Therefore, one of the strategies to address all the above issues can be to dramatically improve the phenotypic prediction based on the genetic composition of lines or cultivars [32]. Keeping the above in view, the focus has now shifted to a rapid and precise simulated phenotyping of traits on a large scale. As a result, non-invasive imaging technologies are now being increasingly deployed for high-throughput phenotyping.

4. High-Precision Phenotyping and Automation

Connecting genotypes to phenotypes improves breeding and contributes to increased agricultural production to satisfy the demand of a growing human population [33]. Traditional phenotyping needs human efforts and tools are labor-intensive, time-consuming and mostly invasive. Human error and high genotype × environment interaction make traditional phenotyping less efficient and sometimes erroneous. Sensor technologies and algorithmic applications for automatic phenotyping overcome the defects of manual techniques and provide a multi-trait assessment with automatic measurements and save considerable time besides offering the advantages of non-destructive measurements, precise observations, regular assessment, and direct storage.
Spectral reflectance of plant architecture has been extensively deployed for monitoring of many complex traits. Field spectrometers (and spectroradiometers) are used to measure spectral reflectance in ranges of 350–2500 nm [34]. The physiological changes of a crop canopy including constituent parameters viz., chlorophyll content and photosynthetic capacity, plant water status, carotenoid content, etc. can be measured using spectral reflectance. Likewise, grain yield has also been estimated using spectral reflectance indices [35,36].
For precisely measuring plant features, digital imaging analysis has provided the most rapid and used option in plant phenotyping till now. Digital images have several advantages such as easy recording, transmission, and storage in a database. Spectral imaging provides spectral information under disorganized outdoor conditions. Imaging technology can be best put to use to characterize traits such as plant height as plant shape is well characterized by this method [35]. Digital photos of the canopy and sides of plants are combined into a three-dimensional (3D) image in the imaging system. However, converting images into quantifiable measurements is tedious and laborious. In such a situation, specific algorithms can be deployed to gather and analyze a huge amount of data [37]. LiDAR (Light Detection and Ranging) has been successfully used to rapidly and easily measure plant size. However, the resolution of this technique is low (in the cm range), hence, measuring a single plant difficult [38]. Laser triangulation has emerged as an accurate and fast method to measure plant size and determine plant architecture [39]. Plant photosynthetic activity is characterized by chlorophyll fluorescence imaging while for plant roots and their architecture, magnetic resonance imaging (MRI) has been deployed. MRI allows the imaging of 3D root geometry mimicking the real soil-like situation. Near-Infrared Imaging (NIR) enables us to study in detail the watering status of plants [40]. The calibration problem in watering status may be addressed through recently developed sensors [41]. The temperature of the canopy of the field can be analyzed in a short period using thermal imaging and reliable data can be produced in the field [42].

5. Phenotyping for Important Traits

While traditional phenotyping mostly focused on yield and yield-related traits, advanced phenotyping options have now encouraged plant scientists to shift to phenotyping of adaptive and evolutionary traits. The digital imaging systems and sensor technologies involving high-end sensors, spectral imaging systems, robotics and automation, and high-algorithmic calculations have made it possible to evaluate a host of complex traits such as plant architecture; root growth and functions; plant growing period; physiological traits; and many other quantitative parameters. The complexity of quantitative and adaptive traits can now be well understood by evaluating related traits and their response to changing environments.

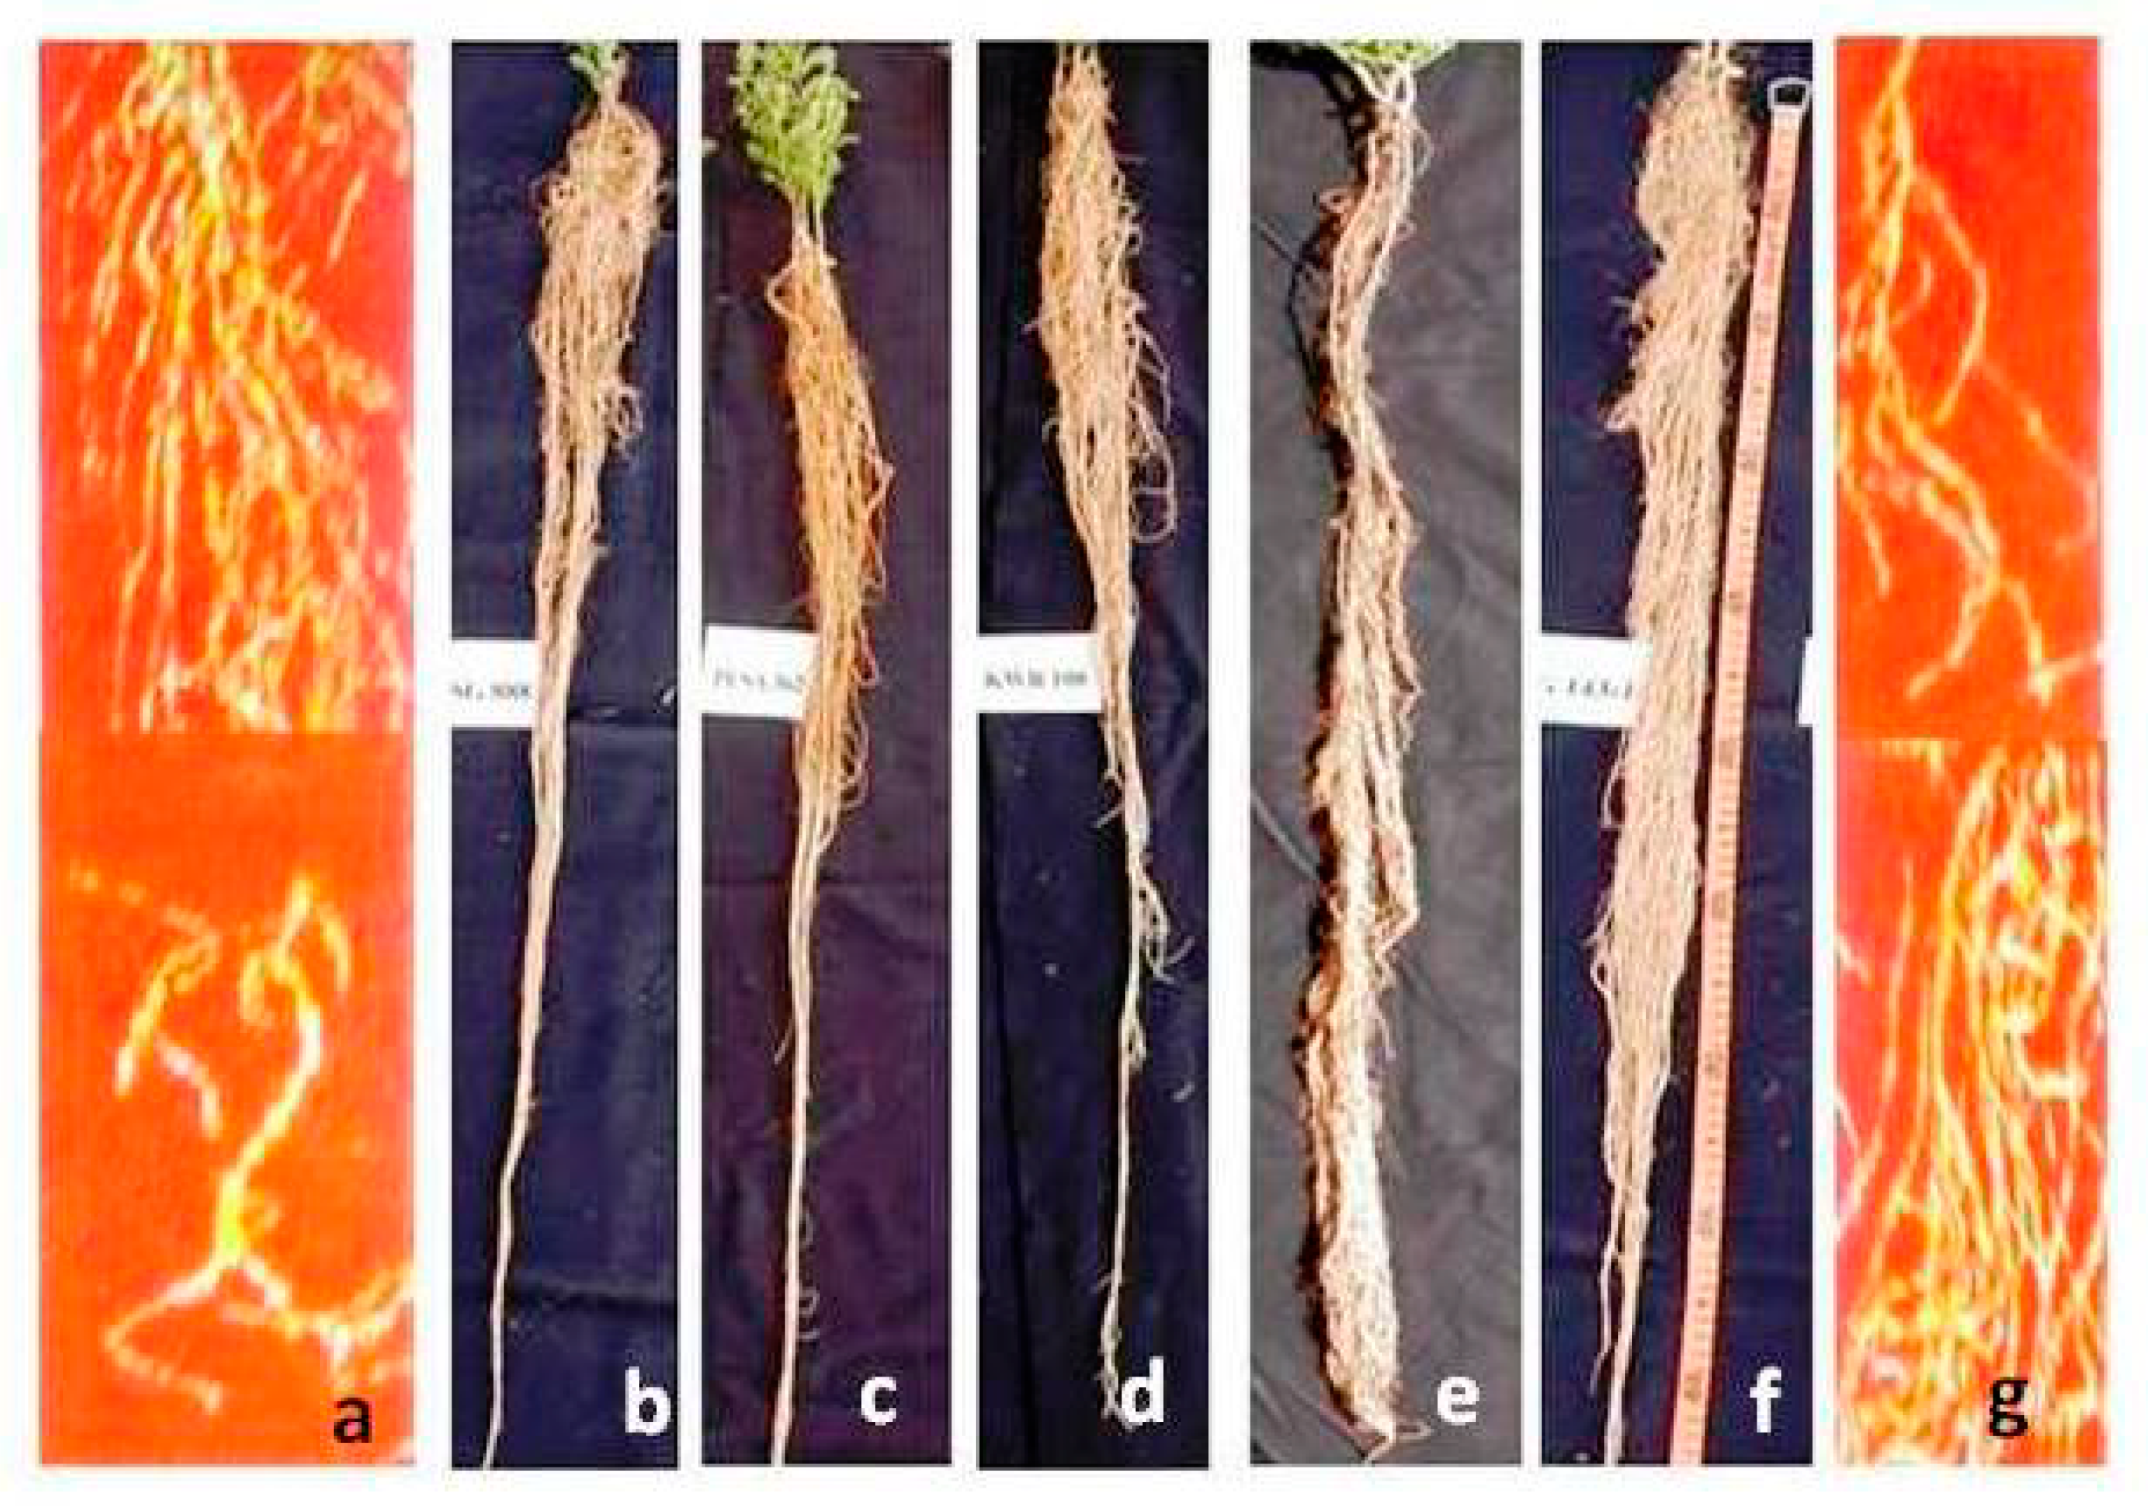
5.1. Root Growth and Functions

Root systems are one of the most complex and vital plant structures that have an important role in water and nutrient acquisition. Plant root system architecture (RSA) directly controls the plant health and survival [43]. This is complemented by the spatial configuration of different types and ages of roots emerging from a single plant [44]. Traditionally, roots were excavated, and soil cores were washed for measurement of root traits to understand root architecture. This method was destructive, making it impossible to study RSA in segregating generations. However, strengthening phenotyping capabilities has led to a definite and increased focus on RSA and its development. This also provides detailed insights into the genetic control of root growth [45]. Understanding the root phenes associated with higher yields and increased stress tolerance would furnish definite objectives for breeders to choose genotypes having better root phenotypes, which can be used as parents as well as to develop breeding lines to proceed through the process of crop improvement. Identification of root traits linked to improving the capacity of soil mining for nutrients and water would assist to increase yield under water stress environment, which has been discussed in some earlier reviews [46,47].
The roots being highly dynamic below ground parts pose extreme difficulty in obtaining information on the genetic control of RSA under variable and complex field conditions. Of late, in situ non-destructive methods involving rhizotron (Figure 1), magnetic resonance, and computed tomography have been developed to facilitate nondestructive spatial and temporal investigations into root system grown in soil [48]. Rhizotron is an underground laboratory or a facility for viewing and measuring underground parts of plants through transparent walls either placed against a continuous native soil profile or of compartments isolated from the native profile and separated from each other. These facilities allow an investigator simultaneous access to roots and shoots of plants growing in a field-like environment [49]. The gellan gum growth systems with very high optical clarity facilitate non-invasive two-dimensional (2-D) [50] and 3-D [51] imaging and temporal studies of plant root systems. Using this system, Clark et al. [52] grew plants of two rice genotypes in a glass cylinder containing transparent gellan gum, under sterile conditions. To image the plant roots, the gel-filled cylinder was submerged in a rectangular glass-walled water-filled tank to minimize refraction, and then it was imaged over as the root system (and plant) was rotated through 360°, with 2D images taken every 9° (40 images per 360° of rotation to image the plant roots). Image processing was done using the RootReader 3D software for classification of root types and quantification of 27 different root traits. Simulation and modeling studies linking rhizosphere and growth data help to link the predictive and field studies. For investigating both static and dynamic 3D RSA characteristics of plant root systems, the RSA phenotyping platform using the 3D imaging and RootReader 3D Reconstruction and Analysis Software platform is a unique imaging and analysis platform. It helps in measuring root traits with a high degree of spatial and temporal resolution and facilitates novel investigations into the development of entire root systems or the selected components of the root systems [52]. RSA has been successfully deployed for evaluating the sensitivity of a number of genotypes growing under varied stress environments, such as in the case of tomato [53] and maize [54].

5.2. Seedling Vigour

Plant health, canopy development and biomass at any given point of time during development depend upon the seed mass, time of germination and relative growth rate. Germination and seedling establishment rates are crucial for plant production and for designing experimental protocols in the lab [20]. While shoot phenotyping has received most phenotyping attention followed by root phenotyping, systematic seed phenotyping has remained neglected. Traditional phenotyping for seed-related traits mostly depended upon invasive or destructive methods. Rapid and simple analyses of seed size and other geometric features are now possible using flatbed scanners and transmitted light [55]. Automated phenotyping platforms for measuring early vigour based on RGB (Red, Green, Blue) imaging have been reported, which allow for quantitative analyses of thousands of seeds together [56]. As a result, seed mass and germination timings are now amenable to non-invasive, automated and high-throughput phenotyping. NIR spectroscopy enables large scale studies on seeds and allows the quantification of water, protein, oil, starch and other potential compounds [57]. Further, to dissect macroscopic traits, MRI and X-ray computerized tomography techniques can be employed [58]. Thus, it is evident that substantial progress has been made in automation and non-invasive phenotyping methodologies for seed and seedling vigor and considerable benefits have been accrued in crops like maize [59].

5.3. Plant Architecture

Plant height, number of branches, angle of branching and crop canopy are measurable traits that evaluate plant architecture. In most of the plant phenotyping experiments, plant height is an important trait to plant breeders, especially under natural field conditions, and is very often recognized as a substitute for biomass [60]. Plant height is also known to dictate the response of a crop to lodging [61] and water stress [62]. The traditional measurement of plant height using a ruler and measuring a predefined sample size for each microplate is low throughput, cost- and labor intensive, and is also prone to errors in the sampling. Advanced methods have now been developed either from LiDAR, also known as laser scanning [63], ultrasonic sensors also known as sonar [64], or depth camera also called time of flight camera [65], and RGB high-resolution imagery associated with structure from motion algorithms [66].
Several manned or semi-autonomous GPS (Geo-Positioning System)-navigated vehicles have also been developed very recently where vertically scanning LiDARs have been set up [66]. However, owing to low cost and high versatility, RGB image-based retrieval of crop height remains the most widely used approach [67]. The advances in sensors and improvements in computer performances along with advances in algorithms have contributed to the recent success of such techniques [68].

5.4. Leaf Area and Senescence

Leaf area measurements are vital in terms of deciphering plant growth and development since all green surfaces on plant relate to light interception and ultimately its photosynthetic activity [69]. While traditionally leaf area was studied through drawings, photographing, blueprinting and planimeter, the electronic leaf area meter is now being used increasingly. Nowadays state-of-the-art digital cameras are deployed for high-quality imaging and analysis using the appropriate software. Leaf area is also accessible to laser triangulation measurements [39]. It has been effectively used in screening for stress tolerance in few crops such as rice [70], potato [71], mungbean [72], pigeon pea [73] and faba bean [74].
During senescence, chloroplasts differentiate into pigmented plastids and leave loose chlorophyll. Leaf senescence assessment is usually made on the proportion of canopy; and green and non-green surface. Traditionally, it has been done by visual assessment. A stay-green phenotype facilitates crops to maintain green leaves for a longer duration post anthesis in comparison to senescent types, likely enhancing the yield. In modern-day phenotyping spectral reflectance and visual imaging [75], NMR [76] and Soil-Plant Analysis Development chlorophyll meter reading are being deployed for phenotyping leaf senescence.

5.5. Leaf Water Potential

Leaf water potential of xylem indicates the water status of the plants, which is traditionally measured through chamber pressure method [77]. Water potential can also be measured through spatial thermal imaging and spatial analysis identifying canopy temperature. Near-infrared spectroscopy (NIS) has also been used as a remote sensing study to predict plant water stress in grapevine [78]. Leaf water potential has also been measured effectively with simple techniques such as a ground-based camera in potato [79] where random plants were selected in plots to classify and isolate young leaves from the older ones and convert the obtained images using principal component analysis. Leaf water potential has been used as a screening trait for tolerance to drought in tomato [80], rice [70], triticale [81].

5.6. Chlorophyll Content

The chlorophyll content has been reported to have a positive relationship with seed yield [82], dry root biomass [83], tolerance to iron-deficiency chlorosis [84], nodulation and nitrogen fixation status [85]. For measuring chlorophyll content, a handheld portable SPAD chlorophyll meter is a popular device that has been used widely [86]. Of late, chlorophyll content can be quickly measured using a portable optical meter (absorbance of red light at 650 nm and infrared light at 940 nm) [36]. SPAD chlorophyll reading has been used as an effective tool for rapid assessment of relative chlorophyll status in different crops, especially under stress conditions, including peanut [87], wheat [88], sugarcane [89] and lentil [90]. Similarly, the efficiency of photosynthesis as a result of different genes and environmental conditions, especially stress environments, can be successfully measured using chlorophyll fluorescence which can be measured using hyper-spectral spectroradiometers [90]. These essentially optical methods can be readily implemented using narrow band [91] or hyperspectral imaging [92]. Chlorophyll fluorescence reflects the photosynthetic ability of the plants which declines under stress environments. Photosynthesis is highly sensitive to high temperature at the level of PS II complex and flow of electrons through the thylakoid membrane. The dark or light-adapted leaves are excited with a saturated light pulse to obtain different photosynthetic parameters like F0, Fm, Fv/Fm (quantum yield), ETR (electron transport rate) and Qp and NPQ (photochemical and no-photochemical quenching). The analog values are then converted to pixels and images to get the pictures of different fluorescence parameters and used to assess the degree of damages occurred at particular stress.
Chlorophyll fluorescence imaging helps to dissect the genetics of photosynthesis at the different levels of both plant physiology and development [93]. Therefore, it has been used as an effective screening tool for stress tolerance, as in strawberry, mungbean, cotton, peanut and chickpea (Figure 2). Due to the simplicity and effectiveness of measuring this trait, it is now being applied successfully for different environmental stresses, and an excellent review is available on this technique (Yadav et al. [94]).

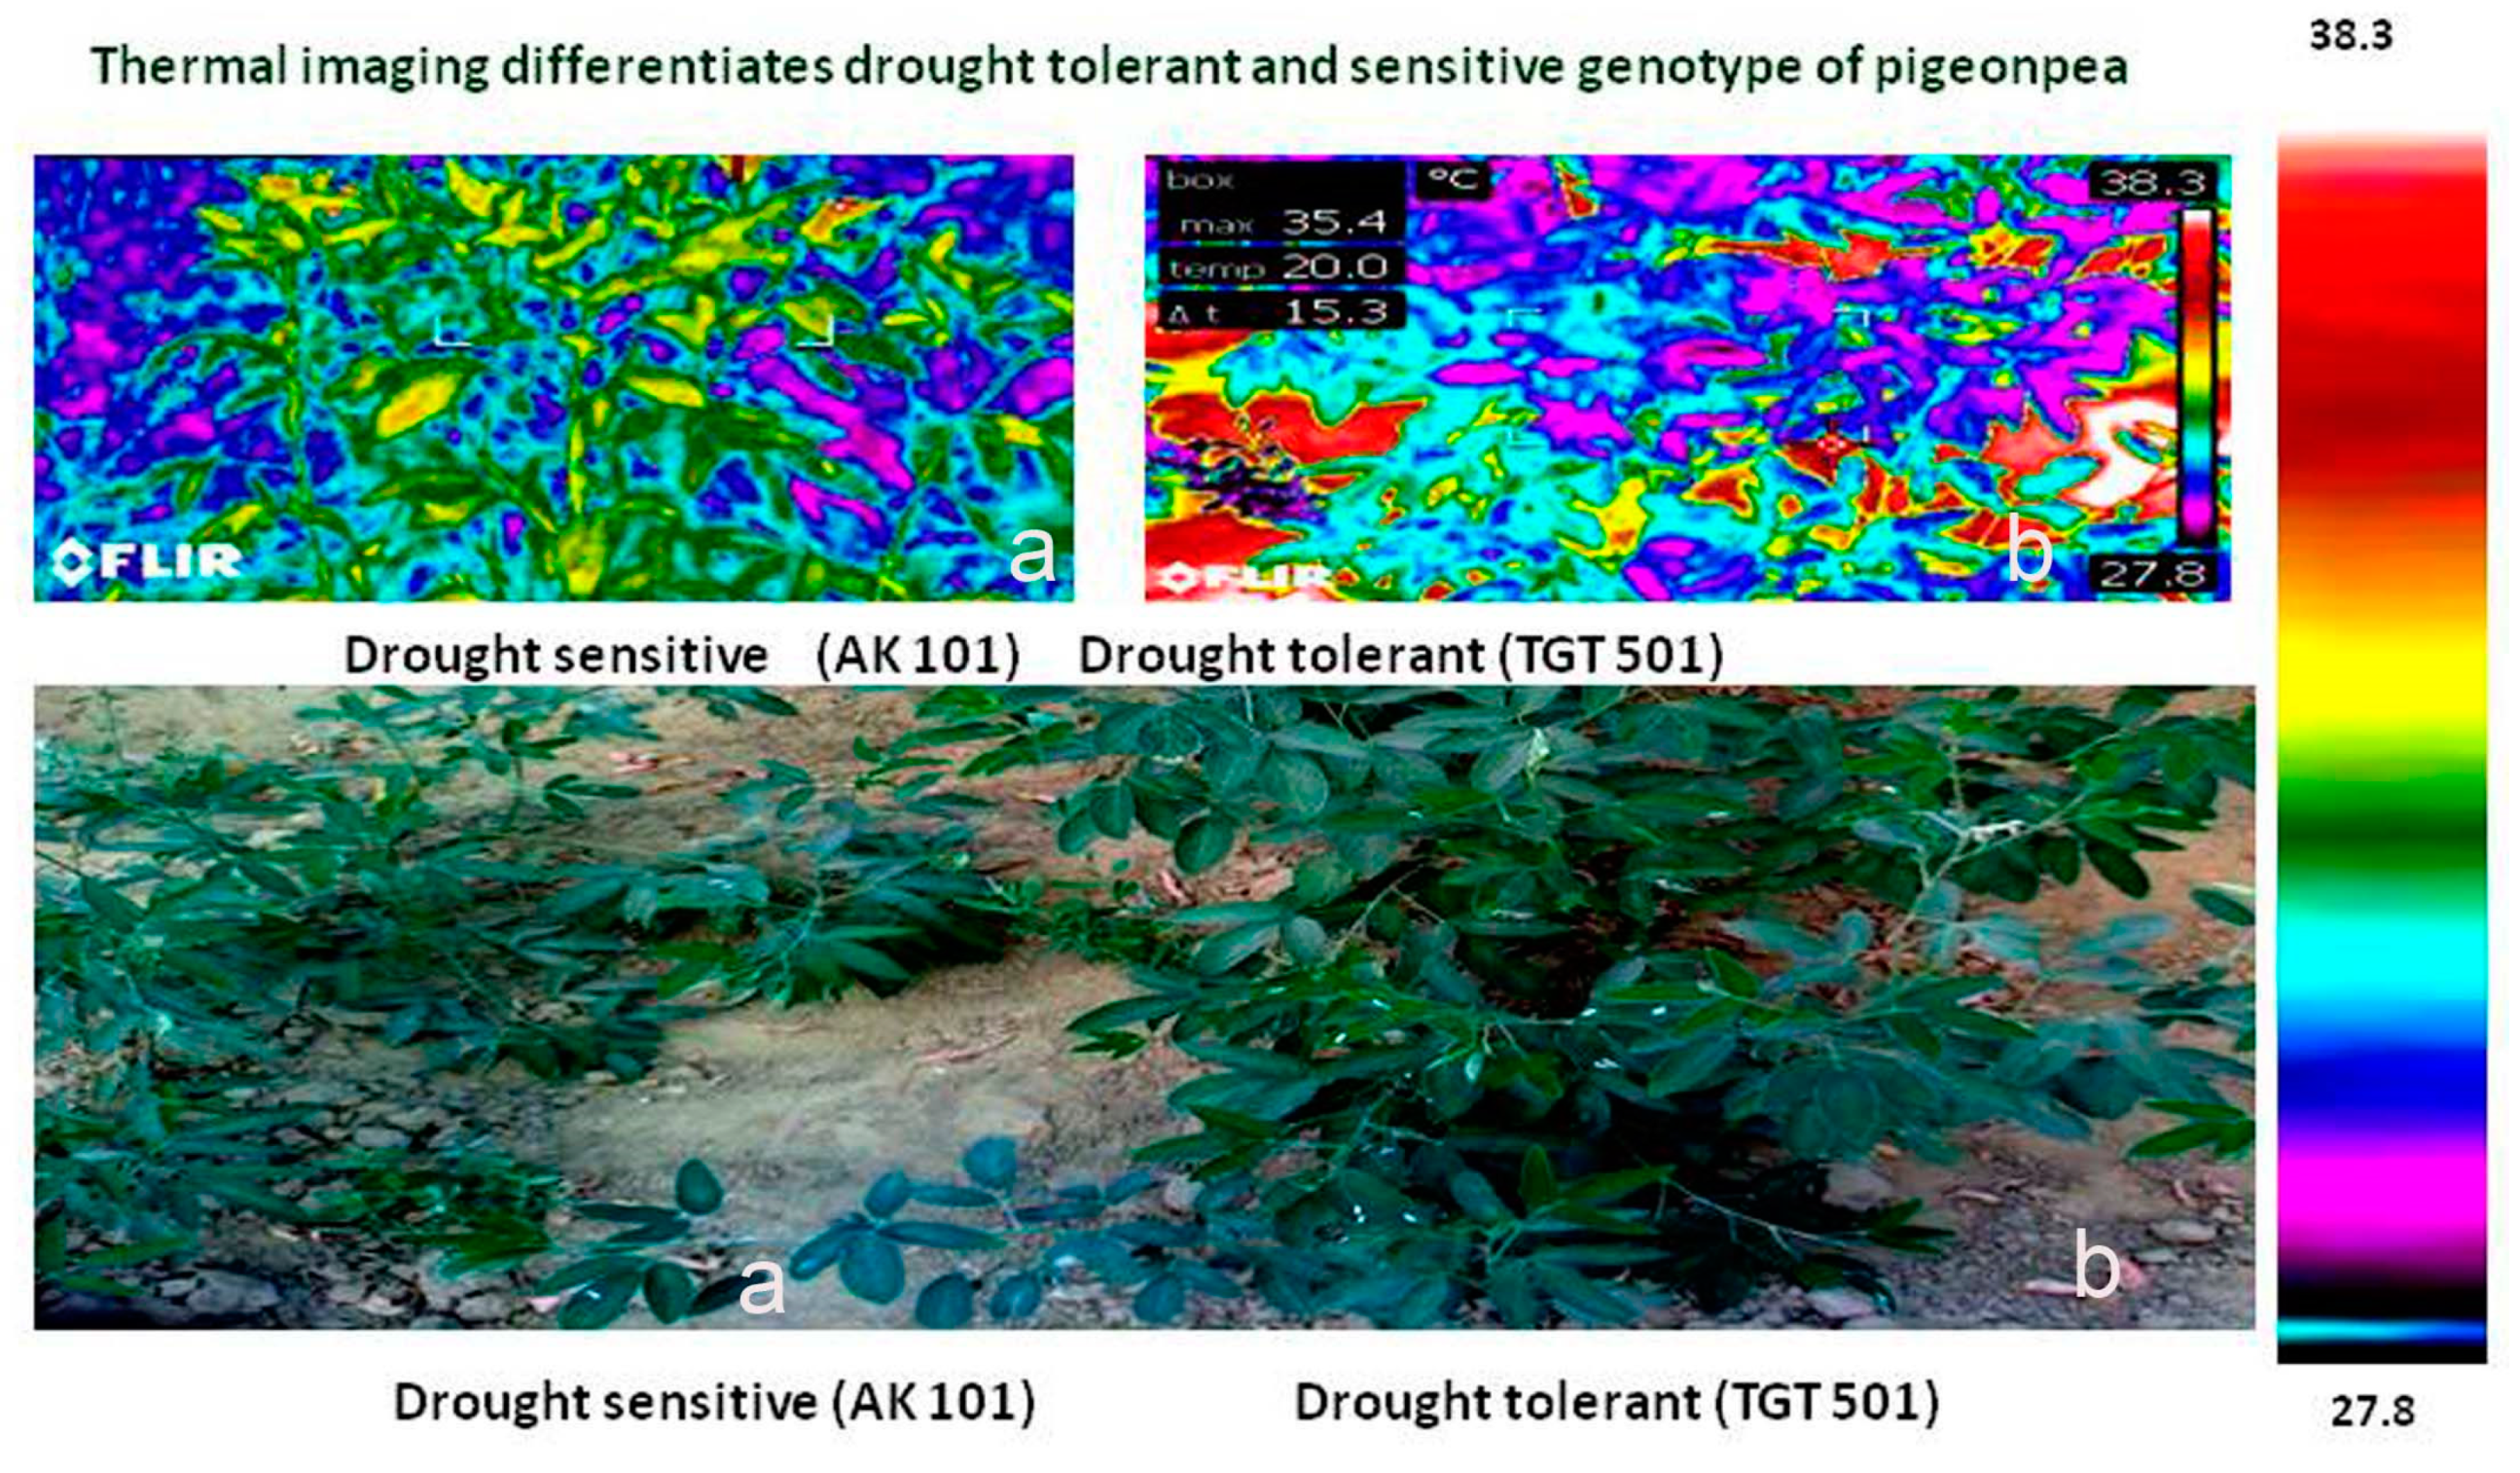
5.7. Canopy Temperature

Canopy temperature has been considered as an indicator of plant water status and affects many parameters simultaneously including stomatal conductance, photosynthesis activity, water-use efficiency, transpiration rate, leaf area index, sink strength, vascular capacity and ultimately crop yield [38]. Therefore, phenotyping of canopy temperature is now increasingly used to study different parameters of stress tolerance in crop plants [95], and to explore plant–environment interactions. Thermal infrared thermometers, as well as remote thermal imaging systems, are non-invasive techniques of measuring canopy temperature which are now being routinely used in plant phenotyping [96] (Figure 3). Thermal images are usually taken with a radiometric infrared video camera. The canopy under phenotyping is observed and at the same time its cumulative leaf water potential (LWP) is measured using pressure chamber along with its temperature which is calculated from the images. Regression models have been developed between leaf temperature and the respective leaf water potential. The LWP of any given canopy is predicted deploying the regression model directly using the temperature of the thermal images according to the empirical formulation of the crop water stress index (CWSI). Statistical analysis revealed that the relationship between CWSI and LWP was more stable and reliable [42]. Wireless infrared thermometers [97] installed in air-borne imaging systems allow screening of fields about 6000–9000 ft above the ground. This technique being non-invasive is non-destructive, does not need contact with the plants and can be efficiently employed for screening large populations under heat with or without drought stress. Canopy temperature to indicate water status and many other parameters have been successfully used in crops plants including maize [98]; cotton [99]; vineyard [100]; peach [101]; chickpea [102]; and wheat [96].

5.8. Stomatal Conductance

Stomatal conductance controls photosynthetic activity and growth of the plants and responds rapidly to soil water content [103]. It also influences the leaf and plant canopy temperature as well as water availability since the leaf temperature rises when the stomata close. Some transgenic studies on tobacco have corroborated the role of stomatal conductance in drought and heat tolerance [104]. Porometer is a small handheld device which helps in the rapid measurement of stomatal conductance in irrigated trials. Stomatal changes in field conditions, as well as canopy temperature, can also be screened by infrared tomography [103]. Stomatal conductance has been used as a reliable and useful screening technique for identifying genotypic variation in plants growing under varied stress environments, for example, wheat [105], barley [106] for salt tolerance and cotton [107] for heat tolerance. Stomatal conductance is linked to changes in leaf temperature, especially under heat and drought stress, and can also be measured using infrared imaging [108], which is relatively easy and convenient for screening a large number of genotypes for cooler leaves under stresses.

5.9. Pollen Traits

Pollen production is the most vulnerable developmental stage under heat stress and heat tolerance in tomato, pepper, and many other fruit-bearing crops is expressed in the form of their increased pollen viability. In the past, manual sampling and pollen staining or germination tests were required to measure this trait [109,110]. Recently a chip-based pollen viability measurement device was developed, allowing rapid, simple and accurate measurements [111].

5.10. Fruit Color

Fruit color is considered one of the most important traits with great commercial value in many horticultural crops. Traditionally, fruit color was phenotyped visually, which most of the times led to variable results. In a highly commercialized and agriculturally competitive world, computer-based analysis pipelines use digital images of objects to produce very precise results. Specialized software is now used to analyze fruit color and shapes. For example, ‘Tomato analyzer’ has been successfully used to scan tomato color [112]. Yoshioka and Fukino (2009) [113] used a full flatbed scanner with a black background to color phenotype melon using the color signature method.

6. Plant Phenotyping Platforms

The phenotyping platforms are located in growth chambers or greenhouses and are fully automated facilities. These are equipped with automation, precise environmental control and remote sensing facilities duly supported by sensors and robotics, to assess overall growth and development of the plant [30]. Phenotyping systems can be either sensor-to-plant [114,115] or plant-to-sensor [116] type. In the first type of platform, the plants occupy a fixed position in the plot and an imaging and phenotyping setup moves to the plants to take measurements. In the second type of platform, the plants are generally planted in pots and are moved to a platform or imaging station which then takes measurements.
Most of the phenotyping platforms have been designed to work in a set of conditions and therefore suit only to the specific type of plants and experiments. While phenotyping platforms were mostly designed to undertake measurements on individual plants, most of the agronomically important traits in crop plants are best expressed when these are grown in a population under the relevant edaphic and environmental condition and therefore field-based phenotyping platforms invoke more interest from the researchers. The initial platforms were vehicle mounted and proposed the deployment of sensors. These included a cart based platform [117] with multiple ultrasonic sensors to surround a single row of a crop, tractor or a harvester mounted reflectance sensors for collection of spectral data [118] and a machine vision system to measure internode length [119]. However, these systems had a limitation in measuring multiple traits. Later several platforms were developed which integrated sensors for leaf area index (LAI), crop canopy, height, normalized difference vegetation index (NDVI), multiple spectral imaging and hyperspectral reflectance in hand as well as motor driver carts/tractors [120,121]. Nevertheless, these phenotyping systems also had one or the other limitation such as involvement of manual labor, land clearance issues and less high throughput than required to keep pace with developments in genotyping [30].

7. High Throughput Plant Phenotyping Platforms (HTPPS)

There are mainly two categories of high throughput plant phenotyping platforms (HTPPs): Ground-based HTPPs that enable the data to be captured at plot level and aerial HTPPs which encompass a very high level of automation and state-of-art precision and can cover larger plots and even entire fields. Ground level HTPPs involve the use of carts, tractors or gantry mounted sensors, while aerial HTTPs mostly deploy small airplanes, helicopters and unmanned aerial platforms (UAPs) such as poly copters and drones. The recent alternatives to airplanes in aerial HTPPs include ‘phenotowers’ [122] and ‘blimps’ [123]. Few of such HTPPs have been deployed for phenotyping several crop plants such as Arabidopsis [114,124], cotton [121], barley [8], maize [125], wheat [126,127], rice [128], sorghum [8,129], etc. and most of these are run by large seed companies and advanced crop research institutes around the world.
Some of the popular HTPPs are LemnaTec [130], Digital Phenotyping- KeyGene [131], The international plant Phenomtyping Network [132], The Julich Plant Phenotyping Centre [133], LEPSE-Montpellier Plant Phenotyping Platform [134], PPHD-INRA, Dijon [135], Phenopsis, Arabidopsis Platform, INRA [135]; PhenoFab, Wageningen [136]; the Biotron, Canada (KeyGene + LemnaTec) [137]; The Australian Plant Phenomics Facility [138]. Table 1 describes the most popular HTPPS which are currently used for precise phenotyping of crops while Table 2 summarizes popular software packages used for advanced analysis of morphometric parameters captured using common HTPP tools.

8. Connecting Genomics to Phenomics

Genome science has now rapidly moved beyond the model organisms and advanced the detailed study in any living organism that has traits of interest. Genomes of many crop plants are now being sequenced at much faster rates at drastically reduced costs and next-generation resequencing methods. High-density single nucleotide polymorphism (SNP) genotyping is routinely applied to plants to investigate genetic variation and support trait-driven efforts to clone and understand specific genes. The phenotyping databases along with available genomic databases have made it feasible to dissect the genetic architecture of complex trait besides helping to discover new genes/QTL, identification of the function of a gene sequence and subsequently increase the genetic gain for traits having low heritability [166]. Forward and reverse phenomics can enable us to harness the potentiality of genomic resources [167].
Genomic tools made it possible to predict the function, location, nature, and interactions of genes. However, precise prediction of genes and their exact functions require validation by phenotyping using next-generation phenotyping tools. The precision of recording phenotyping data decides the precision with which the relevant QTLs or chromosomal regions are identified, and their effects are accurately estimated to establish the phenotype-genotype association [168]. The possibility to assess both genotype and phenotype at a high level of detail provides an opportunity to dissect complex, quantitative traits [93]. Precise phenotyping is of tremendous utility in crop genomics and practical breeding. Most of the quantitative characters have low to moderate heritability, which impairs the probability of detecting the presence of QTLs [169] thereby increasing Type II errors. A large-scale phenotyping of a large population over the years and several locations decrease the probability of Type II errors and increase the probability of detecting the QTLs. Likewise, genome-wide selection (GWS) without the need for QTL identification relies heavily on the molecular profiling and precise phenotyping of each progeny [170]. Simultaneous treatment of phenotypic data from multiple environments provides a significant increase in statistical power of QTL detection and accuracy of the estimates of QTL position and effect [171]. High-throughput phenomics platforms have been used for genetic dissection leading to the discovery of genes/QTLs for several traits in crops like rice, wheat, barley and mustard [172]. These techniques are being applied to screen sequenced mutation populations to identify mutants with modified root system architecture [173].
Genomics and phenomis together have a potential to revolutionize the way new varieties are bred in crop plants. Integration of these two branches of science has already been initiated and is leaping forward due to large scale data generation by HTP and next-generation sequencing tools. Quantitative trait locus (QTL) mapping is a widely used tool to unravel several quantitative traits in crop plants. For example, popular QTL mapping populations such as random inbred lines (RILs) and near isogenic lines (NILs) have been widely used to unravel genetic variation and information on genes that contribute to variation in photosynthetic efficiency for a wide variety of species [174,175]. While new techniques to identify and exploit the genetic diversity within wild wheat relatives have enabled plant breeders to tackle the challenges of additional food production, advances in phenomics have unlocked rapid screening of populations for many traits of interest [176]. There are pieces of evidence that genomics and marker assisted selection incorporated into breeding programs, have led to near two-fold genetic gain as compared to standard phenotypic selection [177]. Even in so called ‘orphan crops’ likes food legumes, advancements have been made towards deployment of molecular markers and phenotyping techniques for introgression of disease resistance genes in chickpea [178,179]. Due to a drastic reduction in cost and efficiency of obtaining genomic information on large numbers of individuals as compared to collecting the phenotyping data over years and environment, the breeding community has developed genomic selection for predicting phenotypes [180,181]. Phenomics will certainly contribute to genetic improvement through genomic selection [29]. Breeders are now adopting genomic selection strategy, particularly for complex traits to accomplish their goals [182]. Precise phenotyping data of a trait in a training population allows geneticists/breeders to dissect the complex traits into genotype, phenotype and the environment contributions.

9. Summary and Conclusions

Precise plant phenotyping using next-generation HTPPs has significantly improved our understanding of plant growth and development, the response of genotypes towards changing environments, designing newer plant types and ultimately leading to the development of better plants addressing the constraints of phenotyping bottleneck.
The vast amount of genomic resources developed in a plant species can now be linked with its phenotypes using the modern HTP approaches available through automated phenotyping platforms. Several public and private funded phenomics projects are currently underway and evidently, a large amount of money is invested in such projects which need to be amply justified by the development of large scale high-quality phenotypic data. Success of such phenomics projects will depend upon several factors including the species; population and traits used for phenotyping; the degree of genetic diversity; the phenotypic assays performed and methods of collection; storage and interpretation of data; and the extent to which the generated data is available in the public domain and preserved for future use. Likewise, the involvement of a multi-disciplinary team comprising biologists, engineers, and statisticians will increase our competitiveness in generating the best possible quality data and utilizing it in multifarious ways. Analysis of a large amount of data requires user-friendly supporting platforms [164]. The establishment of International Phenotyping Network in setting up standards, indexing, and searchable features would pave the way for efficient management of the stored data. Simulation studies can play an important role in understanding the dynamic response of plants to changing environments as these have the potential for optimizing sensor acquisition and evaluation of the robustness of algorithms prior to field measurements. The idea of virtual phenotyping has already been deployed in clinical therapy [183], in which the genetic information is transformed into the most likely associated phenotype and also finds great promise in crop plants. In plants also, the option of integrated simulation environments–such as Robotics Operating System (ROS 2013)–have been applied for simulating the data acquisition for different sensors in a field-like situation [184].
Plant phenotyping also encounters certain limitations or disadvantages such as high data generation and processing costs, complex handling algorithms limiting practical application and lack of efficient analysis pipelines. Unlike genotyping, many traits in plant phenotyping are inter-related and therefore are dependent on each other. For example, canopy temperature is related to plant water status and water use efficiency, stomatal conductance, transpiration rate, leaf area index, and others. However, this trait itself is dependent on the developmental phase of the plant or crop, time of the day and the season and therefore its measurement also affects the interpretation of the related traits. The collection, storage, and retrieval of vast amounts of phenotyping data isstill a challenge irrespective of the method applied for phenotyping. Integration of data from different users and different phenotyping platforms poses an additional challenge to utilize such data generated and therefore needs attention.
Since phenomics uses several types of sensors simultaneously, systematic data acquisition is crucial from the beginning of experiments to develop efficient input data for interpretation of crop properties. Keeping in view the importance of seed in early plant establishment, plant stand and biomass, analysis of seed-related traits and root system architecture are likely to gain more impetus, especially in high-resolution phenotyping. Although phenotyping has mostly been applied to cereals and other major field crops, food legumes, forage and turf species offer a vast potential to determine their response to dynamic environments and therefore non-invasive phenotyping methodologies hold great promise in these species. Next-generation phenotyping is an emerging discipline and if properly integrated with genomics will be crucial in quantifying plant growth and development in real time as well as metabolic pathways governing these processes. Virtual phenotyping is now emerging as an important tool to reduce the complexity of sensor-based high throughput phenotyping. Extrapolation of the experimental setup before establishing field trials will further improve our efficiency in designing climate-resilient genotypes.

Author Contributions

A.P. and S.G. conceived and designed the manuscript. All authors contributed equally in writing the manuscript. K.-H.B. edited the manuscript and modified the language of the manuscript as a final version. All authors read and approved the final version of the manuscript.

Funding

The financial support was provided by ACIAR, Australia (Grant no. CIM2014/079) and the Indian Council of Agricultural Research (through various project grants). Further, this work was also financially supported by Korea Institute of Planning and Evaluation for Technology in Food, Agriculture, Forestry and Fisheries (IPET) through Agri-Bio industry Technology Development Program and financially supported by Ministry of Agriculture, Food and Rural Affairs (MAFRA) (117044-3).

Acknowledgments

The authors are grateful to all the researchers whose contributions have been cited in this paper, which have helped us to prepare this review study. Further, we apologize to those authors whose excellent work could not be cited due to space limitations.

Conflicts of Interest

The authors declare no conflict of interest. The authors declare that the article was prepared in the absence of any commercial or financial relationships that could be construed as a potential conflict of interest.

References

  1. Ray, D.K.; Mueller, N.D.; West, P.C.; Foley, J.A. Yield trends are insufficient to double global crop production by 2050. PLoS ONE 2013, 8, e66428. [Google Scholar] [CrossRef] [PubMed]
  2. Sticklen, M.B. Feedstock crop genetic engineering for alcohol fuels. Crop Sci. 2007, 47, 2238–2248. [Google Scholar] [CrossRef]
  3. Ziska, L.H.; Bunce, J.A. Predicting the impact of changing CO2 on crop yields: Some thoughts on food. New Phytol. 2007, 175, 607–618. [Google Scholar] [CrossRef] [PubMed]
  4. Leakey, A.D.B.; Ainsworth, E.A.; Bernacchi, C.J.; Rogers, A.; Long, S.P.; Ort, D.R. Elevated CO2 effects on plant carbon, nitrogen, and water relations: Six important lessons from FACE. J. Exp. Bot. 2009, 60, 2859–2876. [Google Scholar] [CrossRef] [PubMed]
  5. Pieruschka, R.; Poorter, H. Phenotyping plants: Genes, phenes and machines. Funct. Plant Biol. 2012, 39, 813–820. [Google Scholar] [CrossRef]
  6. Chapman, C.S.; Merz, T.; Chan, A.; Jackway, P.; Hrabar, S.; Dreccer, F.M.; Holland, E.; Zheng, B.; Ling, J.T.; Jimenez-Berni, J. Pheno-Copter: A low-altitude, autonomous remote-sensing robotic helicopter for high-throughput field-based phenotyping. Agronomy 2014, 4, 279–301. [Google Scholar] [CrossRef]
  7. Cobb, J.N.; Declerck, G.; Greenberg, A.; Clark, R.; McCouch, S. Next-generation phenotyping: Requirements and strategies for enhancing our understanding of genotype-phenotype relationships and its relevance to crop improvement. Theor. Appl. Genet. 2013, 126, 867–887. [Google Scholar] [CrossRef] [PubMed]
  8. Hartmann, A.; Czauderna, T.; Hoffmann, R.; Stein, N.; Schreiber, F. HTPheno: An image analysis pipeline for high-throughput plant phenotyping. BMC Bioinformatics 2011, 12, 148. [Google Scholar] [CrossRef] [PubMed]
  9. Yang, W.; Duan, L.; Chen, G.; Xiong, L.; Liu, Q. Plant phenomics and high-throughput phenotyping: Accelerating rice functional genomics using multidisciplinary technologies. Curr. Opin. Plant Biol. 2013, 16, 180–187. [Google Scholar] [CrossRef] [PubMed]
  10. Brown, T.B.; Cheng, R.; Sirault, X.R.R.; Rungrat, T.; Murray, K.D.; Trtilek, M.; Furbank, R.T.; Badger, M.; Pogson, B.J.; Borevitz, J.O. TraitCapture: Genomic and environment modelling of plant phenomic data. Curr. Opin. Plant Biol. 2014, 18, 73–79. [Google Scholar] [CrossRef] [PubMed]
  11. Furbank, R.; von Caemmerer, S.; Sheehy, J.; Edwards, G. C4 rice: A challenge for plant phenomics. Funct. Plant Biol. 2009, 36, 845–856. [Google Scholar] [CrossRef]
  12. Berger, B.; Parent, B.; Tester, M. High-throughput shoot imaging to study drought responses. J. Exp. Bot. 2010, 61, 3519–3528. [Google Scholar] [CrossRef] [PubMed] [Green Version]
  13. Gehan, M.A.; Kellogg, E.A. High-throughput phenotyping. Am. J. Bot. 2017, 104, 505–508. [Google Scholar] [CrossRef] [PubMed] [Green Version]
  14. Soule, M. Phenetics of natural populations I. Phenetic relationships of insular populations of the side-blotched lizard. Evolution 1967, 21, 584–591. [Google Scholar]
  15. Kumar, J.; Pratap, A.; Kumar, S. Plant phenomics: An overview. In Phenomics in Crop Plants: Trends, Options and Limitations; Kumar, J., Pratap, A., Kumar, S., Eds.; Springer: New Delhi, India, 2015; pp. 1–10. ISBN 978-81-322-2226-2. [Google Scholar]
  16. Johannsen, W. The genotype conception of heredity. Int. J. Epidemiol. 2014, 43, 989–1000. [Google Scholar] [CrossRef] [PubMed] [Green Version]
  17. Walter, A.; Liebisch, F.; Hund, A. Plant phenotyping: From bean weighing to image analysis. Plant Methods 2015, 11, 14. [Google Scholar] [CrossRef] [PubMed]
  18. Fisher, R.A. Statistical methods for research workers. In Breakthroughs in Statistics: Methodology and Distribution; Kotz, S., Johnson, N.L., Eds.; Springer: New York, NY, USA, 1992; pp. 66–70. ISBN 978-1-4612-4380-9. [Google Scholar]
  19. Pearson, C.H.; Ernst, S.M.; Barbarick, K.A.; Hatfield, J.L.; Peterson, G.A.; Buxton, D.R. Agronomy journal turns one hundred 1 manuscript tracker is an online, wed-based system for electronically submitting and reviewing manuscripts. Manuscript tracker is used by authors, reviewers, and editors. 2 HighWire Press (http://highwire.stanford.edu). Agron. J. 2008, 100, 1–8. [Google Scholar] [CrossRef]
  20. Fiorani, F.; Schurr, U. Future scenarios for plant phenotyping. Annu. Rev. Plant Biol. 2013, 64, 267–291. [Google Scholar] [CrossRef] [PubMed]
  21. Swanson, C.P. Experimental studies on the nature of species III. Environmental responses of climatic races of Achillea. Jens Clausen, David D. Keck, William M. Hiesey. Q. Rev. Biol. 1949, 24, 144. [Google Scholar] [CrossRef]
  22. Griffiths, A.J.; Miller, J.H.; Suzuki, D.T.; Lewontin, R.C.; Gelbart, W.M. An Introduction to Genetic Analysis, 7th ed.; W. H. Freeman: Oxford, UK, 2000; ISBN 10: 0-7167-3520-2. [Google Scholar]
  23. Reich, P.B.; Walters, M.B.; Ellsworth, D.S. Leaf life-span in relation to leaf, plant, and stand characteristics among diverse ecosystems. Ecol. Monogr. 1992, 62, 365–392. [Google Scholar] [CrossRef]
  24. Grime, J.P.; Hunt, R. Relative growth-rate: Its range and adaptive significance in a local flora. J. Ecol. 1975, 63, 393–422. [Google Scholar] [CrossRef]
  25. Poorter, H.; Remkes, C.; Lambers, H. Carbon and nitrogen economy of 24 wild species differing in relative growth rate. Plant Physiol. 1990, 94, 621–627. [Google Scholar] [CrossRef] [PubMed]
  26. Wright, I.J.; Reich, P.B.; Westoby, M.; Ackerly, D.D.; Baruch, Z.; Bongers, F.; Cavender-Bares, J.; Chapin, T.; Cornelissen, J.H.C.; Diemer, M.; et al. The worldwide leaf economics spectrum. Nature 2004, 428, 821. [Google Scholar] [CrossRef] [PubMed]
  27. Basu, P.S.; Srivastava, M.; Singh, P.; Porwal, P.; Kant, R.; Singh, J. High-precision phenotyping under controlled versus natural environments. In Phenomics in Crop Plants: Trends, Options and Limitations; Kumar, J., Pratap, A., Kumar, S., Eds.; Springer: New Delhi, India, 2015; pp. 27–40. ISBN 978-81-322-2226-2. [Google Scholar]
  28. Masuka, B.; Araus, J.L.; Das, B.; Sonder, K.; Cairns, J.E. Phenotyping for abiotic stress tolerance in maizeF. J. Integr. Plant Biol. 2012, 54, 238–249. [Google Scholar] [CrossRef] [PubMed]
  29. Araus, J.L.; Cairns, J.E. Field high-throughput phenotyping: The new crop breeding frontier. Trends Plant Sci. 2014, 19, 52–61. [Google Scholar] [CrossRef] [PubMed]
  30. Pratap, A.; Tomar, R.; Kumar, J.; Pandey, V.R.; Mehandi, S.; Katiyar, P.K. High-throughput plant phenotyping platforms. In Phenomics in Crop Plants: Trends, Options and Limitations; Kumar, J., Pratap, A., Kumar, S., Eds.; Springer: New Delhi, India, 2015; pp. 285–296. ISBN 978-81-322-2226-2. [Google Scholar]
  31. Poorter, H.; Bühler, J.; van Dusschoten, D.; Climent, J.; Postma, J.A. Pot size matters: A meta-analysis of the effects of rooting volume on plant growth. Funct. Plant Biol. 2012, 39, 839–850. [Google Scholar] [CrossRef]
  32. White, J.W.; Andrade-Sanchez, P.; Gore, M.A.; Bronson, K.F.; Coffelt, T.A.; Conley, M.M.; Feldmann, K.A.; French, A.N.; Heun, J.T.; Hunsaker, D.J.; et al. Field-based phenomics for plant genetics research. F. Crop. Res. 2012, 133, 101–112. [Google Scholar] [CrossRef]
  33. Rahaman, M.M.; Chen, D.; Gillani, Z.; Klukas, C.; Chen, M. Advanced phenotyping and phenotype data analysis for the study of plant growth and development. Front. Plant Sci. 2015, 6, 619. [Google Scholar] [CrossRef] [PubMed]
  34. Nasarudin, N.E.M.; Helmi, S. Development and utilization of urban spectral library for remote sensing of urban environment. J. Urban Environ. Eng. 2011, 5, 44–56. [Google Scholar] [CrossRef] [Green Version]
  35. Fender, F.; Hanneken, M.; Der Stroth, S.I.; Linz, A.; Ruckelshausen, A. Sensor fusion meets gps: Individual plant detection. In Proceedings of the CIGR EurAgEng/VDI-MEG, Bonn, Germany, 3–7 September 2006; pp. 279–280. [Google Scholar]
  36. Pask, A.; Pietragalla, J.; Mullan, D.; Reynolds, M. Physiological Breeding II: A Field Guide to Wheat Phenotyping, 1st ed.; CIMMYT Mexico: Texcoco, Mexico, 2012; ISBN 978-970-648-182-5. [Google Scholar]
  37. Tsaftaris, S.; Noutsos, C. Plant phenotyping with low cost digital cameras and image analytics. In Information Technologies in Environmental Engineering; Springer: Berlin/Heidelberg, Germany, 2009; pp. 238–251. [Google Scholar]
  38. Lin, Y. LiDAR: An important tool for next-generation phenotyping technology of high potential for plant phenomics? Comput. Electron. Agric. 2015, 119, 61–73. [Google Scholar] [CrossRef]
  39. Kjaer, K.H.; Ottosen, C.-O. 3D Laser triangulation for plant phenotyping in challenging environments. Sensors 2015, 15, 13533–13547. [Google Scholar] [CrossRef] [PubMed]
  40. Dornbusch, T.; Hawkesford, M.; Jansen, M.; Nagel, K.; Niehaus, B.; Paulus, S.; Radermacher, M.; Sabermanseh, K.; Sadeghi-Tehran, P.; Schardt, C.; et al. Digital Field Phenotyping by LemnaTec. 2015; Unpublished work. [Google Scholar] [CrossRef]
  41. Engineers Make Wearable Sensors for Plants, Enabling Measurement of Water Use in Crops. Available online: https://shar.es/1N2bDU (accessed on 5 March 2019).
  42. Cohen, Y.; Alchanatis, V.; Meron, M.; Saranga, Y.; Tsipris, J. Estimation of leaf water potential by thermal imagery and spatial analysis*. J. Exp. Bot. 2005, 56, 1843–1852. [Google Scholar] [CrossRef] [PubMed] [Green Version]
  43. Sozzani, R.; Iyer-Pascuzzi, A. Postembryonic control of root meristem growth and development. Curr. Opin. Plant Biol. 2014, 17, 7–12. [Google Scholar] [CrossRef] [PubMed]
  44. Lynch, J. Root Architecture and Plant Productivity. Plant Physiol. 1995, 109, 7–13. [Google Scholar] [CrossRef] [PubMed] [Green Version]
  45. Armengaud, P.; Zambaux, K.; Hills, A.; Sulpice, R.; Pattison, R.J.; Blatt, M.R.; Amtmann, A. EZ-Rhizo: Integrated software for the fast and accurate measurement of root system architecture. Plant J. 2009, 57, 945–956. [Google Scholar] [CrossRef] [PubMed]
  46. Lynch, J.P.; Chimungu, J.G.; Brown, K.M. Root anatomical phenes associated with water acquisition from drying soil: Targets for crop improvement. J. Exp. Bot. 2014, 65, 6155–6166. [Google Scholar] [CrossRef] [PubMed]
  47. Comas, L.H.; Becker, S.R.; Cruz, V.M.V.; Byrne, P.F.; Dierig, D.A. Root traits contributing to plant productivity under drought. Front. Plant Sci. 2013, 4, 442. [Google Scholar] [CrossRef] [PubMed]
  48. Tracy, S.R.; Black, C.R.; Roberts, J.A.; Mooney, S.J. Soil compaction: A review of past and present techniques for investigating effects on root growth. J. Sci. Food Agric. 2011, 91, 1528–1537. [Google Scholar] [CrossRef] [PubMed]
  49. Klepper, B.; Kaspar, T. Rhizotrons: Their Development and Use in Agricultural Research. Agron. J. 1994, 86, 745–753. [Google Scholar] [CrossRef]
  50. Iyer-Pascuzzi, A.; Simpson, J.; Herrera-Estrella, L.; Benfey, P.N. Functional genomics of root growth and development in Arabidopsis. Curr. Opin. Plant Biol. 2009, 12, 165–171. [Google Scholar] [CrossRef] [PubMed] [Green Version]
  51. Fang, S.; Yan, X.; Liao, H. 3D reconstruction and dynamic modeling of root architecture in situ and its application to crop phosphorus research. Plant J. 2009, 60, 1096–1108. [Google Scholar] [CrossRef] [PubMed] [Green Version]
  52. Clark, R.T.; MacCurdy, R.B.; Jung, J.K.; Shaff, J.E.; McCouch, S.R.; Aneshansley, D.J.; Kochian, L.V. Three-dimensional root phenotyping with a novel imaging and software platform. Plant Physiol. 2011, 156, 455–465. [Google Scholar] [CrossRef] [PubMed]
  53. Senthilkumar, M.; Sadashiva, A.T.; Laxmanan, V. Impact of water stress on root architecture in tomato (Solanum lycopersicum Mill). Int. J. Curr. Microbiol. Appl. Sci. 2017, 6, 2095–2103. [Google Scholar] [CrossRef]
  54. Carretero, R.; Bert, F.E.; Podestá, G. Maize root architecture and water stress tolerance: An approximation from crop models. Agron. J. 2014, 106, 2287–2295. [Google Scholar] [CrossRef]
  55. Herridge, R.P.; Day, R.C.; Baldwin, S.; Macknight, R.C. Rapid analysis of seed size in Arabidopsis for mutant and QTL discovery. Plant Methods 2011, 7, 3. [Google Scholar] [CrossRef] [PubMed] [Green Version]
  56. Dias, P.M.B.; Brunel-Muguet, S.; Dürr, C.; Huguet, T.; Demilly, D.; Wagner, M.-H.; Teulat-Merah, B. QTL analysis of seed germination and pre-emergence growth at extreme temperatures in Medicago truncatula. Theor. Appl. Genet. 2011, 122, 429–444. [Google Scholar] [CrossRef] [PubMed]
  57. Blanco Romía, M.; Alcalà Bernàrdez, M. Chapter 3—Multivariate calibration for quantitative analysis. In Infrared Spectroscopy for Food Quality Analysis and Control; Sun, D.-W., Ed.; Academic Press: San Diego, CA, USA, 2009; pp. 51–82. ISBN 978-0-12-374136-3. [Google Scholar]
  58. Borisjuk, L.; Rolletschek, H.; Neuberger, T. Surveying the plant’s world by magnetic resonance imaging. Plant J. 2012, 70, 129–146. [Google Scholar] [CrossRef] [PubMed] [Green Version]
  59. Bolon, Y.-T.; Haun, W.J.; Xu, W.W.; Grant, D.; Stacey, M.G.; Nelson, R.T.; Gerhardt, D.J.; Jeddeloh, J.A.; Stacey, G.; Muehlbauer, G.J.; et al. Phenotypic and genomic analyses of a fast neutron mutant population resource in soybean. Plant Physiol. 2011, 156, 240–253. [Google Scholar] [CrossRef] [PubMed]
  60. Tilly, N.; Aasen, H.; Bareth, G. Fusion of plant height and vegetation indices for the estimation of barley biomass. Remote Sens. 2015, 7, 11449–11480. [Google Scholar] [CrossRef]
  61. Berry, P.M.; Spink, J.H.; Foulkes, M.J.; Wade, A. Quantifying the contributions and losses of dry matter from non-surviving shoots in four cultivars of winter wheat. F. Crop. Res. 2003, 80, 111–121. [Google Scholar] [CrossRef]
  62. Blonquist, J.M.; Norman, J.M.; Bugbee, B. Automated measurement of canopy stomatal conductance based on infrared temperature. Agric. For. Meteorol. 2009, 149, 1931–1945. [Google Scholar] [CrossRef]
  63. Hoffmeister, D.; Waldhoff, G.; Korres, W.; Curdt, C.; Bareth, G. Crop height variability detection in a single field by multi-temporal terrestrial laser scanning. Precis. Agric. 2016, 17, 296–312. [Google Scholar] [CrossRef]
  64. Tubana, B.; Girma, K.; Holtz, S.; Kanke, Y.; Lawles, K.; Edmonds, D.; Dotson, C.; England, B.; Daft, C.; Arnall, D.; et al. Indirect measurement of crop plant height. In Proceedings of the ASA-CSSA-SSAA, International Annual Meeting, New Orleans, LA, USA, 4–8 November 2007. [Google Scholar]
  65. Schima, R.; Mollenhauer, H.; Grenzdörffer, G.; Merbach, I.; Lausch, A.; Dietrich, P.; Bumberger, J. Imagine all the plants: Evaluation of a light-field camera for on-site crop growth monitoring. Remote Sens. 2016, 8, 823. [Google Scholar] [CrossRef]
  66. Madec, S.; Baret, F.; de Solan, B.; Thomas, S.; Dutartre, D.; Jezequel, S.; Hemmerlé, M.; Colombeau, G.; Comar, A. High-throughput phenotyping of plant height: Comparing unmanned aerial vehicles and ground LiDAR estimates. Front. Plant Sci. 2017, 8, 2002. [Google Scholar] [CrossRef] [PubMed]
  67. Bendig, J.; Bolten, A.; Bareth, G. UAV-based imaging for multi-temporal, very high resolution crop surface models to monitor crop growth variability. Photogramm. - Fernerkundung - Geoinf. 2013, 6, 551–562. [Google Scholar] [CrossRef]
  68. Remondino, F.; Spera, M.G.; Nocerino, E.; Menna, F.; Nex, F. State of the art in high density image matching. Photogramm. Rec. 2014, 29, 144–166. [Google Scholar] [CrossRef]
  69. Xu, R.; Dai, J.; Luo, W.; Yin, X.; Li, Y.; Tai, X.; Han, L.; Chen, Y.; Lin, L.; Li, G.; et al. A photothermal model of leaf area index for greenhouse crops. Agric. For. Meteorol. 2010, 150, 541–552. [Google Scholar] [CrossRef]
  70. Singh, B.; Reddy, K.R.; Redoña, E.D.; Walker, T. Screening of rice cultivars for morpho-physiological responses to early-season soil moisture stress. Rice Sci. 2017, 24, 322–335. [Google Scholar] [CrossRef]
  71. Obidiegwu, J.E.; Bryan, G.J.; Jones, H.G.; Prashar, A. Coping with drought: Stress and adaptive responses in potato and perspectives for improvement. Front. Plant Sci. 2015, 6, 542. [Google Scholar] [CrossRef] [PubMed]
  72. Dutta, P.; Bandopadhyay, P.; Bera, A.K. Identification of leaf based physiological markers for drought susceptibility during early seedling development of mungbean. Am. J. Plant Sci. 2016, 07, 1921–1936. [Google Scholar] [CrossRef]
  73. Mula, M.G.; Patil, S.B.; Aden, J.; Rathore, A.; Anil Kumar, V.; Kumar, R.V. Screening of pigeonpea genotypes for drought stress at early vegetative phase in Vertisol and Alfisol. Green Farming 2016, 7, 507–511. [Google Scholar]
  74. Belachew, K.Y.; Stoddard, F.L. Screening of faba bean (Vicia faba L.) accessions to acidity and aluminium stresses. PeerJ 2017, 5, e2963. [Google Scholar] [CrossRef] [PubMed]
  75. Howarth, C.J.; Gay, A.P.; Draper, J.; Powell, W. Development of high throughput plant phenotyping facilities at Aberystwyth. In Proceedings of the Phenomics Workshop, San Diego, CA, USA, 9 January 2011. [Google Scholar]
  76. Leport, L.; Musse, M.; Cambert, M.; De Franscesci, L.; Le Caherec, F.; Burel, A.; Mariette, F.; Bouchereau, A. Oilseed Rape leaf senescence phenotyping and identification of subcellular structural and metabolic changes using NMR tool. In Proceedings of the 2nd International Plant Phenotyping Symposium, Jülich, Germany, 5–7 September 2011. [Google Scholar]
  77. Waring, R.; Cleary, B.D. Plant moisture stress: Evaluation by pressure bomb. Science 1967, 155, 1248–1254. [Google Scholar] [CrossRef] [PubMed]
  78. De Bei, R.; Cozzolino, D.; Sullivan, W.; Cynkar, W.; Fuentes, S.; Dambergs, R.; Pech, J.; Tyerman, S. Non-destructive measurement of grapevine water potential using near infrared spectroscopy. Aust. J. Grape Wine Res. 2011, 17, 62–71. [Google Scholar] [CrossRef]
  79. Zakaluk, R.; Sri Ranjan, R. Predicting the leaf water potential of potato plants using RGB reflectance. Can. Biosyst. Eng. Le Genie des Biosyst. au Canada 2008, 50, 7.1–7.12. [Google Scholar]
  80. Patanè, C.; Scordia, D.; Testa, G.; Cosentino, S.L. Physiological screening for drought tolerance in Mediterranean long-storage tomato. Plant Sci. 2016, 249, 25–34. [Google Scholar] [CrossRef] [PubMed]
  81. Grzesiak, S.; Grzesiak, M.T.; Filek, W.; Stabryła, J. Evaluation of physiological screening tests for breeding drought resistant triticale (x Triticosecale wittmack). Acta Physiol. Plant. 2003, 25, 29–37. [Google Scholar] [CrossRef]
  82. Puangbut, D.; Jogloy, S.; Vorasoot, N.; Akkasaeng, C.; Kesmalac, T.; Patanothai, A. Variability in yield responses of peanut (Arachis hypogaea L.) genotypes under early season drought. Asian J. Plant Sci. 2009, 8. [Google Scholar]
  83. Songsri, P.; Jogloy, S.; Holbrook, C.C.; Kesmala, T.; Vorasoot, N.; Akkasaeng, C.; Patanothai, A. Association of root, specific leaf area and SPAD chlorophyll meter reading to water use efficiency of peanut under different available soil water. Agric. Water Manag. 2009, 96, 790–798. [Google Scholar] [CrossRef]
  84. Samdur, M.Y.; Singh, A.; Mathur, R.; Manivel, P.; Chikani, B.M.; Gor, H.; Khan, M.A. Field evaluation of chlorophyll meter for screening groundnut (Arachis hypogaea L.) genotypes tolerant to iron-deficiency chlorosis. Curr. Sci. 2000, 79, 211–214. [Google Scholar]
  85. Vollmann, J.; Walter, H.; Sato, T.; Schweiger, P. Digital image analysis and chlorophyll metering for phenotyping the effects of nodulation in soybean. Comput. Electron. Agric. 2011, 75, 190–195. [Google Scholar] [CrossRef]
  86. Dwyer, L.; Tollenaar, M.; Houwing, L. A nondestructive method to monitor leaf greenness in corn. Can. J. Plant Sci. 1991, 71, 505–509. [Google Scholar] [CrossRef] [Green Version]
  87. Arunyanark, A.; Jogloy, S.; Vorasoot, N.; Chutipong, A.; Kesmala, T.; Patanothai, A. Stability of relationship between chlorophyll density and soil plant analysis development chlorophyll meter readings in peanut across different drought stress conditions. Asian J. Plant Sci. 2009, 8, 102–110. [Google Scholar]
  88. Dhyani, K.; Ansari, M.W.; Rao, Y.R.; Verma, R.S.; Shukla, A.; Tuteja, N. Comparative physiological response of wheat genotypes under terminal heat stress. Plant Signal. Behav. 2013, 8, e24564. [Google Scholar] [CrossRef] [PubMed]
  89. Jangpromma, N.; Songsri, P.; Thammasirirak, S.; Jaisil, P. Rapid assessment of chlorophyll content in sugarcane using a SPAD chlorophyll meter across different water stress conditions. Asian J. Plant Sci. 2010, 9, 368–374. [Google Scholar] [CrossRef]
  90. Sita, K.; Sehgal, A.; Kumar, J.; Kumar, S.; Singh, S.; Siddique, K.H.M.; Nayyar, H. Identification of high-temperature tolerant lentil (Lens culinaris Medik.) genotypes through leaf and pollen traits. Front. Plant Sci. 2017, 8, 744. [Google Scholar] [CrossRef] [PubMed]
  91. Flood, P.J.; Kruijer, W.; Schnabel, S.K.; van der Schoor, R.; Jalink, H.; Snel, J.F.H.; Harbinson, J.; Aarts, M.G.M. Phenomics for photosynthesis, growth and reflectance in Arabidopsis thaliana reveals circadian and long-term fluctuations in heritability. Plant Methods 2016, 12, 14. [Google Scholar] [CrossRef] [PubMed]
  92. Yendrek, C.R.; Tomaz, T.; Montes, C.M.; Cao, Y.; Morse, A.M.; Brown, P.J.; McIntyre, L.M.; Leakey, A.D.B.; Ainsworth, E.A. High-Throughput phenotyping of maize leaf physiological and biochemical traits using hyperspectral reflectance. Plant Physiol. 2017, 173, 614–626. [Google Scholar] [CrossRef] [PubMed]
  93. Van Bezouw, R.F.H.M.; Keurentjes, J.J.B.; Harbinson, J.; Aarts, M.G.M. Converging phenomics and genomics to study natural variation in plant photosynthetic efficiency. Plant J. 2019, 97, 112–133. [Google Scholar] [PubMed]
  94. Yadav, B.; Kumawat, C.; Verma, A.K.; Yadav, D.K.; Yadav, P. Fluorescence imaging for crop stress monitoring: A review. Int. J. Curr. Microbiol. Appl. Sci. 2017, 6, 568–575. [Google Scholar]
  95. Costa, J.M.; Grant, O.M.; Chaves, M.M. Thermography to explore plant–environment interactions. J. Exp. Bot. 2013, 64, 3937–3949. [Google Scholar] [CrossRef] [PubMed] [Green Version]
  96. Deery, D.M.; Rebetzke, G.J.; Jimenez-Berni, J.A.; James, R.A.; Condon, A.G.; Bovill, W.D.; Hutchinson, P.; Scarrow, J.; Davy, R.; Furbank, R.T. Methodology for high-throughput field phenotyping of canopy temperature using airborne thermography. Front. Plant Sci. 2016, 7, 1808. [Google Scholar] [CrossRef] [PubMed]
  97. O’Shaughnessy, S.A.; Hebel, M.A.; Evett, S.R.; Colaizzi, P.D. Evaluation of a wireless infrared thermometer with a narrow field of view. Comput. Electron. Agric. 2011, 76, 59–68. [Google Scholar] [CrossRef] [Green Version]
  98. Zia, S.; Romano, G.; Spreer, W.; Sanchez, C.; Cairns, J.; Araus, J.L.; Müller, J. Infrared thermal imaging as a rapid tool for identifying water-stress tolerant maize genotypes of different phenology. J. Agron. Crop Sci. 2013, 199, 75–84. [Google Scholar] [CrossRef]
  99. Alchanatis, V.; Cohen, Y.; Cohen, S.; Moller, M.; Sprinstin, M.; Meron, M.; Tsipris, J.; Saranga, Y.; Sela, E. Evaluation of different approaches for estimating and mapping crop water status in cotton with thermal imaging. Precis. Agric. 2010, 11, 27–41. [Google Scholar] [CrossRef]
  100. Orbegozo, H.O. Application of Thermography for the Assessment of Vineyard Water Status; Universidad De La Rioja: La Rioja, Spain, 2012. [Google Scholar]
  101. Wang, D.; Gartung, J. Infrared canopy temperature of early-ripening peach trees under postharvest deficit irrigation. Agric. Water Manag. 2010, 97, 1787–1794. [Google Scholar] [CrossRef]
  102. Kashiwagi, J.; L, K.; Upadhyaya, H.; Gaur, P. Rapid screening technique for canopy temperature status and its relevance to drought tolerance improvement in chickpea. J. SAT Agric. Res. 2008, 6, 104–105. [Google Scholar]
  103. Munns, R.; James, R.A.; Sirault, X.R.R.; Furbank, R.T.; Jones, H.G. New phenotyping methods for screening wheat and barley for beneficial responses to water deficit. J. Exp. Bot. 2010, 61, 3499–3507. [Google Scholar] [CrossRef] [PubMed] [Green Version]
  104. Macková, H.; Hronková, M.; Dobrá, J.; Turečková, V.; Novák, O.; Lubovská, Z.; Motyka, V.; Haisel, D.; Hájek, T.; Prášil, I.T.; et al. Enhanced drought and heat stress tolerance of tobacco plants with ectopically enhanced cytokinin oxidase/dehydrogenase gene expression. J. Exp. Bot. 2013, 64, 2805–2815. [Google Scholar] [CrossRef] [PubMed] [Green Version]
  105. Rahnama, A.; James, R.A.; Poustini, K.; Munns, R. Stomatal conductance as a screen for osmotic stress tolerance in durum wheat growing in saline soil. Funct. Plant Biol. 2010, 37, 255–263. [Google Scholar] [CrossRef]
  106. Jiang, Q.; Roche, D.; Monaco, T.; Hole, D. Stomatal conductance is a key parameter to assess limitations to photosynthesis and growth potential in barley genotypes. Plant Biol. (Stuttg.) 2006, 8, 515–521. [Google Scholar] [CrossRef] [PubMed]
  107. Rahman, H.; Murtaza, N.; Shah, K.; Qayyum, A.; Ullah, I.; Malik, W. Genetic variation for stomatal conductance in upland cotton as influenced by heat-stressed and non-stressed growing regimes. Acta Agron. Hungarica 2008, 56, 11–19. [Google Scholar] [CrossRef]
  108. Torres-Ruiz, J.M.; Diaz-Espejo, A.; Perez-Martin, A.; Hernández-Santana, V. Role of hydraulic and chemical signals in leaves, stems and roots in the stomatal behaviour of olive trees under water stress and recovery conditions. Tree Physiol. 2015, 35, 415–424. [Google Scholar] [CrossRef] [PubMed]
  109. Heslop-Harrison, J.; Heslop-Harrison, Y.; Shivanna, K.R. The evaluation of pollen quality, and a further appraisal of the fluorochromatic (FCR) test procedure. Theor. Appl. Genet. 1984, 67, 367–375. [Google Scholar] [CrossRef] [PubMed]
  110. Pressman, E.; Peet, M.M.; Pharr, D.M. The effect of heat stress on tomato pollen characteristics is associated with changes in carbohydrate concentration in the developing anthers. Ann. Bot. 2002, 90, 631–636. [Google Scholar] [CrossRef] [PubMed]
  111. Heidmann, I.; Schade-Kampmann, G.; Lambalk, J.; Ottiger, M.; Di Berardino, M. Impedance flow cytometry: A novel technique in pollen analysis. PLoS ONE 2016, 11, e0165531. [Google Scholar] [CrossRef] [PubMed]
  112. Gonzalo, M.; Brewer, M.; Anderson, C.; Sullivan, D.; Gray, S.; Knaap, E. Tomato fruit shape analysis using morphometric and morphology attributes implemented in tomato analyzer software program. J. Am. Soc. Hortic. Sci. 2009, 134, 77–87. [Google Scholar] [CrossRef]
  113. Yoshioka, Y.; Fukino, N. Image-based phenotyping: Use of colour signature in evaluation of melon fruit colour. Euphytica 2009, 171, 409. [Google Scholar] [CrossRef]
  114. Granier, C.; Aguirrezabal, L.; Chenu, K.; Cookson, S.J.; Dauzat, M.; Hamard, P.; Thioux, J.-J.; Rolland, G.; Bouchier-Combaud, S.; Lebaudy, A.; et al. PHENOPSIS, an automated platform for reproducible phenotyping of plant responses to soil water deficit in Arabidopsis thaliana permitted the identification of an accession with low sensitivity to soil water deficit. New Phytol. 2006, 169, 623–635. [Google Scholar] [CrossRef] [PubMed]
  115. Harbinson, J.; Prinzenberg, A.E.; Kruijer, W.; Aarts, M.G.M. High throughput screening with chlorophyll fluorescence imaging and its use in crop improvement. Curr. Opin. Biotechnol. 2012, 23, 221–226. [Google Scholar] [CrossRef] [PubMed]
  116. Deikman, J.; Petracek, M.; Heard, J.E. Drought tolerance through biotechnology: Improving translation from the laboratory to farmers’ fields. Curr. Opin. Biotechnol. 2012, 23, 243–250. [Google Scholar] [CrossRef] [PubMed]
  117. Ruixiu, S.; Wilkerson, J.B.; Wilhelm, L.R.; Tompkins, F.D. A microcomputer-based morphometer for bush-type plants. Comput. Electron. Agric. 1989, 4, 43–58. [Google Scholar] [CrossRef]
  118. Montes, J.M.; Melchinger, A.E.; Reif, J.C. Novel throughput phenotyping platforms in plant genetic studies. Trends Plant Sci. 2007, 12, 433–436. [Google Scholar] [CrossRef] [PubMed]
  119. Mccarthy, C.; Hancock, N.; Raine, S. Apparatus and infield evaluations of a prototype machine vision system for cotton plant internode length measurement. J. Cotton Sci. 2010, 14, 221–232. [Google Scholar]
  120. White, J.W.; Conley, M.M. A Flexible, Low-Cost Cart for Proximal Sensing. Crop Sci. 2013, 53, 1646–1649. [Google Scholar] [CrossRef]
  121. Andrade-Sanchez, P.; Gore, M.A.; Heun, J.T.; Thorp, K.R.; Carmo-Silva, A.E.; French, A.N.; Salvucci, M.E.; White, J.W. Development and evaluation of a field-based high-throughput phenotyping platform. Funct. Plant Biol. 2013, 41, 68–79. [Google Scholar] [CrossRef]
  122. Rascher, U.; Blossfeld, S.; Fiorani, F.; Jahnke, S.; Jansen, M.; Kuhn, A.; Matsubara, S.; Märtin, L.L.; Merchant, A.; Metzner, R.; et al. Non-invasive approaches for phenotyping of enhanced performance traits in bean. Funct. Plant Biol. 2011, 38, 968–983. [Google Scholar] [CrossRef] [Green Version]
  123. Losos, J.B.; Arnold, S.J.; Bejerano, G.; Brodie, E.D., III; Hibbett, D.; Hoekstra, H.E.; Mindell, D.P.; Monteiro, A.; Moritz, C.; Orr, H.A.; et al. Evolutionary biology for the 21st century. PLoS Biol. 2013, 11, e1001466. [Google Scholar] [CrossRef] [PubMed]
  124. De Diego, N.; Fürst, T.; Humplík, J.F.; Ugena, L.; Podlešáková, K.; Spíchal, L. An automated method for high-throughput screening of arabidopsis rosette growth in multi-well plates and its validation in stress conditions. Front. Plant Sci. 2017, 8, 1702. [Google Scholar] [CrossRef] [PubMed]
  125. Trachsel, S.; Kaeppler, S.M.; Brown, K.M.; Lynch, J.P. Shovelomics: High throughput phenotyping of maize (Zea mays L.) root architecture in the field. Plant Soil 2011, 341, 75–87. [Google Scholar] [CrossRef]
  126. Bai, G.; Ge, Y.; Hussain, W.; Baenziger, P.S.; Graef, G. A multi-sensor system for high throughput field phenotyping in soybean and wheat breeding. Comput. Electron. Agric. 2016, 128, 181–192. [Google Scholar] [CrossRef] [Green Version]
  127. Zhang, C.; Pumphrey, M.; Zhou, J.; Gao, H.; Zhang, Q.; Sankaran, S. Development of Automated High-Throughput Phenotyping System for Controlled Environment Studies. In Proceedings of the ASABE Annual International Meeting, Spokane, WA, USA, 16–19 July 2017. [Google Scholar] [CrossRef]
  128. Yang, Y. Early detection of rice blast (Pyricularia) at seedling stage in Nipponbare rice variety using near-infrared hyper-spectral image. African J. Biotechnol. 2012, 11, 6809–6817. [Google Scholar] [CrossRef]
  129. Golzarian, M.R.; Frick, R.A.; Rajendran, K.; Berger, B.; Roy, S.; Tester, M.; Lun, D.S. Accurate inference of shoot biomass from high-throughput images of cereal plants. Plant Methods 2011, 7, 2. [Google Scholar] [CrossRef] [PubMed] [Green Version]
  130. LemnaTec. Available online: http://www.lemnatec.com/plant-phenotyping/ (accessed on 5 March 2019).
  131. KeyGene The Digital Phenotype. Available online: http://www.keygene.com/products-tech/digital-phenotyping/ (accessed on 5 March 2019).
  132. International Plant Phenotyping Network. Available online: https://www.plant-phenotyping.org/ (accessed on 5 March 2019).
  133. Jülich Plant Phenotyping Center. Available online: http://www.fz-juelich.de/ibg/ibg-2/EN/_organisation/JPPC/JPPC_node.html (accessed on 5 March 2019).
  134. Montpellier Plant Phenotyping Platform. Available online: https://www6.montpellier.inra.fr/lepse/Presentation-generale/Montpellier-Plant-Phenotyping-Platform-M3P (accessed on 5 March 2019).
  135. PPHD-INRA Dijon. Available online: http://www.dijon.inra.fr/Plateformes-Dispositifs/Plateformes-techniques/PPHD (accessed on 5 March 2019).
  136. La plate-forme PHENOPSIS. Available online: http://bioweb.supagro.inra.fr/phenopsis/InfoBDD.php (accessed on 5 March 2019).
  137. PhenoFab. Available online: https://www.keygene.com/technology/2-the-digital-phenotype/ (accessed on 5 March 2019).
  138. Biotron. Available online: https://www.uwo.ca/sci/research/biotron/ (accessed on 5 March 2019).
  139. Bresson, J.; Vasseur, F.; Dauzat, M.; Labadie, M.; Varoquaux, F.; Touraine, B.; Vile, D. Interact to survive: Phyllobacterium brassicacearum improves Arabidopsis tolerance to severe water deficit and growth recovery. PLoS ONE 2014, 9, e107607. [Google Scholar] [CrossRef] [PubMed]
  140. Clauw, P.; Coppens, F.; De Beuf, K.; Dhondt, S.; Van Daele, T.; Maleux, K.; Storme, V.; Clement, L.; Gonzalez, N.; Inzé, D. Leaf responses to mild drought stress in natural variants of Arabidopsis. Plant Physiol. 2015, 167, 800–816. [Google Scholar] [CrossRef] [PubMed]
  141. Tisné, S.; Serrand, Y.; Bach, L.; Gilbault, E.; Ben Ameur, R.; Balasse, H.; Voisin, R.; Bouchez, D.; Durand-Tardif, M.; Guerche, P.; et al. Phenoscope: An automated large-scale phenotyping platform offering high spatial homogeneity. Plant J. 2013, 74, 534–544. [Google Scholar] [CrossRef] [PubMed]
  142. Jansen, M.; Gilmer, F.; Biskup, B.; Nagel, K.; Rascher, U.; Fischbach, A.; Briem, S.; Dreissen, G.; Tittmann, S.; Braun, S.; et al. Simultaneous phenotyping of leaf growth and chlorophyll fluorescence via GROWSCREENFLUORO allows detection of stress tolerance in. Funct. Plant Biol. 2009, 36, 902–914. [Google Scholar] [CrossRef]
  143. Nagel, K.; Putz, A.; Gilmer, F.; Kathrin, H.; Fischbach, A.; Pfeifer, J.; Marc, F.; Blossfeld, S.; Michaela, E.; Dimaki, C.; et al. GROWSCREEN-Rhizo is a novel phenotyping robot enabling simultaneous measurements of root and shoot growth for plants grown in soil-filled rhizotrons. Funct. Plant Biol. 2012, 39, 891. [Google Scholar] [CrossRef]
  144. Reuzeau, C.; Pen, J.; Frankard, V.; De Wolf, J.; Peerbolte, R.; Broekaert, W.; Van Camp, W. TraitMill: A Discovery Engine for Identifying Yield-enhancement Genes in Cereals. Plant Gene Trait 2010, 1. [Google Scholar] [CrossRef]
  145. Sirault, X.; Fripp, J.; Paproki, A.; Kuffner, P.; Nguyen, C.; Li, R.; Daily, H.; Guo, J.; Furbank, R. PlantScan: A three-dimensional phenotyping platform for capturing the structural dynamic of plant development and growth. In Proceedings of the 7th International Conference on Functional-Structural Plant Models, Saariselkä, Finland, 9–14 June 2013. [Google Scholar]
  146. Neumann, K.; Klukas, C.; Friedel, S.; Rischbeck, P.; Chen, D.; Entzian, A.; Stein, N.; Graner, A.; Kilian, B. Dissecting spatiotemporal biomass accumulation in barley under different water regimes using high-throughput image analysis. Plant. Cell Environ. 2015, 38, 1980–1996. [Google Scholar] [CrossRef] [PubMed]
  147. Vadez, V.; Kholová, J.; Hummel, G.; Zhokhavets, U.; Gupta, S.K.; Hash, C.T. LeasyScan: A novel concept combining 3D imaging and lysimetry for high-throughput phenotyping of traits controlling plant water budget. J. Exp. Bot. 2015, 66, 5581–5593. [Google Scholar] [CrossRef] [PubMed]
  148. Pereyra Irujo, G.; Gasco, E.D.; Peirone, L.; Aguirrezábal, L. GlyPh: A low-cost platform for phenotyping plant growth and water use. Funct. Plant Biol. 2012, 39, 905. [Google Scholar] [CrossRef]
  149. Busemeyer, L.; Mentrup, D.; Möller, K.; Wunder, E.; Alheit, K.; Hahn, V.; Maurer, P.H.; Reif, C.J.; Würschum, T.; Müller, J.; et al. BreedVision — A multi-sensor platform for non-destructive field-based phenotyping in plant breeding. Sensors 2013, 13, 2830–2847. [Google Scholar] [CrossRef] [PubMed]
  150. Humplík, J.F.; Lazár, D.; Fürst, T.; Husičková, A.; Hýbl, M.; Spíchal, L. Automated integrative high-throughput phenotyping of plant shoots: A case study of the cold-tolerance of pea (Pisum sativum L.). Plant Methods 2015, 11, 20. [Google Scholar] [CrossRef] [PubMed]
  151. Phenospex: Smart Plant Analysis. Available online: https://phenospex.com/ (accessed on 5 March 2019).
  152. Burridge, J.; Jochua, C.N.; Bucksch, A.; Lynch, J.P. Legume shovelomics: High—Throughput phenotyping of common bean (Phaseolus vulgaris L.) and cowpea (Vigna unguiculata subsp, unguiculata) root architecture in the field. F. Crop. Res. 2016, 192, 21–32. [Google Scholar] [CrossRef]
  153. Sadok, W.; Naudin, P.; Boussuge, B.; Muller, B.; Welcker, C.; Tardieu, F. Leaf growth rate per unit thermal time follows QTL-dependent daily patterns in hundreds of maize lines under naturally fluctuating conditions. Plant. Cell Environ. 2007, 30, 135–146. [Google Scholar] [CrossRef] [PubMed] [Green Version]
  154. Guo, D.; Juan, J.; Chang, L.; Zhang, J.; Huang, D. Discrimination of plant root zone water status in greenhouse production based on phenotyping and machine learning techniques. Sci. Rep. 2017, 7, 8303. [Google Scholar] [CrossRef] [PubMed]
  155. Klukas, C.; Chen, D.; Pape, J.-M. Integrated analysis platform: An open-source information system for high-throughput plant phenotyping. Plant Physiol. 2014, 165, 506–518. [Google Scholar] [CrossRef] [PubMed]
  156. Bylesjö, M.; Segura, V.; Soolanayakanahally, R.Y.; Rae, A.M.; Trygg, J.; Gustafsson, P.; Jansson, S.; Street, N.R. LAMINA: A tool for rapid quantification of leaf size and shape parameters. BMC Plant Biol. 2008, 8, 82. [Google Scholar] [CrossRef] [PubMed]
  157. De Vylder, J.; Vandenbussche, F.; Hu, Y.; Philips, W.; Van Der Straeten, D. Rosette Tracker: An open source image analysis tool for automatic quantification of genotype effects. Plant Physiol. 2012, 160, 1149–1159. [Google Scholar] [CrossRef] [PubMed]
  158. Weight, C.; Parnham, D.; Waites, R. TECHNICAL ADVANCE: LeafAnalyser: A computational method for rapid and large-scale analyses of leaf shape variation. Plant J. 2008, 53, 578–586. [Google Scholar] [CrossRef] [PubMed]
  159. Bucksch, A.; Burridge, J.; York, L.M.; Das, A.; Nord, E.; Weitz, J.S.; Lynch, J.P. Image-based high-throughput field phenotyping of crop roots. Plant Physiol. 2014, 166, 470–486. [Google Scholar] [CrossRef] [PubMed]
  160. Galkovskyi, T.; Mileyko, Y.; Bucksch, A.; Moore, B.; Symonova, O.; Price, C.A.; Topp, C.N.; Iyer-Pascuzzi, A.S.; Zurek, P.R.; Fang, S.; et al. GiA Roots: Software for the high throughput analysis of plant root system architecture. BMC Plant Biol. 2012, 12, 116. [Google Scholar] [CrossRef] [PubMed]
  161. Green, J.M.; Appel, H.; Rehrig, E.M.; Harnsomburana, J.; Chang, J.-F.; Balint-Kurti, P.; Shyu, C.-R. PhenoPhyte: A flexible affordable method to quantify 2D phenotypes from imagery. Plant Methods 2012, 8, 45. [Google Scholar] [CrossRef] [PubMed]
  162. Pound, M.P.; French, A.P.; Atkinson, J.A.; Wells, D.M.; Bennett, M.J.; Pridmore, T. RootNav: Navigating images of complex root architectures. Plant Physiol. 2013, 162, 1802–1814. [Google Scholar] [CrossRef] [PubMed]
  163. Tanabata, T.; Shibaya, T.; Hori, K.; Ebana, K.; Yano, M. SmartGrain: High-throughput phenotyping software for measuring seed shape through image analysis. Plant Physiol. 2012, 160, 1871–1880. [Google Scholar] [CrossRef] [PubMed]
  164. Lobet, G.; Pagès, L.; Draye, X. A Novel image-analysis toolbox enabling quantitative analysis of root system architecture. Plant Physiol. 2011, 157, 29–39. [Google Scholar] [CrossRef] [PubMed]
  165. Le Bot, J.; Serra, V.; Fabre, J.; Draye, X.; Adamowicz, S.; Pagès, L. DART: A software to analyse root system architecture and development from captured images. Plant Soil 2010, 326, 261–273. [Google Scholar] [CrossRef]
  166. Mir, R.R.; Choudhary, N.; Singh, B.; Khandy, I.A.; Bawa, V.; Sofi, P.; Wani, A.; Kumari, S.; Jain, S.; Kumar, A. Harnessing genomics through phenomics. In Phenomics in Crop Plants: Trends, Options and Limitations; Kumar, J., Pratap, A., Kumar, S., Eds.; Springer: New Delhi, India, 2015; pp. 273–283. ISBN 978-81-322-2226-2. [Google Scholar]
  167. Furbank, R.T.; Tester, M. Phenomics–technologies to relieve the phenotyping bottleneck. Trends Plant Sci. 2011, 16, 635–644. [Google Scholar] [CrossRef] [PubMed]
  168. Tuberosa, R. Phenotyping for drought tolerance of crops in the genomics era. Front. Physiol. 2012, 3, 347. [Google Scholar] [CrossRef] [PubMed]
  169. Bernardo, R. What proportion of declared QTL in plants are false? Theor. Appl. Genet. 2004, 109, 419–424. [Google Scholar] [CrossRef] [PubMed]
  170. Heffner, E.L.; Sorrells, M.E.; Jannink, J.-L. Genomic selection for crop improvement. Crop Sci. 2009, 49. [Google Scholar] [CrossRef]
  171. Jansen, R.C.; Van Ooijen, J.W.; Stam, P.; Lister, C.; Dean, C. Genotype-by-environment interaction in genetic mapping of multiple quantitative trait loci. Theor. Appl. Genet. 1995, 91, 33–37. [Google Scholar] [CrossRef] [PubMed] [Green Version]
  172. Topp, C.N.; Iyer-Pascuzzi, A.S.; Anderson, J.T.; Lee, C.-R.; Zurek, P.R.; Symonova, O.; Zheng, Y.; Bucksch, A.; Mileyko, Y.; Galkovskyi, T.; et al. 3D phenotyping and quantitative trait locus mapping identify core regions of the rice genome controlling root architecture. Proc. Natl. Acad. Sci. USA 2013, 110, E1695–E1704. [Google Scholar] [CrossRef] [PubMed]
  173. Shorinola, O.; Kaye, R.; Golan, G.; Peleg, Z.; Kepinski, S.; Uauy, C. Isolation and characterisation of mutants with altered seminal root numbers in hexaploid wheat. bioRxiv 2018, 364018. [Google Scholar]
  174. Oakley, C.G.; Savage, L.; Lotz, S.; Larson, G.R.; Thomashow, M.F.; Kramer, D.M.; Schemske, D.W. Genetic basis of photosynthetic responses to cold in two locally adapted populations of Arabidopsis thaliana. J. Exp. Bot. 2018, 69, 699–709. [Google Scholar] [CrossRef] [PubMed]
  175. De Oliveira Silva, F.M.; Lichtenstein, G.; Alseekh, S.; Rosado-Souza, L.; Conte, M.; Suguiyama, V.F.; Lira, B.S.; Fanourakis, D.; Usadel, B.; Bhering, L.L.; et al. The genetic architecture of photosynthesis and plant growth-related traits in tomato. Plant. Cell Environ. 2018, 41, 327–341. [Google Scholar] [CrossRef] [PubMed]
  176. Borrill, P.; Harrington, S.A.; Uauy, C. Applying the latest advances in genomics and phenomics for trait discovery in polyploid wheat. Plant J. 2019, 97, 56–72. [Google Scholar] [CrossRef] [PubMed]
  177. Battenfield, S.D.; Guzmán, C.; Gaynor, R.C.; Singh, R.P.; Peña, R.J.; Dreisigacker, S.; Fritz, A.K.; Poland, J.A. Genomic Selection for processing and end-use quality traits in the CIMMYT spring bread wheat breeding program. Plant Genome 2016, 9. [Google Scholar] [CrossRef] [PubMed]
  178. Varshney, R.; Mohan, S.M.; Gaur, P.; Chamarthi, S.; Singh, V.; Samineni, S.; Swapna, N.; Sharma, M.; Pande, S.; Singh, S.; et al. Marker-assisted backcrossing to introgress resistance to fusarium wilt race 1 and Ascochyta blight in C 214, an elite cultivar of chickpea. Plant Genome 2014, 7, 1–11. [Google Scholar] [CrossRef]
  179. Pratap, A.; Chaturvedi, S.K.; Tomar, R.; Rajan, N.; Malviya, N.; Thudi, M.; Saabale, P.R.; Prajapati, U.; Varshney, R.K.; Singh, N.P. Marker-assisted introgression of resistance to fusarium wilt race 2 in Pusa 256, an elite cultivar of desi chickpea. Mol. Genet. Genomics 2017, 292, 1237–1245. [Google Scholar] [CrossRef] [PubMed]
  180. Cabrera-Bosquet, L.; Crossa, J.; von Zitzewitz, J.; Serret, M.D.; Luis Araus, J. High-throughput phenotyping and genomic selection: The frontiers of crop breeding converge. J. Integr. Plant Biol. 2012, 54, 312–320. [Google Scholar] [CrossRef] [PubMed]
  181. Heslot, N.; Yang, H.-P.; Sorrells, M.E.; Jannink, J.-L. Genomic selection in plant breeding: A comparison of models. Crop Sci. 2012, 52, 146–160. [Google Scholar] [CrossRef]
  182. Crossa, J.; Pérez-Rodríguez, P.; Cuevas, J.; Montesinos-López, O.; Jarquín, D.; de los Campos, G.; Burgueño, J.; González-Camacho, J.M.; Pérez-Elizalde, S.; Beyene, Y.; et al. Genomic selection in plant breeding: Methods, models, and perspectives. Trends Plant Sci. 2017, 22, 961–975. [Google Scholar] [CrossRef] [PubMed]
  183. Pérez-Elías, M.J.; García-Arata, M.I.; Munoz, V.; Santos, I.; Sanz-Moreno, J.; Abraira, V.; Arribas, J.; González García, J.; Moreno, A.; Dronda, F.; et al. Phenotype or virtual phenotype for choosing antiretroviral therapy after failure: A prospective, randomized study. Antivir. Ther. 2003, 8, 577–584. [Google Scholar] [PubMed]
  184. Tsukor, V.; Klose, R.; Ruckelshausen, A. Multi-sensor simulation method for outdoor plant phenotyping based on autonomous field robots. In Proceedings of the CIGR-Agicultural Enineering Conference, Valencia, Spain, 8–12 July 2012. [Google Scholar]
Figure 1. (ag). Root trait phenotyping of chickpea varieties by mini-rhizotron: Scanned root images of five chickpea genotypes viz., RSG 888, Pusa 362, KWR 108, PG 96006 and PG 5. (bf): Root profile of genotypes RSG 888, Pusa 362, KWR 108, PG 96006 and PG 5 at different soil depths and densities when grown in 1.5m long polyvinyl chloride (PVC) tube (20 cm diameter). The tubes were filled with 1:1 nutrient-rich mixture of cocopeat and soil and saturated to 20% moisture at initial level so that full expression of roots can be attained. After 60 days of sowing, intact roots were extracted from PVC tubes by washing with a flush of water and pictures were taken. (a,g): In-situ root profile of chickpea contrasting genotypes RSG 888, and PG 96006 monitored at different time intervals using mini-rhizotron. The genotype RSG 888 had high root density in the top soil (0–30 cm) while less density was observed below 30cm. This genotype is well adapted to those water-limiting cooler environments where the upper soil layer often gets saturated due to adequate dew precipitation. Genotype PG 96006 had less root density in the top soil (0–30 cm) but high root density beyond 30 cm. This genotype adapts well in those water limiting environments where top layer quickly gets dried but adequate moisture is available at the deeper level.
Agronomy 09 00126 g001
Figure 2. Chlorophyll fluorescence imaging of chickpea leaf for phenotyping heat tolerance. Here upper half of the leaves were not heat treated while bottom halves were heat treated at 46 °C for 1 h. High photosynthetic activity was detected by deep blue colour (higher quantum yield Fv/Fm) while orange, yellow and green or complete black colour represented the diminishing photosynthetic activity. Treated leaves were exposed to saturating light intensity for a fraction of second and depending upon the extent of damage of the photosynthetic system, the emitted light wavelength changed and appeared in different colours. Based on light emission, the probe captured and transformed into different numerical values which were calibrated with different colour codes. The leaf samples 1 and 2 fall in the range of heat sensitive ones as heat treatment completely damaged photosynthetic system either at Photosystem II level or destroying thylakoid membrane restricting electron flow and consequently no images (black) were detected. The leaf samples 3 and 4 were categorized as heat tolerant as they appeared yellow to green in colour indicating lower photosynthesis but still active even after heat shock. The deep blue colour (upper half of all leaves) represented high photosynthesis (non-stressed).
Agronomy 09 00126 g002
Figure 3. Infra-red thermal imaging describes the canopy temperature. Here two pigeonpea contrasting genotypes (a) AK 101 (drought sensitive) and (b) TGT 501(drought tolerant) have been used for imaging. Lower canopy temperature is related to a high transpiration rate and could be due to high rooting depth. The genotype (a) under drought is showing higher canopy temperature while the genotype (b) is showing cooler canopy, hence more drought tolerant under low moisture condition. (Thermal scale is shown with different colors and temperatures ranging between 27.8 to 38.3 °C).
Agronomy 09 00126 g003
Table 1. Commonly used high throughput plant phenotyping platforms (HTPPs) across agricultural and model crops.
NameTarget Plant OrganParametersDescriptionReferences
PHENOPSISLeafPlant growth parametersAn automated platform for reproducible phenotyping of plant responses to soil water deficit in Arabidopsis thaliana[114,139]
WIWAMLeafGrowth parametersUsed to impose stress early during leaf development[140]
PHENOSCOPEShootsVegetative growth and homogeneityAn integrated device, allowing a simultaneous culture of individual Arabidopsis plants and high-throughput acquisition, storage, and analysis of quality phenotypes[141]
GROWSCREENLeaf3D surface area of leaf discsPlatform to study plant leaf growth fluorescence and root architecture from seedling under control conditions in Arabidopsis thaliana, barley and maize[142,143]
TraitMillFlowers, grains, etc.Growth and yield parametersAutomated high resolution phenotypic platform, uniquely placed to identify genes that improve the yield of cereals[144]
PlantScanWhole plantVegetative growth parametersAutomated high-resolution phenomic center providing non-invasive analysis of plant structure, morphology and function in Gossypium, wheat and maize[145]
LemnaTecLeafGrowth and yield parametersVisualize and analyze 2D/3D non-destructive high-throughput imaging, monitor plant growth and behavior under fully controlled conditions[146]
LeasyScanLeaf, whole plantCanopy traitsPhenotyping for traits controlling plant water use with precision in pearl millet[147]
HRPFWhole plantGrowth and yield parametersHigh-throughput rice phenotyping facility[128]
GlyPh (self-construction)Whole plantSoil water content and growth estimationLow-cost platform for phenotyping plant growth and water use under a broad range of conditions[148]
BreedVisionWhole plantGrowth and physiological parametersMeasures various agronomic traits and leads to non-destructive phenotyping for crop improvement and plant genetic studies[149]
PlantScreenTMShootChlorophyll fluorescence imaging and non-imaging chlorophyll fluorescence, growth parametersEvaluates various parameters of chlorophyll fluorescence obtained from kinetic chlorophyll fluorescence imaging[150]
OloPhenWhole plantRosette area, growth and survival rateSuitable for analysis of rosette growth in multi-well plates, suitable to evaluate plant stress tolerance.[124]
Color eye
(RBG scanner)
LeafLeaf greenness, lesionsData can be overlayed over laser triangulation data obtained by plant eye[151]
LabVIEWCanopyGrowth parametersLow-cost, accurate, and high-throughput phenotyping system with custom algorithms[126,127]
ShovelomicsRootRoot growth parametersIdentification and selection of useful root architectural phenotypes for annual legume or dicotyledonous crops.[152]
Phenodyn/PhenoarchLeafLeaf elongation rateFollows QTL-dependent daily patterns in maize lines under naturally fluctuating conditions, located in INRA, France[153]
LemnaGridRoot and leafPlant and root growth parametersCompares growth behaviors of different genotypes, discriminates plant root zone water status[154]
Integrated Analysis Platform (IAP)LeafPlant leaf orientationProvides user-friendly interfaces with highly adaptable core functions, supports image data transfer from different acquisition environments and large-scale image analysis[155]
LAMINALeafLeaf parametersTool for automated analysis of images of leaves, designed to provide classical indicators of leaf structure[156]
Rosette TrackerShootArea, perimeter diameter stockinessAllows to simultaneously quantify plant growth, photosynthesis, and leaf temperature-related parameters[157]
Leaf AnalyserLeafLeaf architectureProvides a high-throughput method to evaluate leaf shape variation in higher-dimensional phenotypic space[158]
Self-constructionRootRoot growth parametersAlgorithms allow the automatic extraction of many root traits in a high-throughput fashion[159]
PhenovatorLeafPhotosynthesisHigh-throughput phenotyping facility for photosynthesis developed at Wageningen University and Research[91]
Table 2. Non-exhaustive list of popular software packages used for advanced analysis of morphometric parameters captured using common HTP tools.
Name of the SoftwareTarget Plant OrganParametersDescriptionReferences
MATLABLeafLeaf architectureUses image processing algorithms for high-throughput analysis of images for estimating phenotypes/traits associated with tested plants[127]
HTPhenoShootHeight, width and shoot areaAnalyzes colour images of plants and different phenotypical parameters for each plant[8]
GiaRootsRootMorpho-geometric parametersSemi-automated software tool for high-throughput analysis of root system images[160]
RootReader 3DRootsRoot types and phenotypic root traitsImaging and software platform for HTP of 3-D root traits during seedling development[52]
PhenoPhyteLeafLeaf and plant growth parametersTool to analyze the non-destructive imaging of plants can be used in suboptimal imaging conditions also[161]
RootNavRootRoot system architectureImage analysis tool for semi-automated quantification of complex root system architecture in a range of plant species[162]
SmartGrainSeedSeed structure parametersSoftware for high-throughput measurement of seed shape, makes possible to distinguish between lines with small differences in seed shape[163]
SmartRootRootRoot system architectureOperating system-independent freeware and relies on cross-platform standards for communication with data-analysis software[164]
DARTRootRoot system architectureUses human vision tracing to avoid analytical biases[165]
Tomato analyzerFruitFruit colourAnalyzes tomato fruit colour[112]

