Article

Quantification of Cultivar Change in Double Rice Regions under a Warming Climate during 1981–2009 in China

Key Laboratory of Ministry of Agriculture for Crop System Analysis and Decision Making, National Engineering and Technology Center for Information Agriculture, Jiangsu Key Laboratory for Information Agriculture, Jiangsu Collaborative Innovation Center for Modern Crop Production, Nanjing Agricultural University, Nanjing, Jiangsu 210095, China
*
Author to whom correspondence should be addressed.
Agronomy 2019, 9(12), 794; https://doi.org/10.3390/agronomy9120794
Submission received: 1 November 2019 / Revised: 13 November 2019 / Accepted: 21 November 2019 / Published: 22 November 2019

Abstract

:
Maintaining high double rice productivity in China is very important for ensuring the food security of China. However, the double rice production system is sensitive to changes in both climate and management practices. Previous studies showed that rice production has been negatively impacted by global warming without considering the changes of cultivars and management practices. However, cultivar improvements and the impact of cultivar change must not be ignored in any assessment. In the current study, we combined data analysis with crop modeling to investigate the impacts of changes in climate and cultivars on rice productivity at three different double rice sites (Nanchang, Hengyang, and Gaoyao) in China. The results showed a warming trend at the study sites during 1981–2009, and the temperature increase rates (maximum, average, and minimum temperatures) in the late rice growing season were larger than in the early rice growing season. Global warming has led to a reduction in the length of the rice growth period. Adopting new rice cultivars may partially mitigate the declining trend of the growing duration and grain yield, but it would not completely compensate for the negative impact observed in double rice regions. In general, the changes in cultivars prolonged the growing duration by increasing the basic vegetative phase and the photoperiod formation phase. The main reasons for yield improvement were the increase in the percentage of filled grains for early rice and the increase in grain number per spike for late rice. In the face of future warming, breeding efforts are necessary for producing new cultivars that are resilient to the negative impacts of future climate change on agriculture.

1. Introduction

Rice is the third most widely grown cereal crop after wheat and maize and is the staple food of more than half of the world’s population [1,2,3]. China is one of the major rice-producing countries and accounts for approximately one-third of global rice production [4]. China’s 2015–2017 rice harvested area was estimated at 31.0 million ha, accounting for 18.5% of the world’s total [5], and this was dominated by double rice [6]. Approximately 66% of the total rice area in China is under a double rice cropping system [7]. Therefore, it is important that the production from this system in China contributes to global food security. Over the past 60 years, rice farming practices in China have changed tremendously [8,9], and these changes have contributed significantly to the increase in production. From 1978 to 2017, the total rice production increased by 75.7 million t, and the average yield increased by 2.9 t/ha in China [10]. This increase has come from the development of high-yielding varieties, such as semidwarf and hybrid rice varieties, and improved crop management measures, such as nitrogen fertilization and irrigation [11].
However, to meet the demands of a rapidly expanding population worldwide, an estimated 35% increase in rice production is required over the coming decades [12], a goal that is difficult to attain due to the gradual decrease in crop planting area and the increase in global warming. The global mean surface air temperature is projected to increase by 1.4–5.8 °C over the period 1990–2100 based on the IPCC Third Assessment Report [13,14]. In the last century, China had a more temperate climate [15]. The annual mean air temperature in China has increased by 1.2 °C since 1960 [16]. Climate change is recognized to shorten the crop-growing period, which is disadvantageous to production [17,18]. At the current CO2 level, the yield of early rice, late rice, and single rice decreased by 6.6%, 5.2%, and 8.2%, respectively, for every 1 °C increase in China [19]. Although climate remains one of the major and uncontrolled driving forces in crop production, an agriculture production system is a complex dynamic system that is influenced by multiple factors [20]. Some studies have shown that changes in cultivars can stabilize the crop growth stage and improve crop yield [21,22]. By a regression model, Zhang et al. found that climate warming over the past three decades (1980s–2000s) has shortened rice growth duration in China and cultivar shifts have further accelerated the process for late rice [23]. Liu et al. quantified three-decade changes of single rice cultivars in China using crop modeling and found that crop modeling is an efficient way to study the impact of environmental and cultivar changes on crop productivity in agricultural production [24,25]. Due to partial differences in the impact of climate and cultivar change on single and double rice in China [20], it is necessary to quantify the cultivar change in double rice regions under a warming climate.
In this study, we used agricultural records and a rice model to quantify the changes in cultivars under the global warming environment during 1981–2009 in double rice regions. The objectives were to (1) quantify the three-decade changes in rice cultivars, (2) analyze the impact of cultivars on rice phenology and yield, and (3) provide directions for future rice breeding.

2. Materials and Methods

2.1. Study Sites

Three study sites were selected from the main double rice cropping system regions, namely, Nanchang (28°33′ N, 115°57′ E) in Jiangxi Province, Hengyang (26°53′ N, 112°30′ E) in Hunan Province, and Gaoyao (23°03′ N, 112°28′ E) in Guangdong Province (Figure 1).

2.2. Climate and Crop Data

Daily maximum, average, and minimum temperatures; sunshine hours; and precipitation recorded from 1981 to 2009 were obtained from the National Meteorological Networks of the China Central Meteorological Agency (CMA). Double rice growth and yield data and management records from 1981 to 2009 were obtained from the Agrometeorological Experiment Stations (AES) operated by CMA at each study station, including the name of the cultivars, dates of sowing and harvesting, dates of the main growth stages (trilling, jointing, booting, flowering, and grain filling), aboveground biomass, grain yield, yield components (1000-grain weight, percentage of filled grains, and grain number per spike), and management practices (fertilizer and irrigation rate). The crop harvest index was calculated as the ratio of grain yield to total aboveground biomass. In this study, rice phenology was divided into four main phases: basic vegetative phase (BVP, from emergence to the start of the photoperiod-sensitive phase), photoperiod-sensitive phase (PSP, from the end of the basic vegetative phase to panicle initiation), panicle formation phase (PFP, from panicle initiation to flowering), and grain-filling phase (GFP, from flowering to physiological maturity). During the study period, 20 and 18 varieties were used as early and late rice at Nanchang, 13 and 8 varieties were used as early and late rice at Hengyang, and 12 and 15 varieties were used as early and late rice at Gaoyao, respectively. The names and traits of the early and late rice are listed in Tables S1–S6.

2.3. Crop Modeling

The Agricultural Production Systems Simulator (APSIM)-Oryza model was used to simulate rice growth and yield formation at the study sites. This model was developed by incorporating the ORYZA2000 model [26,27] into the APSIM framework [28]. The key objectives of this model are to accurately simulate the growth and development of rice while also dealing with management decisions such as fertilization, time of transplanting, and field management practices. It allows rice physiology, such as photosynthesis, phenological development, and yield, to be simulated as intended in ORYZA2000 while using the existing APSIM suite of modules for water, nitrogen, and other soil processes and management issues. This model also allows assessment of a continuous cropping system. APSIM-Oryza has been calibrated and used in Korea [29] and Sri Lanka [30] to simulate the different nitrogen treatments in rice cropping systems. The model has satisfactorily simulated the dynamics of the rice variables measured, such as phenological stages, yield, and biomass. We included four cultivar parameters in this model: the development rate during the juvenile phase (DVRJ), the development rate during the photoperiod-sensitive phase (DVRI), the development rate during the panicle development phase (DVRP), and the development rate in the reproductive phase (DVRR). In this study, 63 and 24 observed records were used for model calibration and validation in early rice, and 62 and 25 records were used in late rice, respectively. The fitness between the observed and simulated main growth stages was assessed with root-mean-square error (RMSE), mean-square error (MSE), and correlation coefficient (R2).

2.4. Data Analysis

The changes in rice cultivars in terms of phenological development and yield formation at each study site were quantified by combining data analysis and crop modeling. The APSIM-Oryza model was used to conduct cultivar quantification and subsequent modeling against the observed phenology, biomass, and grain yield of early and late rice. Changes in trends of different climate variables (maximum, average, and minimum temperatures) and changes in the model parameters (DVRJ, DVRI, DVRP, and DVRR) were tested for significance at the 5% level using Student’s t-test. The stepwise multilinear regression (SMLR) method was used to quantify the contributions of each yield component to changes in observed rice grain yield. In addition, we used analysis of variance (ANOVA) to analyze the changes in thermal time among different cultivars at each site. The cultivars that were planted for only one year were excluded. Statistical processing was performed with SPSS 22.0 (SPSS, Inc., Chicago, IL, USA)

3. Results and Discussion

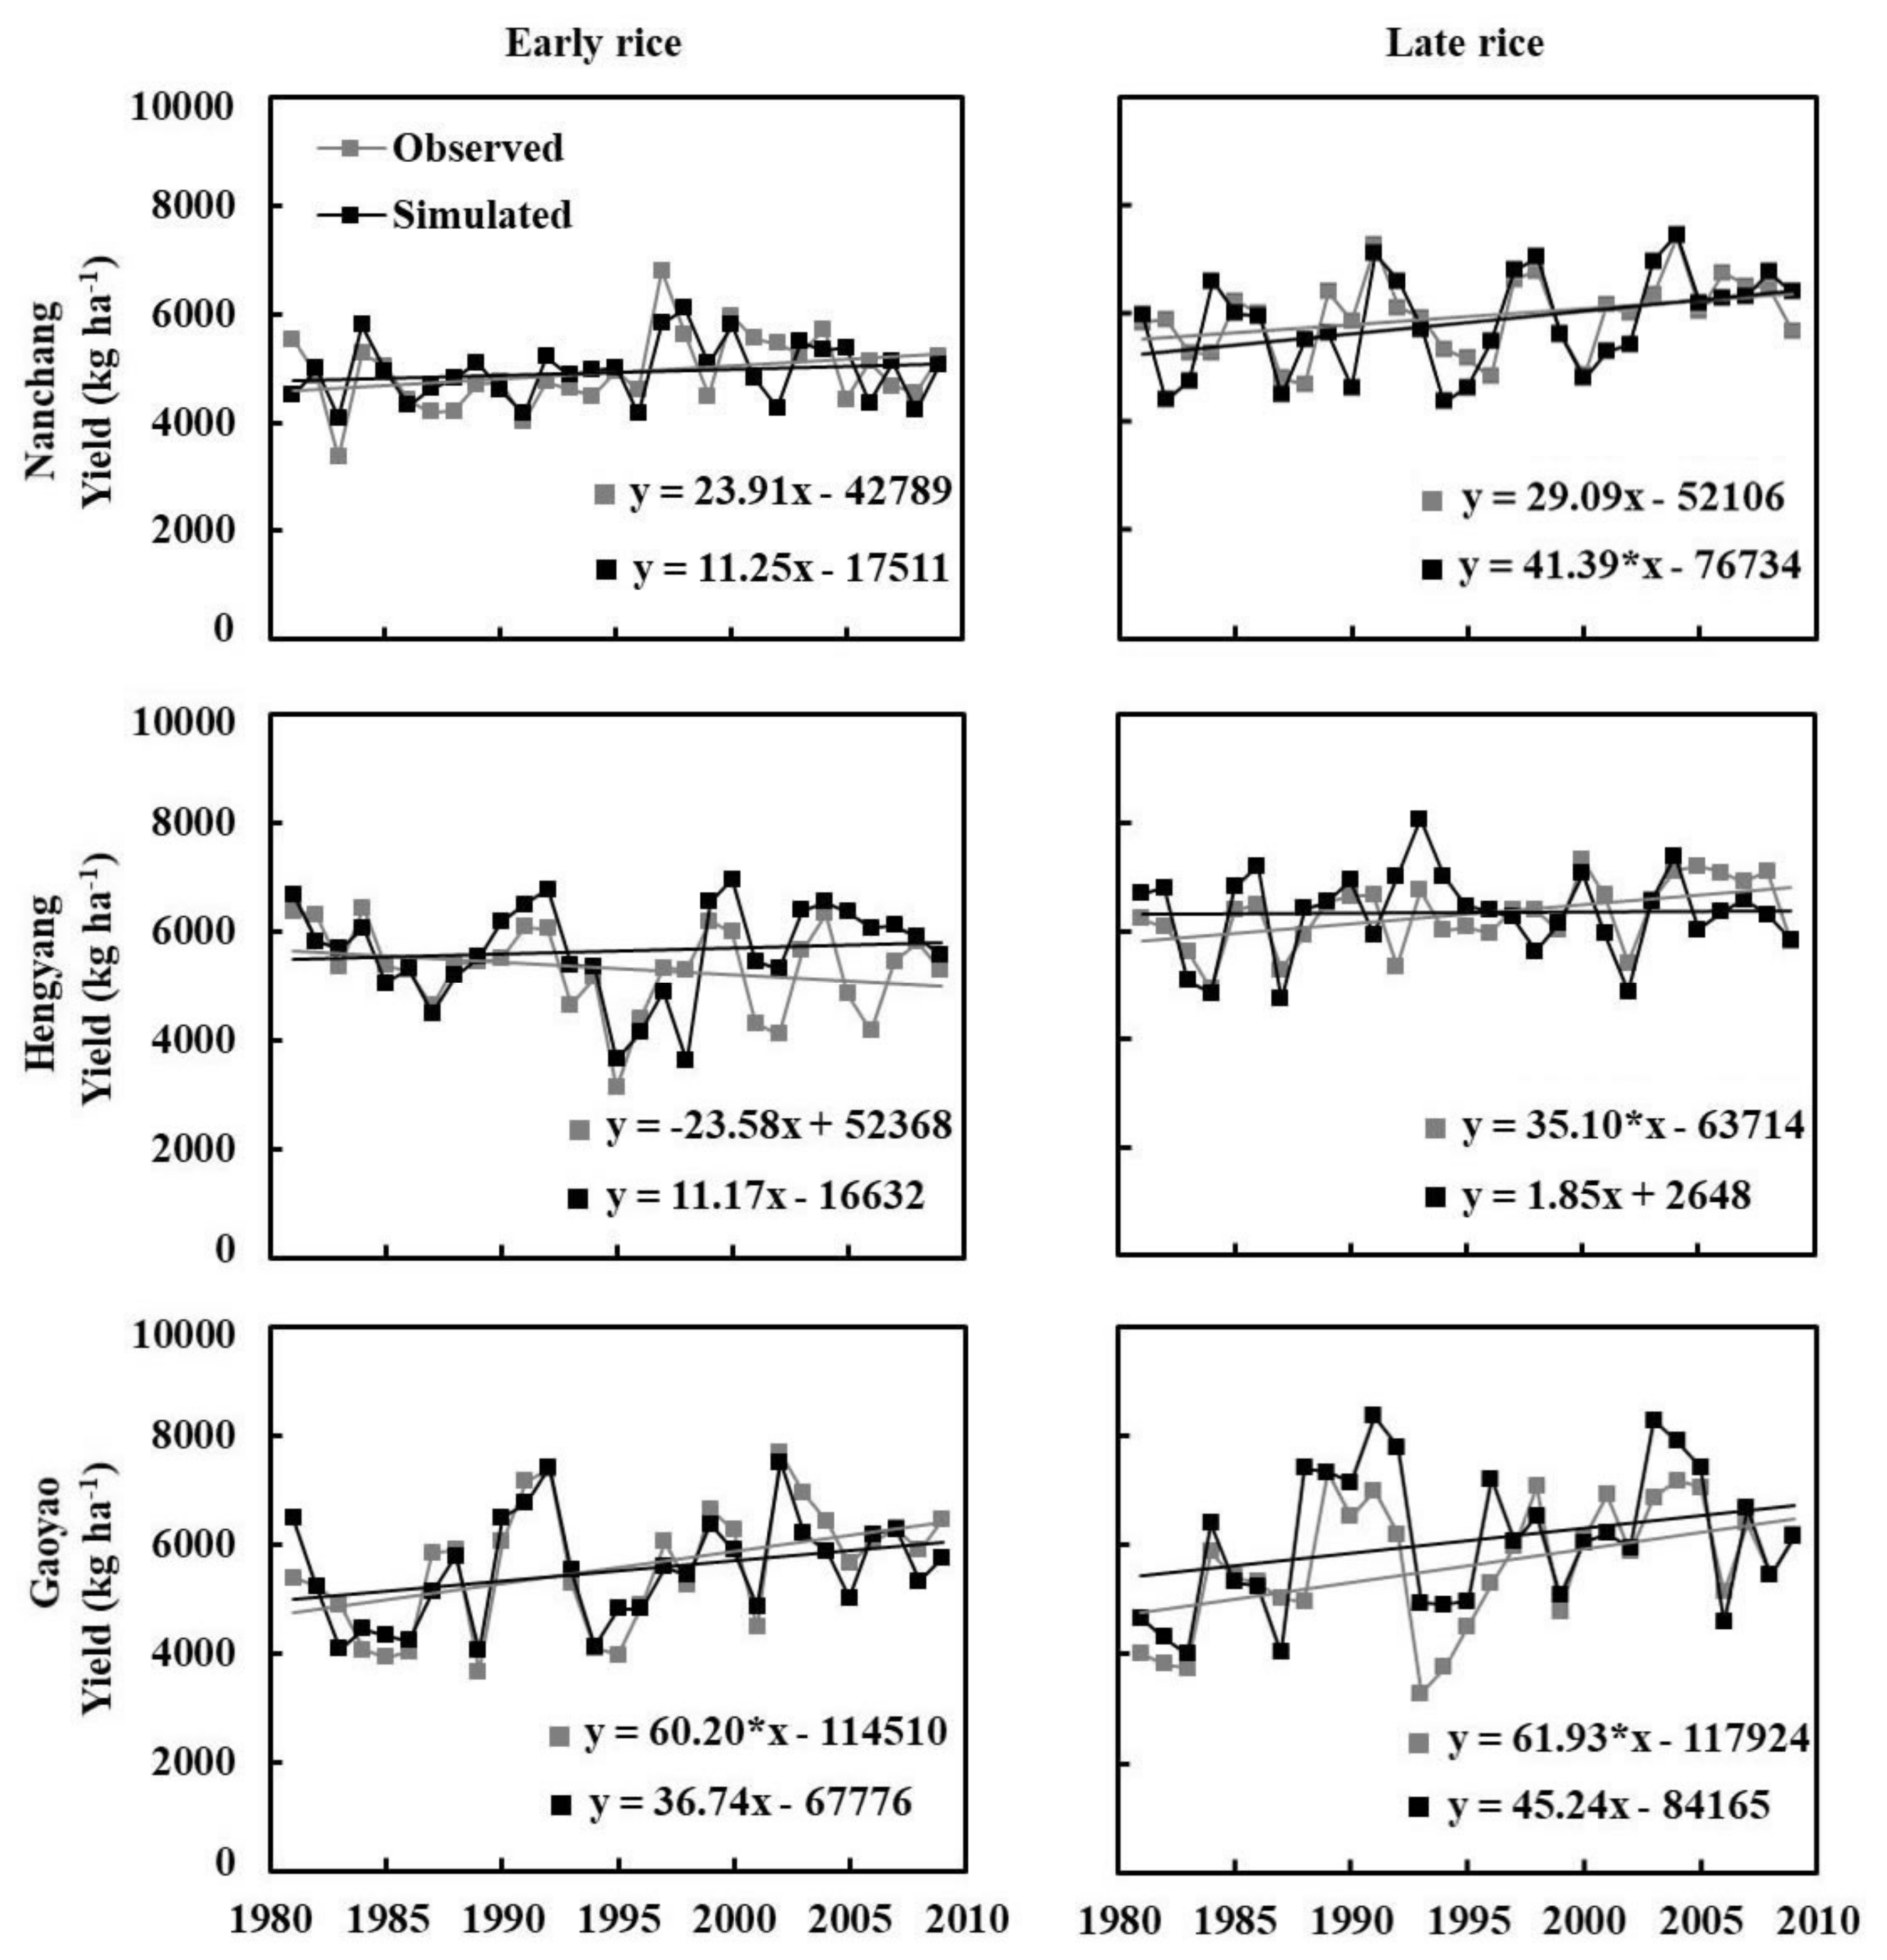
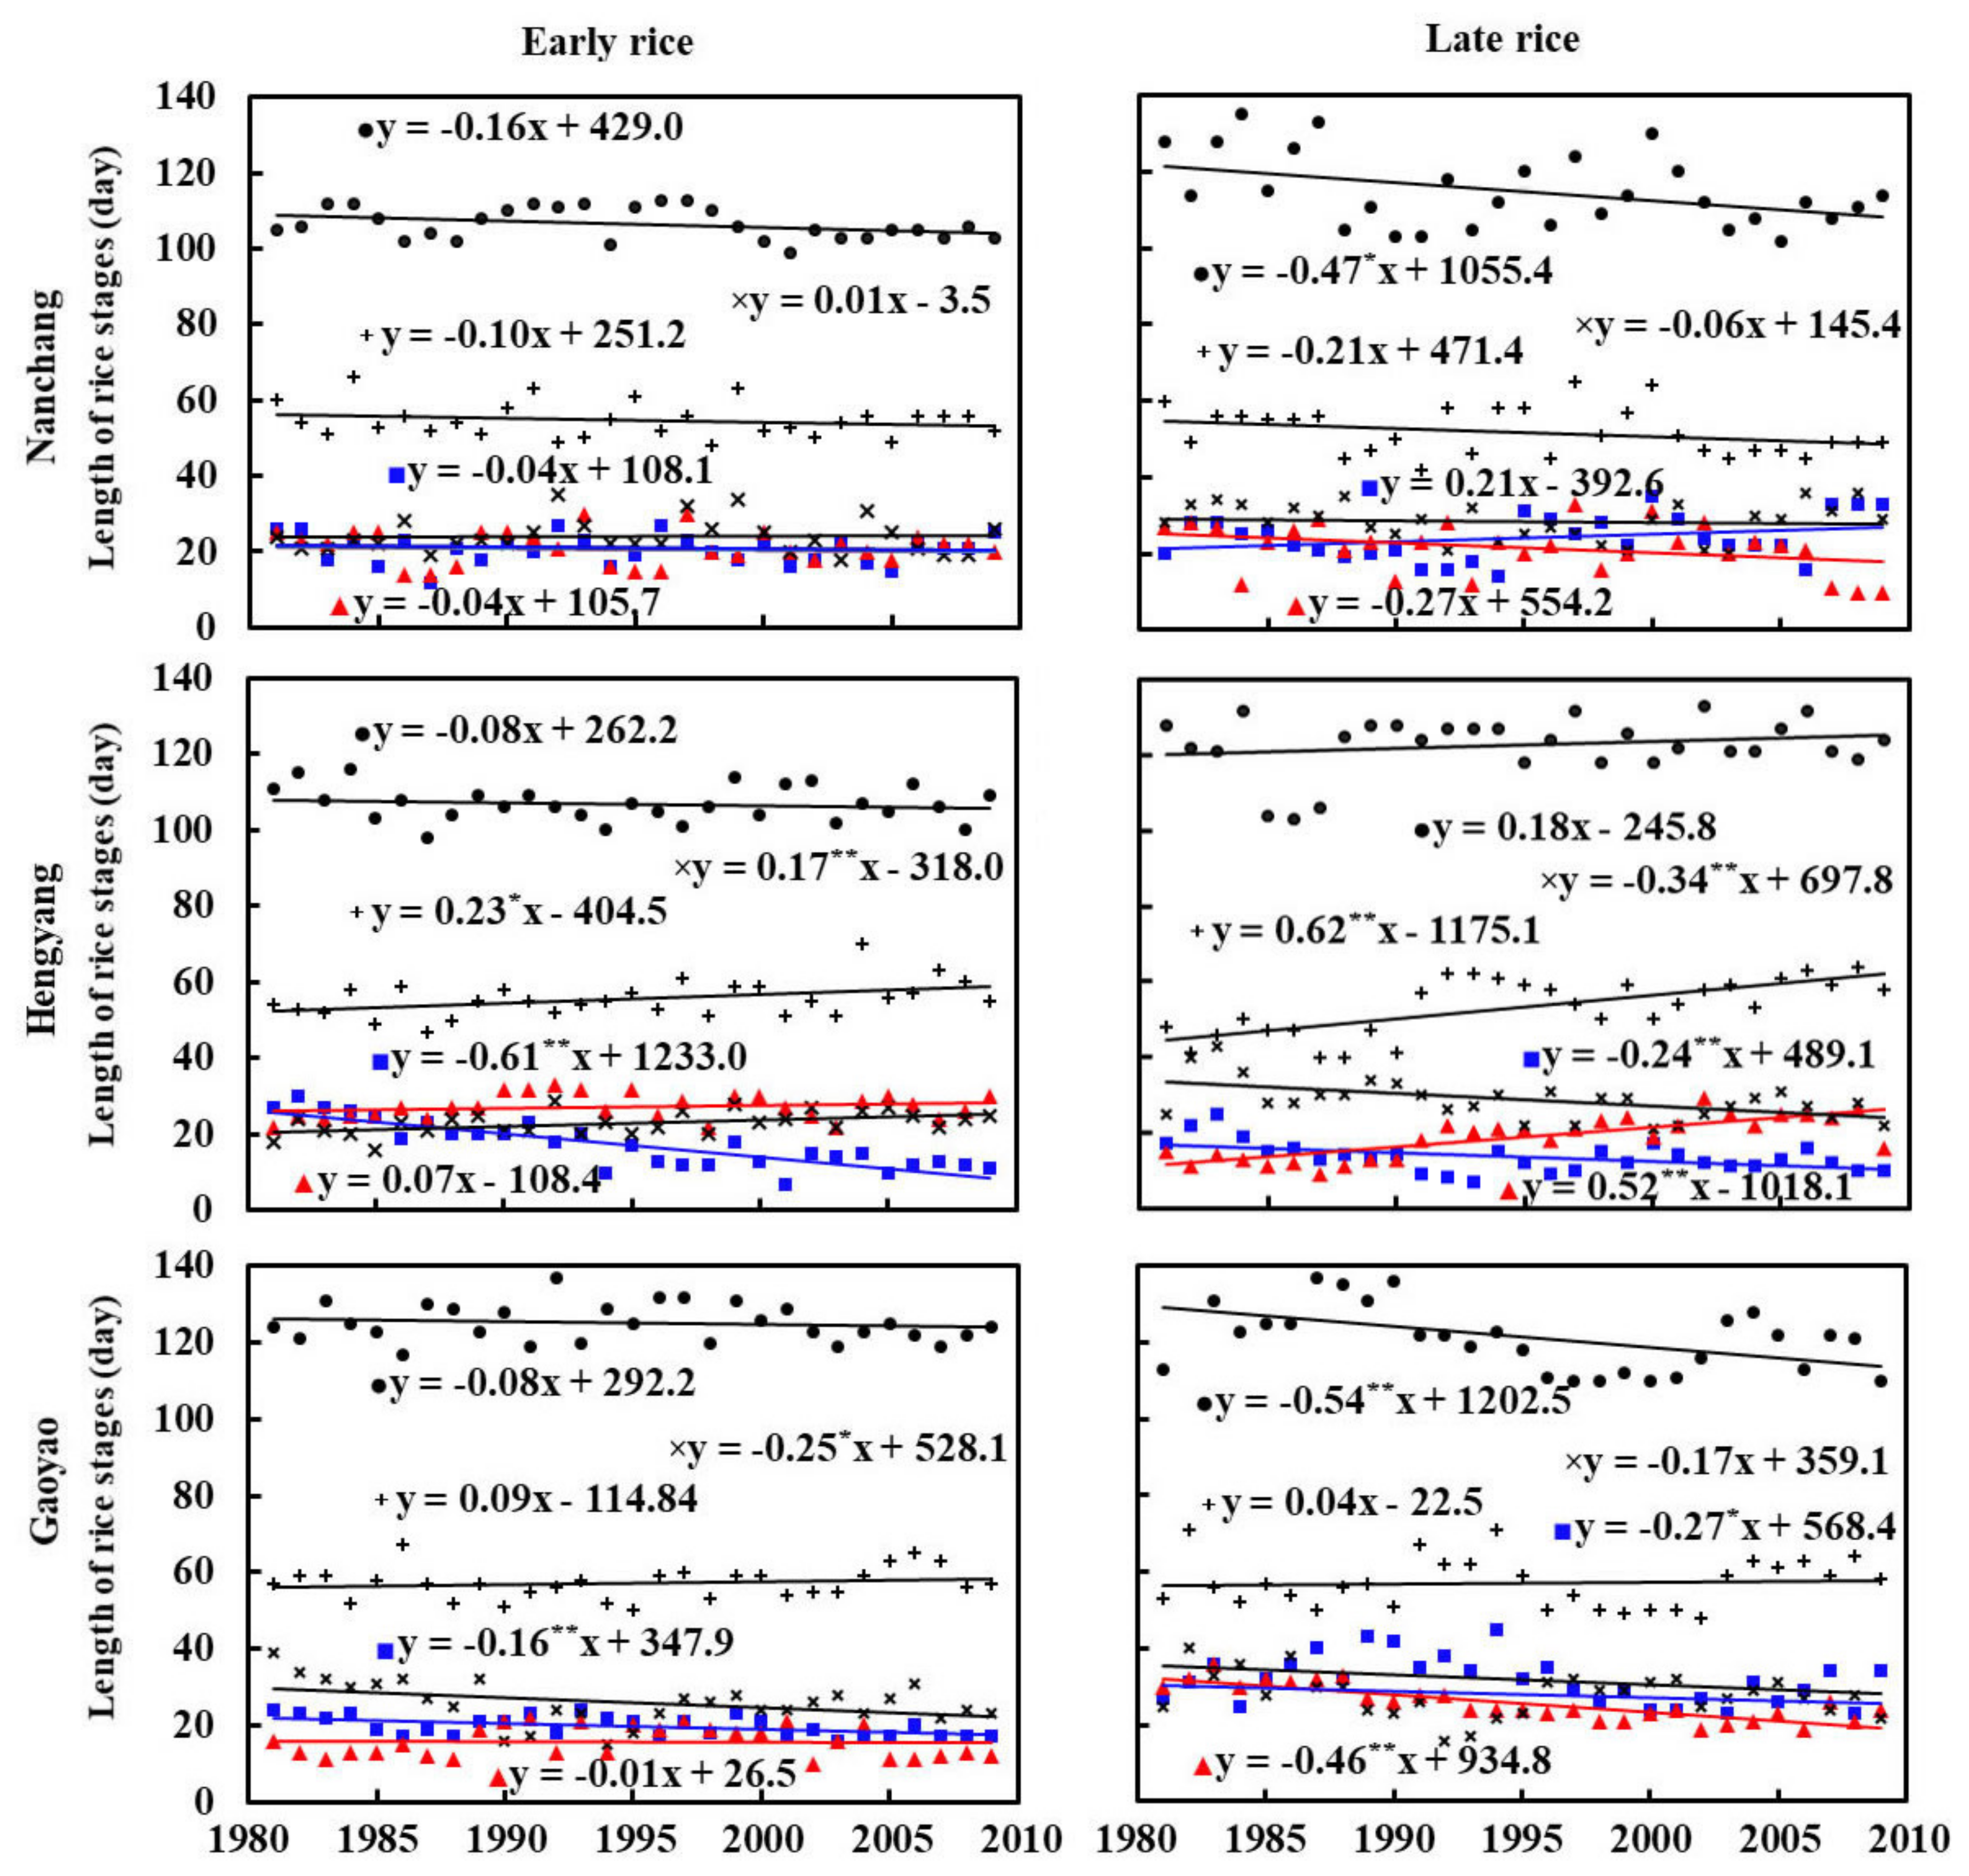
3.1. Climate Changes during Different Rice Growth Stages

With the intensification of climate change, a significant warming trend has been documented at most locations around the world [31]. In addition, it has been proved that the phenology and growth duration of crops have been shortened as temperatures have risen in the past decades [23], and the accelerated developmental rate caused by climate warming is often associated with a harmful effect on crop production [17,32]. Rice is one of the world’s most important cereals, as the staple food for the majority of the world population [33], and accounts for approximately 30% of the total planting acreage of food crops and half of the total grain production in China [34]. The double rice of China produced 61.3% of the total rice production [24]. Therefore, improved knowledge of how the past climate change during early and late rice phenology could provide insights into future climate adaptation strategies to ensure the safe production of rice.
Our results showed that the temperature trends, including maximum, average, and minimum temperatures, during different growth stages were different between early and late rice at all three sites (Table 1). For early rice, the temperatures showed an increasing trend (except for the minimum temperature at Gaoyao) during the BVP stage. The temperatures at Hengyang increased significantly (p < 0.01). During the PSP stage, temperatures gradually decreased (except for the temperatures at Hengyang and the maximum temperature at Gaoyao). During the PFP stage, only the minimum temperature at Gaoyao changed significantly (p < 0.05). During the GFP stage, the temperatures of each site changed slightly. From emergence to maturity (EM), temperatures at Hengyang significantly increased. The average temperature increased by 0.017 °C/year at Nanchang, 0.033 °C/year at Hengyang, and 0.001 °C/year at Gaoyao. For late rice, the temperatures at Nanchang showed an increasing trend in all stages, and the temperatures during the PFP, GFP, and EM stages increased significantly. At Hengyang, the temperatures during PSP and PFP and the maximum temperature during BVP decreased. Only temperatures during PSP reached a significant level (p < 0.05). At Gaoyao, the maximum, average, and minimum temperatures during all stages increased significantly. Only temperatures during BVP and minimum temperatures during PSP did not reach the significance level. From emergence to maturity, the average temperature increased by 0.074, 0.038, and 0.039 °C/year at Nanchang, Hengyang, and Gaoyao, respectively.

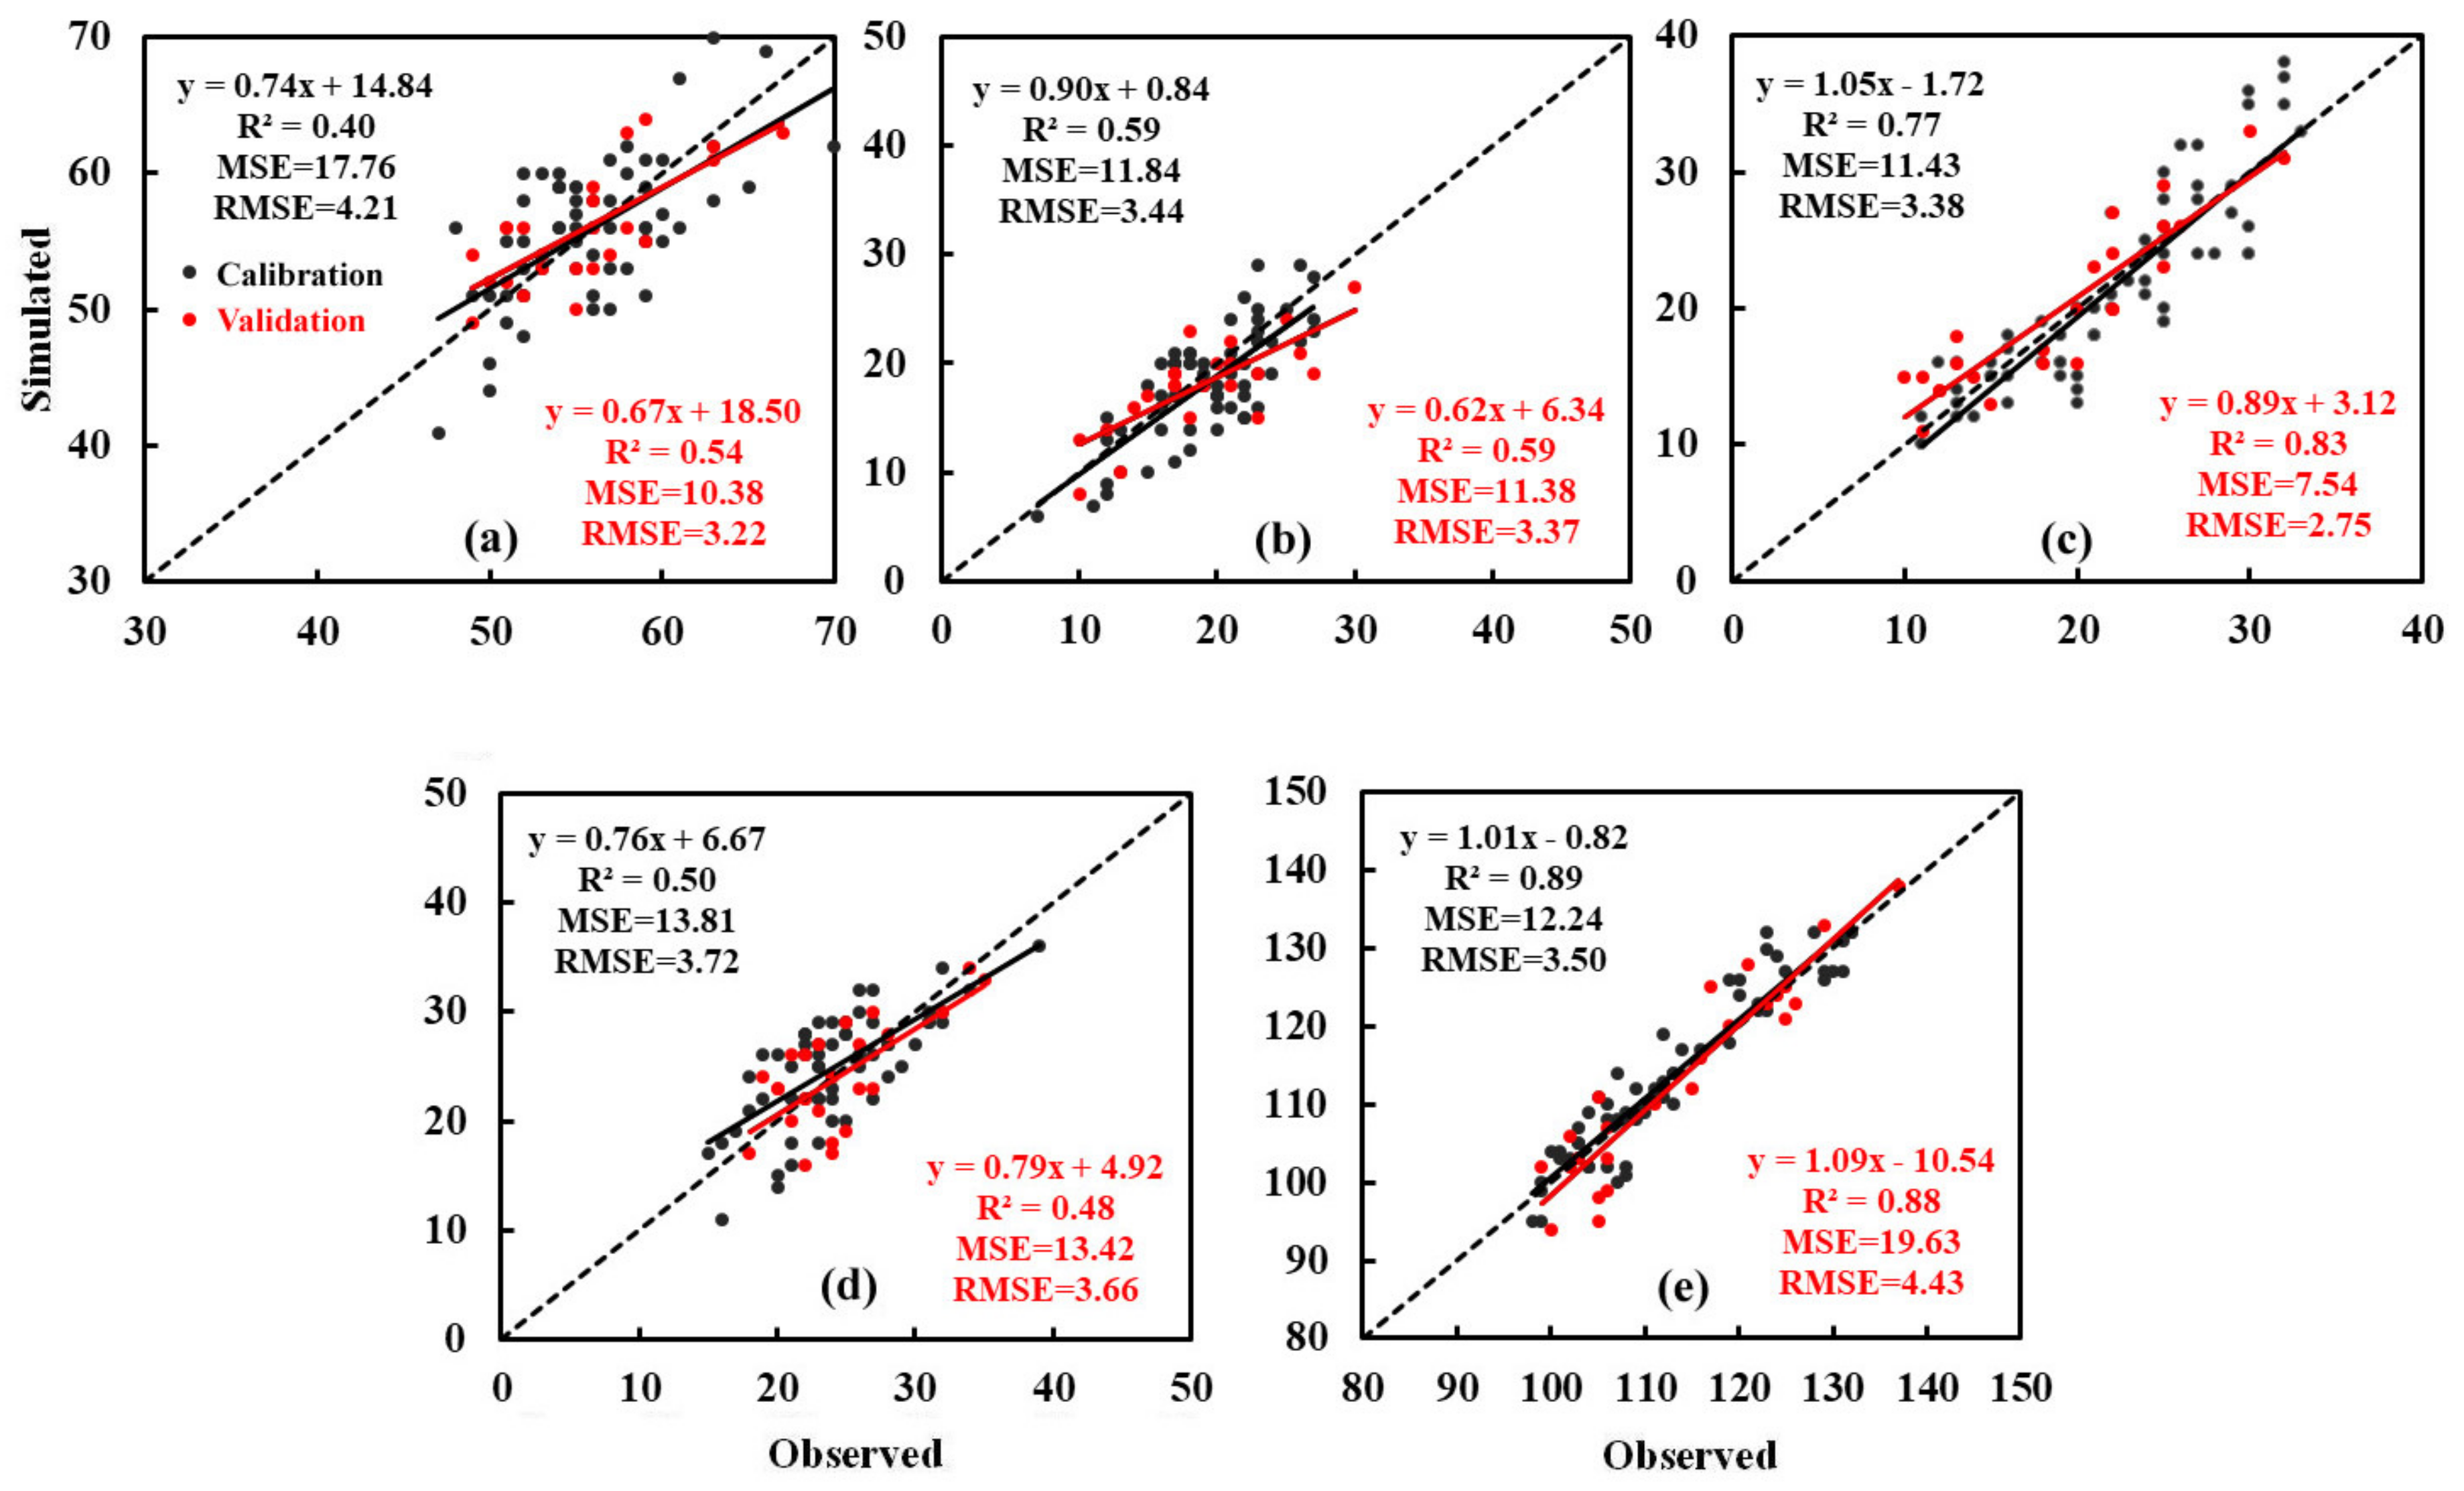
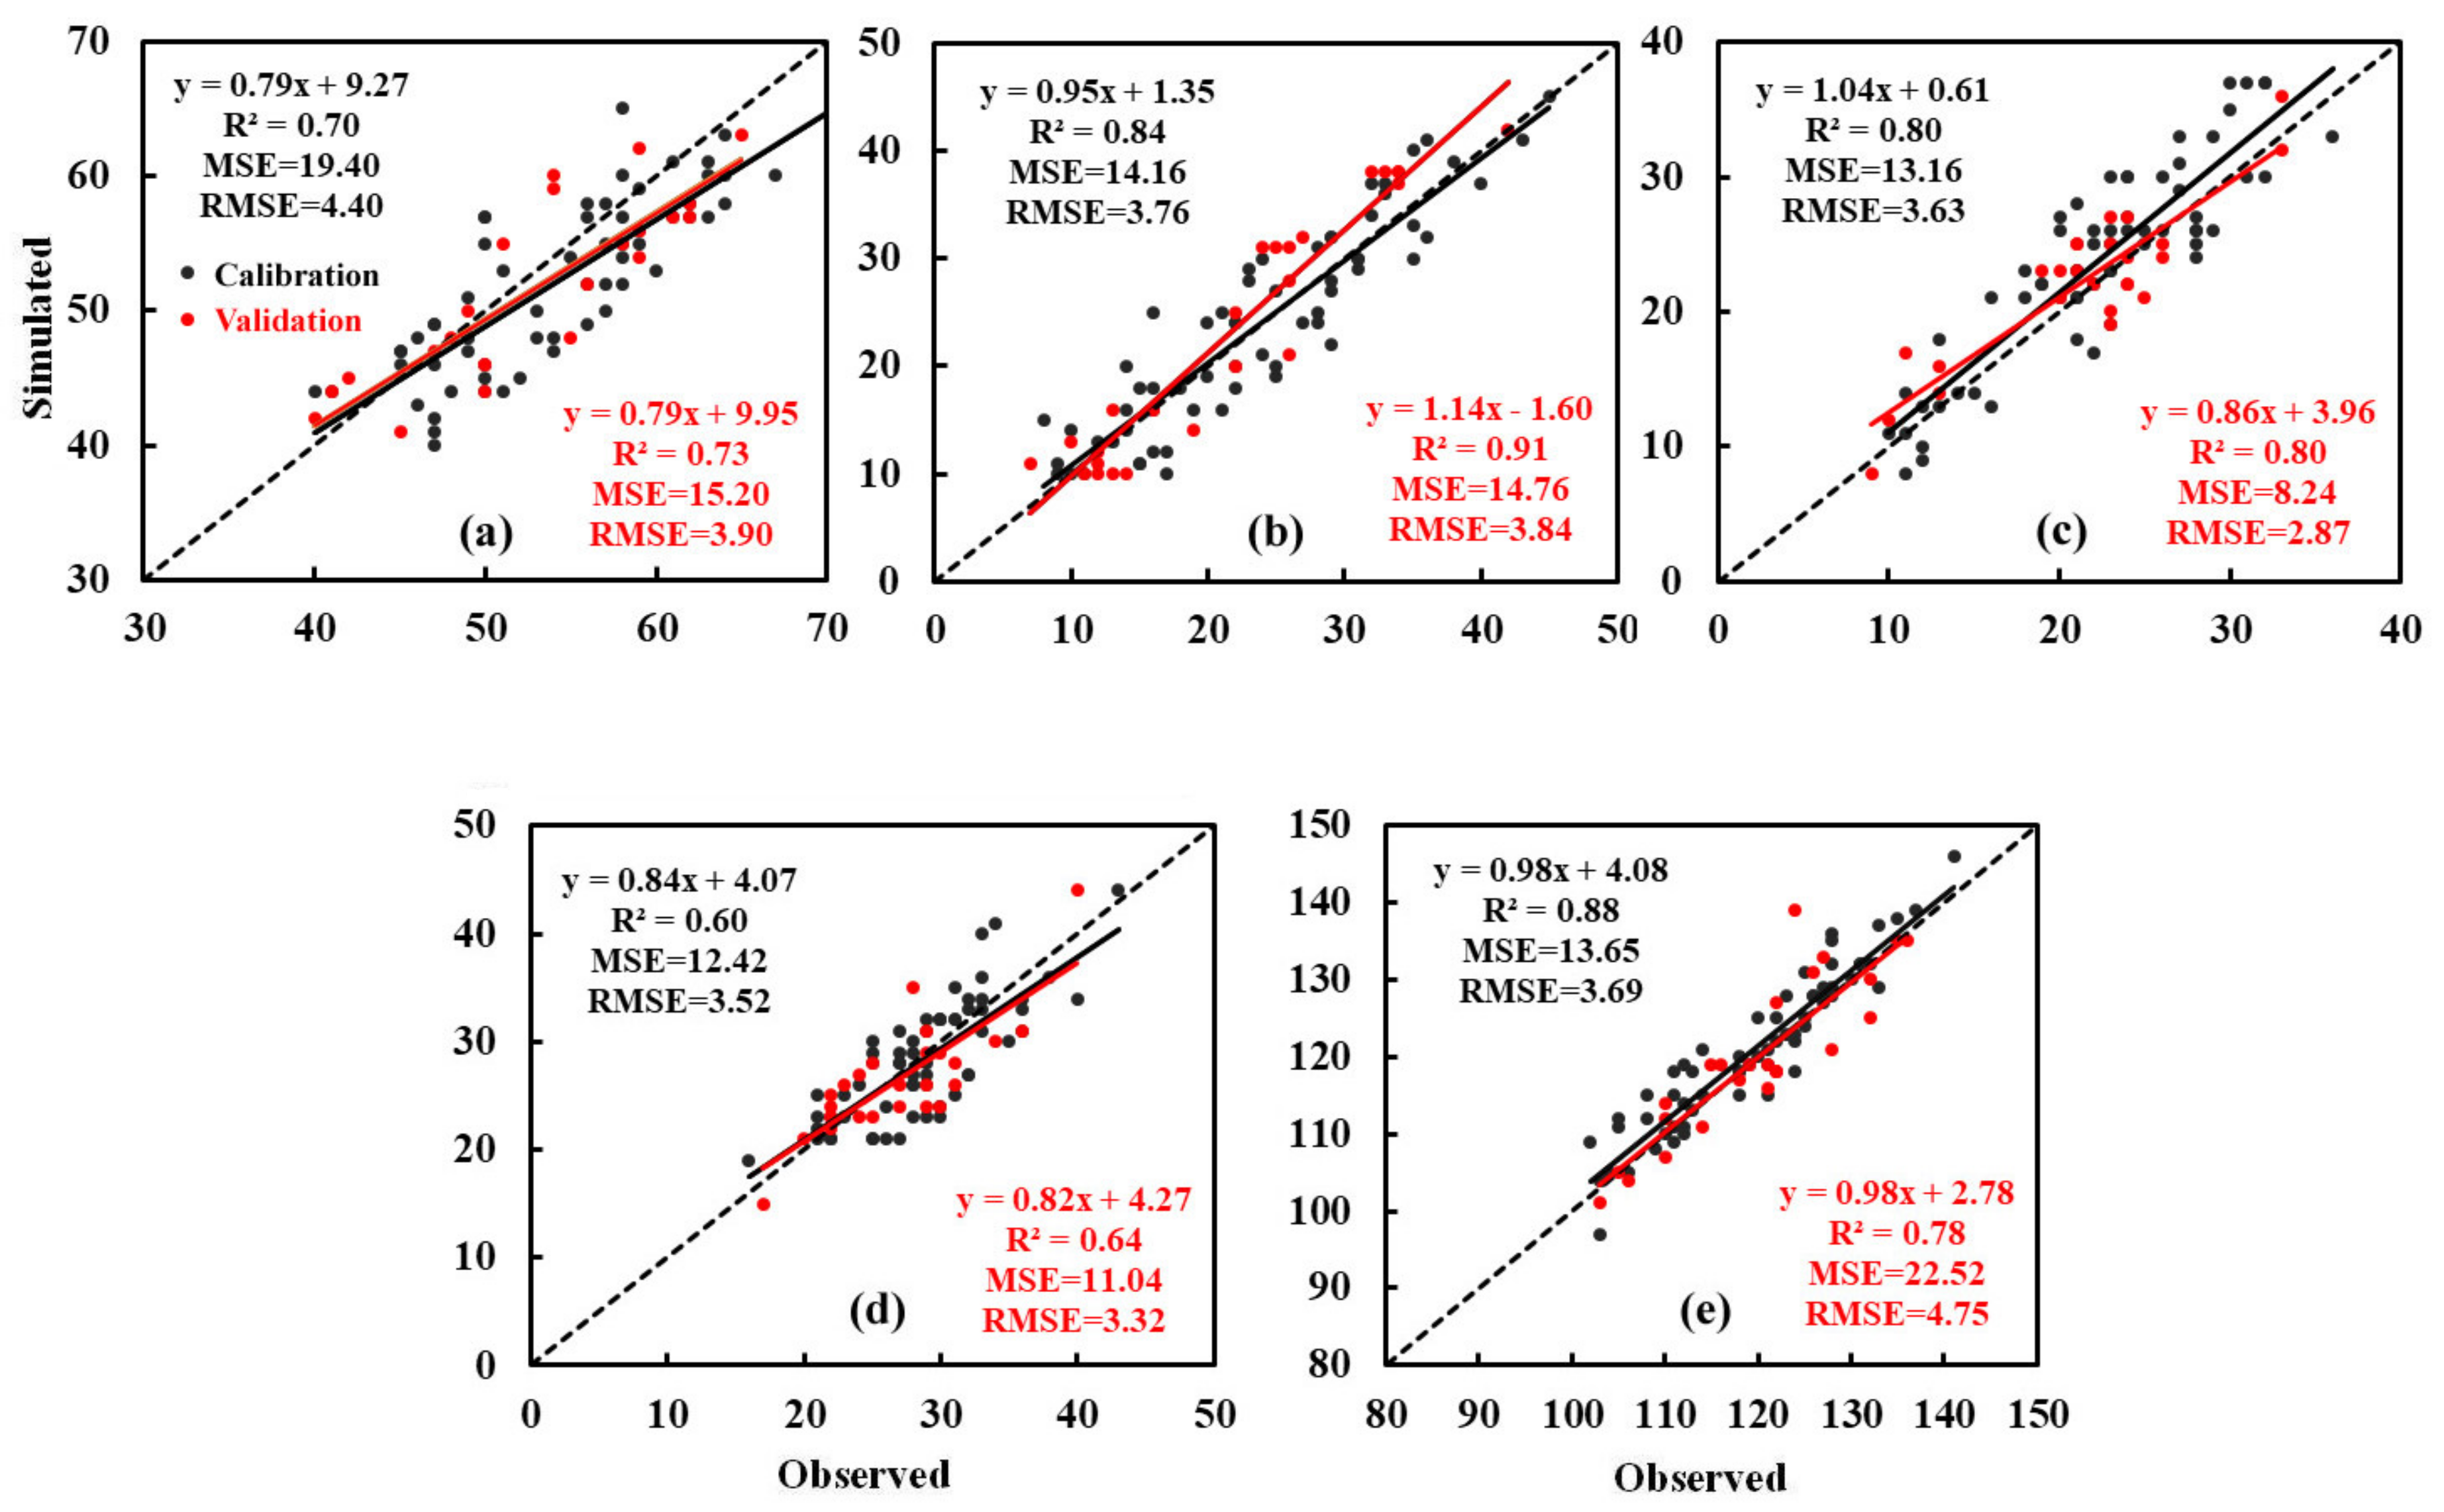
3.2. Model Calibration and Validation

APSIM-Oryza was parameterized using the observed data of Nanchang, Hengyang, and Gaoyao. We simulated the phenological phases, potential biomass, and yield for each site and compared observed and simulated growth periods for early and late rice (Figure 2 and Figure 3). The model performed well in simulating the different phenological phases, with RMSE, MSE, and R2 between 3.38 and 4.40, 11.43 and 19.40, and 0.40 and 0.89 days in the calibration dataset and 2.75 and 4.75, 7.54 and 22.52, and 0.48 and 0.91 days in the validation dataset. A similar trend was observed between the observed and simulated biomass and yield at the three study sites (Figure 4 and Figure 5). In conclusion, the APSIM-Oryza model could explain the variation of rice cultivars in terms of phenological development and capture the trend of change in both biomass and grain yield. In addition, the significant over- or underestimation in grain yield and biomass might be due to poorer management in those early years or to the cultivar changes that were not yet captured in the current simulations. Furthermore, the improvement of disease resistance in new cultivars and the inaccurate specification of model parameters that control grain number and size may also play a role in the over- or underestimation of the simulation results.

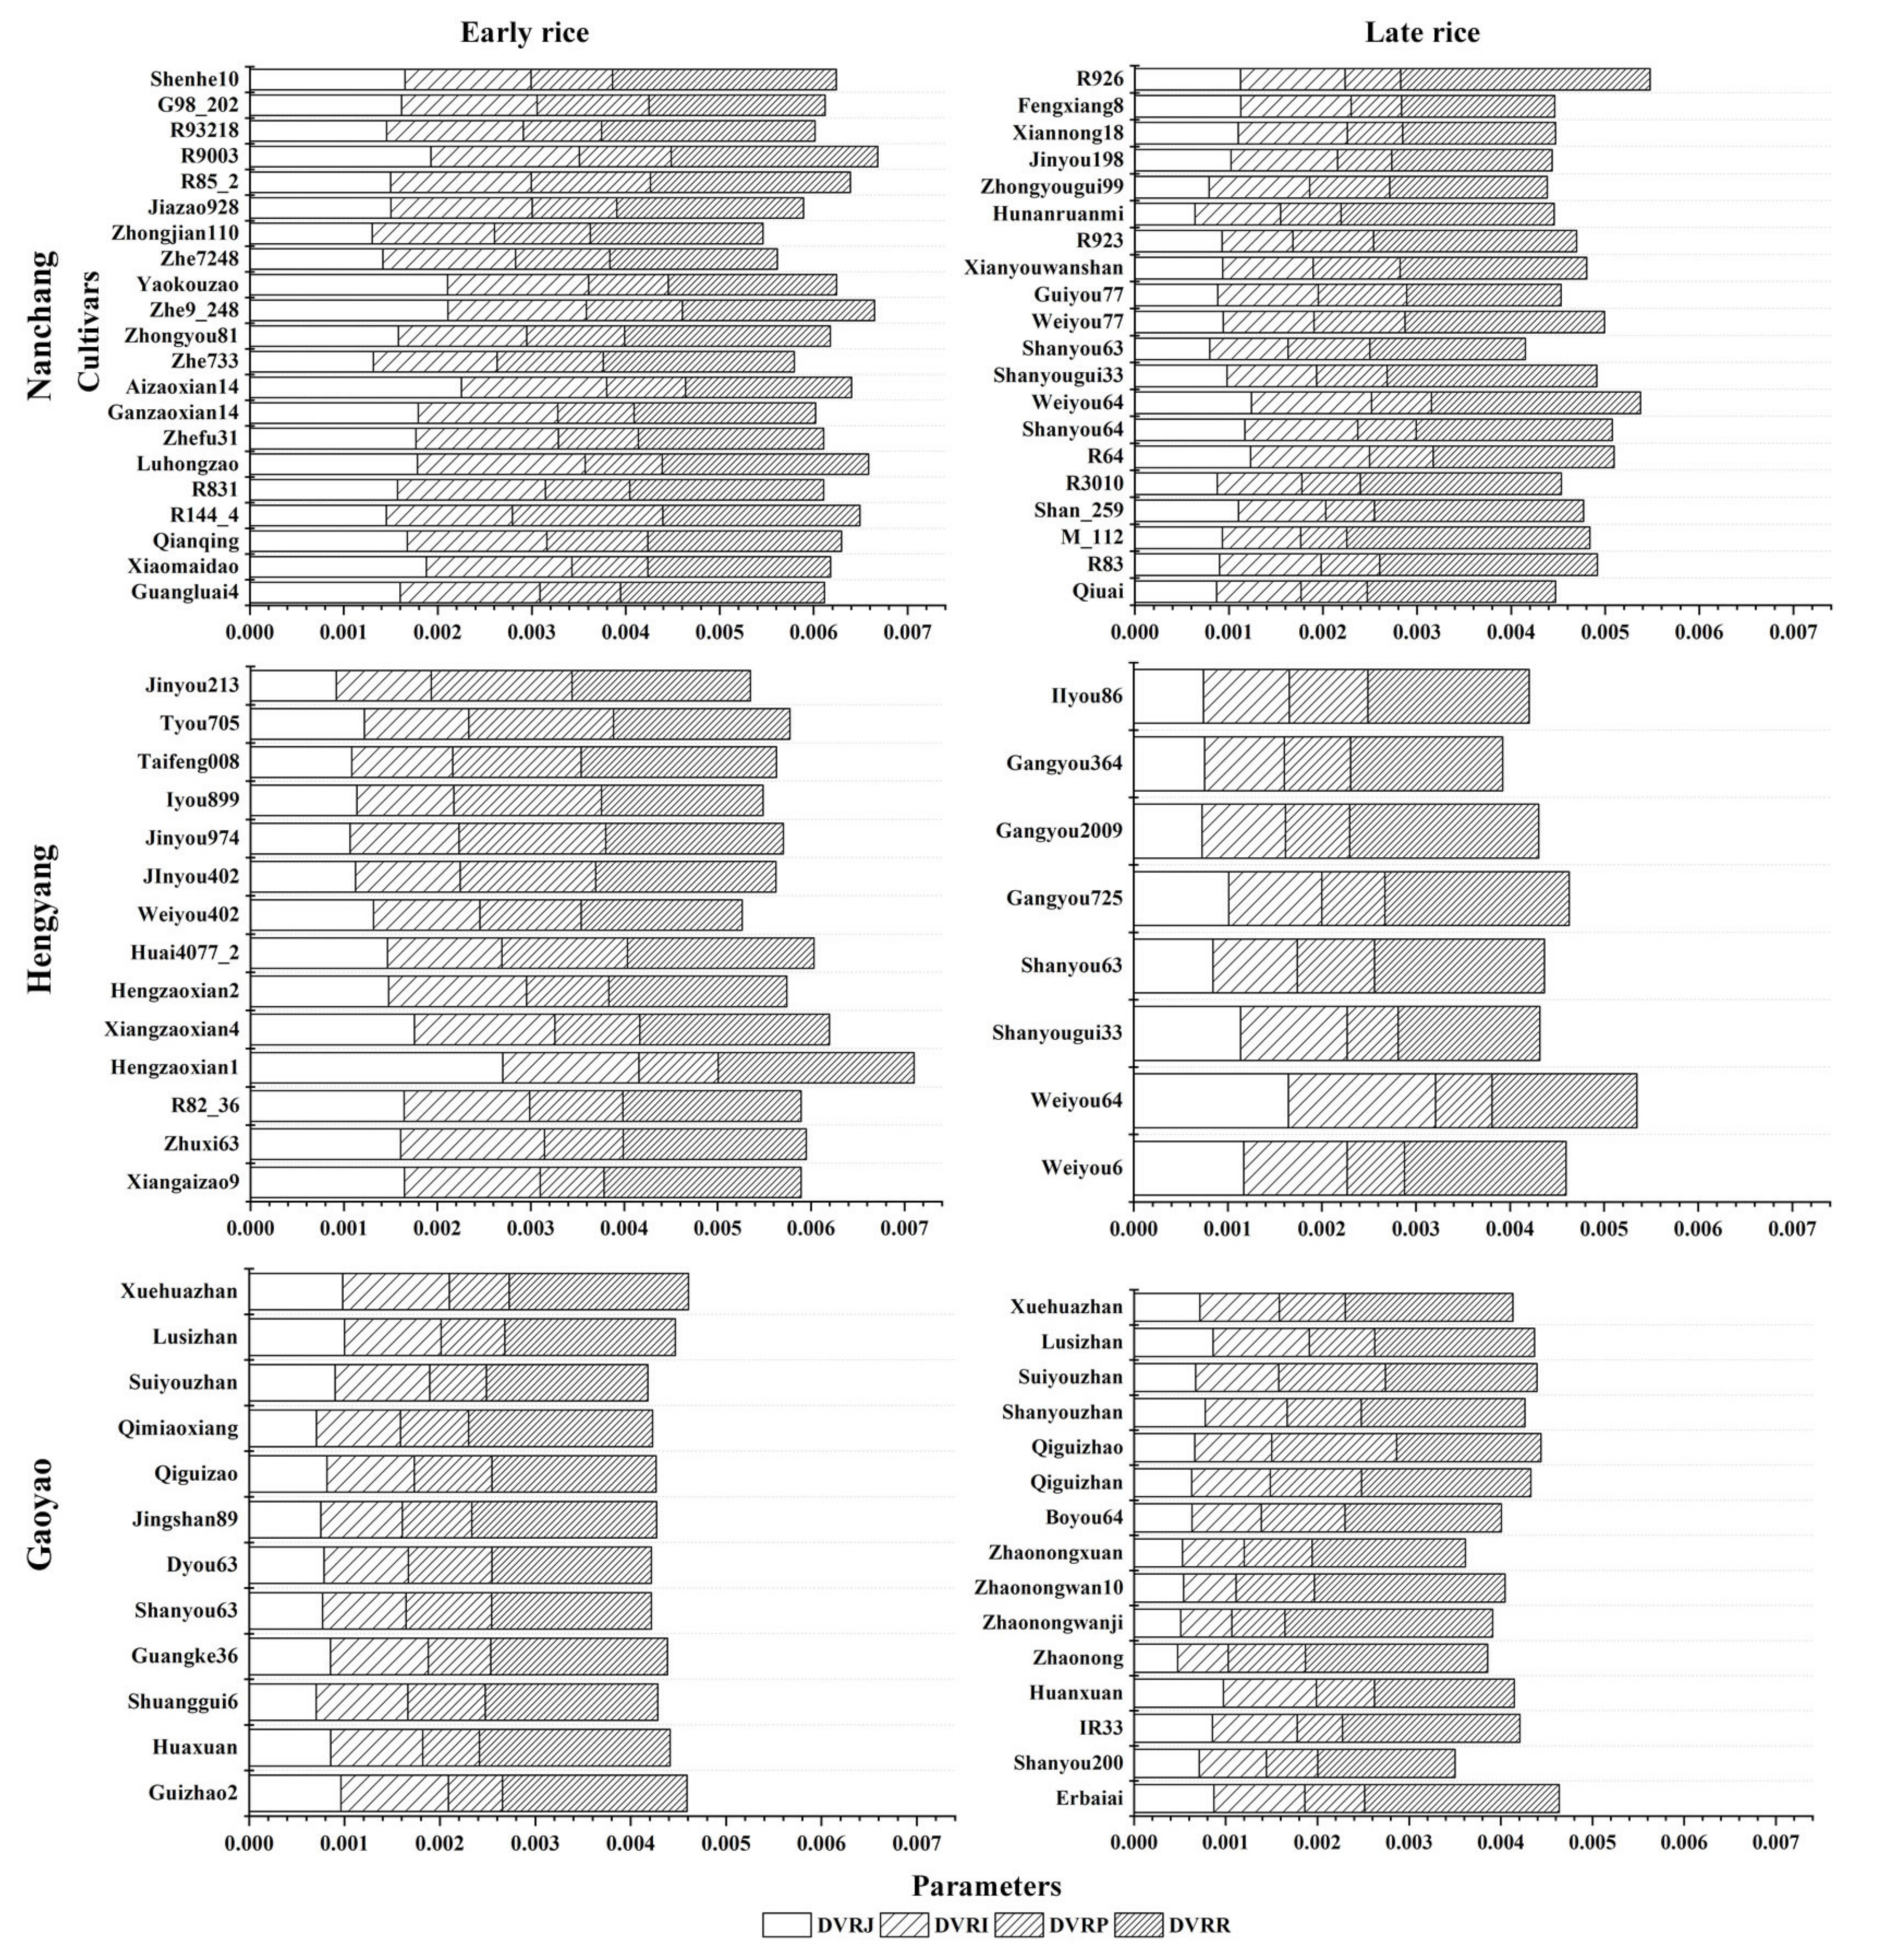
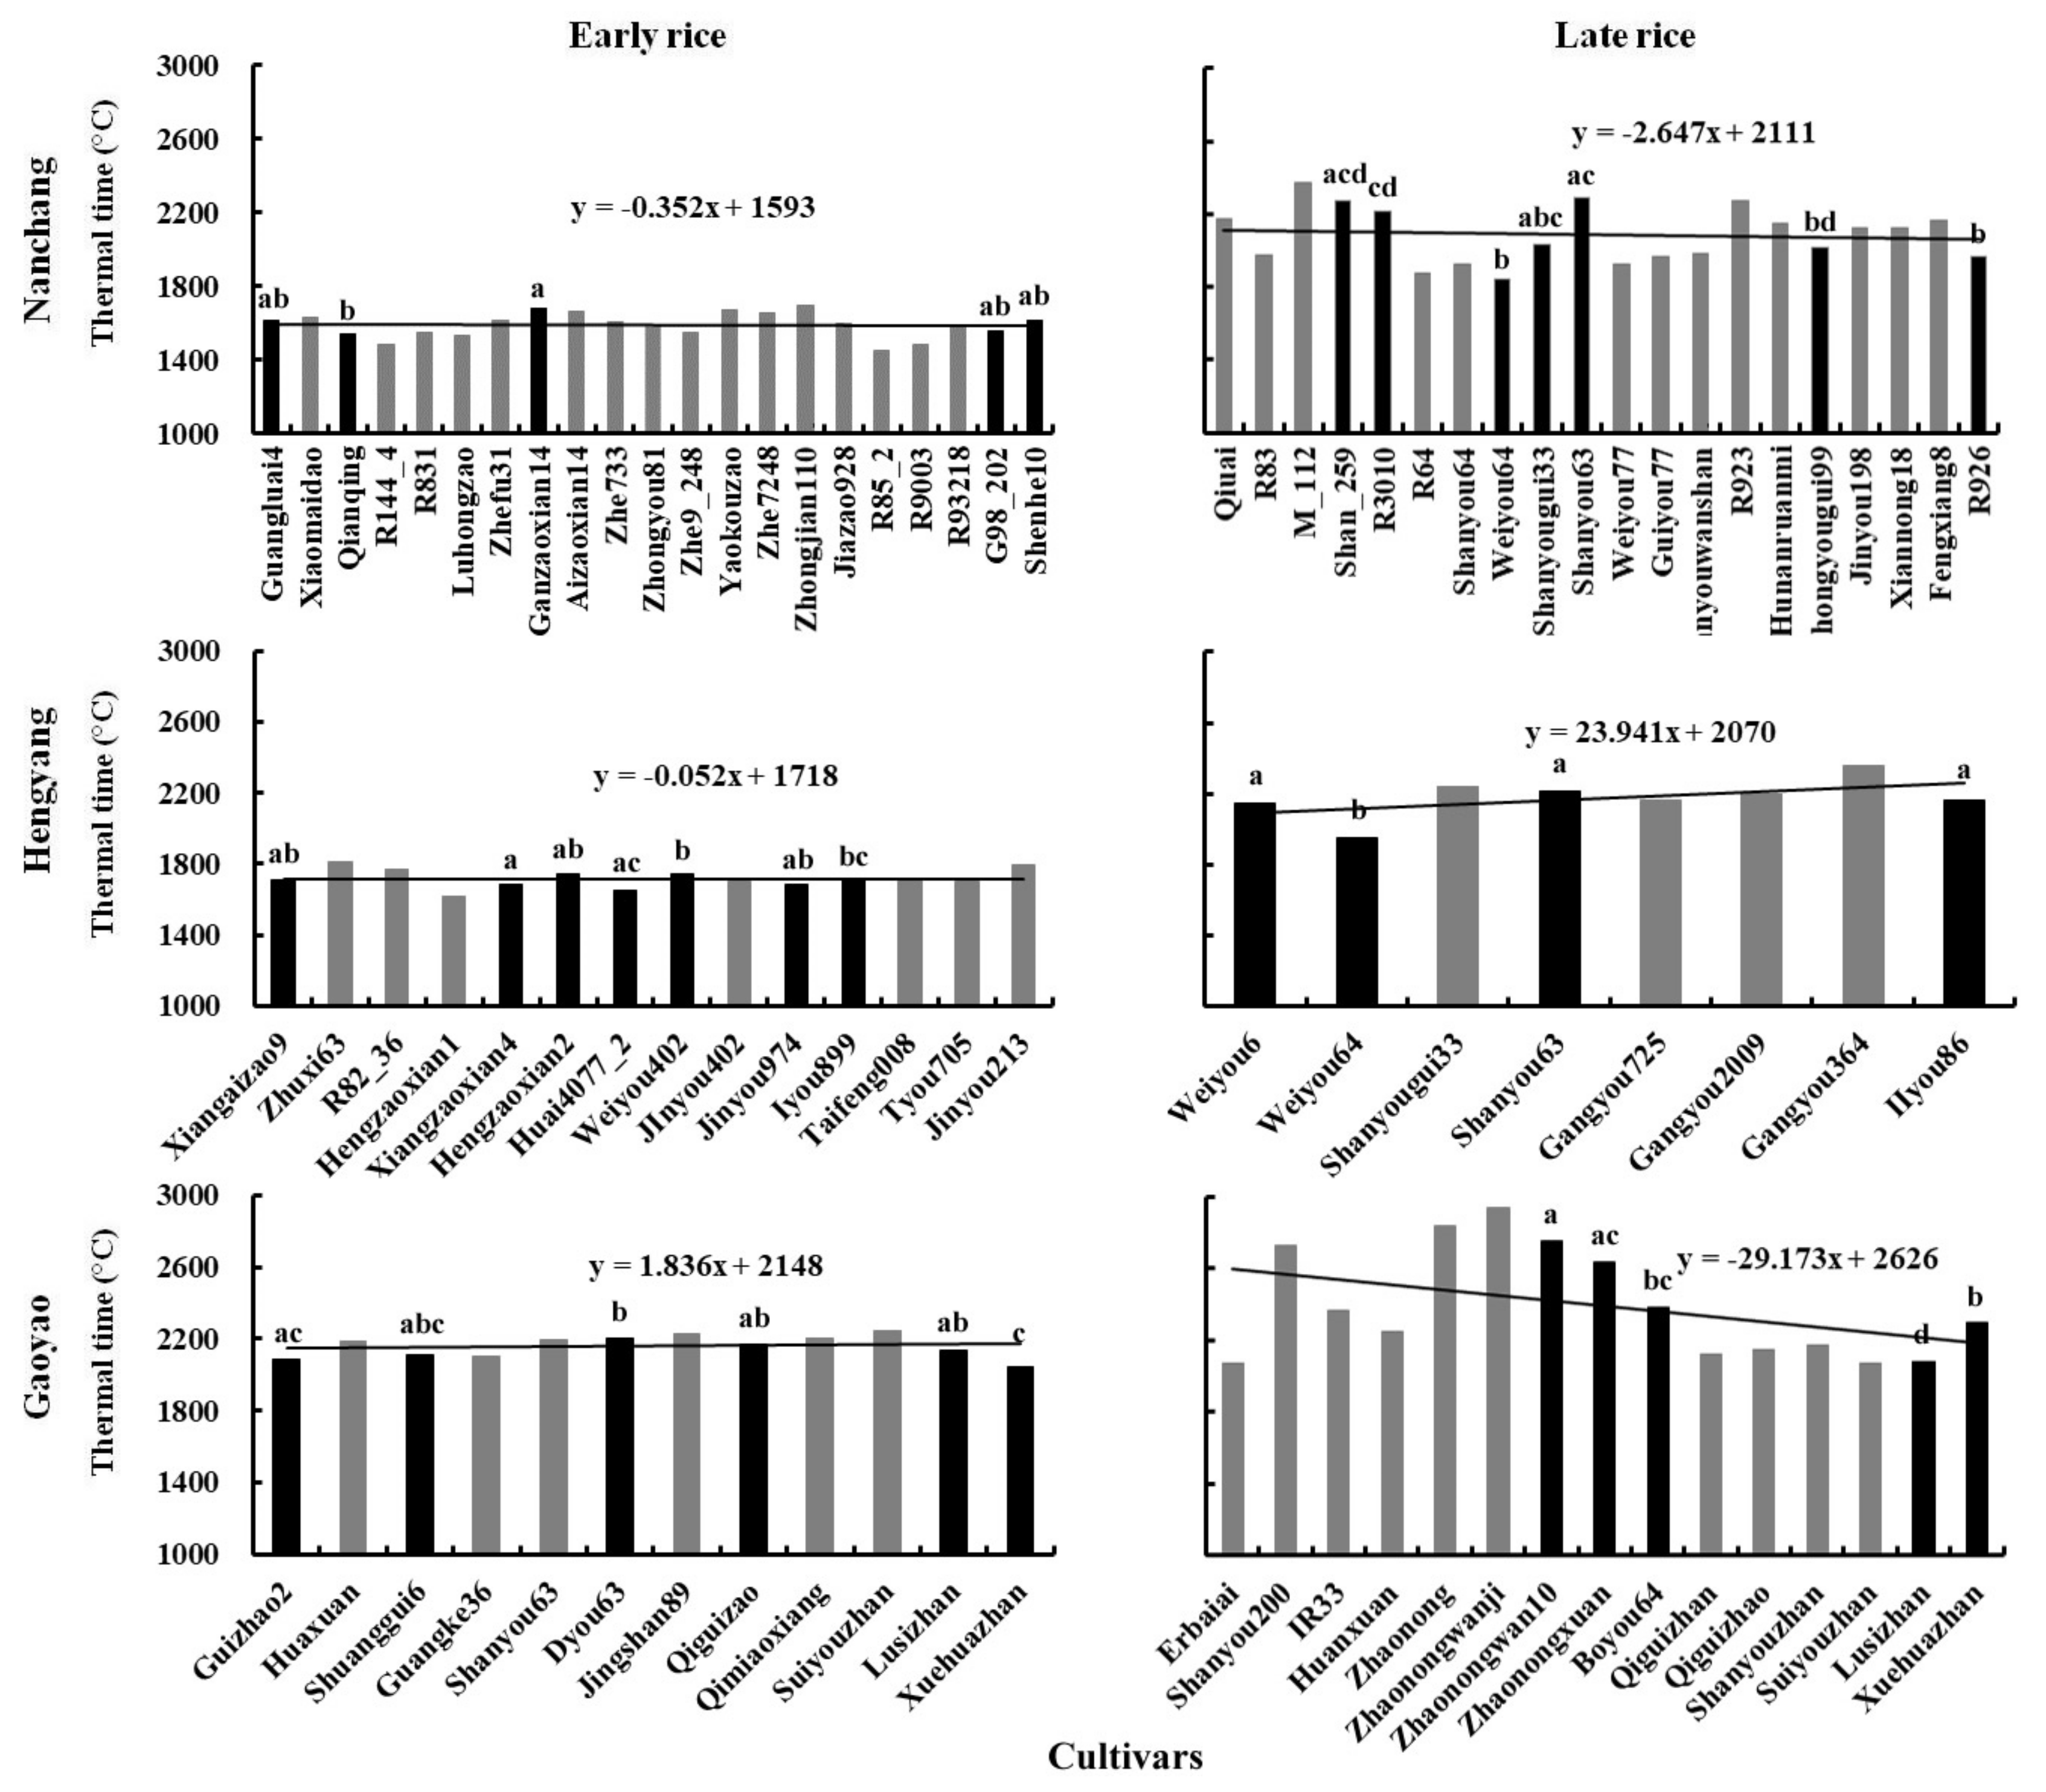
3.3. Changes in Rice Cultivars

In this study, we used the APSIM-Oryza model to derive the cultivar parameters to quantify the varietal changes of early and late rice in the study period at the three sites. The changes in the parameters among different rice cultivars at each site are shown in Table 2. From 1980 to 2009, the four parameters at Nanchang showed no significant change for both early and late rice. At Hengyang, the DVRJ and DVRI showed a significant declining trend for both early and late rice. However, the DVRP showed a significant increasing trend for early and late rice. The DVRR of early rice decreased significantly, while that of late rice increased slightly. At Gaoyao, all the parameters changed slightly; however, only DVRJ for early rice and DVRI for late rice reached a significant level. The decreased parameters indicated prolonged phenological phases. In contrast, the increase in parameters indicated shortened phenological phases. The rice cultivars used at each study site and their parameters are shown in Figure 6.
The changes of thermal time required to complete growth stages could reflect the changes of cultivars in terms of phenological development [24]. In this study, thermal time was significantly different among the different cultivars at each site (Figure 7). A declining trend in thermal time was recorded at Nanchang and Gaoyao for both early and late rice and at Hengyang for early rice; however, an increasing trend was recorded at Hengyang for late rice. The results showed that from 1980 to 2009, the cultivars’ traits significantly changed, and less thermal time was required for double rice, except for late rice at Hengyang.

3.4. Impact of Cultivars on Rice Phenology and Grain Yield

The phenology controls the life cycle of crops, the portioning of assimilates, and also determines the timing of agronomic management practices [35]. Previous studies indicated that the phenology has changed with the temperature increases in recent decades, a process that occurs worldwide in most crops [23]. The accelerated development rate caused by climate warming is often associated with a harmful effect on crop production [36]. Therefore, alteration in the duration of crop growth is an important indicator of agricultural vulnerability to climate warming and has received much attention. The duration of the observed total rice growth stage showed a declining trend at each study site, except for late rice at Hengyang (Figure 8). These changes were mainly due to the changes in climate and cultivar traits from 1981 to 2009 (Table 1 and Table 2 and Figure 8).
The global warming during 1981–2009 was found to have negatively impacted the early and late rice growth, which is in accordance with previous studies of a variety of agricultural crops that used phenological data from laboratory experiments [37], field trials [38], simulation models [20,23], and satellite observations [39,40], all of which reported that temperature increase is the most important driver of crop phenology. In spite of the evidence from previous studies that global warming leads to earlier maturation of double rice, several recently published articles have found little or no change in crop phenology in some areas [25,41,42]. By combining data analysis with crop modeling, we detected that the adoption of new rice cultivars could partially mitigate the declining trend but could not completely compensate for the negative impact observed in double rice regions. The prolonged basic vegetative phase at Nanchang and Hengyang for both early and late rice contributed to the decreasing DVRJ. The DVRI also showed a declining trend at Hengyang and Nanchang (only early rice) and led to the increase of the photoperiod formation phase. However, the DVRP showed an increasing trend at Nanchang and Hengyang, which indicates a shortened panicle formation phase due to global warming. The grain-filling phase was shortened at Nanchang (early rice) and Hengyang (late rice), as indicated by an increase in the DVRR. Generally, the entire phase (from emergence to maturity) of both early and late rice was prolonged by shifting the long-duration cultivars to adapt to climate warming. Such cultivar shifts reduced phenological sensitivity and even altered the direction of the phenological response, counteracting the supposed negative impact of climate warming [23].
Moreover, we observed an increasing trend in grain yield at all study sites (except for early rice at Hengyang; Figure 5). This may be mainly due to the changes in yield components (Table 3). The percentage of filled grains had a positive impact on early rice yield at Nanchang and Gaoyao. The grain number per spike contributed significantly to the increase in early rice yield at Gaoyao and late rice yield at each study site. The relationship between the 1000-grain weight and rice yield reached the 95% significance level for early rice at Gaoyao and late rice at Hengyang. Fischer reported that the partitioning of dry matter to growing spikes was enhanced due to the application of dwarfing genes on the crop [43]. As a result, less competition from the stems was devoted to the significant growth of spikelet and grain numbers, which contributed to the increased harvest index and grain yield. Our results on yield component changes were consistent with these findings. For early rice, the main reason for yield improvement at Nanchang and Gaoyao was the increase in the percentage of filled grains. For late rice, the primary reason for the increase in yield at Nanchang and Gaoyao was the improvement in grain number per spike.

4. Conclusions

The changes in temperature have been demonstrated to shorten the crop growth period and reduce the crop yield throughout most of the world. However, analysis of the trends in climatic change indicates that although the temperature in the entire rice growth period showed an increasing trend for both early and late rice from 1981 to 2009, only the temperatures at certain sites increased significantly. By combining the analysis of rice growth data with crop modeling to quantify the changes in double rice cultivars over three decades, we found that the adoption of new cultivars in the past decades may have partially mitigated the declining trend of growth duration and yield but could not completely compensate for the negative impact observed in double rice regions. Warming is predicted to continue for the next 20–100 years, with the warming rate depending on emission scenarios [44]. Such changes due to global warming are expected to have further negative impacts on agriculture [45,46,47,48]. Future breeding strategies should focus on extending the rice grain filling period and improving the grain number per spike to adapt to global warming.

Supplementary Materials

The following are available online at https://www.mdpi.com/2073-4395/9/12/794/s1, Table S1: Traits of the early rice cultivars at Nanchang, Table S2: Traits of the early rice cultivars at Hengyang, Table S3: Traits of the early rice cultivars at Gaoyao, Table S4: Traits of the late rice cultivars at Nanchang, Table S5: Traits of the late rice cultivars at Hengyang, Table S6: Traits of the late rice cultivars at Gaoyao.

Author Contributions

Conceptualization, L.L. and X.Q.; Funding acquisition, X.Q.; Methodology, X.Q. and L.L.; Resources, W.C. and Y.Z.; Visualization, L.L. and X.Q.; Writing—original draft, L.L. and X.Q.; Writing—review and editing, L.T. and Y.Z.

Funding

This research was supported by grants from the National Key Research and Development Program of China (No. 2017YFD0301203), and the Priority Academic Program Development of Jiangsu Higher Education Institutions (PAPD).

Acknowledgments

We thank the AgMIP research community for their contributions to this effort.

Conflicts of Interest

The authors declare no conflict of interest.

References

  1. Yuan, L.P. Development of Hybrid Rice to Ensure Food Security. Rice Sci. 2014, 21, 1–2. [Google Scholar] [CrossRef]
  2. Nguyen, N.V.; Ferrero, A. Meeting the challenges of global rice production. Paddy Water Environ. 2006, 4, 1–9. [Google Scholar] [CrossRef]
  3. Awika, J.M. Major Cereal grains production and use around the world. In Advances in Cereal Science: Implications to Food Processing and Health Promotion; Awika, J.M., Piironen, V., Bean, S., Eds.; American Chemical Society: Washington, DC, USA, 2011; Volume 1089, pp. 1–13. ISBN 978-0-8412-2636-4. [Google Scholar]
  4. Coats, B. Global rice production. In Rice: Origin, History, Technology, and Production; Smith, C.W., Dilday, R.H., Eds.; John Wiley & Sons, Inc.: Hoboken, NJ, USA, 2002; pp. 247–470. ISBN 978-0-471-34516-9. [Google Scholar]
  5. FAOSTAT 2017. Available online: http://www.fao.org/faostat/en/#data/QC (accessed on 13 May 2019).
  6. Xie, Z.; Tu, S.; Shah, F.; Xu, C.; Chen, J.; Han, D.; Liu, G.; Li, H.; Muhammad, I.; Cao, W. Substitution of fertilizer-N by green manure improves the sustainability of yield in double-rice cropping system in south China. Field Crops Res. 2016, 188, 142–149. [Google Scholar] [CrossRef]
  7. Bi, L.; Zhang, B.; Liu, G.; Li, Z.; Liu, Y.; Ye, C.; Yu, X.; Lai, T.; Zhang, J.; Yin, J.; et al. Long-term effects of organic amendments on the rice yields for double rice cropping systems in subtropical China. Agric. Ecosyst. Environ. 2009, 129, 537–541. [Google Scholar] [CrossRef]
  8. Peng, S.; Khush, G.S.; Virk, P.; Tang, Q.; Zou, Y. Progress in ideotype breeding to increase rice yield potential. Field Crops Res. 2008, 108, 32–38. [Google Scholar] [CrossRef]
  9. Zhang, W.; Yu, Y.; Huang, Y.; Li, T.; Wang, P. Modeling methane emissions from irrigated rice cultivation in China from 1960 to 2050. Global Chang. Biol. 2011, 17, 3511–3523. [Google Scholar] [CrossRef]
  10. National Bureau of Statistics. Agriculture. In China Statistical Yearbook 2018; China Statistics Press: Beijing, China, 2018; pp. 401–408. ISBN 978-7-5037-8587-0. [Google Scholar]
  11. Peng, S.B.; Tang, Q.Y.; Zou, Y.B. Current Status and Challenges of Rice Production in China. Plant Prod. Sci. 2009, 12, 3–8. [Google Scholar] [CrossRef]
  12. Mohanty, S.; Wailes, E.; Chavez, E. The global rice supply and demand outlook: The need for greater productivity growth to keep rice affordable. In Rice in the Global Economy: Strategic Research and Policy Issues for Food Security; Pandey, S., Byerlee, D., Dawe, D., Eds.; IRRI: Metro Manila, Philippines, 2010; pp. 175–187. ISBN 978-971-22-0258-2. [Google Scholar]
  13. Cubasch, U.; Meehl, G.A. Projections of future climate change. In Climate Change 2001: The Scientific Basis; Houghton, J.T., Ding, Y., Griggs, D.J., Eds.; Cambridge University Press: Cambridge, UK, 2001; pp. 525–582. ISBN 0521-01495-6. [Google Scholar]
  14. Rahmstorf, S.; Cazenave, A.; Church, J.A.; Hansen, J.E.; Keeling, R.F.; Parker, D.E.; Somerville, R.C. Recent climate observations compared to projections. Science 2007, 316, 709. [Google Scholar] [CrossRef]
  15. Ding, Y.H.; Ren, G.Y.; Shi, G.Y.; Gong, P.; Zheng, X.H.; Zhai, P.M.; Zhang, D.E.; Zhao, Z.C.; Wang, S.W.; Wang, H.J.; et al. National assessment report of climate change (I): Climate change in China and its future trend. Adv. Clim. Chang. Res. 2006, 2, 3–8. [Google Scholar]
  16. Piao, S.; Ciais, P.; Huang, Y.; Shen, Z.; Peng, S.; Li, J.; Zhou, L.; Liu, H.; Ma, Y.; Ding, Y.; et al. The impacts of climate change on water resources and agriculture in China. Nature 2010, 467, 43–51. [Google Scholar] [CrossRef]
  17. Zhao, C.; Liu, B.; Piao, S.; Wang, X.; Lobell, D.B.; Huang, Y.; Huang, M.; Yao, Y.; Bassu, S.; Ciais, P.; et al. Temperature increase reduces global yields of major crops in four independent estimates. Proc. Natl. Acad. Sci. USA 2017, 114, 9326–9331. [Google Scholar] [CrossRef] [PubMed]
  18. Wheeler, T.; Braun, J.V. Climate Change Impacts on Global Food Security. Science 2013, 341, 508–513. [Google Scholar] [CrossRef] [PubMed]
  19. Zhu, D.F.; Min, S.K. Rice production in China under current and future climates. In Modeling the Impact of Climate Change on Rice Production in Asia; Matthew, R.B., Kropff, M.J., Bachelet, D., Eds.; CAB International: Wallingford, UK, 1995; pp. 217–235. ISBN 0-85198-959-4. [Google Scholar]
  20. Liu, L.; Wang, E.; Zhu, Y.; Tang, L.; Cao, W. Effects of warming and autonomous breeding on the phenological development and grain yield of double-rice systems in China. Agric. Ecosyst. Environ. 2013, 165, 28–38. [Google Scholar] [CrossRef]
  21. Peng, S.; Cassman, K.G.; Virmani, S.S.; Sheehy, J.; Khush, G.S. Yield potential trends of tropical rice since the release of IR8 and the challenge of increasing rice yield potential. Crop Sci. 1999, 39, 1552–1559. [Google Scholar] [CrossRef]
  22. Zhou, Y.; He, Z.H.; Sui, X.X.; Xia, X.C.; Zhang, X.K.; Zhang, G.S. Genetic improvement of grain yield and associated traits in the northern china winter wheat region from 1960 to 2000. Crop Sci. 2007, 47, 245–253. [Google Scholar] [CrossRef]
  23. Zhang, T.Y.; Huang, Y.; Yang, X.G. Climate warming over the past three decades has shortened rice growth duration in China and cultivar shifts have further accelerated the process for late rice. Glob. Chang. Biol. 2013, 19, 563–570. [Google Scholar] [CrossRef]
  24. Liu, L.; Wang, E.; Zhu, Y.; Tang, L.; Cao, W. Quantifying three-decade changes of single rice cultivars in China using crop modeling. Field Crops Res. 2013, 149, 84–94. [Google Scholar] [CrossRef]
  25. Liu, L.; Wang, E.; Zhu, Y.; Tang, L. Contrasting effects of warming and autonomous breeding on single-rice productivity in China. Agric. Ecosyst. Environ. 2012, 149, 20–29. [Google Scholar] [CrossRef]
  26. Gaydon, D.S.; Probert, M.E.; Buresh, R.J.; Meinke, H.; Suriadi, A.; Dobermann, A.; Bouman, B.; Timsina, J. Rice in cropping systems-Modelling transitions between flooded and non-flooded soil environments. Eur. J. Agron. 2012, 39, 9–24. [Google Scholar] [CrossRef]
  27. Bouman, B.A.M.; Laar, H.H.V. Description and evaluation of the rice growth model ORYZA2000 under nitrogen-limited conditions. Agric. Syst. 2006, 87, 249–273. [Google Scholar] [CrossRef]
  28. Keating, B.A.; Carberry, P.S.; Hammer, G.L.; Probert, M.E.; Robertson, M.J.; Holzworth, D.; Huth, N.I.; Hargreaves, J.N.; Meinke, H.; Hochman, Z.; et al. An overview of APSIM, a model designed for farming systems simulation. Eur. J. Agron. 2003, 18, 3–4. [Google Scholar] [CrossRef]
  29. Zhang, X.; Lee, J.H.; Abawi, Y.; Kim, Y.H.; McClymont, D.; Kim, H.D. Testing the simulation capability of APSIM-ORYZA under different levels of nitrogen fertiliser and transplanting time regimes in Korea. Aust. J. Exp. Agric. 2007, 47, 1446–1454. [Google Scholar] [CrossRef]
  30. Amarasingha, R.P.R.K.; Suriyagoda, L.D.B.; Marambe, B.; Gaydon, D.S.; Galagedara, L.W.; Punyawardena, R.; Silva, G.L.L.P.; Nidumolu, U.; Howden, M. Simulation of crop and water productivity for rice (Oryza sativa L.) using APSIM under diverse agro-climatic conditions and water management techniques in Sri Lanka. Agric. Water Manag. 2015, 160, 132–143. [Google Scholar] [CrossRef]
  31. Tao, F.; Yokozawa, M.; Xu, Y.; Hayashi, Y.; Zhang, Z. Climate changes and trends in phenology and yields of field crops in China, 1981–2000. Agric. Forest Meteorol. 2006, 138, 82–92. [Google Scholar] [CrossRef]
  32. Lobell, D.B.; Field, C.B. Global scale climate–crop yield relationships and the impacts of recent warming. Environ. Res. Lett. 2007, 2, 014002. [Google Scholar] [CrossRef]
  33. Sun, T.; Hasegawa, T.; Tang, L.; Wang, W.; Zhou, J.; Liu, L.; Liu, B.; Cao, W.; Zhu, Y. Stage-dependent temperature sensitivity function predicts seed-setting rates under short-term extreme heat stress in rice. Agric. Forest Meteorol. 2018, 256, 196–206. [Google Scholar] [CrossRef]
  34. Jing, Q.; Bouman, B.A.M.; Hengsdijk, H.; Van Keulen, H.; Cao, W. Exploring options to combine high yields with high nitrogen use efficiencies in irrigated rice in China. Eur. J. Agron. 2007, 26, 166–177. [Google Scholar] [CrossRef]
  35. Menzel, A.; Sparks, T.H.; Estrella, N.; Koch, E.; Aasa, A.; Ahas, R.; Alm-Kübler, K.; Bissolli, P.; Braslavská, O.G.; Briede, A.; et al. European phenological response to climate change matches the warming pattern. Glob. Chang. Biol. 2006, 12, 1969–1976. [Google Scholar] [CrossRef]
  36. Challinor, A.J.; Wheeler, T.R.; Craufurd, P.Q.; Ferro, C.A.T.; Stephenson, D.B. Adaptation of crops to climate change through genotypic responses to mean and extreme temperatures. Agric. Ecosyst. Environ. 2007, 119, 190–204. [Google Scholar] [CrossRef]
  37. Yin, X.Y.; Kropff, M.J.; Goudriaan, J. Differential effects of day and night temperature on development to flowering in rice. Ann. Bot. 1996, 77, 203–213. [Google Scholar] [CrossRef]
  38. De Vries, M.E.; Leffelaar, P.A.; Sakane, N.; Bado, B.V.; Giller, K.E. Adaptability of irrigated rice to temperature change in Sahelian environments. Exp. Agric. 2011, 47, 69–87. [Google Scholar] [CrossRef]
  39. Li, Z.; Tang, H.; Yang, P.; Wu, W.; Chen, Z.; Zhou, Q.; Zhang, L.; Zou, J. Spatio-temporal responses of cropland phenophases to climate change in Northeast China. J. Geogr. Sci. 2012, 22, 29–45. [Google Scholar] [CrossRef]
  40. Lobell, D.B.; Sibley, A.; Ivan, O.J. Extreme heat effects on wheat senescence in India. Nat. Clim. Chang. 2012, 2, 186–189. [Google Scholar] [CrossRef]
  41. Liu, Y.; Wang, E.; Yang, X.; Wang, J. Contributions of climatic and crop varietal changes to crop production in the North China Plain, since 1980s. Glob. Chang. Biol. 2010, 16, 2287–2299. [Google Scholar] [CrossRef]
  42. Sacks, W.J.; Kucharik, C.J. Crop management and phenology trends in the U.S. Corn Belt: Impacts on yields, evapotranspiration and energy balance. Agric. Forest Meteorol. 2011, 151, 882–894. [Google Scholar] [CrossRef]
  43. Fischer, R.A. Wheat physiology: A review of recent developments. Crop Pasture Sci. 2011, 62, 95–114. [Google Scholar] [CrossRef] [Green Version]
  44. Ding, Y.; Ren, G.; Zhao, Z.; Xu, Y.; Luo, Y.; Li, Q.; Zhang, J. Detection, causes and projection of climate change over China: An overview of recent progress. Adv. Atmos. Sci. 2007, 24, 954–971. [Google Scholar] [CrossRef]
  45. Peng, S.; Huang, J.; Sheehy, J.E.; Laza, R.C.; Visperas, R.M.; Zhong, X.; Centeno, G.S.; Khush, G.S.; Cassman, K.G. Rice yields decline with higher night temperature from global warming. Proc. Natl. Acad. Sci. USA 2004, 101, 9971–9975. [Google Scholar] [CrossRef] [Green Version]
  46. Asseng, S.; Ewert, F.; Martre, P.; Rötter, R.P.; Lobell, D.B.; Cammarano, D.; Kimball, B.A.; Ottman, M.J.; Wall, G.W.; White, J.W.; et al. Rising temperatures reduce global wheat production. Nat. Clim. Chang. 2015, 5, 143–147. [Google Scholar] [CrossRef]
  47. Lin, E.D.; Xu, Y.L.; Jiang, J.H.; Li, Y.E.; Yang, X.; Zhang, J.Y.; Li, C.X.; Wu, S.H.; Zhao, Z.Q.; Wu, J.G.; et al. National Assessment Report of Climate Change (II): Climate change impacts and adaptation. Adv. Clim. Chang. Res. 2006, 2, 51–56. [Google Scholar]
  48. Jiao, H.Y.; Zhou, G.S.; Zhang, Z.Q.; Jiao, M.Y.; Zhou, G.S.; Chen, Z.L.; Chen, C.; Fang, S.B.; Guo, J.P.; Huo, Z.G.; et al. Assessment Report of Climate Change Impacts on Agriculture in China (No.1); Social Sciences Academic Press (China): Beijing, China, 2014; pp. 49–60. ISBN 978-7-5097-6216-5. [Google Scholar]
Figure 1. Regionalization of rice cropping in China and the three study sites (province names are shown in capital letters and parentheses).
Agronomy 09 00794 g001
Figure 2. Observed versus simulated early rice growth periods at three study sites (1981–2009): (a) BVP, (b) PSP, (c) PFP, (d) GFP, and (e) EM.
Agronomy 09 00794 g002
Figure 3. Observed versus simulated late rice growth periods at three study sites (1981–2009): (a) BVP, (b) PSP, (c) PFP, (d) GFP, and (e) EM.
Agronomy 09 00794 g003
Figure 4. Simulated potential and observed biomass at the study sites.
Agronomy 09 00794 g004
Figure 5. Simulated potential and observed yield at the study sites.
Agronomy 09 00794 g005
Figure 6. Parameters of the rice cultivars at three study sites.
Agronomy 09 00794 g006
Figure 7. Changes in thermal time among different cultivars from 1981 to 2009. Cultivars planted for only one year were eliminated from variance analysis. The black bar indicates that the cultivar was planted more than one year, and the gray bar indicates that the cultivar was planted for only one year. The different letters above the bars indicate significant differences at p < 0.05.
Agronomy 09 00794 g007
Figure 8. Duration of observed rice stages from 1981 to 2009. + indicates BVP, indicates PSP, indicates PFP, × indicates GFP, and ● indicates EM. Straight lines show the linear trends against year. ** Significant at p < 0.01 and * significant at p < 0.05.
Agronomy 09 00794 g008
Table 1. Trends in maximum, average, and minimum temperatures during the different rice growth stages at three study sites (1981–2009).
SitesTemperature (°C/y)BVPPSPPFPGFPEM
Early riceNanchangMaximumy = 0.047x − 69.5y = −0.012x + 53.6y = 0.045x − 59.2y = 0.002x + 28.3y = 0.024x − 20.9
Averagey = 0.037x − 52.6y = −0.015x + 54.5y = 0.035x − 42.9y = 0.007x + 13.8y = 0.018x − 12.1
Minimumy = 0.026x − 34.5y = −0.002x + 25.6y = 0.022x − 19.9y = 0.011x + 2.4y = 0.013x − 4.8
HengyangMaximumy = 0.094**x − 161.5y = 0.078x − 131.4y = −0.031x + 94.1y = −0.010x + 54.3y = 0.037*x − 47.6
Averagey = 0.081**x − 139.2y = 0.081*x − 141.4y = −0.011x + 49.5y = 0.005x + 19.5y = 0.033**x − 44.9
Minimumy = 0.073**x − 126.9y = 0.080**x − 142.0y = 0.003x + 18.6y = 0.016x − 7.2y = 0.032**x − 45.2
GaoyaoMaximumy = 0.022x − 17.5y = 0.003x + 24.3y = −0.010x + 51.6y = −0.031x + 94.9y = 0.009x + 10.7
Averagey = 0.007x + 8.5y = −0.006x + 38.1y = −0.033x + 92.6y = −0.024x + 76.7y = 0.001x + 27.7
Minimumy = −0.006x + 31.6y = −0.001x + 25.2y = −0.037*x + 98.3y = −0.018x + 60.9y = −0.007x + 36.5
Late riceNanchangMaximumy = 0.002x + 30.1y = 0.043x − 54.6y = 0.110*x − 197.9y = 0.189**x − 351.2y = 0.075**x − 117.9
Averagey = 0.015x + 0.08y = 0.044x − 58.9y = 0.107**x − 188.7y = 0.179**x − 336.8y = 0.076**x − 125.8
Minimumy = 0.023x − 19.1y = 0.047x − 68.2y = 0.104**x − 192.0y = 0.167**x − 326.4y = 0.078**x − 132.3
HengyangMaximumy = −0.014x + 62.2y = −0.097*x + 232.1y = −0.005x + 40.3y = 0.073x − 125.7y = 0.031x − 32.0
Averagey = 0.001x + 27.8y = −0.074*x + 180.6y = −0.008x + 41.5y = 0.076*x − 129.4y = 0.038x − 52.2
Minimumy = 0.011x + 3.1y = −0.047*x + 121.6y = −0.018x + 59.1y = 0.064*x − 114.4y = 0.040*x − 60.4
GaoyaoMaximumy = 0.011x + 10.6y = 0.062*x − 97.2y = 0.067*x − 107.1y = 0.121**x − 222.2y = 0.041**x − 53.2
Averagey = 0.003x + 22.9y = 0.053*x − 81.5y = 0.071**x − 120.4y = 0.132**x − 249.4y = 0.039*x − 52.7
Minimumy = 0.001x + 24.5y = 0.048x − 73.5y = 0.063**x − 106.6y = 0.129**x − 245.9y = 0.035**x − 47.7
** Significant at p < 0.01; *Significant at p < 0.05. Abbreviations: Basic vegetative phase (BVP); from emergence to the start of the photoperiod-sensitive phase. Photoperiod-sensitive phase (PSP); from the end of the basic vegetative phase to panicle initiation. Panicle formation phase (PFP); from panicle initiation to flowering. Grain-filling phase (GFP); from flowering to physiological maturity. From emergence to maturity (EM).
Table 2. Changes in rice parameters at the three study sites (1981–2009).
SitesDVRJDVRIDVRPDVRR
Early riceNanchang−0.09−0.290.040.23
Hengyang−0.75**−0.87**0.74**−0.45*
Gaoyao0.41*0.10−0.02−0.06
Late riceNanchang−0.020.200.18−0.11
Hengyang−0.72**−0.60**0.39*0.34
Gaoyao0.220.42*0.000.00
** Significant at p < 0.01; * Significant at p < 0.05. Abbreviations: Development rate during the juvenile phase (DVRJ). Development rate during the photoperiod-sensitive phase (DVRI). Development rate during the panicle development phase (DVRP). Development rate in the reproductive phase (DVRR).
Table 3. Results of stepwise multilinear regression (above 95% significance level) between yield components (percentage of filled grains, grain number per spike, and 1000-grain weight) and grain yield of rice (1981–2009).
SitesPercentage of Filled Grains (%)Grain Number Per Spike1000-Grain Weight (g)B0R2
Early riceNanchang0.27--00.70
Hengyang
Gaoyao0.680.410.3900.73
Late riceNanchang-0.19-00.64
Hengyang-0.110.5700.63
Gaoyao-0.28-00.49
B0, intercept of the linear regression equation.

