Article

Long-Term Mineral Fertilization Improved the Grain Yield and Phosphorus Use Efficiency by Changing Soil P Fractions in Ferralic Cambisol

1
National Engineering Laboratory for Improving Quality of Arable Land; Institute of Agricultural Resources and Regional Planning, Chinese Academy of Agricultural Sciences, Beijing 100081, China
2
National Engineering and Technology Research Centre for Red Soil Improvement; Jiangxi Institute of Red Soil, Nanchang 331717, China
3
National Observation Station of Qiyang Agri-ecology System; Institute of Agricultural Resources and Regional Planning, Chinese Academy of Agricultural Sciences, Qiyang 426182, China
4
Institute of Soil, Fertilizer and Agricultural Water Conservation, Xinjiang Academy of Agricultural Sciences, Urumqi 830091, China
5
Key Guangdong Provincial Key Laboratory for Radionuclides, Pollution Control and Resources, School of Environmental Science and Engineering, Guangzhou University, Guangzhou 510006, China
6
Key Laboratory of Plant Nutrition and the Agri-environment in Northwest China, Ministry of Agriculture, College of Natural Resources and Environment, Northwest Agriculture and Forestry (A & F) University, Yangling, 712100, China
7
College of Agriculture, Henan University of Science and Technology, Luoyang 471000, China
*
Author to whom correspondence should be addressed.
Waqas Ahmed and Liu Kailou contributed equally to this work.
Agronomy 2019, 9(12), 784; https://doi.org/10.3390/agronomy9120784
Submission received: 3 October 2019 / Revised: 5 November 2019 / Accepted: 8 November 2019 / Published: 21 November 2019
(This article belongs to the Section Soil and Plant Nutrition)

Abstract

:
Elevated mineral fertilization may change the composition and increase the availability of soil phosphorus (P) in subtropical paddy soils and thus affect long-term plant growth. However, an understanding of the response of soil P fractions to long-term nitrogen, phosphorus and potassium (NPK) additions remains elusive. This study aimed to explore the responses of soil P-fractions and their mobility to different long-term chemical fertilization rates under a double rice cropping system. The rates of nitrogen (N), phosphorus (P), and potassium (K) in the low NPK treatment (LNPK) were 90, 45, and 75 kg ha−1 year−1, respectively, and in the high NPK treatment (HNPK), they were 180, 90, and 150 kg ha−1 year−1, respectively. The results showed that the concentrations of soil organic matter (SOM), total P, Olsen P, total N, and mineral N were remarkably increased under HNPK by 17.46%, 162.66%, 721.16%, 104.42%, and 414.46%, respectively, compared with those under control (CT). Compared to the CT P fractions, HNPK increased the labile P fractions (i.e., NaHCO3-Pi and NaHCO3-Po) by 322.25% and 83.53% and the moderately labile P fractions (i.e., NaOH-Pi, NaOH-Po and HCl. dil. Pi) by 163.54%, 183.78%, and 3167.25% respectively, while the non-labile P was decreased by the HNPK addition. P uptake and grain yield were increased by LNPK and HNPK by 10.02% and 35.20%, respectively, compared with CT. P use efficiency indices were also higher under HNPK than under LNPK. There was a strong positive relationship between grain yield and P use efficiency (R2 = 0.97). A redundancy analysis (RDA) showed a strong correlation between soil chemical properties and the labile and moderately labile P pools. Structural equation modeling (SEM) revealed that SOM, mineral N, and available P strongly control the labile P pool. In conclusion, NPK additions under the paddy soils significantly influences the soil P fractions. The soil P dynamics and the mechanisms governing the interactions between plants and soil nutrients are clearly explained in this study.

1. Introduction

Phosphorus (P) is considered one of the nutrients with highest demand and plays a vital role in plant growth. The accessibility of phosphorus in the soil depends on the various P-fractions that influence the primary production of agricultural ecosystems [1]. Under long-term fertilization, phosphorus becomes unavailable for plant uptake as it becomes fixed and precipitated with aluminum, calcium, and iron in soil [2,3,4] which results in non-labile P formation [5]. The major problem associated with P fertilizer application is the low efficiency of P uptake by the plants. Nitrogen is also a prime element for attaining consistently high crop production [6]. Therefore, the interaction of P with nitrogen (N) could be considered the most essential nutrient interaction in practical terms [7].
Rice (Oryza sativa L.) is one of the major crops worldwide and paddy soils cover large anthropogenic wetlands [8]. However, soil phosphorus deficiencies considerably limit rice production [9,10,11]. Most soils in southern China are acidic in nature and P deficient. Therefore, P fertilizer application is commonly used to minimize P insufficiency. However, P fertilizer application leads to serious environmental hazards e.g., soil hardening, P leaching, and soil acidification, which results in a considerable reduction in soil fertility [12]. The main reason for the low soil P availability even after frequent P fertilizer application is that a greater quantity of phosphorus is fixed by Al and iron oxides and hydroxides, which are present in highly weathered soils [13,14]. The applied P reacts with the Al and Fe oxides and hydroxides resulting in the formation of stable fractions of P that might be unavailable to the plants, and leading to lower P recovery and P accumulation in the soils [15]. The heterogeneity and complexity of all the forms of P in the soil make it difficult to access plant available P.
Inorganic P fertilization can result in different rates of total P buildup and can also create a shift in the P-fractions in the upper layer of the paddy soils which delivers useful knowledge regarding the effects of P additions on soil P transformations [16,17]. Therefore, it is of great importance to discover the status of P-fractions in response to the various long-term continuous inorganic P fertilizer applications in red paddy soils which could be a way to obtain an improved understanding of the P dynamics and behaviors in paddy soils.
Soil P is affected by chemical fertilization via various factors such as the supply of the ample concentrations of soil micro and macronutrients. The inorganic forms of P such as new beryite (MgHPO4.3H2O) and brushite (CaHPO4.2H2O) are grouped as moderately labile phosphorus [18]. In an incubation study, it was observed that P fertilizer application comprising chemical fertilizer increases labile-P pool at initial stages and, further, it converted to the moderately labile-P comparatively faster than turkey litter compost. However, this study did not examine influences of P forms on the P availability for plant uptake. Shen et al. [19] documented that that in a calcareous soil of northern China, 14-year long-term P fertilizer application along with N supply is essential in maintaining the availability of soil P and higher rice grain production. Lee et al. [20] found in a long-term rice paddy experiment conducted in southeastern Korea that continuous inorganic fertilizer application (NPK) led to a substantial increase in soil inorganic and organic P levels. Long-term field experiments conducted in different arable soils that grow upland crops (maize, wheat, and chickpea) revealed that P additions containing mineral fertilizers increased the soil inorganic P fractions, but it did not affect or reduce the soil organic P fraction [6,21].
Fertilizer management affects soil chemical properties at various depths [22,23]. Soil acidification was found to be significantly higher in the upper surface of soil than at lower depths, and the increase in N fertilizer application was associated with a decrease in pH [24]. Schroder et al. [23] explored a highly significant negative relationship between the nitrogen fertilizer application rate and soil pH during a 30-year long-term study conducted in Oklahoma. Ammonium containing fertilizers that cause nitrification along with decomposition of SOM (soil organic matter) led to soil acidification in the upper soil surface [25,26,27].
P is among the least accessible nutrients to plants and is also less mobile in the soil because of its fixation/adsorption to Al and Fe in the paddy fields [2,3,4]. Moreover, the bioavailability of various geochemical fractions of soil inorganic and organic P could be altered under certain conditions [28,29]. Different fractionation approaches with various chemical sequential extractions can be used to examine the different P fractions and the P dynamics in the soil [30,31]. However, the long-term impacts of the usage of various inorganic fertilizers on the P fractions and their availability to plants and in different soils of China have been less studied.
The fractionation approach described by Hedley et al. [28] is widely being followed to evaluate the build-up of P in soil. The fractionation schemes separate various P fractions on the basis of their nature, either organic or inorganic, and dissolution/desorption by using various extractors which hold dissolution and desorption power from lower to higher levels [32]. As per our knowledge and recent research progress, very few experiments have compared the effects of various rates of inorganic fertilizers on the P fractions in paddy soils under subtropical conditions, particularly after long-term NPK addition. As this experiment has been in place for more than 35 years, the aim of this research is to explore the responses of soil P-fractions and its mobility to different long-term chemical fertilization rates under double rice cropping systems to obtain a better understanding of P behavior in paddy soils.

2. Materials and Methods

2.1. Site Description

This experiment was conducted in Jinxian located in the province of Jiangxi, Southern China (28°35′38′′ N, 116°17′55′′ E). The location has a subtropical monsoon climate. The mean annual temperature (MAT) of this region is 18 °C, and the mean annual precipitation (MAP) is 1535 mm. The soil is a ferralic cambisol and is classified as a paddy soil according to the Chinese classification of soil. The soil texture is silty loam consisting of 26% clay. The characteristics of soil in the plough horizon (0–20 cm) before the experiment were as follows: pH (H2O) 6.9, SOM 27.96 g kg−1, total N, P, and K 1.49, 0.48, and 10.4 g kg−1, respectively; available N, P, and K contents 144, 4.15, and 80.52 mg kg−1, respectively.

2.2. Experimental Design

A long-term fertilization field experiment has been established since 1981. To discover the response of soil P cycling to the elevated NPK depositions, we selected treatments of three different levels of inorganic fertilizers including control with no fertilizer input (CT), low N, P, and K fertilizer application rate (LNPK) and high N, P, and K fertilizer application rate (HNPK). The rates of nitrogen (N), phosphorus (P), and potassium (K) in LNPK were 90, 45, and 75 kg ha−1 year−1, respectively, and in HNPK they were 180, 90, 150 kg ha−1 year−1, respectively. For this experiment, each plot was designed as 46.67 m2 in area and to prevent the exchange of nutrients and water among these plots, the area was separated by a concrete frame with 10 cm width (15 cm above ground and 50 cm deep below ground). All the treatments were arranged in a randomized complete block design (RCBD) with three replicates each. The mineral fertilizers nitrogen, phosphorus, and potassium were applied in the form of urea (46.0% N), calcium magnesium phosphate (15.0% P2O5), and KCl (60% K2O), respectively. Approximately 60% of the mineral N fertilizer, 50% of the chemical K fertilizer, and 100% of the chemical P fertilizer were applied before the rice seedling transplantation. The remaining proportions of K and N were applied at the tillering stage (approximately 10–12 days after transplantation).

2.3. Soil Sampling and Analyses

Immediately after the late rice harvest in October 2017, soil samples from 0–20 cm soil depth were collected with the help of an auger. Each sample was an aggregate sample of the three random cores taken from each treatment plot. Fresh soil samples were thoroughly mixed together, air-dried, and then sieved using a 1-mm sieve, after which they were stored in closed plastic bags for examination. The representative subsamples were then ground with a 0.25-mm sieve to assess total-P [33], Olsen-P [34], P-fractions [28], SOM [35], and total N [36]. Mineral N that is also known as a hydrolysable nitrogen was measured according to [37]. At maturity stage, the late rice crop was harvested, and the plant P uptake was measured. The separated-out grains were weighed carefully after sun drying and then grain yield was recorded.

2.4. Sequential Fractionation of P Pools

To sequentially evaluate the P fractions, a modified Hedley method [28,29] was followed. Briefly, triplicate subsamples of each soil (0.5 g) were sequentially extracted as described: 0.5 g of soil was collected and shaken with 0.5 M NaHCO3 at pH 8.5 for 16 consecutive hours (NaHCO3-P), 0.1 M NaOH for 16 h (NaOH-P), with 1 M HCl for 16 h (diluted HCl-P), heated with 10 mL of concentrated HCl in a water bath for 10 min at 80 °C containing 5 mL of 12M HCl, and then conveyed to a final volume of 50 mL with distilled water (concentrated HCl-P). Finally, by using concentrated H2SO4 (300 μL per 30 mg of soil buildup subsample) at 350 °C for 3 h (rate of 4 °C/min; residual phosphorus), the soil residue samples were digested. Between two continuous phases, the tubes were placed for centrifugation for 10 min at 5000 g and 4 °C. At last, the supernatants were extracted to find out the total phosphorus (Pt) [29] or inorganic phosphorus (Pi) [33] and the difference noted between Pt and Pi was considered as organic phosphorus (Po).

2.5. Calculation of P Efficiency

The calculation of P recovery efficiency (PRE) and P use efficiency (PUE) were modified from Lu et al. [38].
P U E   k g   k g 1 =   Y T Y C T P F ,
where YT and YCT are the grain yields in the fertilized and control treatments, respectively, at harvest stage. PF is the total amount of P which was applied in the fertilized treatment.
P R E   k g   k g 1 =   U T U C T P F ,
where UT and UCT are the amounts of P uptake in the grain of both the unfertilized and fertilized treatments at harvest stage. PF is the total amount of P fertilizer that was applied in the fertilized treatment.
The phosphorus partial factor productivity (PFPP) followed Si et al. [39]
P F P P k g   k g 1 =   Y T P F ,
where YT is grain yield in the respective fertilized treatment at harvest stage. PF is the total amount of P fertilizer that was applied in the fertilized treatment.

2.6. Statistical Analysis

Statistical analysis was performed using SPSS 20.0 (SPSS, Chicago, IL, USA). One-way analysis of variance (ANOVA) was used, followed by least significant difference (LSD) test at p = 0.05 level for each of the variables to calculate the significant differences among the different treatment means. To determine the relationship between the grain yield and PUE, linear regression analysis was performed. Redundancy analysis (RDA) was performed using Canoco version 5 (Cambridge University Press, Cambridge, UK). Structural equation modeling (SEM) is a statistical method to find out the indirect and the direct effects and helps to estimate the partial contribution of the given explanatory variables [40,41,42]. We used SEM to find out the linkage between SOM, available P, mineral N, P pools, and the P uptake using the AMOS package with SPSS 20.0 (SPSS, Chicago, IL, USA).

3. Results

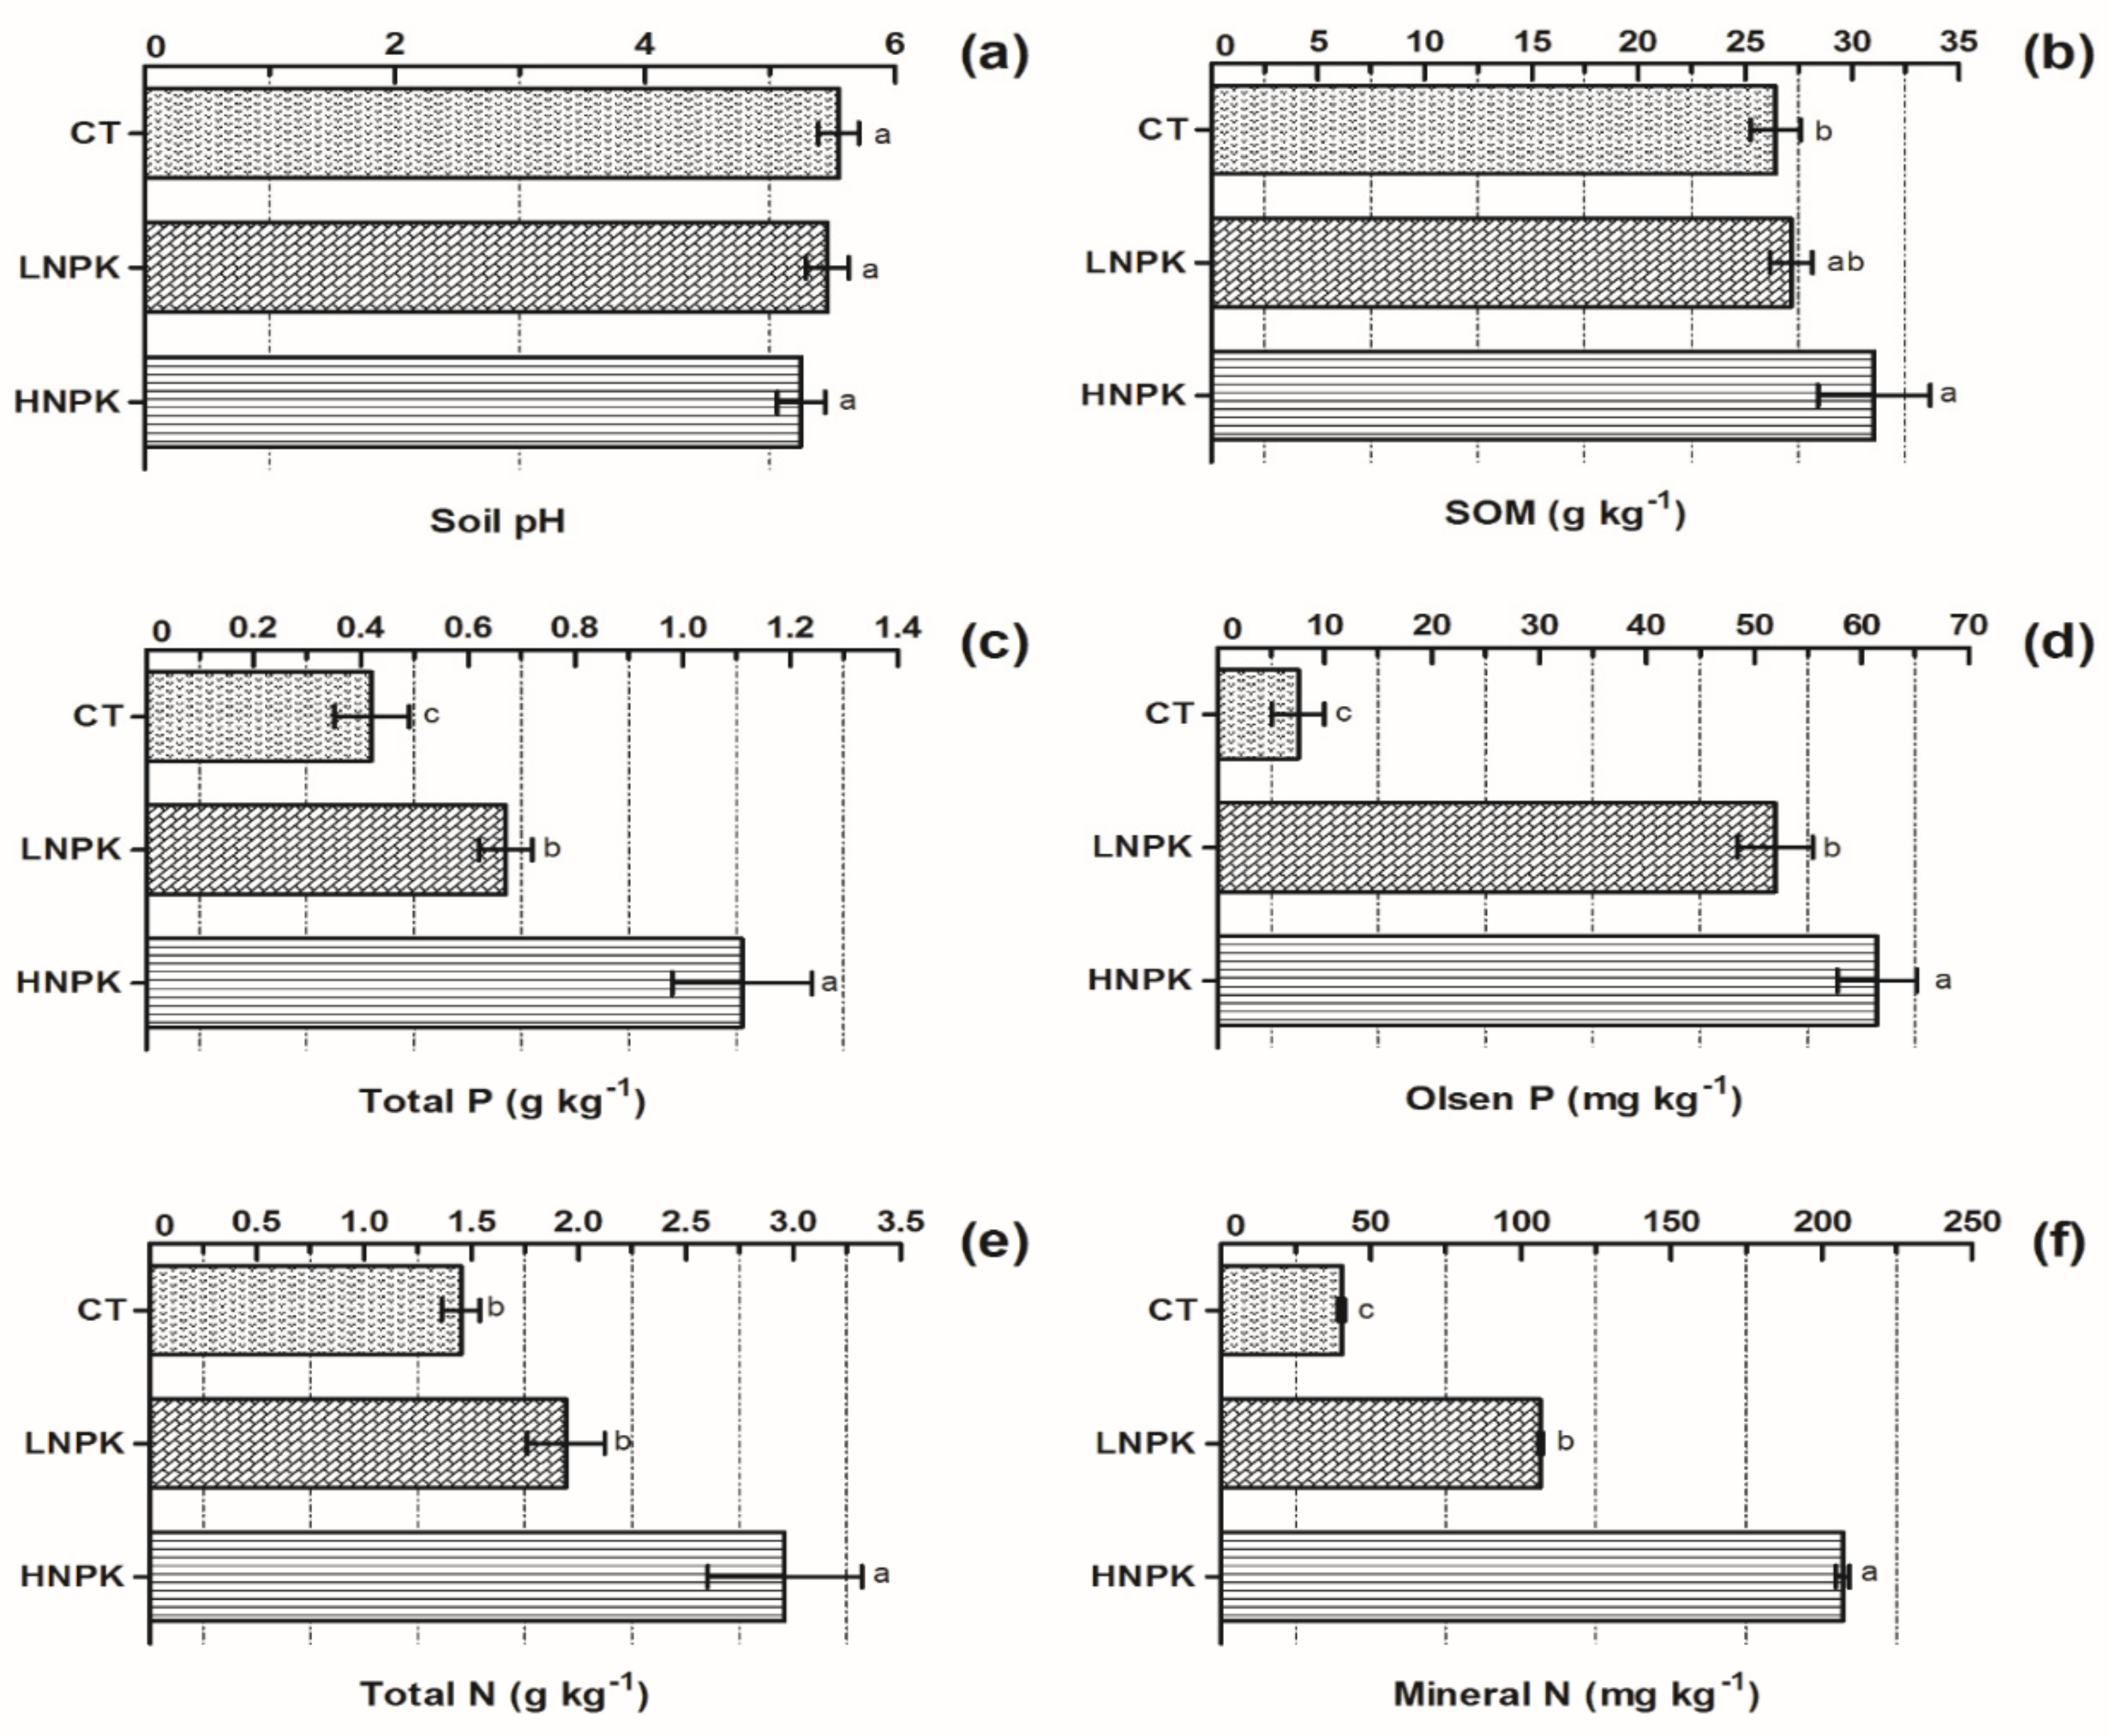
3.1. Soil Chemical Properties

Long-term NPK addition did not change soil pH significantly, but SOM was significantly influenced by long-term fertilization. SOM was significantly higher under the HNPK treatment, compared with LNPK and CT (Figure 1). Soil total P, total N, Olsen P, and mineral N were also significantly affected by long-term fertilization and were significantly higher in HNPK treatment (Figure 1).

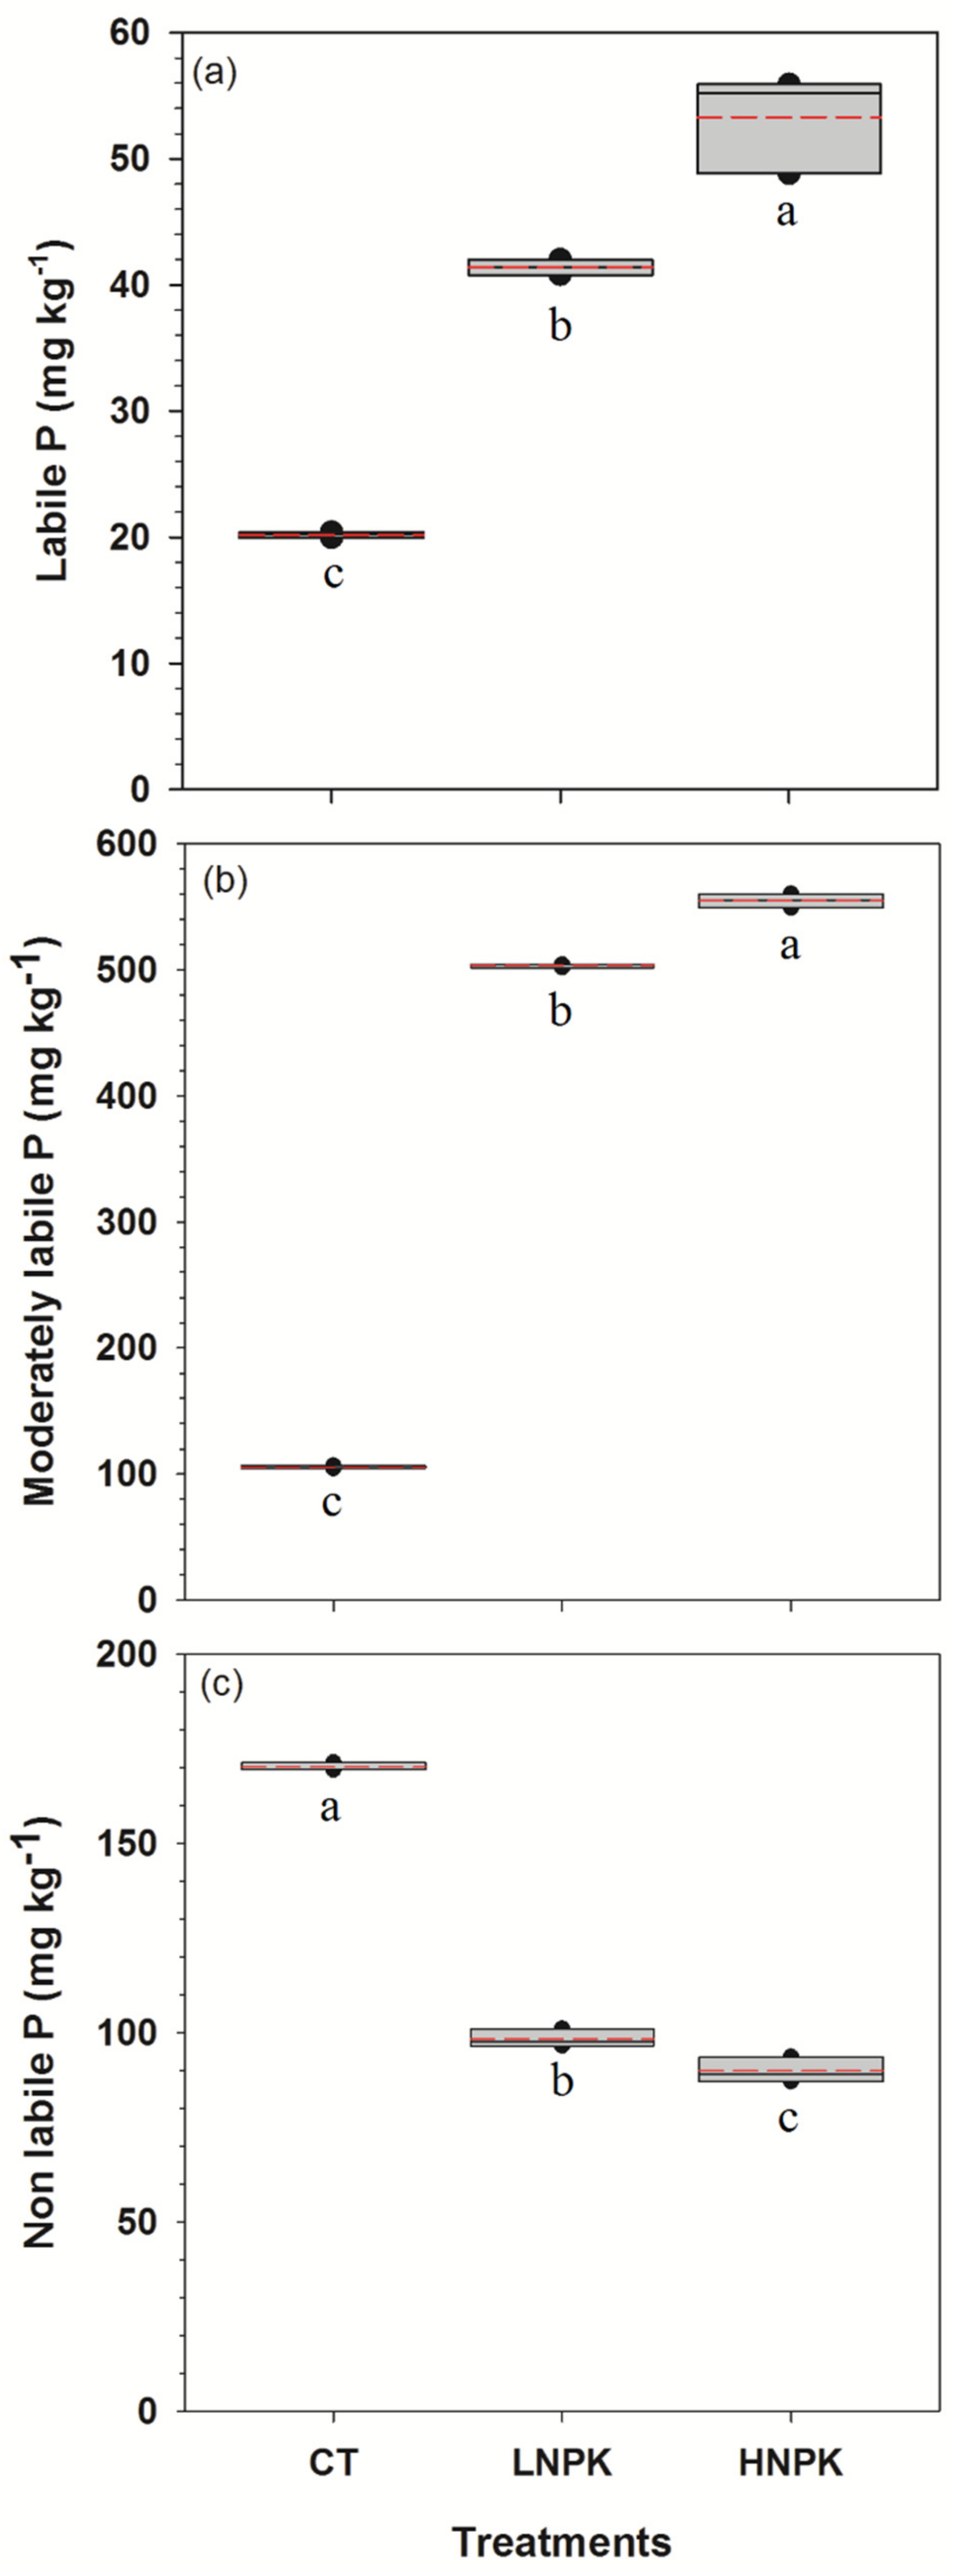
3.2. Soil P Fractions Affected by Long-Term NPK Applications

Long-term NPK addition significantly affected the distribution of the various soil inorganic and the organic P fractions. In this study, HNPK significantly (p ≤ 0.05) increased both inorganic and organic P fractions (NaHCO3-Pi, NaHCO3-Po, NaOH-Pi, NaOH-Po, dil. HCl-Pi) except the residual-P contents (conc. HCl-P and residual-Pi) (Figure 2). The fractionated total P (sum of all the organic and inorganic P fractions) contents among the treatments decreased in the order HNPK > LNPK > CT.

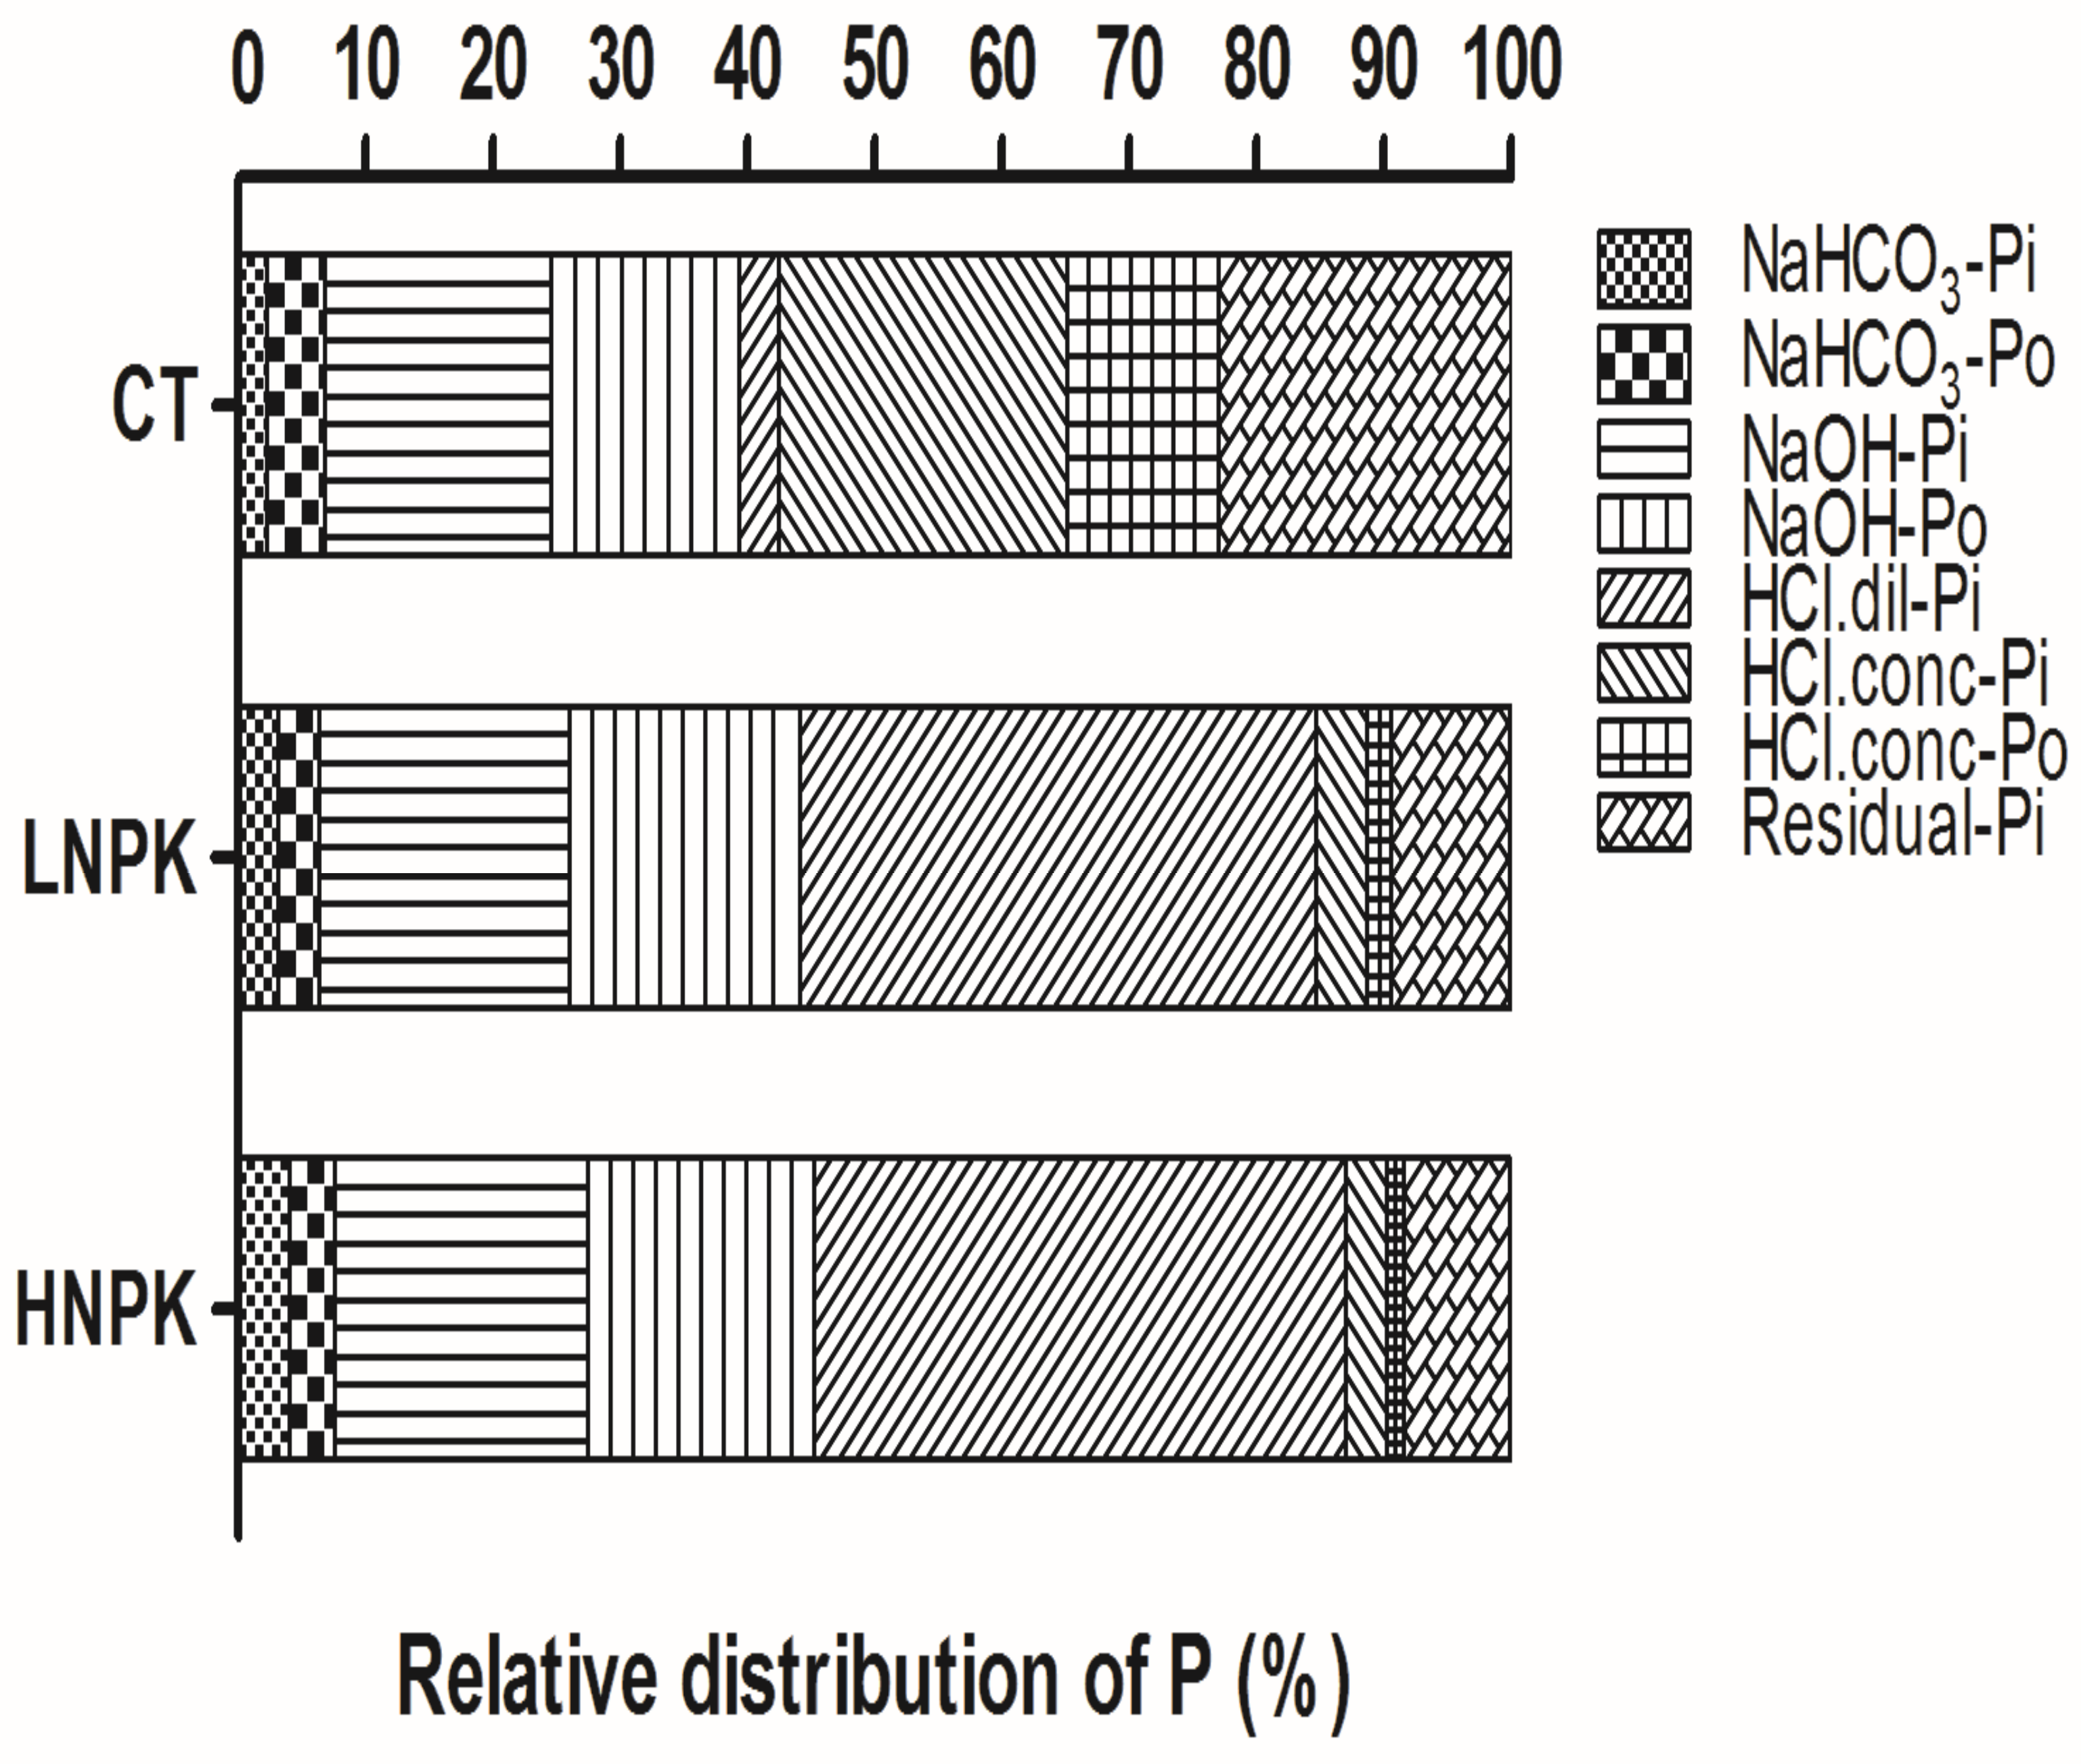
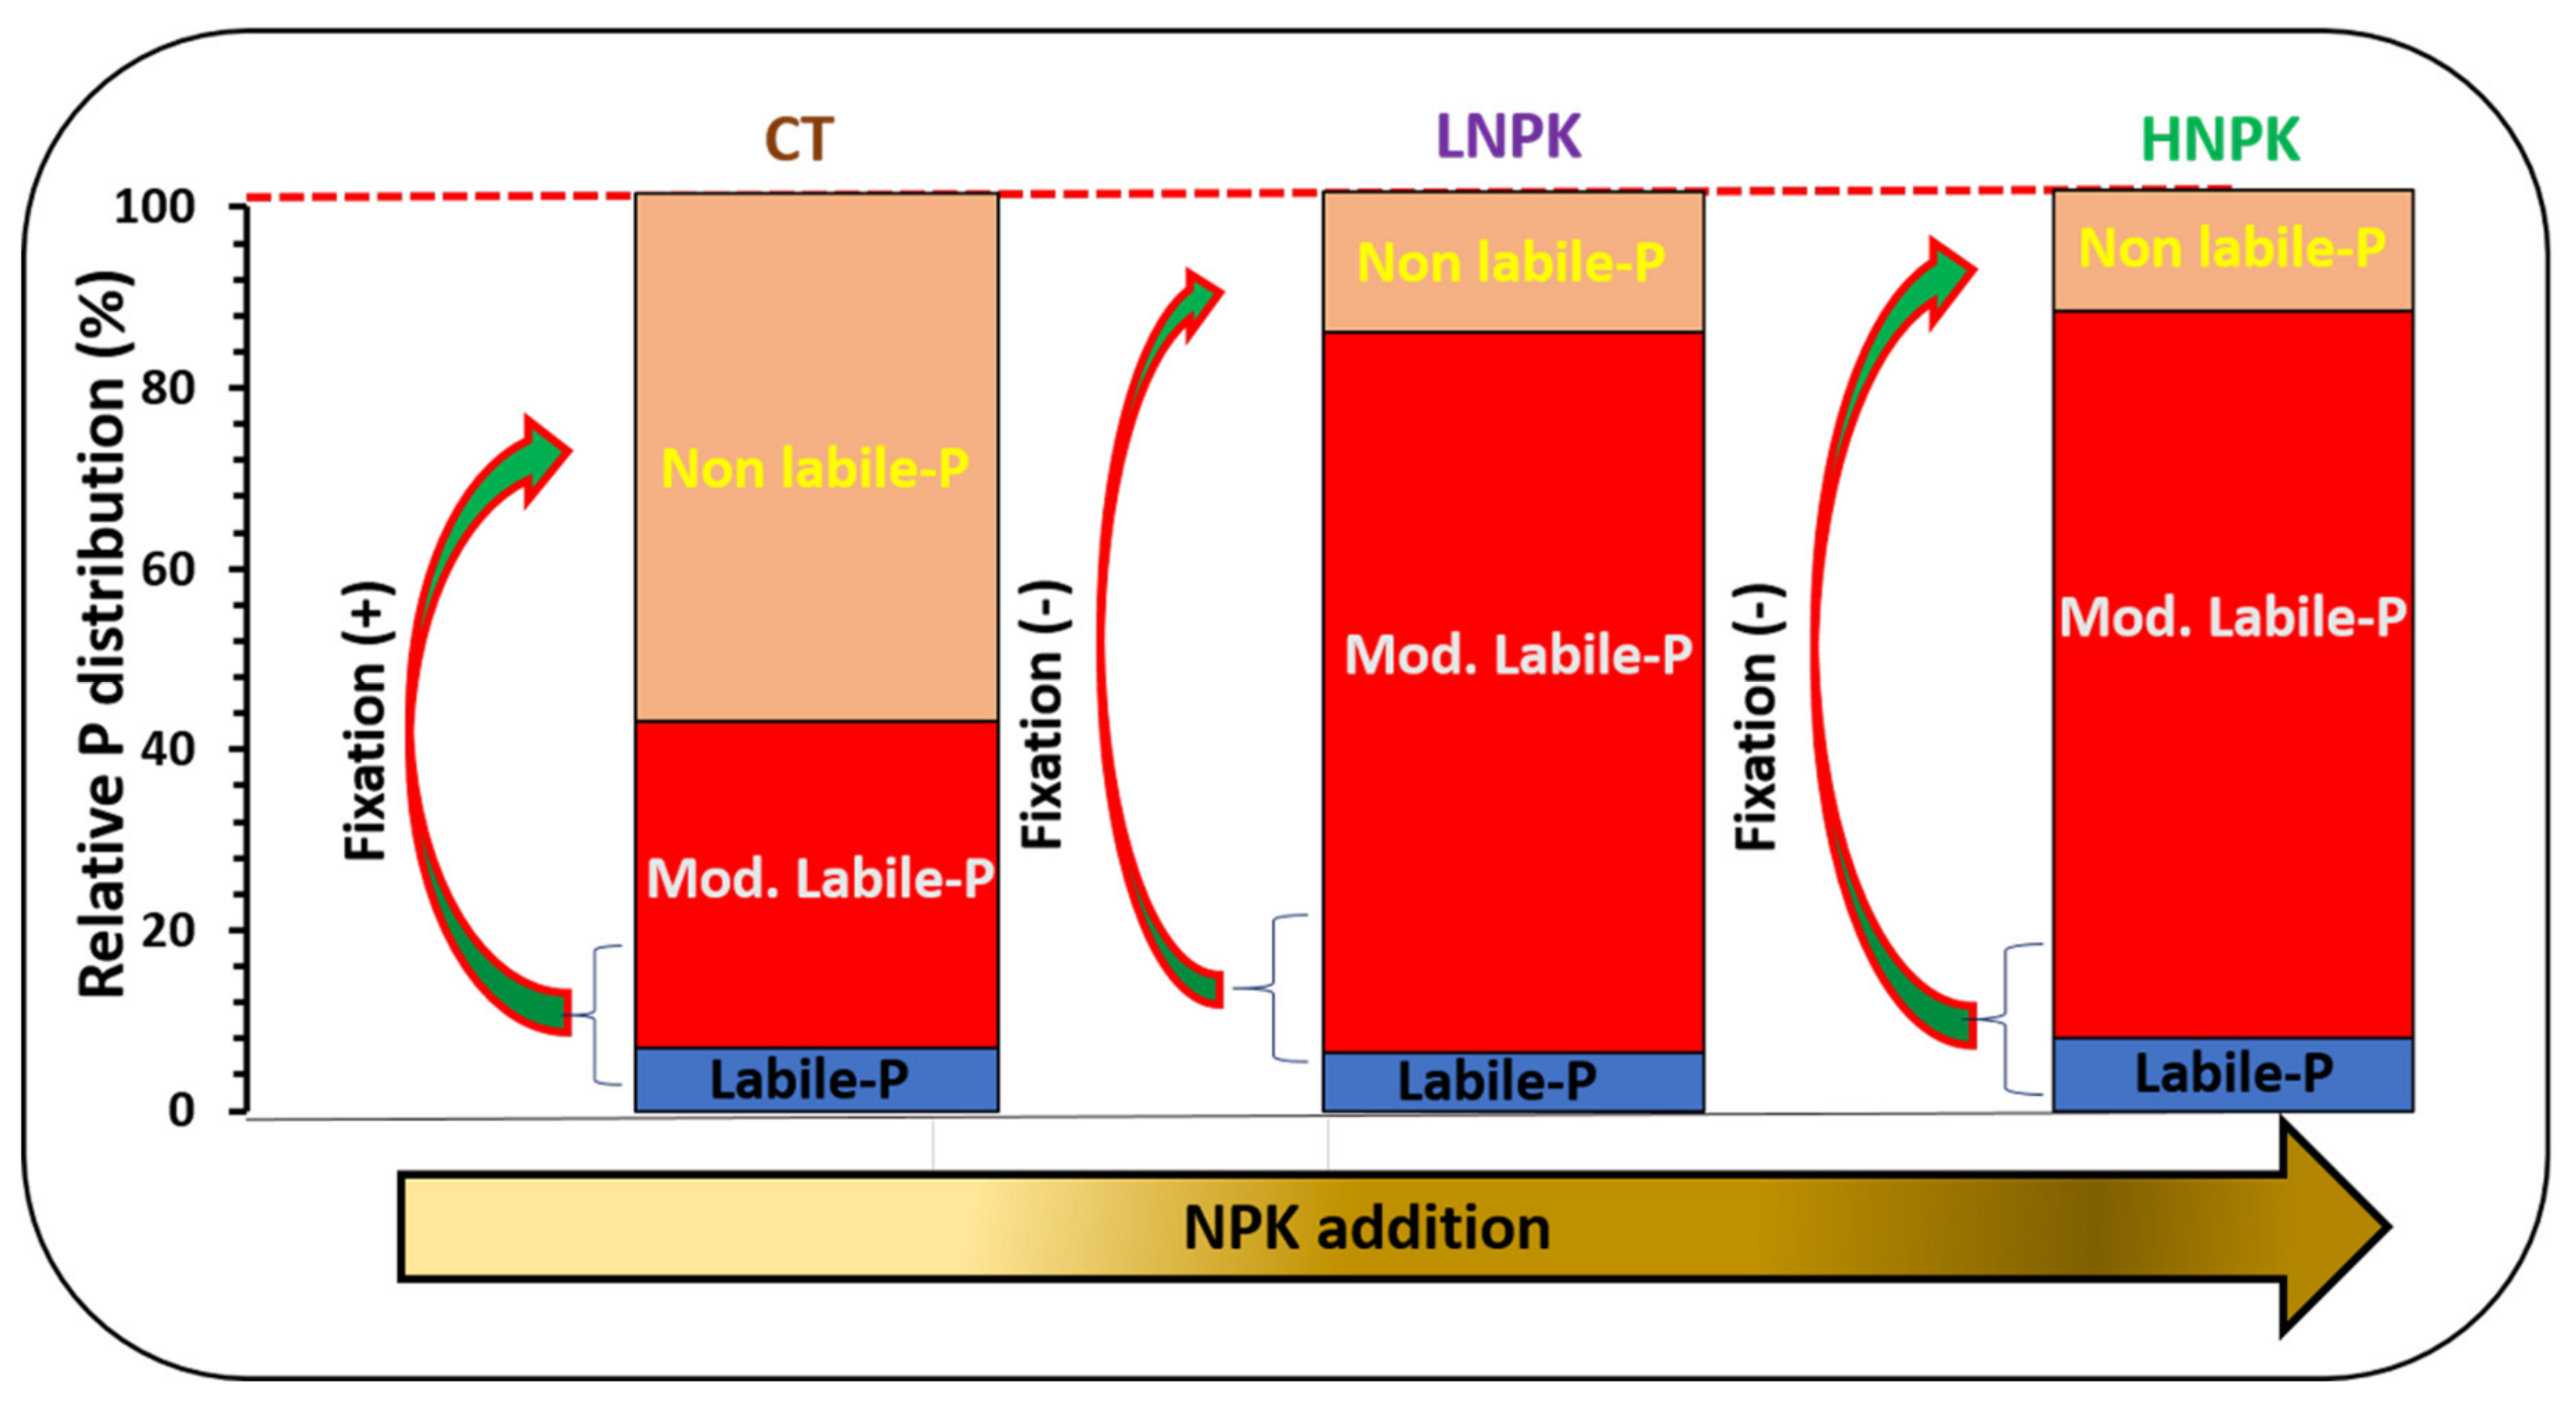
3.3. Relative Proportions of the P Pools

The various successive P fractions were grouped for ease of understanding into three pools: (1) labile phosphorus (NaHCO3-Pi + NaHCO3-Po) pool, (2) moderately labile phosphorus (NaOH-Pi. + NaOH-Po + Dil. HCl-Pi) pool, and (3) non-labile or stable phosphorus pool (HCl. conc.-Pi. + HCl. conc. –Po + Residual-P). Labile phosphorus is an intermediate form that is rather weakly adsorbed or bound to various compounds and clay in the soil (solid phase). This is the primary phosphorus source supplying the soil solution. The non-labile P refers to the proportion of very slowly available P, out of the total P present in the soil system. The NPK addition remarkably increased both the labile P and moderately labile P pools (Figure 3), compared with LNPK and CT treatments. Both the LNPK and HNPK treatment reduced the non-labile P pool compared with that of CT, but the difference between them was not significant.

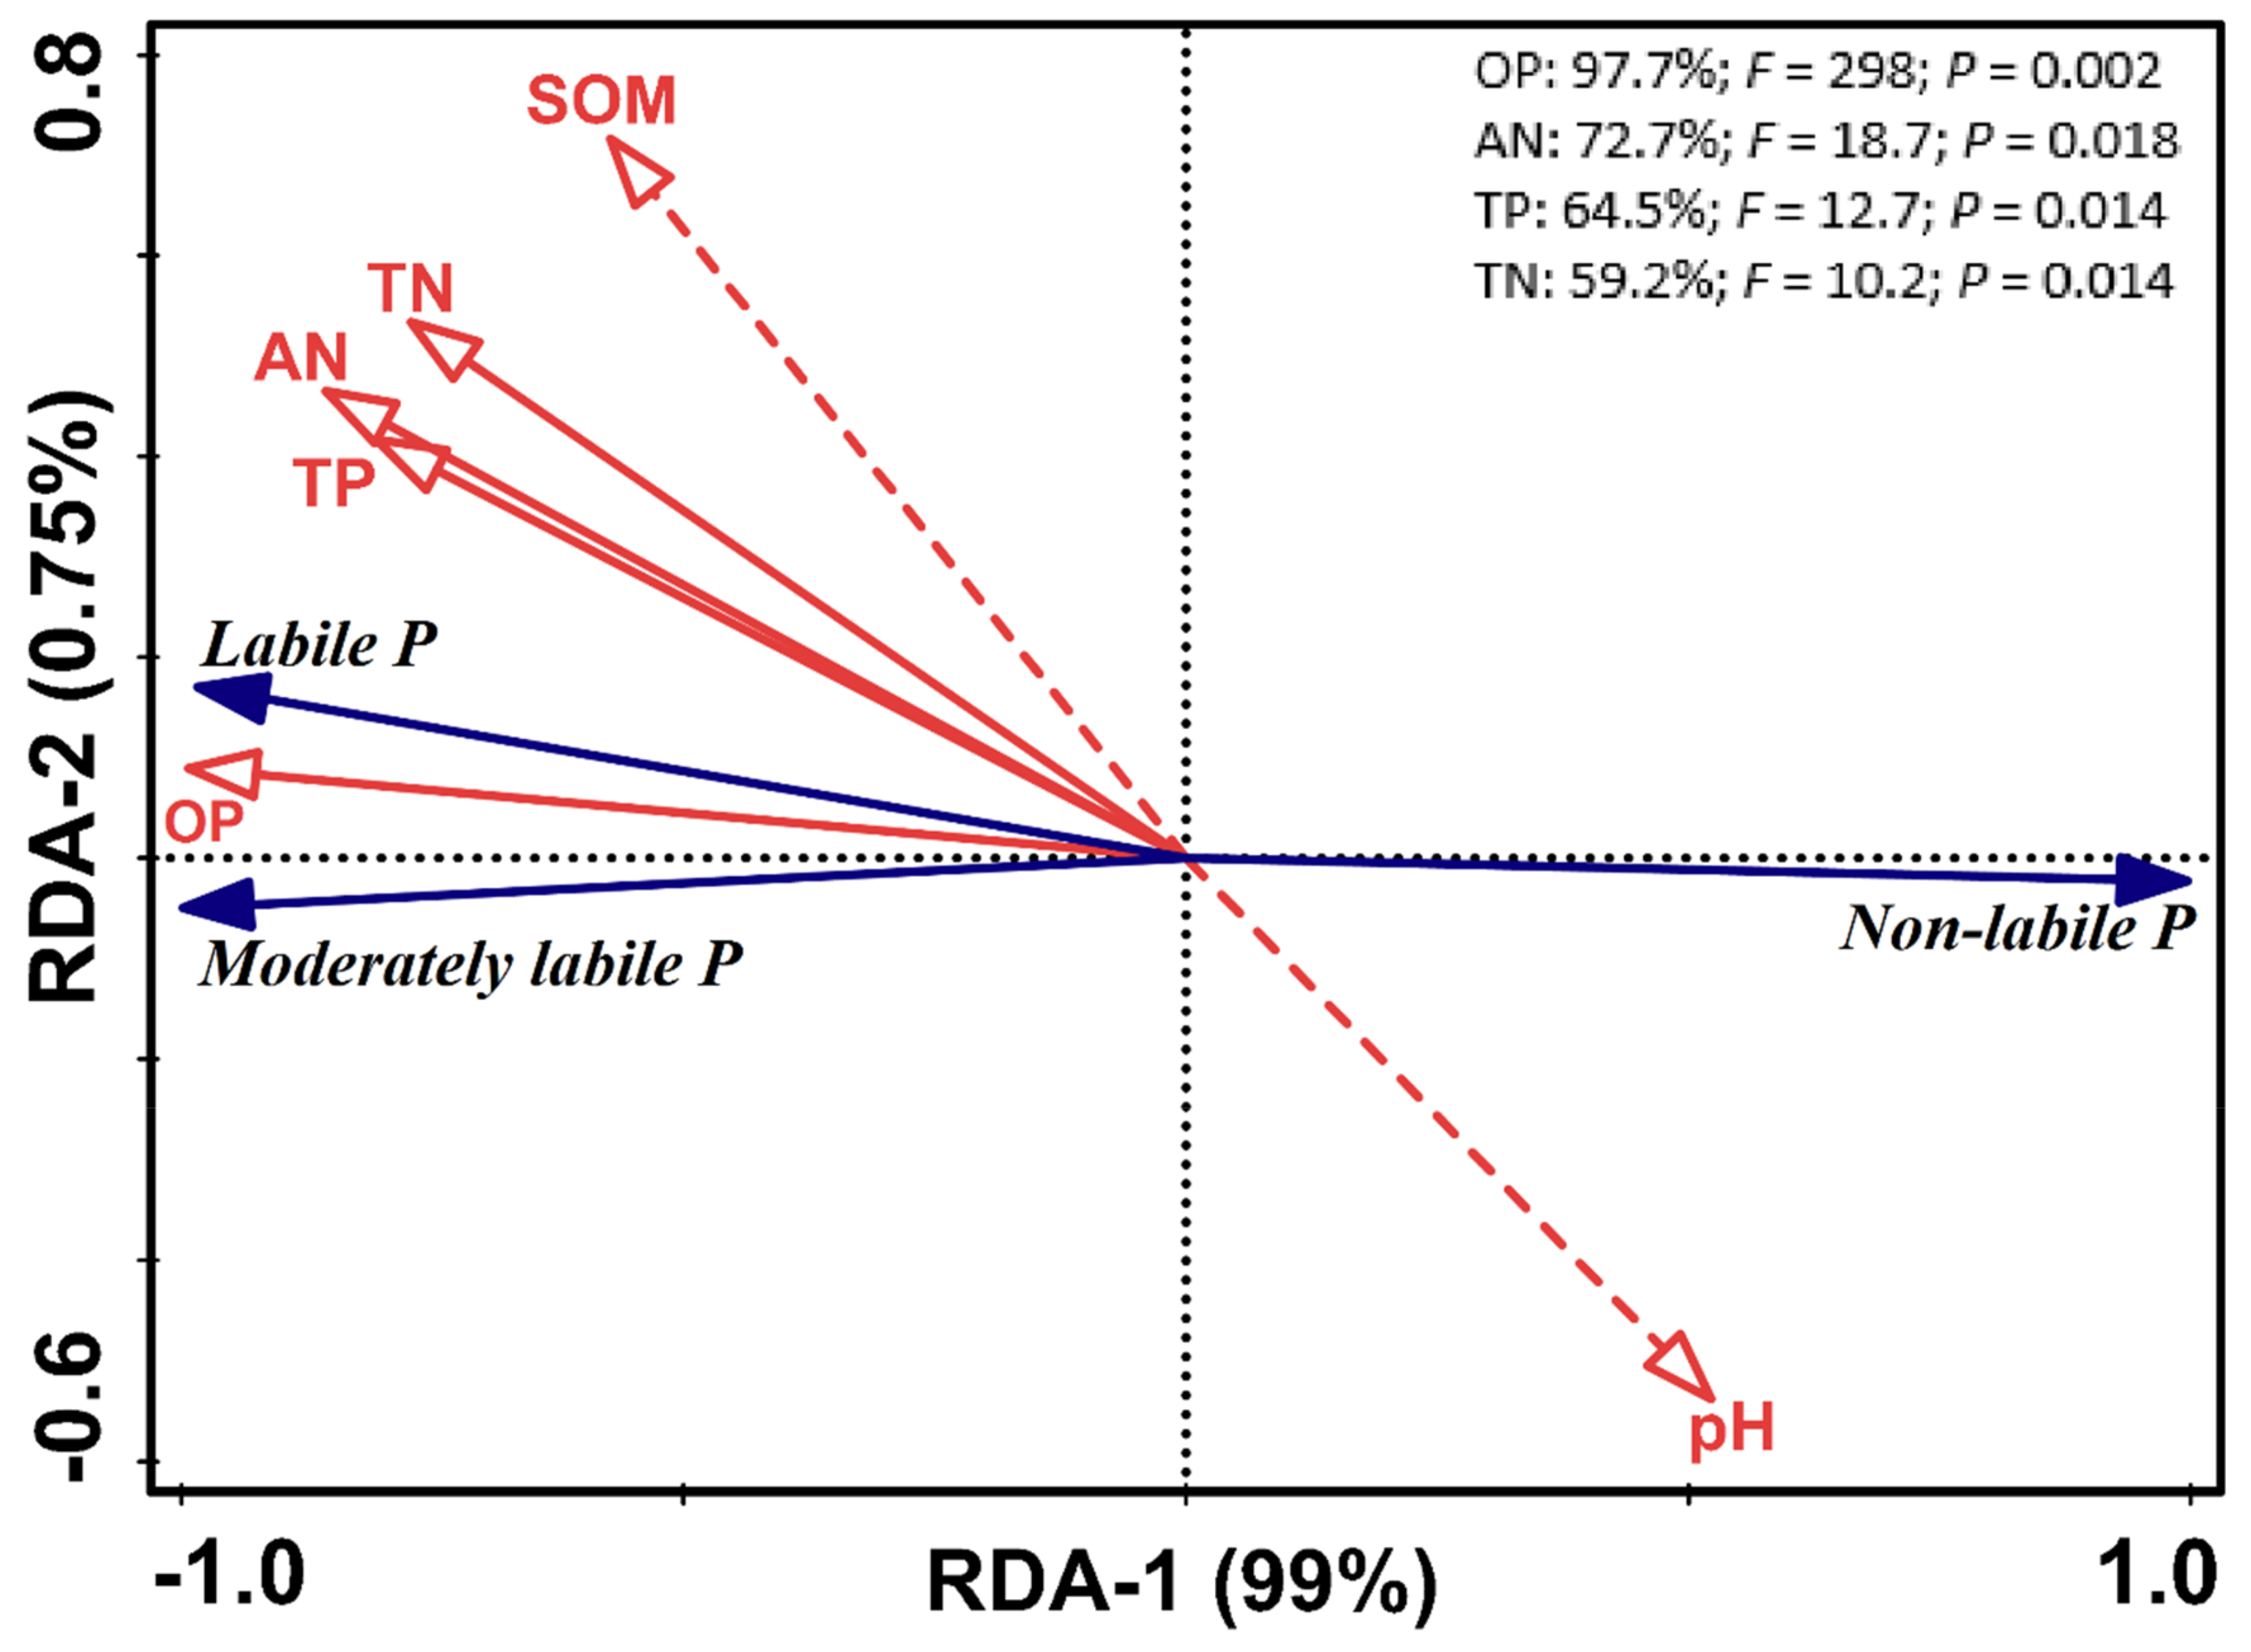
3.4. Relationship between Soil Chemical Properties and P-Fractions

RDA analysis revealed that the soil chemical variables explained almost 99% of the variations in the different soil P fractions among the NPK addition levels (Figure 4). The RDA-1 and the RDA-2 ordination axes accounted for 99% and 0.75% of the total variation, respectively. The labile P and moderately labile P pool was highly increased by the elevated NPK additions and were significantly correlated with the soil Olsen P, total P, mineral N, and total N concentrations (p ≤ 0.01). Soil organic matter content and pH showed a non-significant correlation with P pools. The Non-labile P showed an opposite relationship and was negatively correlated to all the nutrient concentrations.

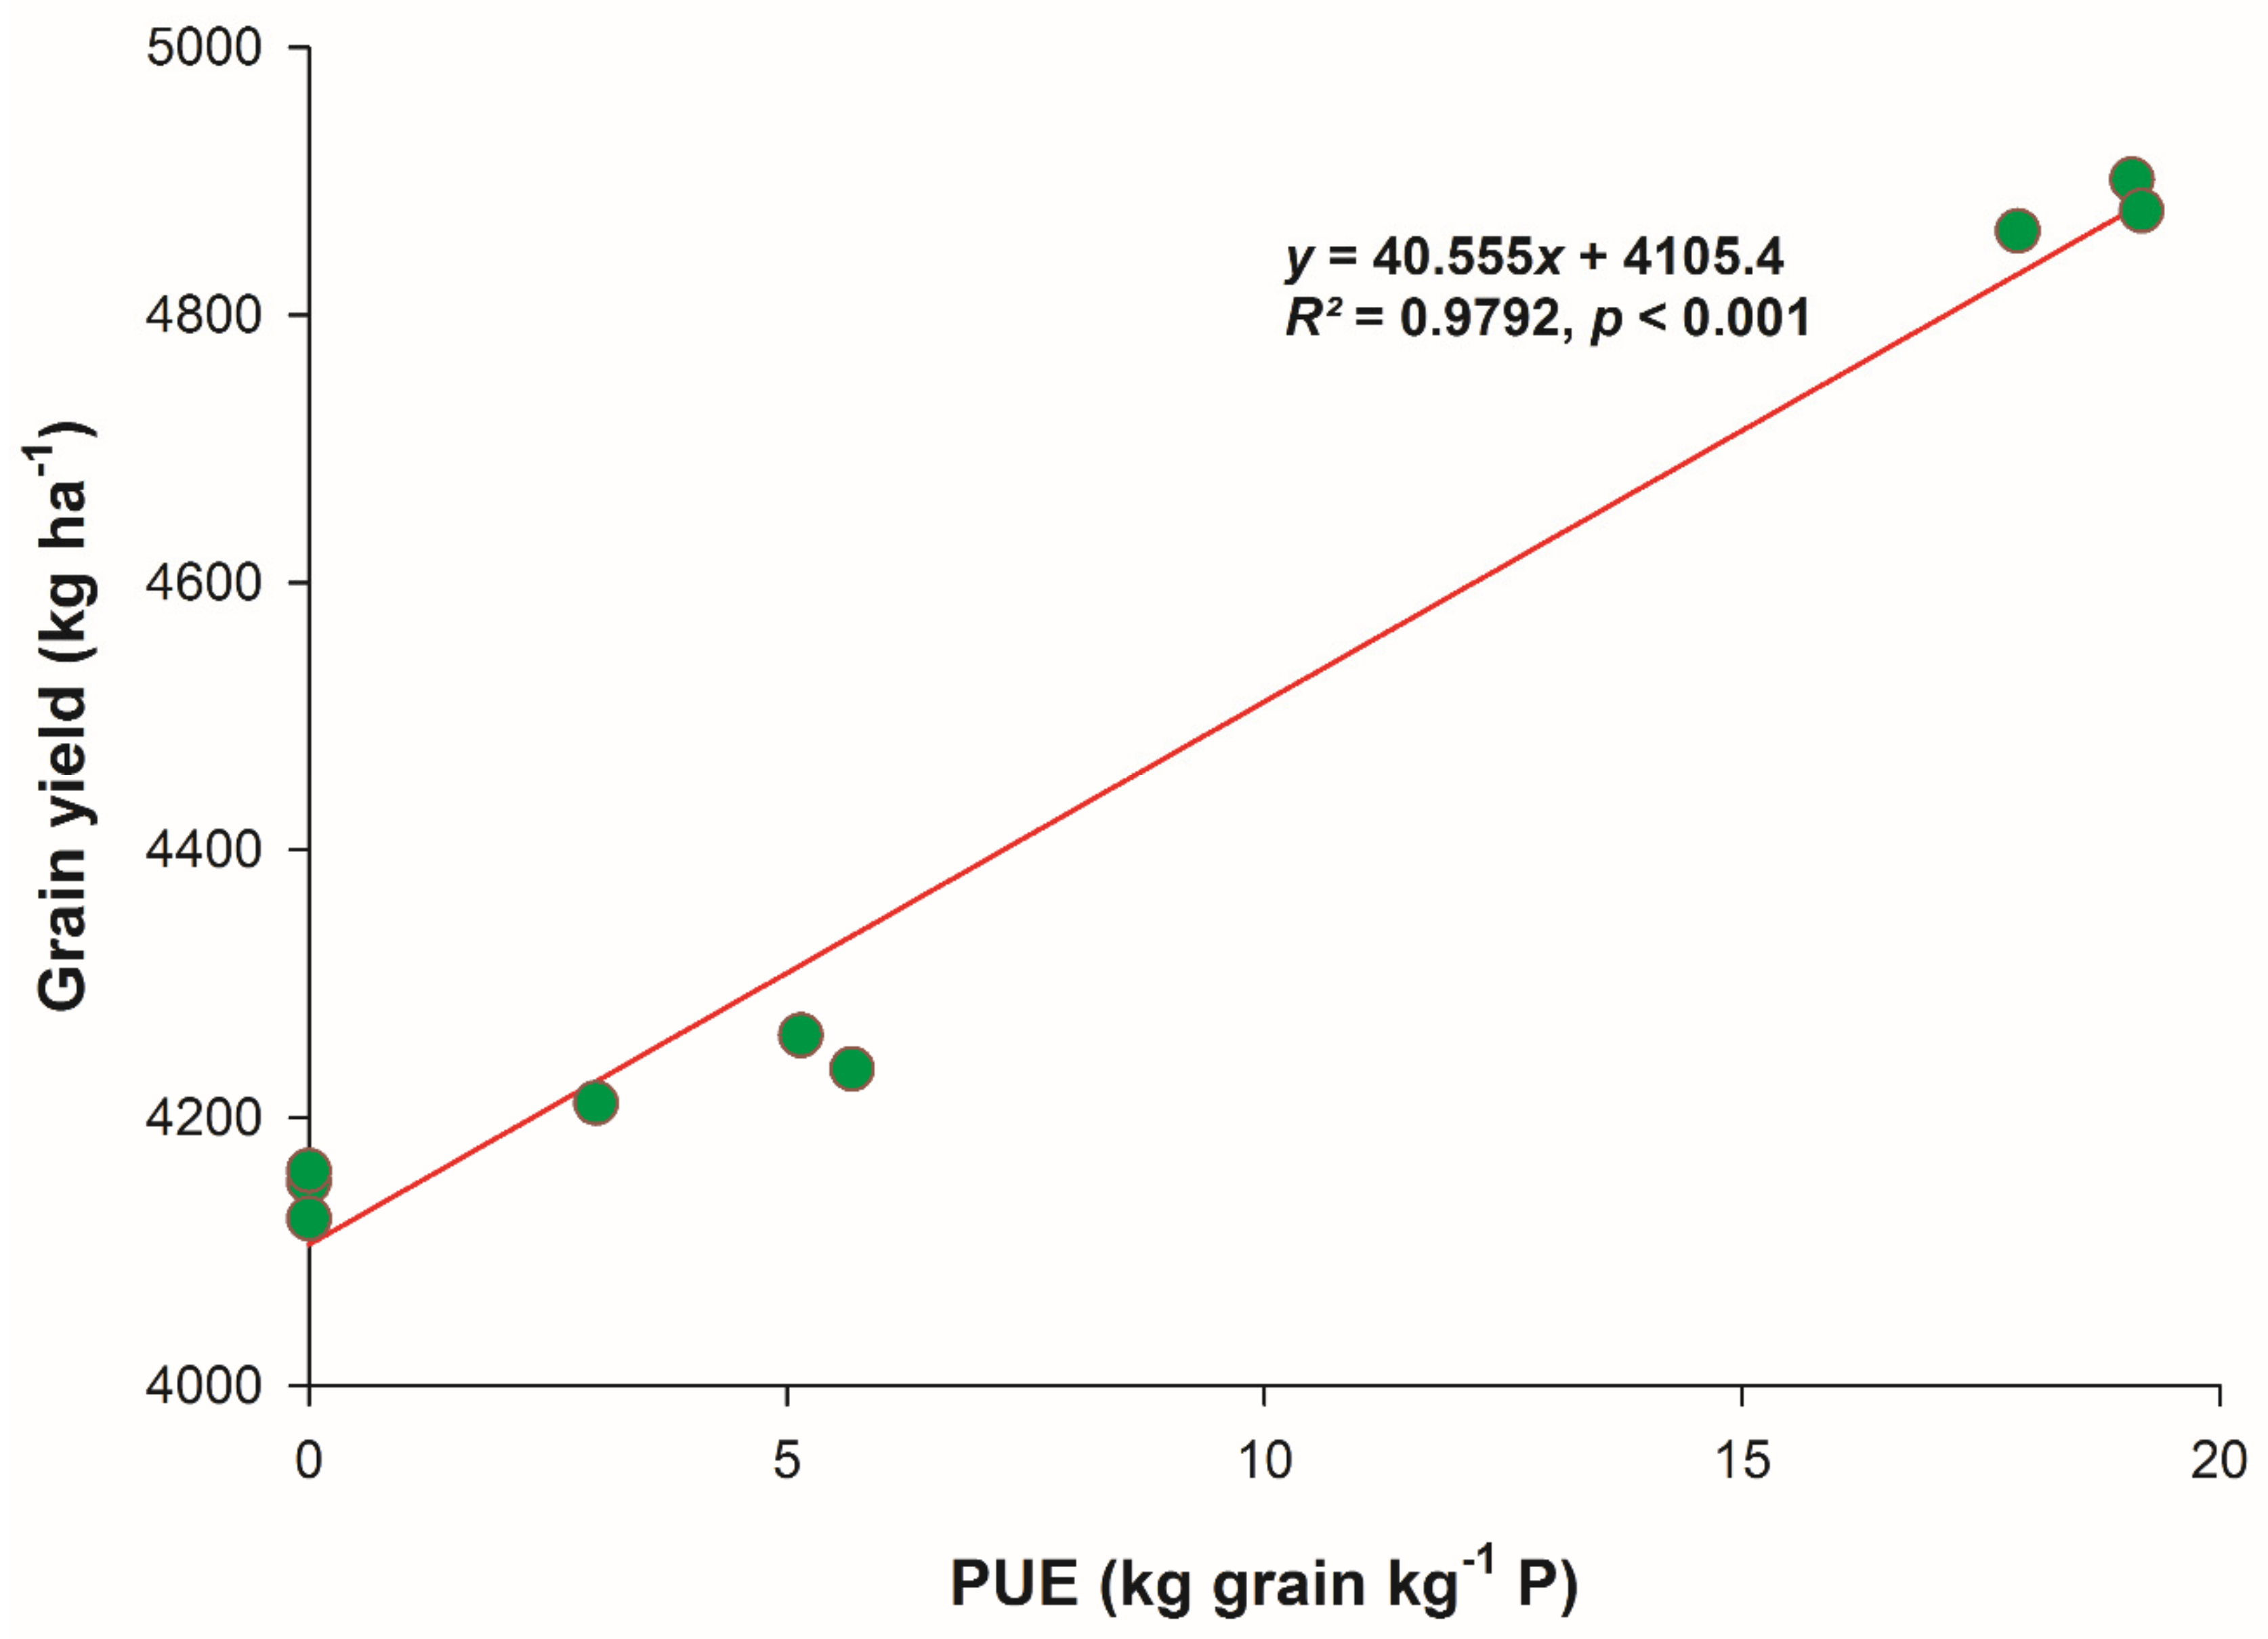
3.5. Grain Yield, P Uptake, and P Efficiency Indices

Grain yield was significantly increased by the NPK applications (Table 1). HNPK showed significantly higher yields (4880.62 kg ha−1), compared with LNPK (4236.01 kg ha−1), and CT (4145.49 kg ha−1. The average increase in the grain yield by LNPK and HNPK was 2.18% and 17.73%, respectively, compared to the control treatment CT. Similarly, the grain P uptake was significantly higher in the HNPK treatment and it was increased by 10.02% and 35.20% by LNPK and HNPK, respectively, compared with CT. The phosphorus use efficiency (PUE), phosphorus recovery efficiency (PRE), and the partial factor productivity for P (PFPP) was calculated (Table 1). PUE was significantly higher with HNPK addition (18.72 kg grain kg−1 P), compared with LNPK addition (4.61 kg grain kg−1 P), and the PRE was also significantly higher in HNPK addition. While the partial factor productivity for P was decreased by the HNPK addition (124.26 kg grain kg−1 P), compared with LNPK (215.70 kg grain kg−1 P). PUE showed a highly significant (p ≤ 0.05, R2 = 0.97) and positive relationship with the grain yield (Figure 5).

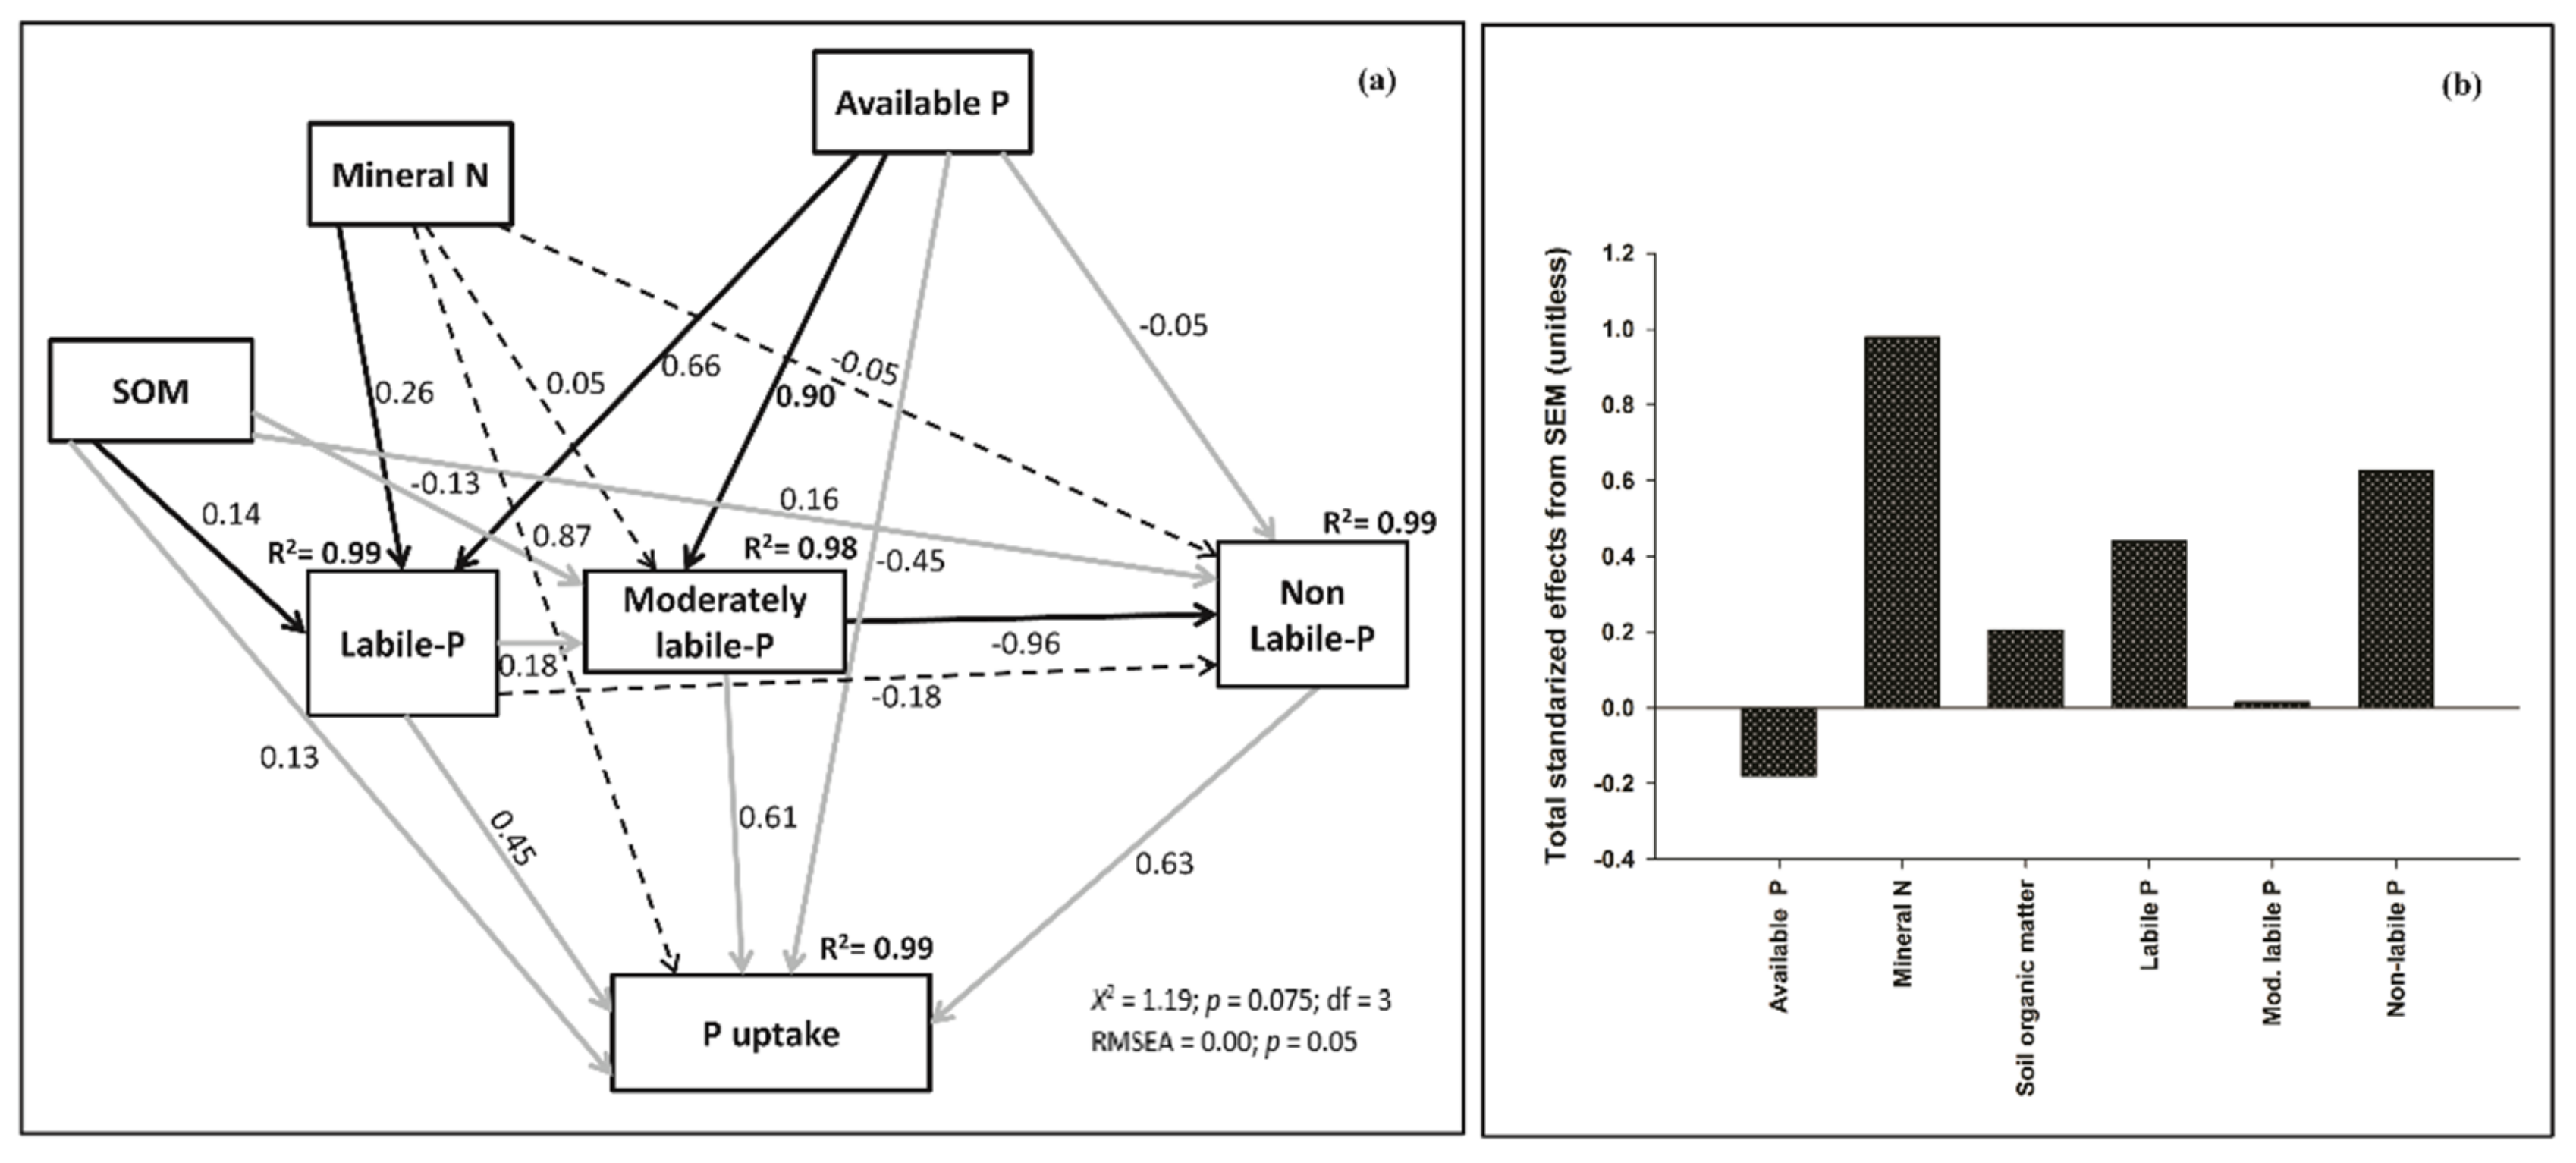
3.6. Soil Nutrient Responses to P Pools and P Uptake by the Crop

We explored the direct and indirect and total effects of SOM, mineral N and available P on the different P pools and P uptake by structural equation modeling (SEM) pathway analysis (Figure 6a,b). The results showed that SEM explained 99%, 98%, 99%, and 99% variance in labile-P, moderately labile-P, non-labile-P, and the P uptake, respectively. SOM, mineral N, and available P directly affected the labile P pool. Available P also directly affected the moderately labile P pool but did not show a significant effect on the non-labile P pool. Mineral N indirectly affected the non-labile P and the P uptake. However, the labile P, moderately labile-P, and non-labile P did not significantly influence the P uptake. Overall, the total standardized effects (sum of indirect effects and directs effects of each variable) from SEM revealed that the soil available P, mineral N, and SOM strongly control the labile P pool (Figure 6b).

4. Discussion

4.1. Relationship of Soil Properties and P Fractions with NPK Additions

The long-term addition of NPK fertilizer significantly increased the total N, mineral N, SOM, available P, and total P (Figure 1). Lan et al. also observed that the long-term fertilization increases soil nutrient contents. The increase in SOM, total, and available nutrient concentrations could be associated with long-term continuous mineral fertilization that built the SOM in the surface soil layer [17,27]. The long-term application of inorganic fertilizers allows long-term assessment of the effects of NPK additions on the soil P fractions. We observed that HNPK treatment significantly increased the labile and the moderately labile P pools (Figure 3 and Figure 7). These results generally agree with the previous study of Siddique and Robinson and Song et al. [43,44] who observed that long-term crop cultivation without any fertilizer input resulted in a decreased labile P content in the soil. The changes in labile and moderately labile P pools could be due to the organic P mineralization that allows the inorganic P to be utilized by the ectomycorrhizal fungi [45,46]. The changes might also because of the elevated SOM contents in the soil with HNPK additions which could affect P-sorption sites, either by creating a cover over iron and aluminum sorption spots to cease the added or the applied P from fixation/adsorption or by modifying the mineral surface charges that also reduce the sorption sites, eventually increasing the soil phosphorus [47]. The decrease in the concentrations of non-labile P fractions observed with HNPK addition might be due to the effect of excessive fertilization that results in the saturation of P in residual form which may convert to the labile or moderately labile P pools with the passage of time. These findings suggest that these fractions might take part in the long-term cycling of phosphorus in soil. This cycling process could be due to the existence of different processes in the soil system, as Hedley et al. [26] suggested that the inorganic form of P in soil which is immobilized for the soil microorganisms, might take part in the slower buildup of the residual P as approximately one quarter of the P that is present in the bacterial cell from the soil is non-extractable. Meason et al. [47] suggested that applied P fertilizers that are fixed/adsorbed onto the primary minerals can play a vital role in increasing the HCl-Pi pool.
Soil chemical properties such as soil pH, SOM content, and the available and total nutrient concentrations might have an impact on the responses of the soil P fractions to different NPK additions (Figure 4). As reported by Hou et al. [48,49], Sales et al. [50], and Shi et al. [51], P fractions are greatly influenced by the continuous N additions. P fractions in the soil were mainly affected by the soil chemical properties (total and mineral N, SOM, available P, and total-P), physical properties of soil (soil moisture content, particle size distribution), different microbial activities in the soils, and various agricultural management practices, especially rates of the P fertilizer applied to the soils [52,53].

4.2. Grain Yield, P Uptake, and P Efficiency Indices

Long-term NPK additions significantly increased grain yield and P uptake, compared with CT and LNPK (Table 1). This increase could be because long-term NPK addition resulted in increased soil available P and mineral N concentrations along with the increase in labile P pools (Figure 1 and Figure 3). These findings are consistent with the results of Dobermann et al. [54] who revealed that fertilizer P application increases the soluble inorganic P fractions. Another factor for high crop yield could be the higher P application under HNPK that resulted in high crop root density ultimately helping in the greater P uptake and the yield [38,55,56]. This evidence could suggest the maximum P uptake by long-term inorganic additions. Grain yield could be reduced by low P availability or its complete deficiency. Xin et al. [57] also reported that the mineral fertilizer application has a significant impact on the grain yield that might be due to optimum supply of soil macro-nutrients.
PUE represents the efficiency of P uptake from the applied P resources and has useful implications for the nutrient cycle during crop production. PUE was increased by the HNPK additions compared with LNPK addition (Table 1). The HNPK addition depicted higher yield, compared to that of LNPK. Long-term NPK addition improved the efficiency of the P fertilizer applied, especially under conditions of low availability of this nutrient. This difference was possibly caused by difference in P input rates between the two treatments. PRE is linked with the crop P uptake efficiency and it was higher in HNPK compared LNPK probably due the increased P uptake by the crop and higher P application rate under HNPK addition. PFPP is the partial factor productivity that indicates the use efficiency of the applied P and the soil P. It is generally related to the grain yield. PFPP can be explained as a parameter that measures the significant contributions of soil nutrients from the native soil systems as well as from the exotic inputs to the economical outputs [58]. In our study, the soil available nutrients absorbed by the crop under waterlogged paddy soil were mainly obtained from the mineral NPK inputs, other than the soil itself. Therefore, the decrease in PFPP was probably due to the increased N and P supply that did not cause a corresponding increase in the grain yield as much as the P that has been applied. Similar conclusions were also informed by Si et al. [39].

4.3. Pathways of the Transformations in the Soil P Pools and the P Uptake

In this study, SEM significantly explained the effects of SOM, mineral N, and available P on P pools and uptake in the paddy soil (Figure 6). In our results, the mineral N, available P, and SOM showed significant direct effects on the labile P. While, mineral N showed an indirect effect on moderately labile P and the P uptake (Figure 6a). Available P also showed a direct effect on the moderately labile P. These results are in accordance with Jimenez et al. [59] who stated that the SOM and the soil P could be the key factors affecting P mobility and transformations in the paddy soils. Previous research has highlighted the synergistic effect of N on P uptake [60,61,62]. It was also reported that nitrogen application affects the P uptake by increasing the biomass production and the soil carbon inputs [63]. In this study, the P pools (labile P, moderately labile P, non-labile P) did not show a significant effect on the P uptake, possibly due to the lower soil pH because the soil P is highly sensitive to soil pH and P uptake decreased in acidic soils due to high soil P fixation with metal cations. SEM explained the direct and indirect relationship between SOM, mineral N, available P, and P mobility in the paddy soils affected by long-term NPK additions, and it could be valuable in understanding the mechanism of phosphorus transformation and P cycling in paddy soils.

5. Conclusions

In a paddy soil, the response of the soil P fractions to elevated NPK addition indicated that the increase in chemical fertilizer inputs increased the availability of soil nutrients for plant uptake thereby increasing the crop yield. NPK addition also influenced soil P fractions, increased the lability of P, and improved PUE in ferralic cambisol. Therefore, for paddy soils, management of the inorganic fertilizer input rates are essential for attaining high crop productivity and enhanced nutrient use efficiency. The transformations of phosphorus between various P pools under increased NPK additions were well explained by SEM and revealed the potential of the highly stable pools to mobilize P into more labile P forms. Our findings provide a clear understanding of the effects of simulated NPK addition on the dynamics of P present in soil and of the mechanisms that govern soil-plant nutrient interactions.

Author Contributions

Conceptualization and writing—original draft preparation, W.A.; methodology, W.A. and M.Q.; formal analysis, W.A.; investigation, K.L.; resources, K.L. and H.Z.; writing—review and editing, W.A., M.Q., H.Z., S.M., R.M.A.A., M.M. and S.A.; project administration, J.H., Q.H. and Y.X.; supervision, H.Z.; funding acquisition, H.Z.

Funding

This research was supported by the National Key Research and Development Program of China (2016YFD0300901) and the National Natural Science Foundation of China (41561070).

Acknowledgments

We acknowledge all staff for their valuable work associated with the long-term fertilization experiment in Jiangxi province.

Conflicts of Interest

The authors declare no conflict of interest.

References

  1. Williams, A.; Börjesson, G.; Hedlund, K. The effects of 55 years of different inorganic fertiliser regimes on soil properties and microbial community composition. Soil Biol. Biochem. 2013, 67, 41–46. [Google Scholar] [CrossRef]
  2. Brady, N.C.; Weil, R.R. The soils around us. The Nature and Properties of Soils, 14th ed.; Pearson Prentice Hall: Upper Saddle River, NJ, USA, 2008; pp. 1–31. [Google Scholar]
  3. Gichangi, E.M.; Mnkeni, P.N.S.; Brookes, P.C. Effects of goat manure and inorganic phosphate addition on soil inorganic and microbial biomass phosphorus fractions under laboratory incubation conditions. Soil Sci. Plant Nutr. 2009, 55, 764–771. [Google Scholar] [CrossRef]
  4. Khan, K.S.; Joergensen, R.G. Changes in microbial biomass and P fractions in biogenic household waste compost amended with inorganic P fertilizers. Bioresour. Technol. 2009, 100, 303–309. [Google Scholar] [CrossRef] [PubMed]
  5. Malik, M.A.; Marschner, P.; Khan, K.S. Addition of organic and inorganic P sources to soil–Effects on P pools and microorganisms. Soil Biol. Biochem. 2012, 49, 106–113. [Google Scholar] [CrossRef]
  6. Takahashi, S.; Anwar, M.R. Wheat grain yield, phosphorus uptake and soil phosphorus fraction after 23 years of annual fertilizer application to an Andosol. Field Crop. Res. 2007, 101, 160–171. [Google Scholar] [CrossRef]
  7. Aulakh, M.S.; Kabba, B.S.; Baddesha, H.S.; Bahl, G.S.; Mps, G. Crop yields and phosphorus fertilizer transformations after 25 years of applications to a subtropical soil under groundnut-based cropping systems. Field Crop. Res. 2003, 83, 283–296. [Google Scholar] [CrossRef]
  8. Kogel-Knabner, I.; Amelung, W.; Cao, Z.; Fiedler, S.; Frenzel, P.; Jahn, R.; Kalbitz, K.; Kölbl, A.; Schloter, M. Biogeochemistry of paddy soils. Geoderma 2010, 157, 1–14. [Google Scholar] [CrossRef]
  9. Hedley, M.J.; Kirk, G.J.R.; Santos, M.B. Phosphorus efficiency and the forms of soil phosphorus utilized by upland rice cultivars. Plant Soil 1994, 158, 53–62. [Google Scholar] [CrossRef]
  10. Raghothama, K.G.; Karthikeyan, A.S. Phosphate acquisition. Plant Soil 2005, 274, 37. [Google Scholar] [CrossRef]
  11. Fageria, N.K.; Santos, A.B.; Heinemann, A.B. Lowland rice genotypes evaluation for phosphorus use efficiency in tropical lowland. J. Plant Nutr. 2011, 34, 1087–1095. [Google Scholar] [CrossRef]
  12. Xiao, Y.; Wang, D.J.; Zhang, G.; Lu-Ji, B.O.; Peng, X.L. Soil phosphorous accumulation in long-term P fertilization paddy field and its environmental effects. Chin. J. Eco-Agric. 2013, 21, 393–400. [Google Scholar]
  13. Dubinsky, E.A.; Silver, W.L.; Firestone, M.K. Tropical forest soil microbial communities couple iron and carbon biogeochemistry. Ecology 2010, 91, 2604–2612. [Google Scholar] [CrossRef] [PubMed]
  14. Igwe, C.A.; Zarei, M.; Stahr, K. Fe and Al oxides distribution in some ultisols and inceptisols of southeastern Nigeria in relation to soil total phosphorus. Environ. Earth Sci. 2010, 60, 1103–1111. [Google Scholar] [CrossRef]
  15. Halajnia, A.; Haghnia, G.H.; Fotovat, A.; Khorasani, R. Phosphorus fractions in calcareous soils amended with P fertilizer and cattle manure. Geoderma 2009, 150, 209–213. [Google Scholar] [CrossRef]
  16. Lan, Z.M.; Lin, X.J.; Wang, F.; Zhang, H.; Chen, C.R. Phosphorus availability and rice grain yield in a paddy soil in response to long-term fertilization. Biol. Fertil. Soils 2012, 48, 579–588. [Google Scholar] [CrossRef]
  17. Zhang, Q.; Wang, G.H.; Feng, Y.K.; Sun, Q.Z.; Witt, C.; Dobermann, A. Changes in soil phosphorus fractions in a calcareous paddy soil under intensive rice cropping. Plant Soil 2006, 288, 141–154. [Google Scholar] [CrossRef]
  18. Audette, Y.; O’Halloran, I.P.; Paul Voroney, R. Kinetics of phosphorus forms applied as inorganic and organic amendments to a calcareous soil. Geoderma 2016, 262, 119–124. [Google Scholar] [CrossRef]
  19. Shen, J.; Li, R.; Zhang, F.; Fan, J.; Tang, C.; Rengel, Z. Crop yields, soil fertility and phosphorus fractions in response to long-term fertilization under the rice monoculture system on a calcareous soil. Field Crop. Res. 2004, 86, 225–238. [Google Scholar] [CrossRef]
  20. Lee, C.H.; Park, C.Y.; Park, K.D.; Jeon, W.T.; Kim, P.J. Long-term effects of fertilization on the forms and availability of soil phosphorus in rice paddy. Chemosphere 2004, 56, 299–304. [Google Scholar] [CrossRef]
  21. Vu, D.T.; Tang, C.; Armstrong, R.D. Changes and availability of P fractions following 65 years of P application to a calcareous soil in a Mediterranean climate. Plant Soil 2008, 304, 21–33. [Google Scholar] [CrossRef]
  22. Blevins, R.L.; Thomas, G.W.; Smith, M.S.; Frye, W.W.; Cornelius, P.L. Changes in soil properties after 10 years continuous non-tilled and conventionally tilled corn. Soil Tillage Res. 1983, 3, 135–146. [Google Scholar] [CrossRef]
  23. Schroder, J.L.; Zhang, H.; Girma, K.; Raun, W.R.; Penn, C.J.; Payton, M.E. Soil Acidification from Long-Term Use of Nitrogen Fertilizers on Winter Wheat. Soil Sci. Soc. Am. J. 2011, 75, 957. [Google Scholar] [CrossRef]
  24. Obour, A.K.; Mikha, M.M.; Holman, J.D.; Stahlman, P.W. Changes in soil surface chemistry after fifty years of tillage and nitrogen fertilization. Geoderma 2017, 308, 46–53. [Google Scholar] [CrossRef]
  25. Barak, P.; Jobe, B.O.; Krueger, A.R.; Peterson, L.A.; Laird, D.A. Effects of long-term soil acidification due to nitrogen fertilizer inputs in Wisconsin. Plant Soil 1997, 197, 61–69. [Google Scholar] [CrossRef]
  26. Hedley, M.; Bolan, N. Role of Carbon, Nitrogen, and Sulfur Cycles in Soil Acidification. In Handbook of Soil Acidity; CRC Press: Boca Raton, FL, USA, 2003. [Google Scholar]
  27. Fageria, N.K.; dos Santos, A.B.; Moraes, M.F. Influence of Urea and Ammonium Sulfate on Soil Acidity Indices in Lowland Rice Production. Commun. Soil Sci. Plant Anal. 2010, 41, 1565–1575. [Google Scholar] [CrossRef]
  28. Hedley, M.J.; Stewart, J.W.B.; Chauhan, B. Changes in inorganic and organic soil phosphorus fractions induced by cultivation practices and by laboratory incubations. Soil Sci. Soc. Am. J. 1982, 46, 970–976. [Google Scholar] [CrossRef]
  29. Tiessen, H.; Moir, J.O. Characterization of available P by sequential extraction. Soil Sampl. Methods Anal. 1993, 7, 5–229. [Google Scholar]
  30. Condron, L.M.; Newman, S. Revisiting the fundamentals of phosphorus fractionation of sediments and soils. J. Soils Sediments 2011, 11, 830–840. [Google Scholar] [CrossRef]
  31. Negassa, W.; Leinweber, P. How does the Hedley sequential phosphorus fractionation reflect impacts of land use and management on soil phosphorus: A review. J. Plant Nutr. Soil Sci. 2009, 172, 305–325. [Google Scholar] [CrossRef]
  32. Cross, A.F.; Schlesinger, W.H. A literature review and evaluation of the. Hedley fractionation: Applications to the biogeochemical cycle of soil phosphorus in natural ecosystems. Geoderma 1995, 64, 197–214. [Google Scholar] [CrossRef]
  33. Murphy, J.; Riley, J.P. A modified single solution method for the determination of phosphate in natural waters. Anal. Chim. Acta 1962, 27, 31–36. [Google Scholar] [CrossRef]
  34. Olsen, S.R. Estimation of Available Phosphorus in Soils by Extraction with Sodium Bicarbonate; United States Department Of Agriculture: Washington, DC, USA, 1954.
  35. Walkley, A. An Examination of Methods for Determining Organic Carbon and Nitrogen in Soils. (With One Text-figure.). J. Agric. Sci. 1935, 25, 598–609. [Google Scholar] [CrossRef]
  36. Sparks, D.L.; Helmke, P.A.; Page, A.L. Methods of Soil Analysis: Chemical Methods; SSSA: Madison, WI, USA, 1996. [Google Scholar]
  37. Lu, R.K. Soil Agricultural Chemical Analysis Method; China Agricultural Science Technology Press: Beijing, China, 2000; pp. 1–315. [Google Scholar]
  38. Lu, D.; Song, H.; Jiang, S.; Chen, X.; Wang, H.; Zhou, J. Managing fertiliser placement locations and source types to improve rice yield and the use efficiency of nitrogen and phosphorus. Field Crop. Res. 2019, 231, 10–17. [Google Scholar] [CrossRef]
  39. Si, L.; Xie, Y.; Ma, Q.; Wu, L. The short-term effects of rice straw biochar, nitrogen and phosphorus fertilizer on rice yield and soil properties in a cold waterlogged paddy field. Sustainability 2018, 10, 537. [Google Scholar] [CrossRef] [Green Version]
  40. LI, Y.-F.; LUO, A.-C.; WEI, X.-H.; YAO, X.-G. Changes in Phosphorus Fractions, pH, and Phosphatase Activity in Rhizosphere of Two Rice Genotypes. Pedosphere 2008, 18, 785–794. [Google Scholar] [CrossRef]
  41. Luo, Z.; Feng, W.; Luo, Y.; Baldock, J.; Wang, E. Soil organic carbon dynamics jointly controlled by climate, carbon inputs, soil properties and soil carbon fractions. Glob. Chang. Biol. 2017, 23, 4430–4439. [Google Scholar] [CrossRef] [PubMed]
  42. Han, T.; Cai, A.; Liu, K.; Huang, J.; Wang, B.; Li, D.; Qaswar, M.; Feng, G.; Zhang, H. The links between potassium availability and soil exchangeable calcium, magnesium, and aluminum are mediated by lime in acidic soil. J. Soils Sediments 2018, 19, 1–11. [Google Scholar] [CrossRef]
  43. Siddique, M.T.; Robinson, J.S. Phosphorus sorption and availability in soils amended with animal manures and sewage sludge. J. Environ. Qual. 2003, 32, 1114–1121. [Google Scholar] [CrossRef]
  44. Song, C.; Han, X.; Wang, E. Phosphorus budget and organic phosphorus fractions in response to long-term applications of chemical fertilisers and pig manure in a Mollisol. Soil Res. 2011, 49, 253. [Google Scholar] [CrossRef]
  45. Fan, Y.; Lin, F.; Yang, L.; Zhong, X.; Wang, M.; Zhou, J.; Chen, Y.; Yang, Y. Decreased soil organic P fraction associated with ectomycorrhizal fungal activity to meet increased P demand under N application in a subtropical forest ecosystem. Biol. Fertil. Soils 2018, 54, 149–161. [Google Scholar] [CrossRef]
  46. George, T.S.; Giles, C.D.; Menezes-Blackburn, D.; Condron, L.M.; Gama-Rodrigues, A.C.; Jaisi, D.; Lang, F.; Neal, A.L.; Stutter, M.I.; Almeida, D.S.; et al. Correction to: Organic phosphorus in the terrestrial environment: A perspective on the state of the art and future priorities. Plant Soil 2018, 427, 209–211. [Google Scholar] [CrossRef] [Green Version]
  47. Meason, D.F.; Idol, T.W.; Friday, J.B.; Scowcroft, P.G. Effects of fertilisation on phosphorus pools in the volcanic soil of a managed tropical forest. For. Ecol. Manag. 2009, 258, 2199–2206. [Google Scholar] [CrossRef]
  48. Hou, E.; Tang, S.; Chen, C.; Kuang, Y.; Lu, X.; Heenan, M.; Wen, D. Solubility of phosphorus in subtropical forest soils as influenced by low-molecular organic acids and key soil properties. Geoderma 2018, 313, 172–180. [Google Scholar] [CrossRef]
  49. Hou, E.; Wen, D.; Kuang, Y.; Cong, J.; Chen, C.; He, X.; Heenan, M.; Lu, H.; Zhang, Y. Soil pH predominantly controls the forms of organic phosphorus in topsoils under natural broadleaved forests along a 2500 km latitudinal gradient. Geoderma 2018, 315, 65–74. [Google Scholar] [CrossRef]
  50. Sales, M.V.S.; Aleixo, S.; Gama-Rodrigues, A.C.; Gama-Rodrigues, E.F. Structural equation modeling for the estimation of interconnections between the P cycle and soil properties. Nutr. Cycl. Agroecosystems 2017, 109, 193–207. [Google Scholar] [CrossRef]
  51. Shi, L.; Zhang, H.; Liu, T.; Zhang, W.; Shao, Y.; Ha, D.; Li, Y.; Zhang, C.; Cai, X.; Rao, X. Consistent effects of canopy vs. understory nitrogen addition on the soil exchangeable cations and microbial community in two contrasting forests. Sci. Total Environ. 2016, 553, 349–357. [Google Scholar] [CrossRef]
  52. Blake, L.; Mercik, S.; Koerschens, M.; Moskal, S.; Poulton, P.R.; Goulding, K.W.T.; Weigel, A.; Powlson, D.S. Phosphorus content in soil, uptake by plants and balance in three European long-term field experiments. Nutr. Cycl. Agroecosystems 2000, 56, 263–275. [Google Scholar] [CrossRef]
  53. Hinsinger, P. Bioavailability of soil inorganic P in the rhizosphere as affected by root-induced chemical changes: A review. Plant Soil 2001, 237, 173–195. [Google Scholar] [CrossRef]
  54. Dobermann, A.; George, T.; Thevs, N. Phosphorus Fertilizer Effects on Soil Phosphorus Pools in Acid Upland Soils. Soil Sci. Soc. Am. J. 2002, 66, 652–660. [Google Scholar] [CrossRef]
  55. Cassman, K.G.; Dobermann, A.; Walters, D.T. Agroecosystems, nitrogen-use efficiency, and nitrogen management. AMBIO A J. Hum. Environ. 2002, 31, 132–141. [Google Scholar] [CrossRef]
  56. Chen, X.; Zhang, F.; Römheld, V.; Horlacher, D.; Schulz, R.; Böning-Zilkens, M.; Wang, P.; Claupein, W. Synchronizing N supply from soil and fertilizer and N demand of winter wheat by an improved N min method. Nutr. Cycl. Agroecosystems 2006, 74, 91–98. [Google Scholar] [CrossRef]
  57. Xin, X.; Qin, S.; Zhang, J.; Zhu, A.; Yang, W.; Zhang, X. Yield, phosphorus use efficiency and balance response to substituting long-term chemical fertilizer use with organic manure in a wheat-maize system. Field Crop. Res. 2017, 208, 27–33. [Google Scholar] [CrossRef]
  58. Ierna, A.; Mauro, R.P.; Mauromicale, G. Improved yield and nutrient efficiency in two globe artichoke genotypes by balancing nitrogen and phosphorus supply. Agron. Sustain. Dev. 2012, 32, 773–780. [Google Scholar] [CrossRef]
  59. Jiménez, J.L.G.; Healy, M.G.; Daly, K. Effects of fertiliser on phosphorus pools in soils with contrasting organic matter content: A fractionation and path analysis study. Geoderma 2019, 338, 128–135. [Google Scholar] [CrossRef]
  60. Yuan, Z.Y.; Chen, H.Y.H. Decoupling of nitrogen and phosphorus in terrestrial plants associated with global changes. Nat. Clim. Chang. 2015, 5, 465–469. [Google Scholar] [CrossRef]
  61. Wang, Y.; Zhao, X.; Wang, L.; Jin, S.; Zhu, W.; Lu, Y.; Wang, S. A five-year P fertilization pot trial for wheat only in a rice-wheat rotation of Chinese paddy soil: Interaction of P availability and microorganism. Plant Soil 2015, 399, 305–318. [Google Scholar] [CrossRef]
  62. de Groot, C.C.; Marcelis, L.F.M.; van den Boogaard, R.; Kaiser, W.M.; Lambers, H. Interaction of nitrogen and phosphorus nutrition in determining growth. Plant Soil 2003, 248, 257–268. [Google Scholar] [CrossRef]
  63. Joshi, R.V.; Patel, B.J.; Patel, K.M. Effect of nitrogen levels and time of application on growth, yield, quality, nitrogen, phosphorus content and uptake for seed production of oat (Avena sativa L.). Forage Res. 2015, 41, 104–108. [Google Scholar]
Figure 1. Effect of NPK addition on (a) soil pH, (b) soil organic matter (SOM), (c) total P, (d) Olsen P, (e) total N, and (f) mineral N concentrations. Data (means ± standard deviation n = 3) followed by different lowercase letters denote significant differences between the treatments followed by Tukey’s test, p ≤ 0.05. Abbreviations: CT, LNPK, and HNPK represent the control and low NPK and high NPK addition, respectively.
Agronomy 09 00784 g001
Figure 2. The relative distribution of different P-fractions in each fertilization treatment. Abbreviations: CT, LNPK, and HNPK represent control, low NPK, and high NPK addition, respectively.
Agronomy 09 00784 g002
Figure 3. Responses of soil P pools to NPK addition to (a) Labile-P, (b) moderately labile-P, and (c) non-labile-P. Box plots show the median (horizontal lines), mean (red dotted line), 25th and 75th percentiles (box), 5th and 95th percentiles (whisker caps), and outliers (circles).
Agronomy 09 00784 g003
Figure 4. Correlations between the various P fractions and soil chemical properties as determined by the redundancy analysis. Abbreviations: SOM: soil organic matter, TP: total P, OP: Olsen-P, TN: total nitrogen, AN: mineral nitrogen, red lines: explanatory variables, blue lines: response variables, red dotted lines: non-significant variables, red solid lines: significant variables.
Agronomy 09 00784 g004
Figure 5. Relationship between grain yield and phosphorus use efficiency.
Agronomy 09 00784 g005
Figure 6. (a) Structural equation modeling results on the direct and the indirect effects of mineral N, available P, and SOM on lability of P and the P uptake. Numbers closest to arrows are standardized path coefficients, equivalent to relative regression weights, and indicative of the effect size of the relationship. Continuous and dashed arrows show direct and indirect relationships respectively. Gray arrows show non-significant effects. The proportion of variance explained (R2) appears above every response variable in the model. Goodness-of-fit statistics for each model are shown in the lower right corner. Chi/df = 0.40 RMSEA: Root mean square error of approximation. (b) Total standardized effects of different variables on the P uptake.
Agronomy 09 00784 g006
Figure 7. A conceptual framework of soil P pool responses to different NPK additions. (+) Increase P fixation; (−) decrease P fixation, hence increases the availability of P for plant uptake. Colors: Blue = NaHCO3-Pi and Po; red = NaOH-Pi and Po, HCl. dil-Pi; light brown = HCl. conc. Pi and Po, residual-Pi.
Agronomy 09 00784 g007
Table 1. Phosphorus uptake, grain yield, phosphorus use efficiency (PUE), phosphorus recovery efficiency (PRE), and partial factor productivity for P (PFPP) under different inorganic fertilizer treatments.
TreatmentsP UptakeGrain YieldPUEPREPFPP
CT10.43 ± 0.15 c4145.80 ± 18.69 c---
LNPK11.48 ± 0.17 b4236.01 ± 25.26 b4.61 ± 1.42 b0.05 ± 0.02 b215.70 ± 1.29 a
HNPK14.11 ± 0.43 a4880.62 ± 19.47 a18.72 ± 0.72 a0.09 ± 0.01 a124.26 ± 0.50 b
Mean ± SD (n = 3). Mean values followed by the same letter are not significantly different at p < 0.05. PUE: P use efficiency (kg grain kg−1 P applied); PRE: P recovery efficiency (kg P uptake kg−1 P applied); PFPP: P partial factor productivity (kg grain kg−1 P applied).

