
Genotypic Variation in Seedling Tolerance to Aluminum Toxicity in Historical Maize Inbred Lines of Zambia

Abstract
:1. Introduction
2. Material and Methods
2.1. Plant Materials
2.2. Hydroponic Experiment
- Fij = membership index value of the ith inbred line, jth trait
- Xij = ratio of the ith inbred line, jth trait
- Xmin = minimum ratio of the trait
- Xmax = maximum ratio of the trait
- Fi = membership index averaged over n traits of the ith accession

| Trait | Details |
|---|---|
| Initial root length (IRL) | Length of roots recorded before the seedlings were transferred into the nutrient solution |
| Final root length (FRL) | Root length recorded after seedlings have been exposed to nutrient solution |
| Number of roots (NOR) | Number of roots formed after the seedlings have been exposed to aluminum stress |
| Shoot or Root dry matter (SDM or RDM) | The weight of root or shoot growth parts |
| Total dry matter (TDM) | The weight of shoot and root growth parts (Sum of root and shoot biomass) |
| Shoot Length (SL) | Length of the shoot measured after seedlings have been exposed to aluminum stress |
| Shoot length response or root length response | This was calculated by using Equation (1). |
| Net root growth (NRG) | This was calculated by subtracting the root length of maize seedlings in aluminum stress from the control. |
| Shoot length: shoot dry matter ratio (SLSDMratio) | Estimated by dividing shoot dry matter by shoot length |
| Shoot: root dry matter ratio (SRDMratio) | Estimated by dividing shoot dry matter by root dry matter |
| Shoot: root length ratio (SLRLratio) | Estimated by dividing shoot length by root length |
| Rank 1: Fi ≥0.8 | (highly tolerant) |
|---|---|
| Rank 2: 0.6 ≥ Fi < 0.8 | (tolerant) |
| Rank 3: 0.4 ≥ Fi < 0.6 | (intermediate tolerance) |
| Rank 4: 0.2 ≥ Fi < 0.4 | (susceptible) |
| Rank 5: Fi < 0.2 | (highly susceptible) |
2.3. Statistical Analysis
- PCV = Phenotypic Coefficient of Variability
- GCV = Genotypic Coefficient of Variability,
- = mean of the character
3. Results
3.1. Analysis of Variance (ANOVA) for Seedling Traits
| Genotype | IRL | FRL | ARL | SRL | RRL | RLR | SL | SLR | SLSDM Ratio | NOR | RDM | SDM | TDM | SRDM Ratio | SLRL Ratio | NRG |
|---|---|---|---|---|---|---|---|---|---|---|---|---|---|---|---|---|
| POOL 16 | 1.81 | 16.47 | 14.66 | 692.04 | 101.49 | −0.63 | 6.17 | −11.35 | 172.09 | 3.38 | 0.03 | 0.04 | 0.08 | 1.83 | 0.45 | 1.20 |
| L12 | 2.33 | 7.81 | 5.49 | 521.96 | 113.39 | 21.50 | 3.21 | 2.32 | 156.95 | 2.00 | 0.02 | 0.03 | 0.04 | 2.72 | 0.41 | −6.04 |
| L143 | 1.13 | 10.13 | 8.99 | 491.29 | 100.26 | 2.68 | 6.06 | 0.24 | 216.46 | 3.92 | 0.02 | 0.03 | 0.06 | 1.64 | 0.89 | 1.99 |
| L710 | 1.13 | 5.70 | 4.56 | 996.63 | 102.21 | −0.62 | 12.25 | −9.04 | 661.89 | 1.17 | 0.01 | 0.02 | 0.03 | 4.92 | 2.97 | −1.57 |
| L911 | 1.45 | 6.53 | 4.68 | 1039.71 | 94.41 | −23.79 | 5.96 | −1.70 | 199.25 | 1.54 | 0.01 | 0.04 | 0.05 | 7.73 | 1.25 | −0.02 |
| L913 | 2.68 | 14.17 | 11.49 | 504.79 | 93.29 | −1.71 | 5.71 | −16.59 | 133.72 | 3.71 | 0.03 | 0.05 | 0.08 | 2.08 | 0.69 | 4.25 |
| L917 | 2.35 | 8.18 | 5.83 | 149.13 | 76.64 | −27.19 | 5.85 | −5.92 | 176.08 | 3.54 | 0.04 | 0.04 | 0.08 | 1.08 | 1.45 | −3.56 |
| L1214 | 1.89 | 12.17 | 10.28 | 529.29 | 150.21 | 89.03 | 5.88 | −14.31 | 111.20 | 2.96 | 0.03 | 0.06 | 0.08 | 3.74 | 0.69 | 3.51 |
| L3233 | 1.70 | 11.56 | 9.87 | 1152.00 | 149.25 | 85.50 | 5.79 | −3.48 | 308.92 | 2.63 | 0.01 | 0.03 | 0.04 | 3.50 | 1.13 | −0.14 |
| L3234 | 3.05 | 17.40 | 14.34 | 1129.04 | 127.58 | 44.96 | 5.63 | 23.95 | 168.29 | 1.92 | 0.02 | 0.04 | 0.06 | 2.54 | 0.45 | 3.13 |
| ZM421 | 2.19 | 16.50 | 14.31 | 323.08 | 146.23 | 68.85 | 6.83 | −5.45 | 155.00 | 3.21 | 0.06 | 0.05 | 0.10 | 0.99 | 0.55 | −0.29 |
| ZM521 | 2.17 | 15.47 | 13.30 | 311.54 | 123.18 | 45.60 | 6.52 | −1.83 | 206.21 | 5.08 | 0.05 | 0.03 | 0.08 | 0.77 | 0.55 | −1.54 |
| L5522 | 2.06 | 9.90 | 7.84 | 844.00 | 92.02 | −11.78 | 5.10 | 2.67 | 159.95 | 1.71 | 0.02 | 0.04 | 0.07 | 2.79 | 0.63 | −3.20 |
| L5527 | 2.10 | 13.54 | 11.44 | 936.29 | 123.36 | 45.58 | 7.48 | 32.09 | 136.48 | 2.17 | 0.03 | 0.06 | 0.10 | 5.37 | 0.83 | 3.46 |
| Mean | 2.003 | 11.824 | 9.791 | 687.199 | 113.823 | 24.141 | 6.317 | −0.600 | 211.606 | 2.781 | 0.027 | 0.040 | 0.068 | 2.979 | 0.924 | 0.084 |
| Probability of main effects and their interactions | ||||||||||||||||
| Genotype | 0.000 | 0.033 | 0.049 | 0.065 | 0.007 | 0.027 | 0.287 | 0.869 | 0.002 | 0.167 | 0.092 | 0.000 | 0.000 | 0.034 | 0.317 | 0.756 |
| Environment | 0.426 | 0.898 | 0.785 | 0.497 | 0.519 | 0.346 | 0.572 | 0.815 | 0.933 | 0.557 | 0.942 | 0.603 | 0.842 | 0.515 | 0.605 | 0.573 |
| interaction | 0.000 | 0.000 | 0.000 | 0.000 | 0.000 | 0.000 | 0.000 | 0.000 | 0.000 | 0.000 | 0.000 | 0.000 | 0.000 | 0.000 | 0.000 | 0.000 |
3.2. Phenotypic and Genotypic Coefficients of Variation, Heritability, and Genetic Advance as Percent of the Mean
| Variable | Grand Mean | VG | VGxEn | VP | h2bs (%) | PCV | GCV | GA | GG |
|---|---|---|---|---|---|---|---|---|---|
| IRL | 2.00 | 0.2031 | 0.4339 | 0.2947 | 68.9 | 27.1 | 22.5 | 0.77 | 38.5 |
| FRL | 11.82 | 13.716 | 5.553 | 15.2272 | 90.1 | 33.0 | 31.3 | 7.24 | 61.2 |
| ARL | 9.79 | 11.6236 | 7.4616 | 13.4773 | 86.3 | 37.5 | 34.8 | 6.52 | 66.6 |
| SRL | 687.20 | 52,020.44 | 158,743.45 | 108,080.2273 | 48.1 | 47.8 | 33.2 | 325.96 | 47.4 |
| RRL | 113.82 | 412.6663 | 351.6464 | 548.0072 | 75.3 | 20.6 | 17.8 | 36.31 | 31.9 |
| RLR | 24.14 | 1224.88 | 672.9026 | 1531.7734 | 80.0 | 162.1 | 145.0 | 64.47 | 267.1 |
| SL | 6.32 | 3.511 | 1.2157 | 3.8265 | 91.8 | 31.0 | 29.7 | 3.70 | 58.5 |
| SLR | −0.60 | 130.6968 | 79.2851 | 183.4006 | 71.3 | 2257.1 | 1905.4 | 19.88 | 3313.5 |
| SLSDMratio | 211.61 | 17,912.03 | 3212.58 | 19,060.2367 | 94.0 | 65.2 | 63.2 | 267.27 | 126.3 |
| NOR | 2.78 | 1.0852 | 0.0806 | 1.2036 | 90.2 | 39.4 | 37.5 | 2.04 | 73.3 |
| RDM | 0.03 | 0.0002 | 0.0001 | 0.0002 | 90.3 | 52.1 | 52.1 | 0.03 | 107.3 |
| SDM | 0.04 | 0.0001 | 0.0001 | 0.0002 | 88.3 | 35.4 | 25.0 | 0.01 | 36.4 |
| TDM | 0.07 | 0.0005 | 0.0002 | 0.0005 | 87.8 | 33.0 | 33.0 | 0.05 | 67.9 |
| SRDMratio | 2.98 | 2.5002 | 3.6912 | 3.8111 | 65.6 | 65.5 | 53.1 | 2.64 | 88.6 |
| SLRLRATIO | 0.92 | 0.3902 | 0 | 0.4806 | 81.2 | 75.0 | 67.6 | 1.16 | 125.4 |
| NRG | 0.08 | 6.3832 | 11.5206 | 9.3671 | 68.2 | 3631.2 | 2997.5 | 4.30 | 5097.4 |
3.3. Associations among Seedling Traits
| Trait | IRL | FRL | ARL | SRL | RRL | RLR | SL | SLR | SLSDM Ratio | NOR | RDM | SDM | TDM | SRDM Ratio | SLRL Ratio |
|---|---|---|---|---|---|---|---|---|---|---|---|---|---|---|---|
| FRL2 | 0.56 1 * | ||||||||||||||
| ARL | 0.45 | 0.99 ** | |||||||||||||
| SRL | −0.18 | −0.11 | −0.10 | ||||||||||||
| RRL | 0.09 | 0.46 | 0.49 | 0.16 | |||||||||||
| RLR | 0.16 | 0.49 | 0.51 | 0.09 | 0.98 ** | ||||||||||
| SL | −0.48 | −0.18 | −0.12 | 0.24 | −0.02 | −0.05 | |||||||||
| SLR | 0.29 | 0.19 | 0.16 | 0.43 | 0.14 | 0.14 | −0.07 | ||||||||
| SLSDM ratio | −0.57 * | −0.48 | −0.42 | 0.36 | −0.09 | −0.14 | 0.82 ** | −0.18 | |||||||
| NOR | 0.14 | 0.48 | 0.50 | −0.73 ** | 0.05 | 0.14 | −0.22 | −0.33 | −0.36 | ||||||
| RDM | 0.39 | 0.57 * | 0.56 * | −0.76 ** | 0.20 | 0.25 | −0.09 | −0.11 | −0.43 | 0.67 ** | |||||
| SDM | 0.39 | 0.43 | 0.40 | −0.14 | 0.27 | 0.31 | −0.23 | 0.17 | −0.67 ** | 0.07 | 0.40 | ||||
| TDM | 0.39 | 0.64 * | 0.62 * | −0.50 | 0.12 | 0.18 | −0.14 | 0.12 | −0.64 ** | 0.50 | 0.81 ** | 0.78 ** | |||
| SRDM ratio | −0.40 | −0.50 | −0.49 | 0.70 ** | −0.02 | −0.10 | 0.28 | 0.23 | 0.27 | −0.72 ** | −0.65 ** | 0.09 | −0.37 | ||
| SLRL ratio | −0.57 * | −0.66 ** | −0.62 * | 0.26 | −0.28 | −0.30 | 0.82 ** | −0.20 | 0.89 ** | −0.39 | −0.40 | −0.45 | −0.50 | 0.41 | |
| NRG | 0.08 | 0.53 * | 0.56 * | 0.24 | 0.29 | 0.31 | 0.15 | 0.13 | −0.22 | 0.16 | 0.01 | 0.57 * | 0.38 | 0.15 | −0.18 |
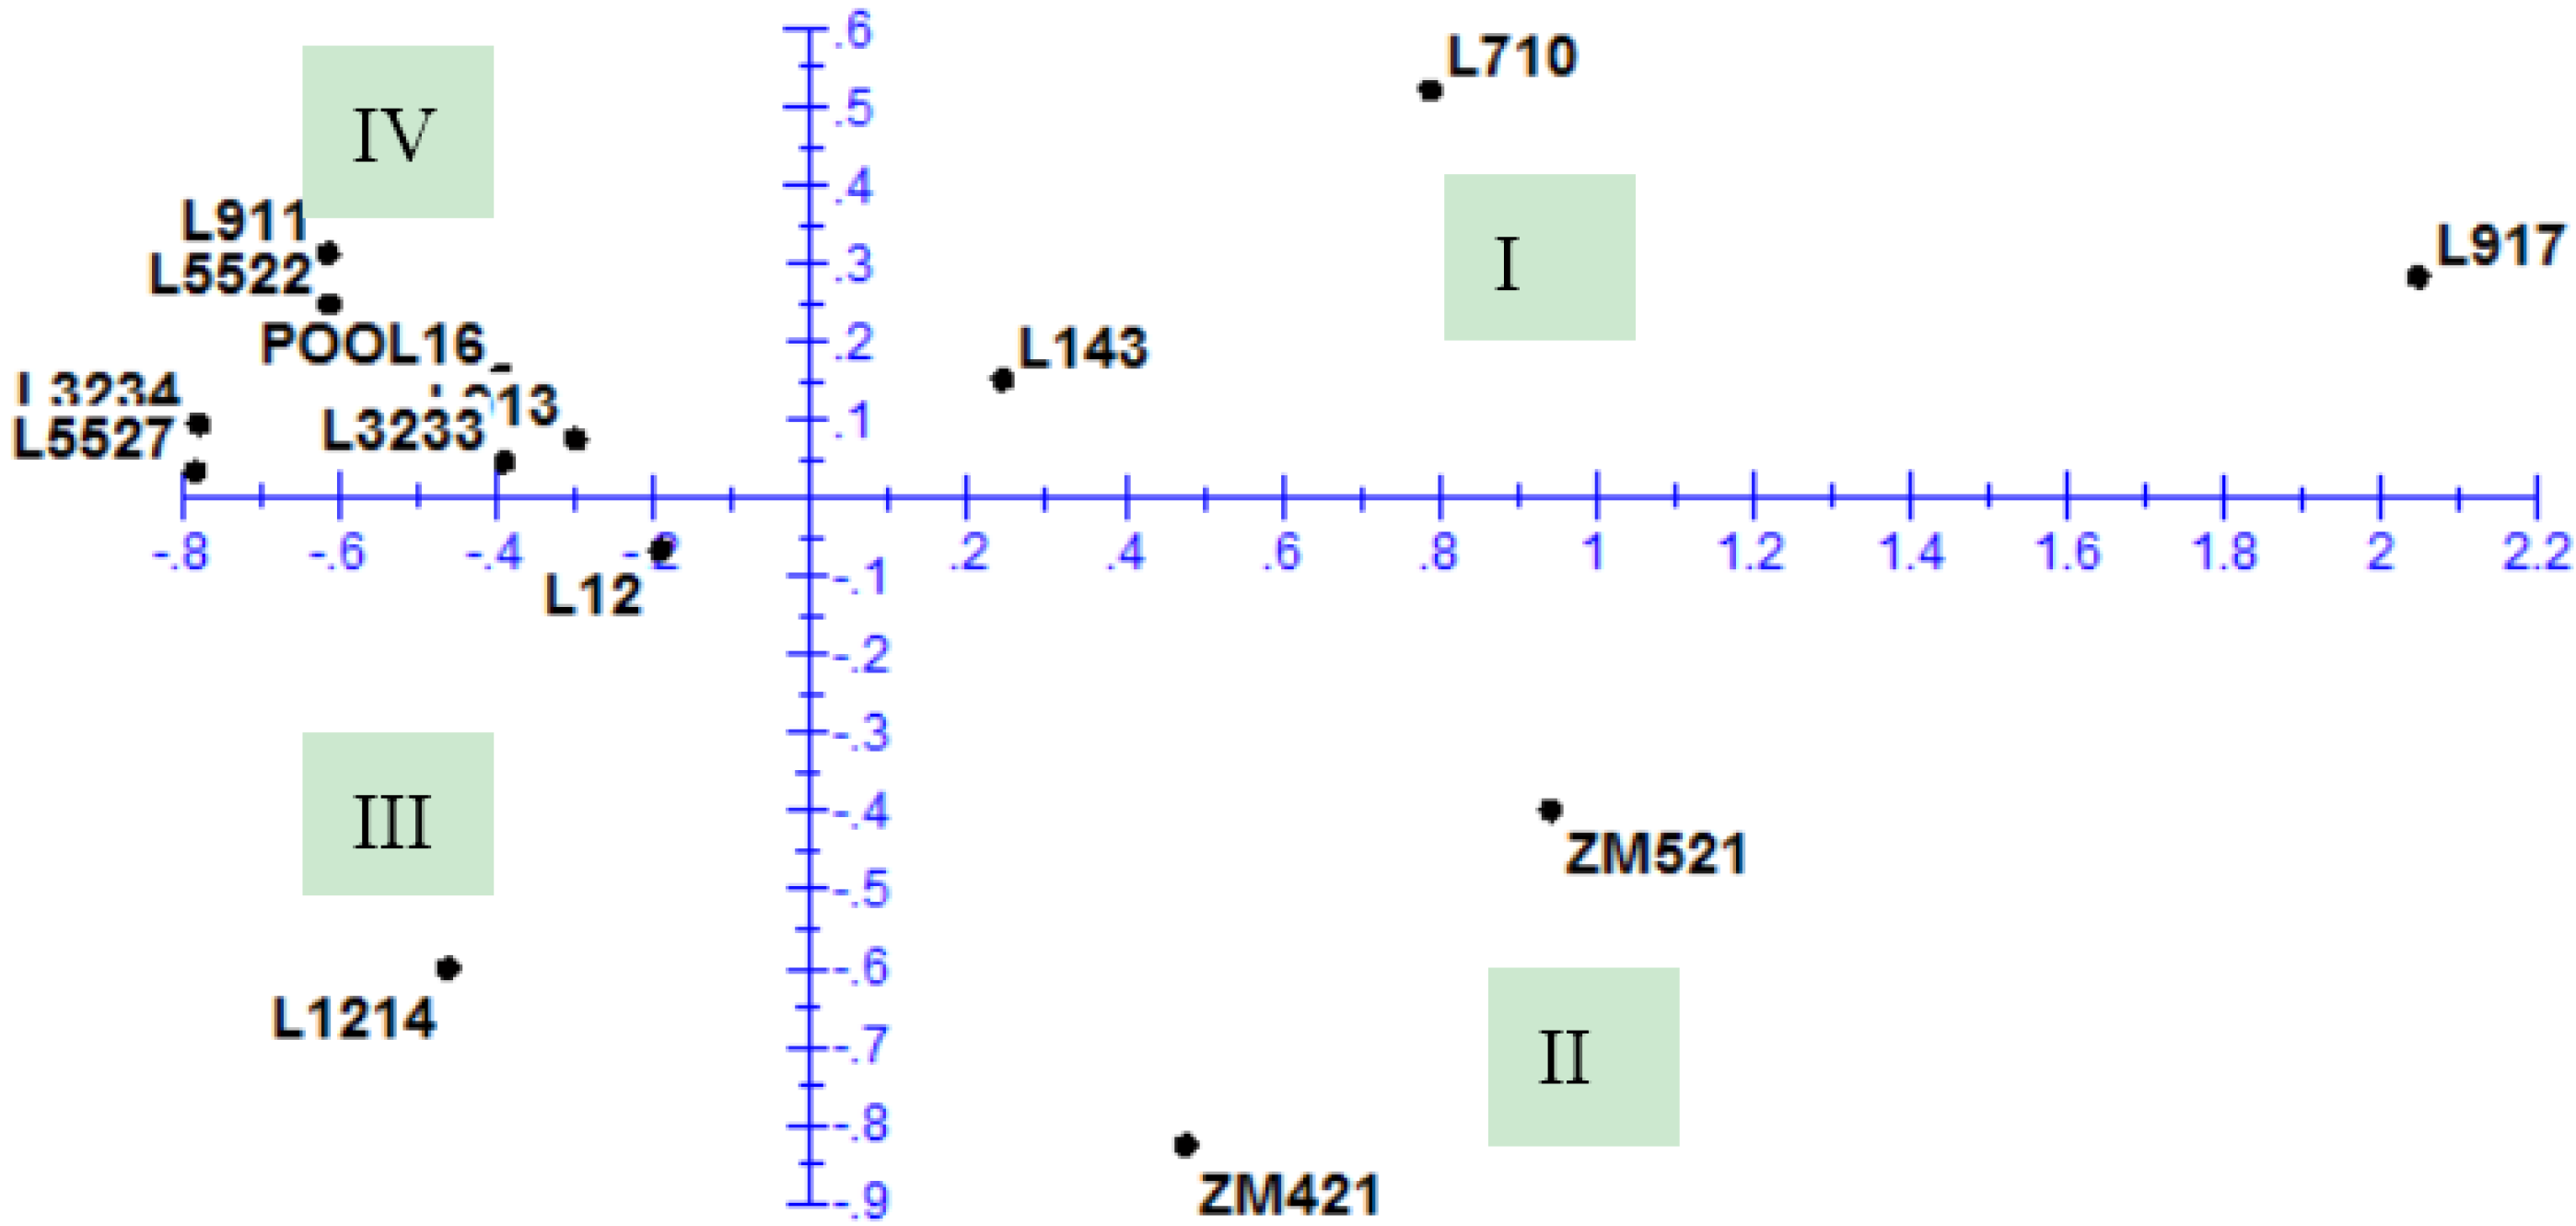
3.4. Principal Component Analysis
| Value | PC 1 | PC 2 | PC 3 | PC 4 | PC 5 | PC 6 |
|---|---|---|---|---|---|---|
| Eigenvalue | 6.462 | 2.932 | 2.100 | 1.477 | 1.061 | 0.892 |
| Proportion | 0.404 | 0.183 | 0.131 | 0.092 | 0.066 | 0.056 |
| Cumulative | 0.404 | 0.587 | 0.718 | 0.811 | 0.877 | 0.933 |
| Component loadings * | ||||||
| IRL | 0.25 | −0.02 | 0.27 | 0.09 | −0.34 | 0.23 |
| FRL | 0.34 | −0.16 | −0.14 | 0.04 | −0.31 | −0.16 |
| ARL | 0.33 | −0.16 | −0.20 | 0.04 | −0.29 | −0.20 |
| SRL | −0.19 | −0.46 | 0.10 | 0.07 | −0.21 | −0.18 |
| RRL | 0.15 | −0.35 | −0.27 | 0.37 | 0.32 | 0.17 |
| RLR | 0.18 | −0.32 | −0.27 | 0.36 | 0.31 | 0.18 |
| SL | −0.19 | −0.10 | −0.49 | −0.31 | −0.21 | 0.20 |
| SLR | 0.04 | −0.32 | 0.26 | −0.01 | −0.43 | 0.40 |
| SLSDM ratio | −0.31 | −0.02 | −0.39 | 0.06 | −0.21 | 0.08 |
| NOR | 0.25 | 0.30 | −0.24 | 0.02 | 0.02 | −0.29 |
| RDM | 0.30 | 0.22 | −0.21 | −0.10 | 0.01 | 0.40 |
| SDM | 0.25 | −0.20 | 0.13 | −0.44 | 0.34 | 0.15 |
| TDM | 0.32 | 0.03 | −0.04 | −0.41 | 0.03 | 0.22 |
| SRDMratio | −0.24 | −0.33 | 0.16 | −0.25 | 0.27 | 0.03 |
| SLRLratio | −0.32 | 0.03 | −0.30 | −0.20 | −0.05 | 0.19 |
| NRG | 0.15 | −0.33 | −0.15 | −0.38 | −0.01 | −0.49 |
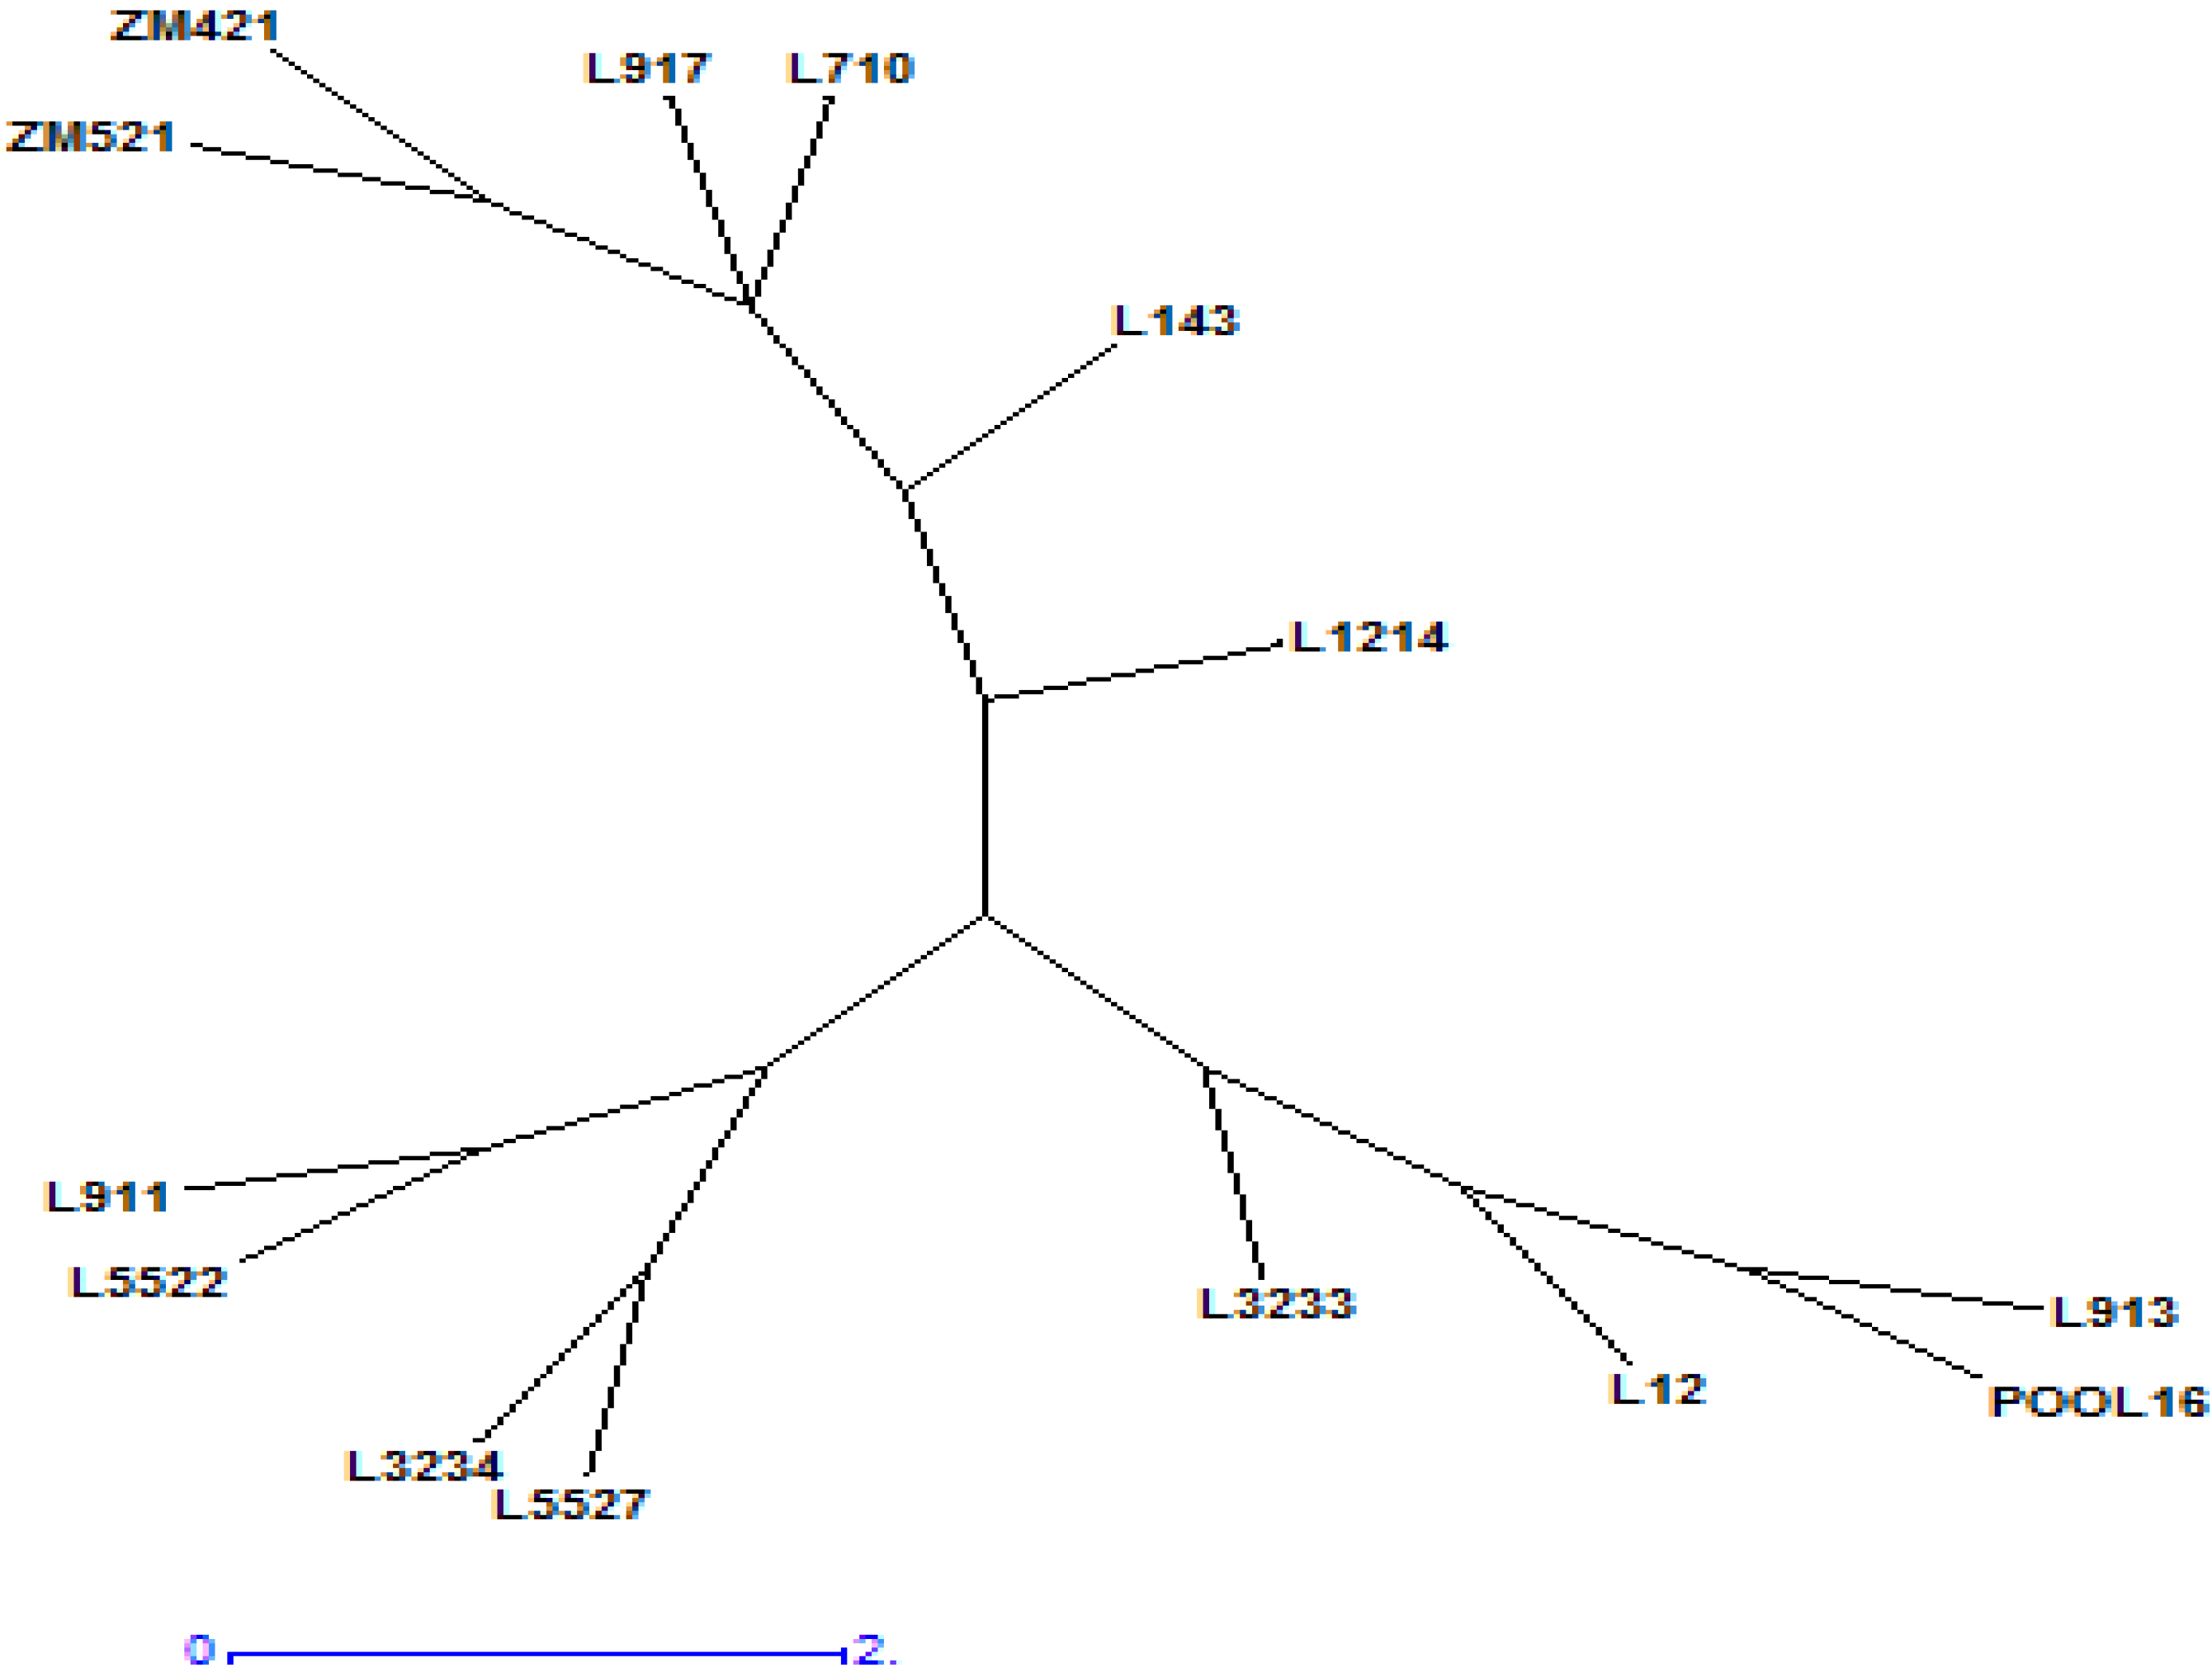
3.5. Cluster Analysis and Similarity between Inbred Lines
| Genotype | POOL16 | L12 | L143 | L710 | L911 | L913 | L917 | L1214 | L3233 | L3234 | ZM421 | ZM521 | L5522 | L5527 |
|---|---|---|---|---|---|---|---|---|---|---|---|---|---|---|
| POOL16 | 0.00 | |||||||||||||
| L12 | 0.33 | 0.00 | ||||||||||||
| L143 | 0.66 | 0.50 | 0.00 | |||||||||||
| L710 | 1.34 | 1.24 | 0.78 | 0.00 | ||||||||||
| L911 | 0.29 | 0.58 | 0.90 | 1.50 | 0.00 | |||||||||
| L913 | 0.16 | 0.26 | 0.60 | 1.32 | 0.43 | 0.00 | ||||||||
| L917 | 2.46 | 2.29 | 1.86 | 1.49 | 2.68 | 2.38 | 0.00 | |||||||
| L1214 | 0.78 | 0.63 | 1.06 | 1.74 | 0.93 | 0.73 | 2.68 | 0.00 | ||||||
| L3233 | 0.30 | 0.35 | 0.68 | 1.29 | 0.43 | 0.38 | 2.50 | 0.68 | 0.00 | |||||
| L3234 | 0.44 | 0.64 | 1.05 | 1.69 | 0.30 | 0.56 | 2.85 | 0.78 | 0.46 | 0.00 | ||||
| ZM421 | 1.32 | 1.02 | 1.01 | 1.44 | 1.58 | 1.21 | 1.96 | 0.97 | 1.24 | 1.56 | 0.00 | |||
| ZM521 | 1.47 | 1.20 | 0.90 | 0.97 | 1.73 | 1.37 | 1.40 | 1.44 | 1.41 | 1.81 | 0.65 | 0.00 | ||
| L5522 | 0.26 | 0.54 | 0.89 | 1.52 | 0.08 | 0.39 | 2.67 | 0.87 | 0.41 | 0.26 | 1.54 | 1.70 | 0.00 | |
| L5527 | 0.47 | 0.63 | 1.07 | 1.72 | 0.36 | 0.57 | 2.86 | 0.74 | 0.48 | 0.08 | 1.54 | 1.80 | 0.31 | 0.00 |


| Cluster | Parameters | IRL | FRL | ARL | SRL | RRL | RLR | SL | SLR | SLSDM Ratio | NOR | RDM | SDM | TDM | SRDM Ratio | SLRL Ratio | NRG |
|---|---|---|---|---|---|---|---|---|---|---|---|---|---|---|---|---|---|
| Cluster 1 | Mean | 2.13 | 12.50 | 10.38 | 717.70 | 114.36 | 26.17 | 5.22 | −7.28 | 192.92 | 2.93 | 0.02 | 0.04 | 0.06 | 2.53 | 0.67 | −0.18 |
| Pool16, L12, L913, L3233 | Max | 2.68 | 16.47 | 14.66 | 1152.00 | 149.25 | 85.50 | 6.17 | 2.32 | 308.92 | 3.71 | 0.03 | 0.05 | 0.08 | 3.50 | 1.13 | 4.25 |
| Min | 1.70 | 7.81 | 5.49 | 504.79 | 93.29 | −1.71 | 3.21 | −16.59 | 133.72 | 2.00 | 0.01 | 0.03 | 0.04 | 1.83 | 0.41 | −6.04 | |
| Range | 0.98 | 8.66 | 9.17 | 647.21 | 55.96 | 87.21 | 2.96 | 18.91 | 175.20 | 1.71 | 0.02 | 0.02 | 0.04 | 1.67 | 0.72 | 10.29 | |
| Cluster 2 | Mean | 2.17 | 11.84 | 9.58 | 987.26 | 109.34 | 13.74 | 6.04 | 14.25 | 165.99 | 1.84 | 0.02 | 0.05 | 0.07 | 4.61 | 0.79 | 0.84 |
| L911, L3234, L5522, L5527 | Max | 3.05 | 17.40 | 14.34 | 1129.04 | 127.58 | 45.58 | 7.48 | 32.09 | 199.25 | 2.17 | 0.03 | 0.06 | 0.10 | 7.73 | 1.25 | 3.46 |
| Min | 1.45 | 6.53 | 4.68 | 844.00 | 92.02 | −23.79 | 5.10 | −1.70 | 136.48 | 1.54 | 0.01 | 0.04 | 0.05 | 2.54 | 0.45 | −3.20 | |
| Range | 1.60 | 10.87 | 9.66 | 285.04 | 35.56 | 69.37 | 2.38 | 33.79 | 62.77 | 0.63 | 0.02 | 0.02 | 0.05 | 5.19 | 0.80 | 6.66 | |
| Cluster 3 | Mean | 1.81 | 11.36 | 9.55 | 466.83 | 116.46 | 29.73 | 7.23 | −6.05 | 254.47 | 3.31 | 0.04 | 0.04 | 0.07 | 2.19 | 1.18 | −0.24 |
| L143, L710, L917, L1214, ZM421, ZM521 | Max | 2.35 | 16.50 | 14.31 | 996.63 | 150.21 | 89.03 | 12.25 | 0.24 | 661.89 | 5.08 | 0.06 | 0.06 | 0.10 | 4.92 | 2.97 | 3.51 |
| Min | 1.13 | 5.70 | 4.56 | 149.13 | 76.64 | −27.19 | 5.85 | −14.31 | 111.20 | 1.17 | 0.01 | 0.02 | 0.03 | 0.77 | 0.55 | −3.56 | |
| Range | 1.22 | 10.80 | 9.75 | 847.50 | 73.57 | 116.22 | 6.40 | 14.55 | 550.69 | 3.91 | 0.05 | 0.04 | 0.07 | 4.15 | 2.42 | 7.07 |
| Genotype | ARL | RRL | RLR | Mean | ||||
|---|---|---|---|---|---|---|---|---|
| Score | Class | Score | Class | Score | Class | Score | Class | |
| POOL16 | 0.32 | S | 0.34 | S | 0.29 | S | 0.32 | S |
| L12 | 0.52 | I | 0.51 | I | 0.49 | I | 0.51 | I |
| L143 | 0.38 | S | 0.37 | S | 0.34 | S | 0.36 | S |
| L710 | 0.30 | S | 0.34 | S | 0.27 | S | 0.30 | S |
| L911 | 0.14 | HS | 0.26 | S | 0.11 | HS | 0.17 | HS |
| L913 | 0.34 | S | 0.31 | S | 0.32 | S | 0.32 | S |
| L917 | 0.16 | HS | 0.11 | HS | 0.14 | HS | 0.14 | HS |
| L1214 | 0.82 | HT | 0.78 | T | 0.83 | HT | 0.81 | HT |
| L3233 | 0.74 | T | 0.82 | HT | 0.84 | HT | 0.80 | HT |
| L3234 | 0.59 | I | 0.57 | I | 0.56 | I | 0.57 | I |
| ZM421 | 0.49 | I | 0.76 | T | 0.72 | T | 0.66 | T |
| ZM521 | 0.50 | I | 0.56 | I | 0.57 | I | 0.54 | I |
| L5522 | 0.20 | S | 0.28 | S | 0.25 | S | 0.24 | S |
| L5527 | 0.60 | T | 0.59 | I | 0.61 | T | 0.60 | T |
4. Discussion
4.1. Correlation among Seedling Traits
4.2. Phenotypic and Genotypic Coefficients of Variation, Heritability, and Genetic Advance as Percent of the Mean
4.3. Principal Component Analysis and Cluster Analysis
4.4. Implications on Plant Breeding in Zambia
5. Conclusions
Acknowledgments
Author Contributions
Conflicts of Interest
References
- Kumwenda, J.D.T.; Waddington, S.R.; Snapp, S.S.; Jones, R.B.; Blackie, M.J. Soil fertility management research for the maize cropping systems of smallholders in southern africa: A review. In NRG Paper; CIMMYT: Mexico, DF, Mexico, 1996; Volume 96–02, p. 30. [Google Scholar]
- Duraes, F.M.; Gama, E.E.G.; Magalhaes, P.C.; Marriel, I.E.; Casela, C.R.; Oliveira, A.C.; Luchiari-Junior, A.; Shanahan, J.F. The Usefulness of Chlorophyll Fluorescence in Screening for Disease Resistance, Water Stress Tolerance, Aluminum Toxicity Tolerance and Nitrogen Use Effeciency in Maize. In Proceedings of the Seventh Eastern and Southern Africa Regional Maize Conference, Harare, Zimbabwe, 11–15 February 2001; pp. 356–360.
- Gudu, S.O.; Okalebo, J.R.; Othieno, C.O.; Obura, P.A.; Ligeyo, D.O.; Shulze, D.; Johnston, C. Response of five maize genotypes to nitrogen, phosphorus and lime on acid soils of western kenya. Afr. Crop Sci. 2005, 7, 1109–1115. [Google Scholar]
- Foy, C.D. Physiological effects of hydrogen, aluminum and manganese toxicities in acid soils. In Soil Acidity and Liming, Agronomy Monograph 12, 2nd ed.; Adams, F., Ed.; American Society of Agronomy: Madison, WI, USA, 1984; pp. 57–97. [Google Scholar]
- Fageria, N.K.; Baligar, V.C.; Wright, R.J. Alumimium toxicity in crop plants. J. Plant Nutr. 1988, 11, 303–319. [Google Scholar] [CrossRef]
- Donovan, C.; Damaseke, M.; Govereh, J.; Simumba, D. Framework and initial analyses of fertilizer profitabillity in maize and cotton. In Food Security Research Project; CIMMYT: Harare, Zimbabwe, 2002; pp. 1–64. [Google Scholar]
- Tveitnes, S.; Svads, H. The effect of lime on maize and groundnut yields in the high rainfall areas of zambia. Nowegian J. Agric. Sci. 1989, 3, 173–180. [Google Scholar]
- Malama, C.N. Evaluating the agronomic potential of tithonia diversifolia prunings in the acid soils on nothern Zambia. In Proceedings of the Seventh Eastern and Southern Africa Regional Maize Conference, Harare, Zimbabwe, 11–15 February 2001; pp. 372–376.
- Caniato, F.F.; Guimaraes, C.T.; Hamblin, M.; Billot, C.; Rami, J.; Hufnagel, B.; Kochian, L.V.; Liu, J.; Garcia, A.A.F.; Hash, C.T.; et al. The relationship between population structure and aluminum tolerance in cultivated sorghum. PLoS ONE 2011, 6, e20830. [Google Scholar] [CrossRef] [PubMed]
- Mason, N.M.; Burke, W.J.; Shipekesa, A.; Jayne, T.S. The 2011 surplus in smallholder maize production in Zambia: Drivers, beneficiaries, and implications for agricultural and poverty reduction policies. In Food Security Research Project; CIMMYT: Harare, Zimbabwe, 2011; p. 35. [Google Scholar]
- Bwembya, S.; Yerokun, O.A. Effect of cassia spectables, cowdung and their combination on growth and grain yield on maize. In Proceedings of the Seventh Eastern and Southern African Regional Maize Conference, Harare, Zimbabwe, 11–15 February 2001; pp. 361–366.
- Munyinda, K. Climate change in Zambia; Chanda, R., Ed.; CIMMYT: Lusaka, Zambia, 2010. [Google Scholar]
- The, C.; Calba, H.; Zonkeng, C.; Zonkeng, C.; Ngonkeu, E.L.M.; Adetimirin, V.O.; Mafouasson, H.A.; Meka, S.S.; Horst, W.J. Responses of maize grain yield to changes in acid soil characteristics after soil ammendments. Plant Soil 2006, 284, 45–57. [Google Scholar] [CrossRef]
- Magalhaes, J.V.; Garvin, D.F.; Wang, Y.; Sorrels, M.E.; Klein, P.E.; Schaffert, R.E.; Li, L.; Kochian, L.V. Comparative mapping of major Al3+ tolerance gene in sorghum and other species in the poaceae. Plant Genet. 2004, 167, 1905–1914. [Google Scholar]
- The, C.; Calba, H.; Horst, W.J.; Zonkeng, C. Maize grain yield correlated responses to change in acid soil characteristics after 3years of soil ammendments. In Proceedings of the Seventh Eastern and Southern Africa Region Maize Conference, Harare, Zimbabwe, 11–15 February 2001; pp. 222–227.
- Okiyo, T.; Gudu, S.; Kiplagia, O.; Owuoche, J. Combining drought and aluminum toxicity tolerance to improve sorghum productivity. Afr. Crop Sci. J. 2010, 18, 147–154. [Google Scholar]
- Urrea-Gomej, R.; Ceballos, H.; Pandey, S.; Bahia-Filho, A.F.C.; Lenin, L.A. A greenhouse screening technique for acid soil tolerance in maize. Agron. J. 1996, 88, 806–812. [Google Scholar] [CrossRef]
- Ouma, E.; Ligeyo, D.; Matonyei, T.; Agalo, J.; Were, B.; Too, E.; Onkware, A.; Gudu, S.; Kisinyo, P.; Nyangweso, P. Enhancing maize grain yield in acid soils of western kenya using aluminum tolerance germplasm. J. Agric. Sci. Technol. 2013, 3, 33–46. [Google Scholar]
- Abdel-Ghani, A.H.; Kumar, B.; Reyes-Matamoros, J.; Gonzalez-Portilla, P.J.; Jansen, C.; Martin, J.P.S.; Lee, M.; Lubberstdt, T. Genotypic variation and relationships between seedling and adult plant traits in maize (Zea Mays L.) inbred lines grown under contrasting nitrogen levels. Euphytica 2012, 189. [Google Scholar] [CrossRef]
- Kumar, B.; Abdel-Ghani, A.H.; Reyes-Matamoros, J.; Hochholdinger, F.; Lubberstdt, T. Genotypic variation for root architecture traits in seedlings of maize (Zea Mays L.) inbred lines. Plant Breed. 2012, 131, 465–478. [Google Scholar] [CrossRef]
- DeSousa, S.M.; Clark, R.T.; Mendes, F.F.; deOliveira, A.C.; deVasconcelos, M.J.V.; Paretoni, S.N.; Kochian, L.V.; Guimaraes, C.T.; Magalhaes, J.V. A role for root morphology and related candidate genes in p acquisition effeciency in maize. Funct. Plant Biol. 2012, 39, 925–935. [Google Scholar] [CrossRef]
- Makau, M.; Masito, S.S.; Gweyi-Onyango, J.P. A rapid hydroponic screening of field and horticultural crops for aluminium tolerance. Afr. J. Hort. Sci. 2011, 4, 48–59. [Google Scholar]
- Kerridge, P.C.; Dawson, M.D.; Moore, D.P. Separation of degrees of aluminium tolereance in wheat. Agron. J. 1971, 63, 568–591. [Google Scholar] [CrossRef]
- Choudhary, A.K.; Singh, D.; Kumar, J. A comparative study of screening methods for tolerance to aluminum toxicity in pigeonpea (Cajanus Cajan (L.) millspaugh). Aust. J. Crop Sci. 2011, 5, 1419. [Google Scholar]
- Anas; Yoshida, T. Screening of al-tolerant sorghum by hematoxylin staining and growth response. Plant Prod. Sci. 2000, 3, 246–253. [Google Scholar] [CrossRef]
- Blair, M.W.; López-Marín, H.D.; Rao, I.M. Identification of aluminum resistant Andean common bean (Phaseolus vulgaris L.) genotypes. Braz. J. Plant Physiol. 2009, 21, 291–300. [Google Scholar] [CrossRef]
- Gai, J.; Liu, Y.; Liu, H.; Zhao, T.; Yu, D. Identification of Mutatnts with Tolerance to Rhizospheric Stresses and Inheritance and qtl Mapping of Rewlated Root Traits in Soyabean. Available online: http//mvgs.iaea.org/PDF/TECDOC149304.pdf (accessed on 18 June 2014).
- Suwarno, W.B.; Sobir; Aswidinnoor, H.; Syukur, M. Pbstat: A web-based statistical analysis software for participatory plant breeding. In Proceedings of the 3rd International Conference on Mathematics and Statistics (ICoMS-3), Bogor Agricultural University, Bogor, Indonesia, 5–6 August 2008; p. 7.
- Singh, R.K.; Chaudhary, B.D. Biometrical Methods in Quantitative Genetics Analysis; Kalyani Publishers: New Delhi, India, 1977. [Google Scholar]
- Shivasubramanian, S.; Menon, N. Heterosis and inbreeding depression in rice. Madras Agril. J. 1973, 60, 1139–1144. [Google Scholar]
- Johnson, H.W.; Robinson, H.F.; Comstock, R.W. Estimation of genetic and environmental variability in soybean. Agron. J. 1955, 47, 447–483. [Google Scholar] [CrossRef]
- Robinson, H.F.; Comstock, R.E.; Harvery, V.H. Estimates of heritability and degree of dominance in corn. Agron. J. 1949, 41, 353–359. [Google Scholar] [CrossRef]
- Trachsel, S.; Stamp, P.D.; Hundi, A. Effect of high temperatures, drought and aluminum toxicity on root growth of tropical maize (Zea Mays L.) seedlings. Maydica 2010, 55, 249–260. [Google Scholar]
- Abate, E.; Hussien, S.; Laing, M.; Mengistu, F. Aluminium toxicity tolerance in cereals: Mechanisms, genetic control and breeding methods. Afr. J. Agric. Res. 2013, 8, 711–722. [Google Scholar]
- Ringo, J.H.; Mneney, E.E.; Onkware, A.O.; Were, B.A.; Too, E.J.; Owuoche, J.O.; Gud, S.O. Tolerance to aluminium toxicity in Tanzanian sorghum genotypes. Afr. Crop Sci. J. 2010, 18, 155–164. [Google Scholar]
- Krstic, D.; Djalovic, I.; Nikezic, D.; Bjelic, D. Aluminium in acid soils: Chemistry, toxicity and impact on maize plants. In Food Production-Approaches, Challenges and Tasks; Aladjadjiyan, A., Ed.; INTECH: Rijeka, Croatia, 2012; pp. 231–242. [Google Scholar]
- Ma, J.F.; Nagao, S.; Sato, K.; Ito, H.; Furukawa, J.; Tekda, K. Mollecular mapping of gene responsible for al-activated secretion of citrate in barley. J. Exp. Bot. 2004, 55, 1335–1341. [Google Scholar] [CrossRef] [PubMed]
- Nyamangara, J.; Mugwira, L.M.; Mpofu, S.E. Soil fertility status in the commercial areas of Zimbabwe in relation to sustainable crop production. J. Sustain. Agric. 2005, 16, 15–29. [Google Scholar] [CrossRef]
- Bänziger, M.; Setimela, P.S.; Hodson, D.; Vivek, B. Breeding for improved drought tolerance in maize adapted to southern Africa. Agric. Water Manag. 2006, 80, 212–224. [Google Scholar] [CrossRef]
- Weber, V.S.; Melchinger, A.E.; Magorokosho, C.; Makumbi, D.; Bänziger, M.; Atlin, G.N. Effieciency of managed-stress screening of elite maize hybrids under drought and low nitrogen for yield under rainfed conditions in southern africa. Crop Sci. 2012, 52, 1011–1020. [Google Scholar] [CrossRef]
- Løes, A.K.; Gahoonia, T.S. Genetic variation in specific root length in Scandinavian wheat and barley accessions. Euphytica 2004, 137, 243–249. [Google Scholar] [CrossRef]
- Paula, S.; Pausa, J.G. Root traits explain different foraging strategies between resprouting life histories. Oecologia 2011, 165, 321–331. [Google Scholar] [CrossRef] [PubMed][Green Version]
- Pérez-Harguindeguy, N.; Díaz, S.; Garnier, E.; Lavorel, S.; Poorter, H.; Jaureguiberry, P.; Bret-Harte, M.S.; Cornwell, W.K.; Craine, J.M.; Gurvich, D.E.; et al. New handbook for standardised measurement of plant functional traits worldwide. Aust. J. Bot. 2013, 61, 167–234. [Google Scholar] [CrossRef]
- Mohamed, S.M.; Ali, E.E.; Mohamed, T.Y. Study of heritability and genetic variability among differrent plant and fruit characters of tomato (Solanum lycopersicon L.). Int. J. Sci. Technol. Res. 2012, 1, 55–58. [Google Scholar]
- Dudley, J.W.; Moll, R.H. Interpretation and use of estimates heritability and genetic variances in plant breeding. Crop Sci. 1969, 9, 257–262. [Google Scholar] [CrossRef]
- Bello, O.B.; Ige, S.A.; Azeez, M.A.; Afolabi, M.S.; Abdulmaliq, S.Y.; Mahamood, J. Heritability and genetic advance for grain yield and its component characters in maize (zea mays l.). Int. J. Plant Res. 2012, 2, 138–145. [Google Scholar] [CrossRef]
- Devi, N.D.; Mariappan, S. Genetic variability, heritability and genetic advance for yield and its components snake gourd (Trichosanthes anguina L.). Afr. J. Agric. Res. J. Agric. Sci. 2013, 8, 3857–3859. [Google Scholar]
- Boakye, P.B.; Kwadwo, O.; Isaac, A.K.; Parkes, E.Y. Genetic variability of three cassava traits across three locations in Ghana. Afr. J. Plant Sci. 2013, 7, 265–267. [Google Scholar] [CrossRef]
- Hosseini, S.J.; Sarvestani, Z.T.; Pirdashti, H.; Afkhami, A.; Hazrati, S. Estimation of heritability and genetic advance for screening some rice genotypes at salt stress conditions. Int. J. Agron. Plant Prod. 2012, 3, 475–482. [Google Scholar]
- Nasr, N.; Carapetian, J.; Heidari, R.; Rezaei, S.A.; Abbaspour, N.; Darvishzadeh, R. Differential effects of aluminium on the seedling parameters of wheat. Afr. J. Biotechnol. 2011, 10, 3345–3353. [Google Scholar]
- Roy, B.; Bhadra, S. Effect of toxic levels of aluminium on seedling parameters of rice (Oryza sativa L.) under hydroponic culture. Rice Sci. 2014, 21, 9. [Google Scholar] [CrossRef]
- Masole, H. An assessment of maize development in Zambia. Afr. Crop Sci. Soc. 1997, 3, 747–753. [Google Scholar]
- Masole, H.; Gumbo, M. Performance of early to medium maturity maize genotypes during the 1991–1992 drought in Zambia. In Proceedings of the Maize Research for Stress Environments: Fourth Eastern and Southern African Regional Maize Conference, Harare, Zimbabwe, 28th March–1st April 1994; pp. 117–121.
- Magalhaes, P.C.; de-Souza, T.C.; Cantao, F.R.O.; Padilha, F.A. Root morphology of maize with contrasting drought resistance under three toxic levels of aluminum. Revista Brasileira de Milho e Sorgo 2012, 11, 35–48. [Google Scholar]
© 2015 by the authors; licensee MDPI, Basel, Switzerland. This article is an open access article distributed under the terms and conditions of the Creative Commons Attribution license (http://creativecommons.org/licenses/by/4.0/).
Share and Cite
Richard, C.; Munyinda, K.; Kinkese, T.; Osiru, D.S. Genotypic Variation in Seedling Tolerance to Aluminum Toxicity in Historical Maize Inbred Lines of Zambia. Agronomy 2015, 5, 200-219. https://doi.org/10.3390/agronomy5020200
Richard C, Munyinda K, Kinkese T, Osiru DS. Genotypic Variation in Seedling Tolerance to Aluminum Toxicity in Historical Maize Inbred Lines of Zambia. Agronomy. 2015; 5(2):200-219. https://doi.org/10.3390/agronomy5020200
Chicago/Turabian StyleRichard, Chanda, Kalaluka Munyinda, Theresa Kinkese, and David S. Osiru. 2015. "Genotypic Variation in Seedling Tolerance to Aluminum Toxicity in Historical Maize Inbred Lines of Zambia" Agronomy 5, no. 2: 200-219. https://doi.org/10.3390/agronomy5020200
APA StyleRichard, C., Munyinda, K., Kinkese, T., & Osiru, D. S. (2015). Genotypic Variation in Seedling Tolerance to Aluminum Toxicity in Historical Maize Inbred Lines of Zambia. Agronomy, 5(2), 200-219. https://doi.org/10.3390/agronomy5020200