Article

Can Plastic Mulching Enhance Soil Physical Conditions and Mitigate Water-Related Physiological Stress in Citrus Crops?

by
Pedro Antônio Namorato Benevenute
1,*,
Samara Martins Barbosa
1,
Isabela Cristina Filardi Vasques
2,
Everton Geraldo de Morais
1,
Cynthia de Oliveira
1,
Geraldo César de Oliveira
1,
Ester Alice Ferreira
3 and
Bruno Montoani Silva
1
1
Department of Soil Science (DCS), Federal University of Lavras (UFLA), Trevo Rotatório Professor Edmir Sá Santos, Lavras 37200-000, MG, Brazil
2
Department of Soil Science, Federal University of Viçosa (UFV), Avenida Peter Henry Rolfs, Viçosa 36570-900, MG, Brazil
3
Agricultural Research Company of Minas Gerais (EPAMIG), Southern Regional Unit of Minas Gerais (URESM), Trevo Rotatório Professor Edmir Sá Santos, Lavras 37200-000, MG, Brazil
*
Author to whom correspondence should be addressed.
Agronomy 2026, 16(1), 83; https://doi.org/10.3390/agronomy16010083
Submission received: 30 November 2025 / Revised: 24 December 2025 / Accepted: 25 December 2025 / Published: 27 December 2025
(This article belongs to the Section Horticultural and Floricultural Crops)

Abstract

Short dry spells during the rainy season have become increasingly common in Brazil, reinforcing the need for soil water conservation practices. Plastic mulching can enhance plant water use and mitigate abiotic stress. This study evaluates water use efficiency in terms of soil physical quality, root systems, and photosynthetic performance of citrus plants grown in different Inceptisols. The field experiment, in a randomized block design with a split-plot arrangement, was conducted in Lavras, Brazil, and involved citrus (orange) plants from 2012 to 2014. Undisturbed soil samples were collected at depths of 0.00–0.05, 0.20–0.25, and 0.90–0.95 m, two years after the installation of white plastic (WP), black plastic (BP), and no plastic (NP) mulching treatments in two Inceptisol types, totaling 54 samples. The soil water-retention curve, pore size distribution, and soil physical quality indicators were determined, and root system distribution maps were generated using B-splines. Leaf gas exchange was measured under contrasting precipitation conditions. Inceptisol I showed minimal impact from mulching, except for the bulk density and total porosity, which positively correlated with transpiration under BP. In contrast, in Inceptisol II, WP increased photosynthetic rates under low- and high-precipitation conditions but reduced water use efficiency, correlating positively with macropores and negatively with micropores. Plastic mulching reduces physiological stress in citrus and improves soil physical quality, with WP being the most effective across precipitation levels, particularly in less stable soils.

1. Introduction

The world production of citrus (oranges, lemons, limes, tangerines, mandarins, clementines, and satsumas) in 2020 was 135.41 million tons, with China being the most significant producer, with 33.66 million tons, and Brazil being the second, responsible for 19.31 million tons [1,2]. The 2023 citrus harvest for São Paulo and Minas Gerais ended with 314.21 million boxes of 40.8 kg each, with 23.22 million boxes produced solely in the Triângulo Mineiro region [3]. After the COVID-19 pandemic, the consumption of foods high in vitamin C increased worldwide [4], as these foods are associated with immune system support [4,5]. Thus, the global demand for citrus fruits will also remain high [1]. Brazil is preparing to diversify citrus orchards, expand areas with lemon and tangerine, intensify mechanized harvesting, and densify planting to achieve productivity gains [3,6,7].
The 2021/22 production was lower than 2022/23 by 19.49%, associated with the adverse weather impact [3]. One of the main factors that helps increase crop yield is efficient water use [8]; therefore, prioritizing soil and water conservation systems is paramount in agriculture [9]. This is due to the intensification of dry years, associated with the increase in occurrences of short dry spell periods (≥4 days) with heatwaves in the middle of the rainy season or in the autumn period in the southeast region of Brazil. Therefore, innovative management techniques adapted to drylands, for example, plastic mulch [10] and farming, have been advocated due to concerns about the scarcity of water resources for irrigation [6,11].
The Inceptisols occupy approximately 8% of the global ice-free land [12]. These soils are spread over about 5.3% of the Brazilian territory [13]. Their main characteristic is incipient development, characterized by little differentiation of horizons in morphological characteristics, mainly by color and structure [14,15,16,17]. However, these soils vary widely in depth, from shallow profiles (<0.50 m) to deep profiles exceeding 1.50 m, and show substantial variability in physical and morphological characteristics, including texture, structure, and degree of horizon development [14,15,16,18]. These soils are suitable for agricultural use once some restrictive factors are mitigated, such as stoniness, small depth, and excessive slope [14,15,16,18].
Plastic mulch was already responsible for approaching the water use efficiency in drylands compared to that of the irrigated areas for wheat and maize crops [19]. References have also shown that plastic films are responsible for increasing soil water content, fruit yield, and water use efficiency in apple crops [20], bell peppers [21], and others [22]. Therefore, plastic mulch has been revealed to be promising for use in many crops worldwide [23], and even its continued use has been proven to improve soil and groundwater quality [24]. It is highlighted that plastic mulching can vary in color; the black and white ones are the most often used, and this characteristic can reveal different effects on the water used by plants [25,26], especially in perennial fruit crops [23]. This condition results from the microclimate modification induced by plastic mulch, which provides physical insulation and moisture retention despite the absence of organic inputs. The cover improves soil physical properties compared with bare soil, leading to physiological benefits such as increased yield and weed suppression [27].
A practical way of evaluating the efficiency of water use by plants grown in soils is the A/E ratio, assimilation (A), and transpiration (E) [28,29], which indicates whether the soil physical-hydric condition has positively influenced the plants’ efficient water use. An infrared gas exchange analyzer (IRGA) is used to obtain the endpoint inputs for this ratio. The gas exchange endpoints (photosynthetic rate, stomatal conductance, and transpiration rate) tend to be increased with the greater volume of mesopores in soil, which is responsible for greater water availability to plants during stress intervals [30].
The efficient use of water by plants is also related to some common soil attributes, such as texture, mineralogy, organic matter, and structure, and this last item is modifiable according to the management system adopted [31,32]. Management practices with intense soil turnover can negatively change the size and continuity of the soil pore network, with substantial losses in the hydric conditions of this system [9,33,34]. However, by adopting management practices that preserve or positively change the soil structure, it is possible to increase the plant water availability [15,16].
The disadvantages of plastic mulching have already been cited in the literature [35]. Notably, the soil cannot adequately capture and use rainwater, and applying fertilizers becomes very difficult due to the installation of a plastic cover in the field [36]. The soil structure can also be damaged by plastic waste in this system, leading to the decreased connectivity of soil pores and soil porosity [37].
Although plastic mulching applied to the soil is widely reported as an effective technique for improving soil moisture conservation, crop performance, and water use efficiency, most available studies do not specifically address, and therefore poorly elucidate, the combined effects of plastic mulching on soil physical quality, root system spatial distribution, and the physiological responses of perennial fruit crops under contrasting precipitation conditions.
This limitation is justified, as most studies evaluating plastic mulching have focused on annual crops and soils with a relatively stable structure, in which greater macroporosity may enhance the positive effects of soil cover on water infiltration and storage. Consequently, significant knowledge gaps remain regarding how plastic mulching influences soil–plant interactions in tropical soils, particularly in Inceptisols, which are characterized by high spatial variability, incipient horizon development, and contrasting physical-hydric limitations along the soil profile. In addition, perennial fruit crops, such as citrus, exhibit deep and spatially heterogeneous root systems, resulting in long-term soil–plant interactions that differ substantially from those observed in annual cropping systems.
Therefore, studying the effects of plastic mulching and adopting a holistic perspective are necessary. Innovatively, the study provides information on how the weather station data and water balance are assessed to understand water dynamics through soil physical quality indicators, root systems, and the photosynthetic performance of citrus plants in tropical soils. This study hypothesizes that plastic mulching can maintain or increase water use efficiency and reduce physiological stress in citrus plants. To test this, the properties of Inceptisols were evaluated through soil porosity, root system characterization, and the physiological responses of citrus plants. This study aimed to evaluate the effectiveness of black and white plastic mulches on soil physical properties and the physiological traits of citrus plants. Soil properties, including porosity and root system characteristics, were quantified in Inceptisols, and the effects on plant water use efficiency and physiological stress were assessed.

2. Materials and Methods

2.1. Field Experimental Design

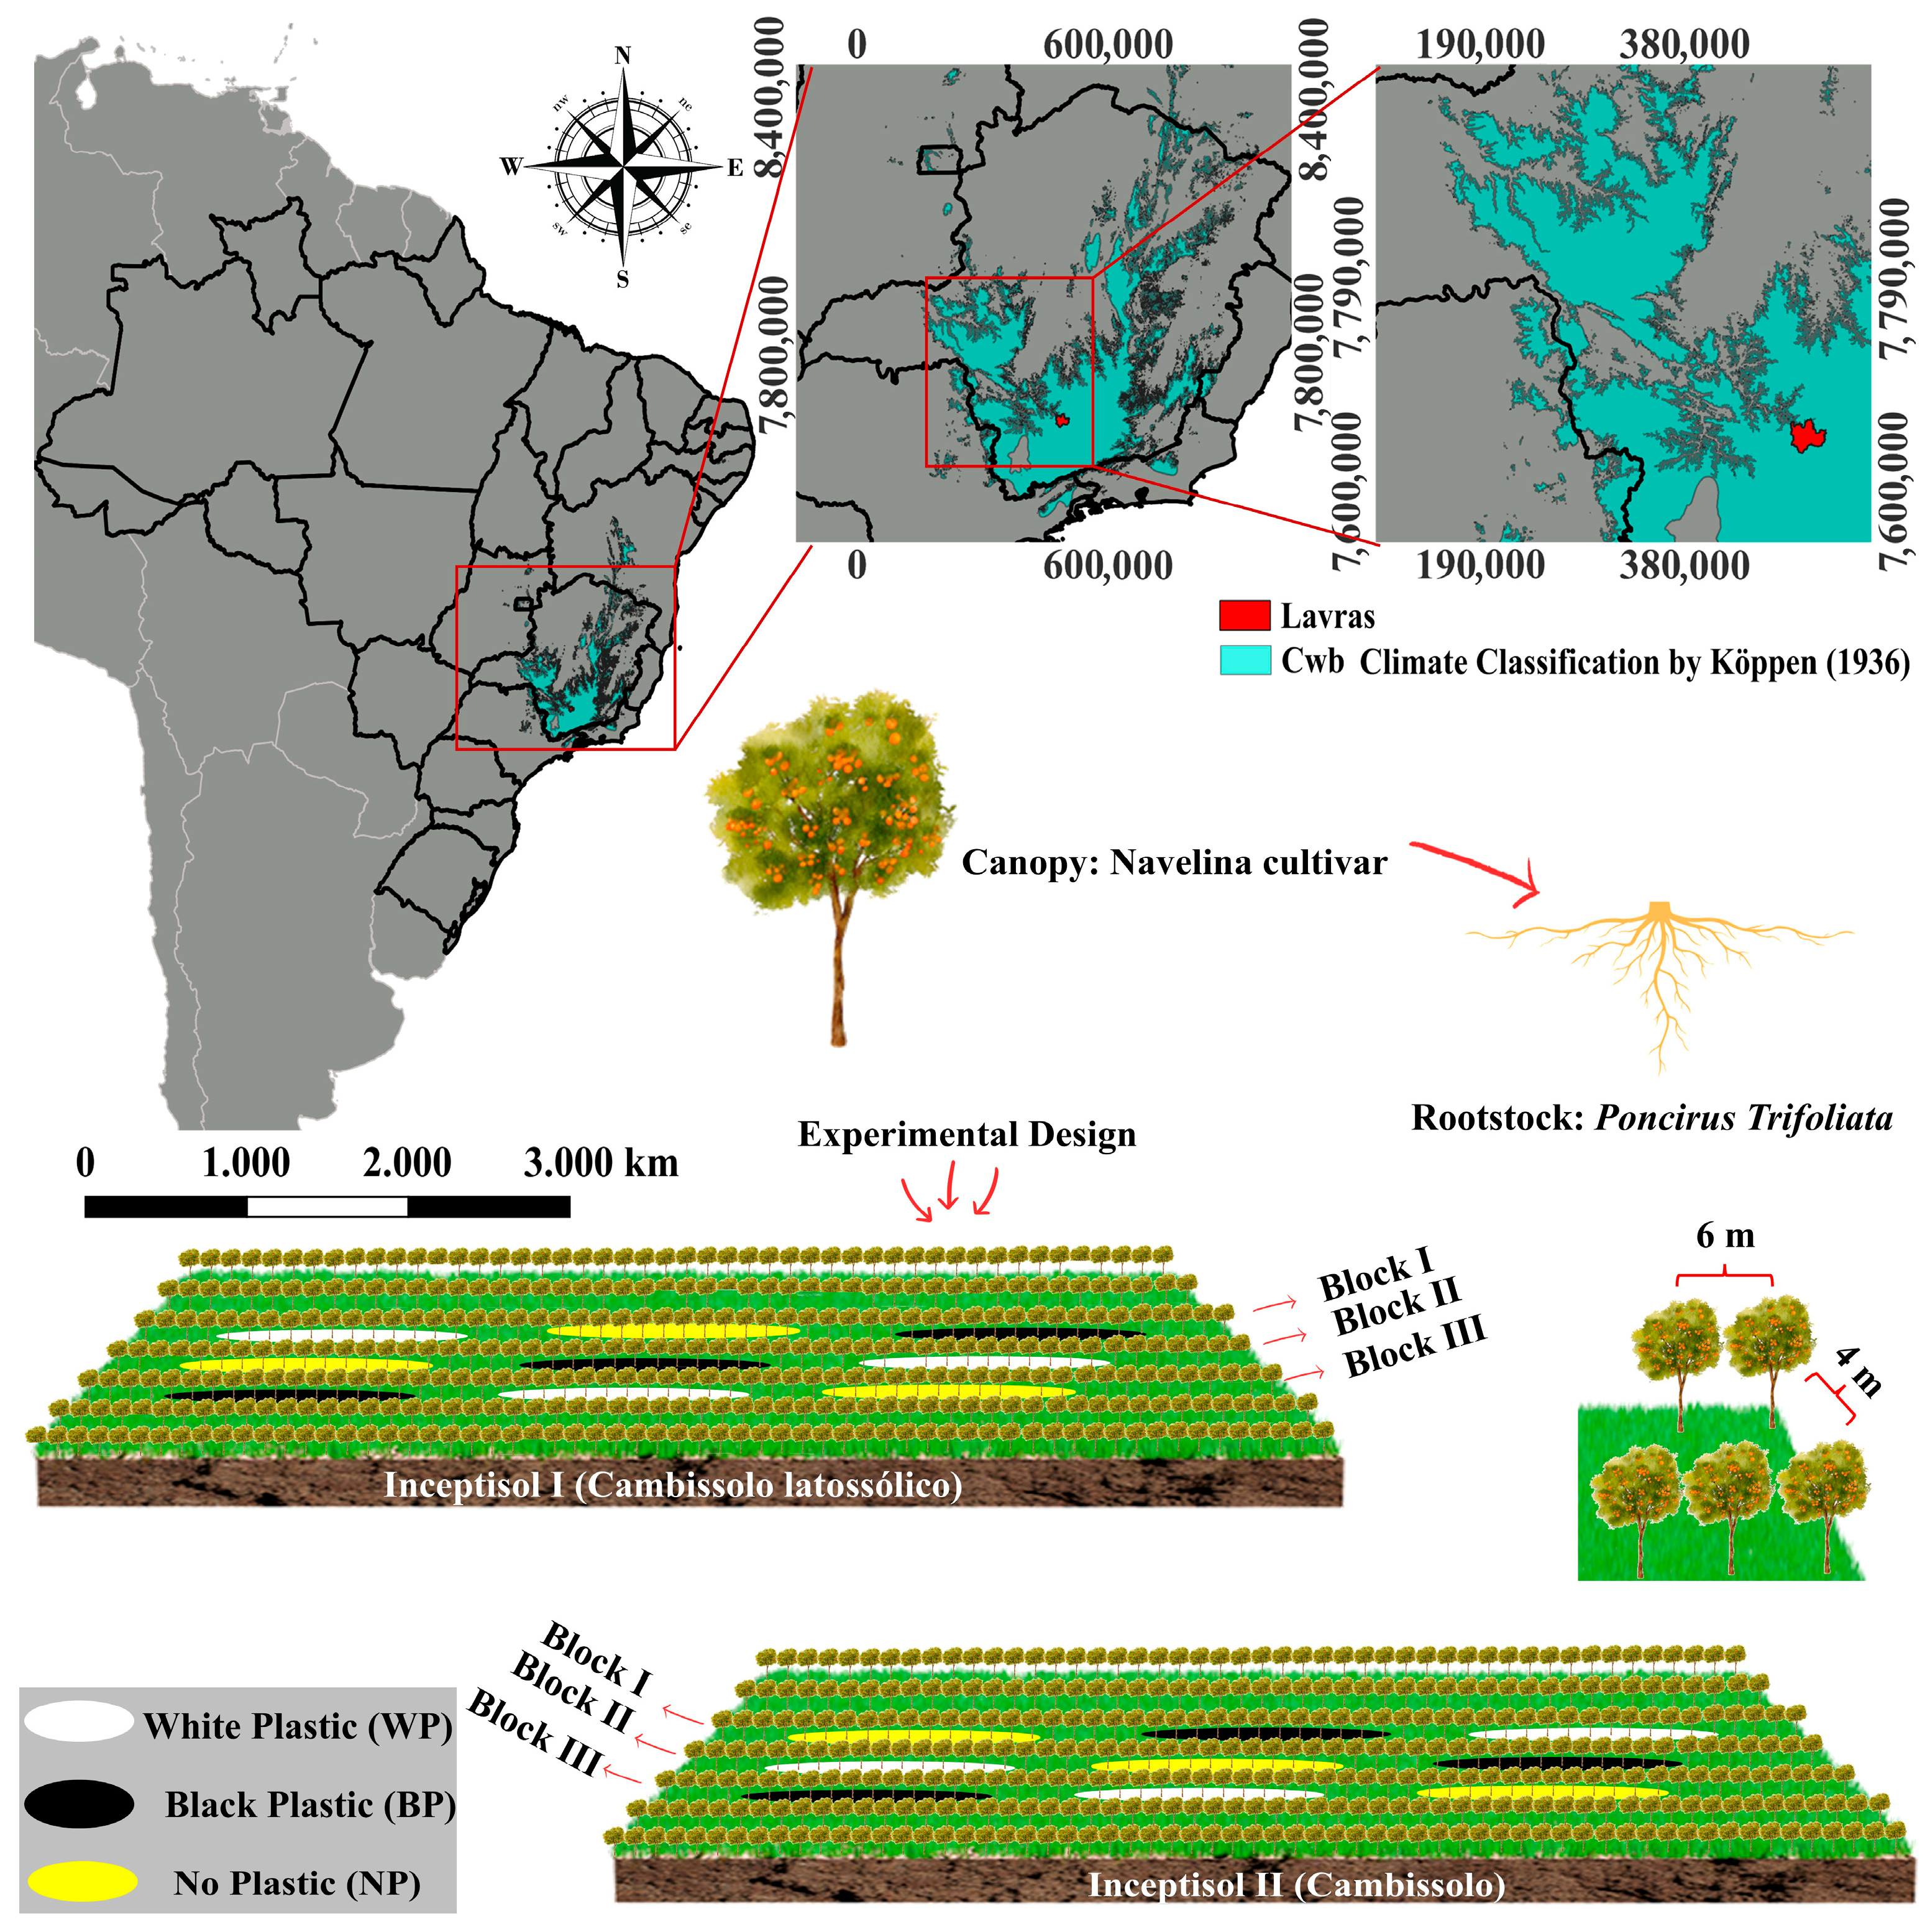
The study was conducted in a citrus orchard in the Dr. Sílvio Menicucci experimental farm of the EPAMIG unit in the South of Minas Gerais (Southern Regional Unit of Minas Gerais—URESM), in Lavras, Minas Gerais, Brazil. The location’s geographic coordinates are 21°14′43′′ S and 44°59′59′′ W, at an altitude of 919 m. The climate and temperature are classified as Cwb (Figure 1) [38], indicating a humid–temperate climate with a dry winter and a moderately hot summer. The average annual temperature is 20.1 °C, and the annual rainfall is 1463 mm.
In the experimental area, two soils were identified according to the Brazilian Soil Classification System (BSCS) [17]: Cambissolo latossólico franco and Cambissolo franco argiloso. In Soil Taxonomy [39], they are clay loam Inceptisols, and in the World Reference Base [40] they are classified as Cambisols. The soils were tilled with a harrow, and the furrower was used to open furrows measuring 0.60 m × 0.60 m × 0.60 m. The soil pH was adjusted with lime, and fertilization was performed according to Ribeiro et al. [41], and soil chemical and physical attributes (Table 1). In the furrows, 300 g of dolomitic limestone (with 87% total neutralizing relative power, 39.7% of CaO, and 13.38% of MgO), 20 g of zinc sulfate (ZnSO4), 20 g of boric acid (H3BO3), 40 g of superphosphate (16% phosphorus in the form of water-soluble P2O5, 16% calcium, and 10% sulfur), and 20 L of manure corral was used.
Seedlings of the ‘Navelina’ cultivar grafted onto Poncirus trifoliata rootstock were planted in September 2011 at a spacing of 6 × 4 m (Figure 1). The experiment was established in a randomized block design with a split-plot arrangement in space. The main plots consisted of three non-randomized soil sampling depths (0.00–0.05, 0.20–0.25, and 0.90–0.95 m). The split plots corresponded to three soil management treatments: white plastic (WP), black plastic (BP), and no plastic (NP), conventional management. Each treatment plot comprised one plant row with five plants. The treatments included two types of biodegradable plastic mulch installed in March 2012 along the plant row: a WP (40 μm) and a BP (18 μm), both containing an anti-UV additive.
In March 2014, 1.5 m-deep soil pits were excavated to assess soil physical conditions and morphological features using the profil cultural method, which is based on a soil profile evaluation directly in the field, as described by Boizard et al. [43] (Supplementary Data). In the experimental area, two soil types were classified. The first one is Inceptisol I (Cambissolo latossólico) because its diagnostic horizon missed the criteria of the Oxisol order due to its high silt content and less than 40% clay content [39], as well as for BSCS (Silt/Clay rate upper 0.7, Table 2). Also, it presents a deep oxic diagnostic horizon (>1.50 m) (or B latossólico in the BSCS), and a homogeneous and well-developed structure [17]. This soil type was also observed by [44]. The second soil type is Inceptisol II (Cambisol), characterized by a shallow (<0.50 m) cambic horizon (Bw), weak development of the B horizon, with no clear evidence of clay illuviation, oxide accumulation, cementation, or other advanced pedogenetic processes [39], with gravel within the soil mass (soil profile characteristics are provided in Supplementary Materials).
It is important to note that both Inceptisol I and Inceptisol II were chemically amended equally during soil correction, as the producer was unaware of the two classifications of soils within the same citrus cultivation area. Consequently, Table 1 presents the soil analysis provided by the producer before amendment and treatment implementation, while Table 2 details the particle size distribution after trench excavation and soil classification.
A detailed pedological description was performed after treatment installation for both Inceptisols and is provided in Supplementary Materials. This characterization highlights inherent differences in soil structure, aggregation, and root growth limitations along the soil profile, which are typical of Inceptisols. These soil baseline descriptions were used to support the interpretation of treatment effects within each studied Inceptisol. At the same time, the experimental design and blocking strategy were adopted to minimize the influence of inherent spatial variability on the evaluated responses.

2.2. Soil Physical Indicators

Undisturbed soil samples were collected in volumetric rings using the Uhland sampler in the 0.00–0.05 m, 0.20–0.25 m, and 0.90–0.95 m layers. In the laboratory, samples were saturated with distilled water until all pores were filled with water (approximately 24 h). After that, the saturated samples were equilibrated at the matric potentials of −2, −4, −6, and −10 kPa in Buchner funnels and matric potentials of −33, −100, −500, and −1500 kPa in Richards’ chambers. The soil water retention curve (WRC) was obtained after weighing the samples and determining their moisture content. The curve was fitted using the van Genuchten [45] model with the Mualem restriction (m = 1 − 1/n) [46], using the following equation:
θ = θr + (θres − θsat)/[1 + (αΨm) n]1 − 1/n
where Ψm is the matric potential (kPa); θ the water content (cm3 cm−3); θsat the water content at saturation (cm3 cm−3); and θres the residual water content (cm3 cm−3).
The matric potential at the inflection point (Ψi) was determined using Equation (2), using the methodology presented by [47].
Ψ i = 1 α 1 m 1 n
The water content at Ψi θ i was determined using Equation (3), defined by the following:
θ i = θ s a t θ r e s 1 + 1 m m
The S index (Sgi) was determined using the slope formed at the inflection point of the WRC [48] using Equation (4):
S g i = | n U s a t U r e s 1 + 1 m m + 1 |
where Usat (g g−1) is the gravimetric water content at the saturation; Ures (g g−1) is the gravimetric water content of soil residual water, and α (hPa−1) and n (dimensionless) are empirical parameters of curve fitting, with m = 1 − (1/n) [46].
The plant-available water capacity (AWC) was calculated via the difference between the estimated water content at the matric potential of −10 kPa, for the field capacity (FC), and the water content at the permanent wilting point (θPMP), estimated using the water content at the matric potential of −1500 kPa [49]. The readily available water (RAW) was considered based on the range of water content between matric potentials from −6 to −100 kPa [33]. The core method also calculated the bulk density (BD) [15,16]. Soil physical indicators of soil quality, air capacity (AC), and relative field capacity (RFC) were calculated as described by Reynolds et al. [50].
The pore size distribution was calculated through the mathematical expression proposed by Bouma, [51] in Equation (5):
[D = 4 σ Cos θ/Ψm]
where D is the pore diameter (μm); σ is the surface tension of water (73.43 kPa μm at 20 °C); θ is the angle of contact between the meniscus and the wall of the capillary tube (considered as 0); and Ψm is the matric potential (kPa).
Pore diameter was related to Ψm, according to the methodology used by Oliveira et al. [33]. The adopted porosity classification was based on that of Bullock et al. [52], in which macropores are those with a diameter > 73 μm, and micropores are those with a diameter < 0.2 μm.
The pore volume distribution function [Sv(h)] was described assuming the methodology by Reynolds et al. [50]. The Sv(h) was defined as the slope of the WRC from a graph of volumetric water content, θ (m3 m−3), versus ln(h). The normalized pore volume distribution function [S*(h)] was defined by dividing Sv(h) by Svi (Equation (6)), resulting in the following:
S * h = S v h S v i = m α h n [ 1 + m 1 ] m + 1 1 + α h n m + 1 ; 0 S * ( h ) 1
where Svi is the peak of the pore volume distribution, corresponding to the slope of the inflection point of the WRC.
Equation (6) was plotted against the equivalent pore diameter [de (μm)]. The S*(h) was compared according to Reynolds et al. [50], using “localization” parameters defined by the mean, mode, and median equivalent pore diameter (Dmean, Dmode, and Dmedian) and “shape” parameters Skewness and Kurtosis.

2.3. Root System Development

Soil trenches measuring 0.50 m (width) × 0.45 m (length) × 0.30 m (depth) were opened for the root development study using the cultural profile method. The vertical wall of the trench was maintained at 0.10 m from the plant trunk under the coffee plant canopy projection, from which the scarification of up to 0.05 m towards the interior of the soil was conducted to expose the roots. The roots were coated with a thin layer of white paint to provide a clear contrast between the roots and the soil [6,18].
A grid with 0.05 × 0.05 m2 squares was placed precisely parallel to the trench wall and in front of the roots. Then, using a 14-megapixel digital camera, 2D digital images were obtained. Considering the maximum furrow preparation depth of 0.80 m and the dimensional constraints of the trenches, a total of 54 sampling points were established. The images were processed and aligned in the free software ImageJ software (version 1.53; National Institutes of Health, Bethesda, MD, USA) and later submitted to the Safira© v. 1.1 software [53], generating variables in root number (RN), root volume (RV) (mm3), root surface area (RSA) (mm2), root length (RL) (mm), and root diameter (RD) (mm).

2.4. Weather

The Thornthwaite and Mather [54] method was used to evaluate the water availability, using soil properties AWC, PWP, Bd, rainfall, evapotranspiration, and temperature to perform the water balance calculations for the Lavras region, from the Lavras weather station (83687/−21.226111° E; −44.979722° S). The monthly and annual average climatological temperature and precipitation data were acquired from the [55] database from 2012 to 2014.

2.5. Physiological Analysis

The gas exchange characteristics were analyzed in August 2012, low precipitation, LP, (5 months after the installation of the plastic cover) and in March 2014, high precipitation, HP, (2 years after the installation of the plastic cover) for all treatments studied and, in both Inceptisol I and Inceptisol II, using an infrared gas exchange analyzer, IRGA (Li-6400, Li-Cor, Lincoln, NE, USA). The photosynthetic rate (PR), stomatal conductance (SC), and transpiration rate (TR) were measured as follows: three leaves of three plants within the same treatment, fully expanded leaves were selected between 9 and 11 h, and the flux density of photosynthetically active photons was set in the chamber apparatus at 1800 μmol m−2 s−1. From these measurements, the water use efficiency (WUE) was calculated via the CO2 assimilation (A) and transpiration (E), with the A/E ratio according to Larcher [56].

2.6. Statistical Analysis

All statistical analyses were carried out in R software, version 4.3.0, with the assistance of the tidyverse package [57,58]. The WRC model and its confidence interval were performed for each model involving the combination of the soil depth and treatments in each soil type using the stats and nlstools packages [57,59]. Analysis of variance (ANOVA) was used to compare soil physical properties and plant physiological characteristics within each soil type, without performing cross-soil comparisons. The basic assumptions of analysis of variance (normality, homoscedasticity, additivity, and independence of residuals) were tested and met, and the F-test reached significance (p < 0.05). The data were analyzed using a split-plot design, with mulching treatments allocated to the main plots and soil depth to the subplots. When treatment × depth interactions were observed, simple effects were evaluated by comparing treatments within each soil depth and soil depths within each treatment using Tukey’s test. Differences between treatments at a given depth were assessed using the minimum significant difference for treatments (MSD-T). In contrast, differences among soil depths within the same treatment were evaluated using the minimum significant difference for depths (MSD-D), both at p ≤ 0.05; for these, the stats and agricolae packages were used [57,60]. The Pearson correlation was performed using the stats and corrplot packages to evaluate the correlation between the physiological parameters of plants and soil physical variables [57,61].
Root data processed by the Safira© v. 1.1 software were used as the maximum value for the NR, the average for the RD, and the sum for the RV, RSA, and RL to ensure greater accuracy of the root variables within each square of the sample grid [6,18]. With the results obtained in each sampling grid unit, spatial interpolation of the root system was performed in QGIS 3.16.13 (QGIS Development Team, Open-Source Geospatial Foundation) [62], using the Multilevel B-splines interpolation method [63].

3. Results

3.1. Rainfall Regime and Water Balance

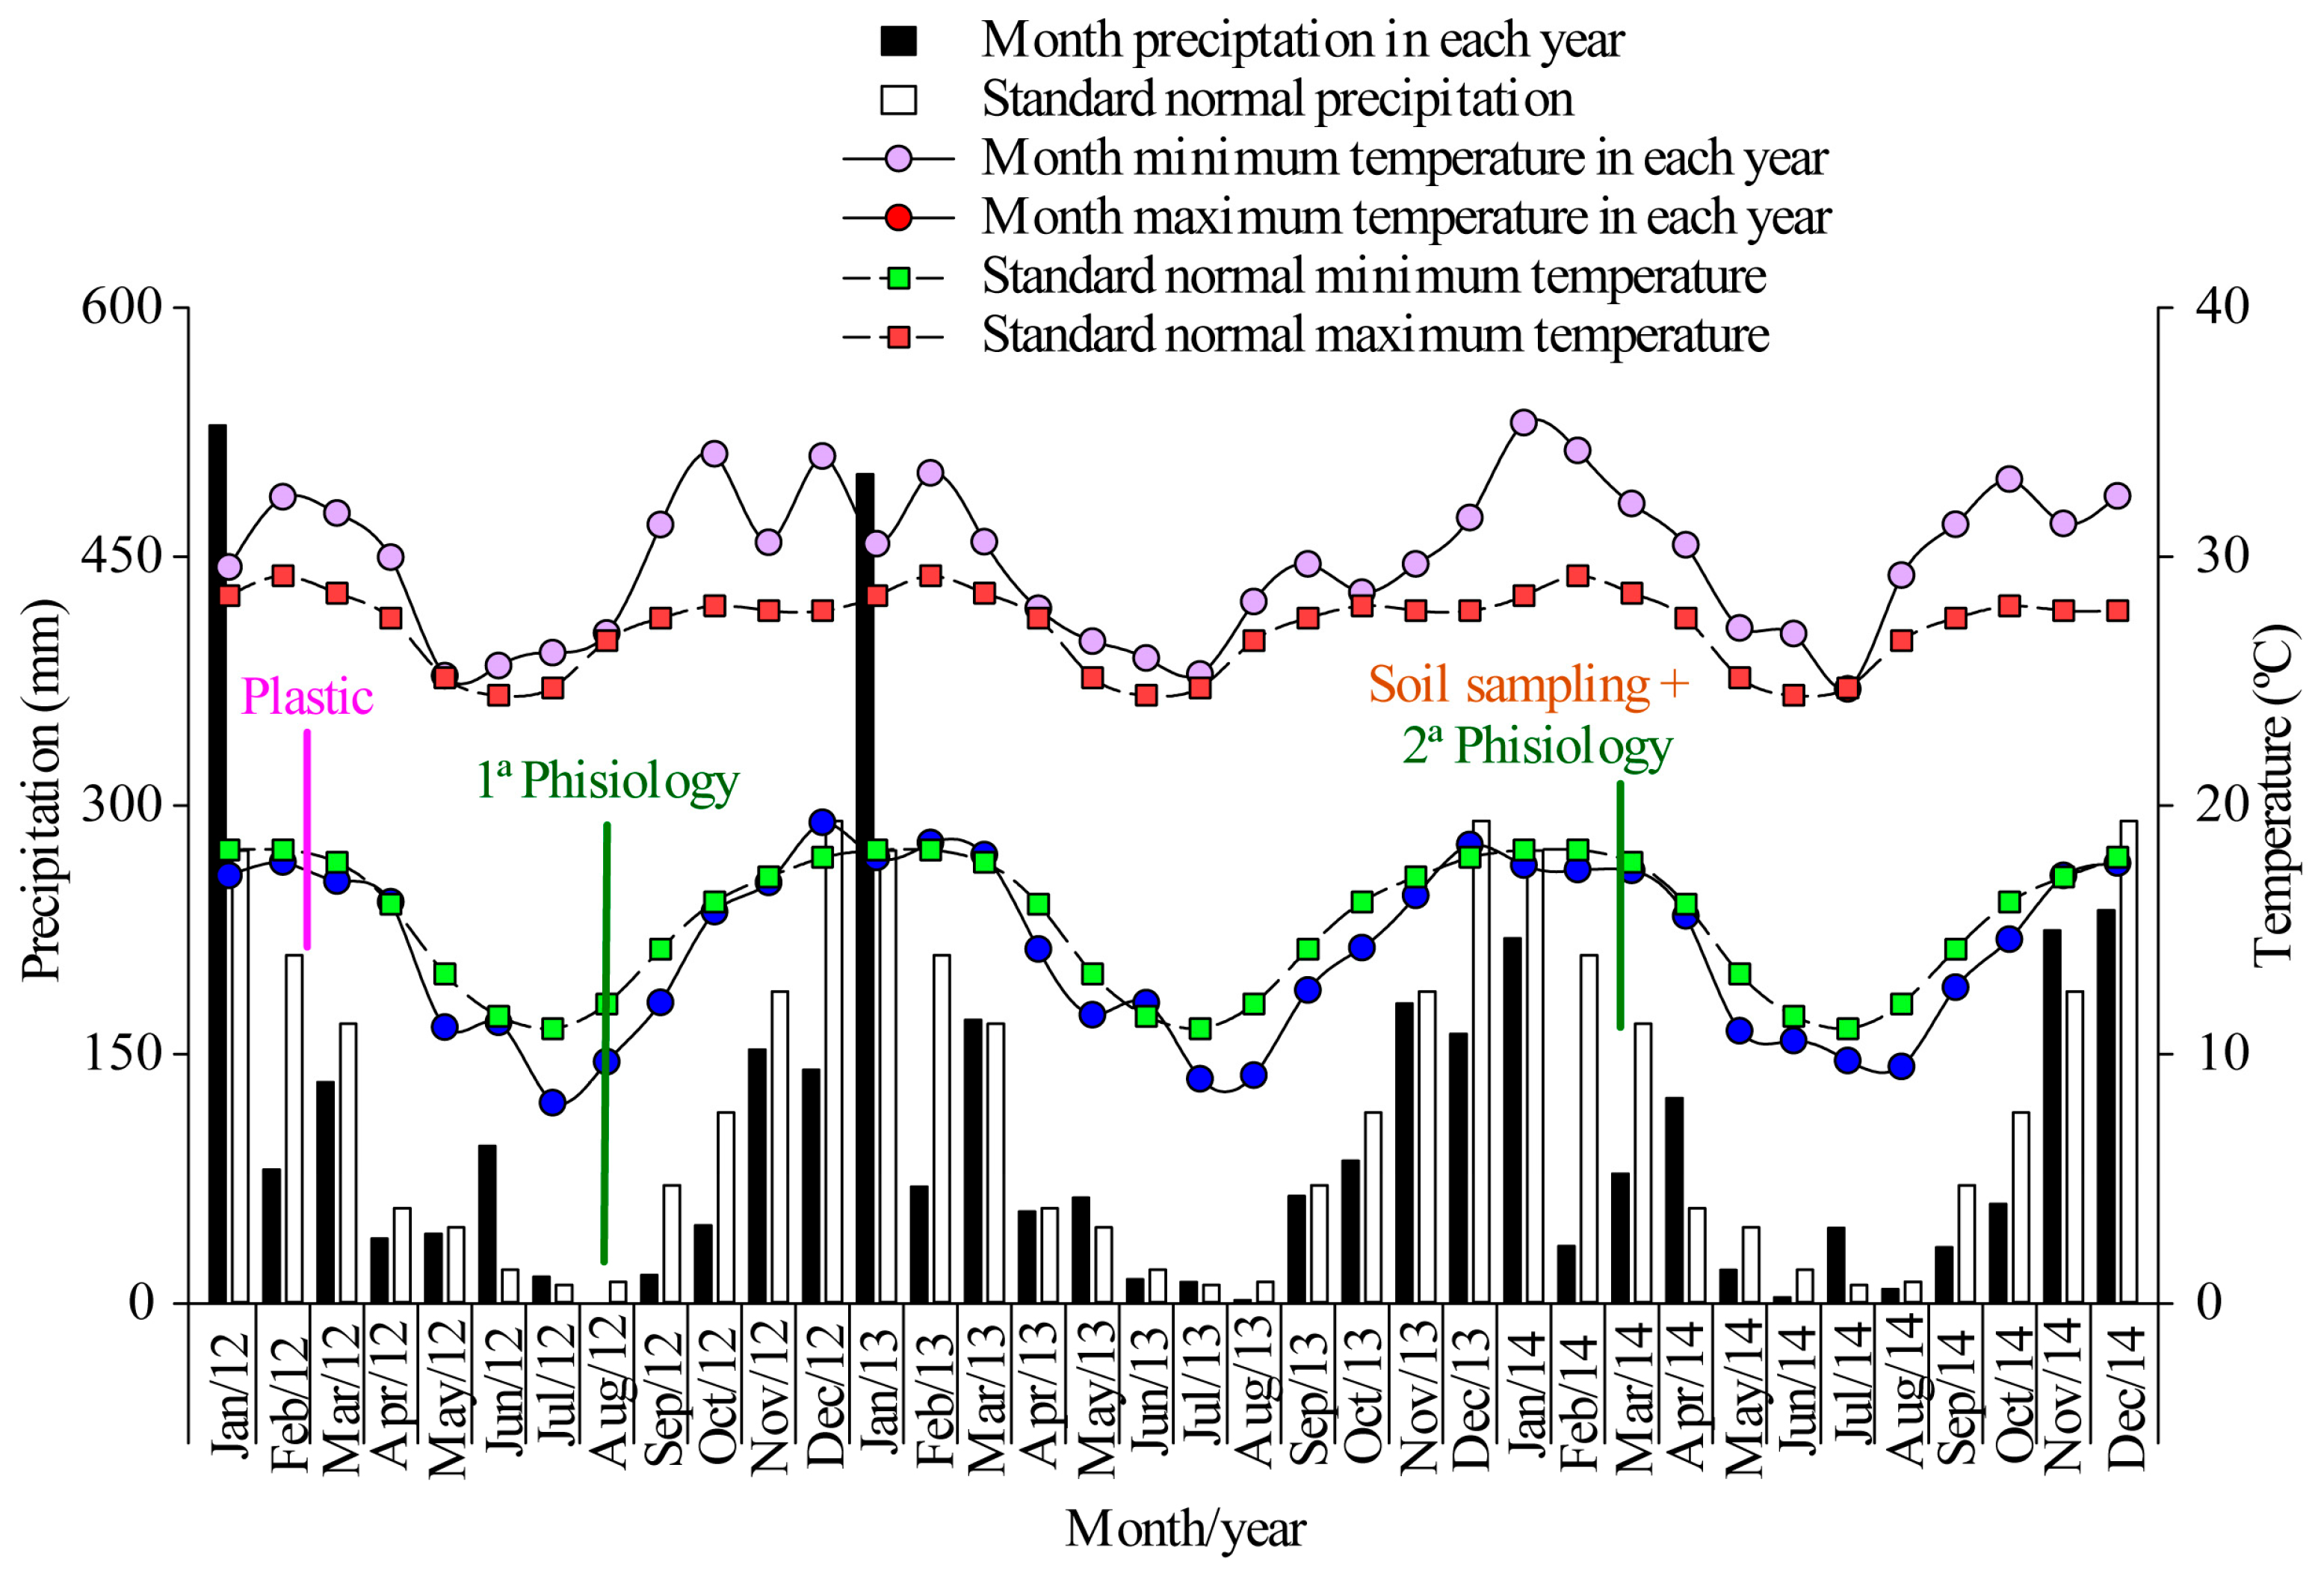
The rainfall regime from 2012 to 2014 (Figure 2) was lower than the 30-year climatological standard dataset. Mainly during March 2012 (plastic mulching implementation), August 2012 (the first physiology evaluation), and March 2012 (the second physiology evaluation). Also, a direct relationship between temperature increase and this reduction can be observed.
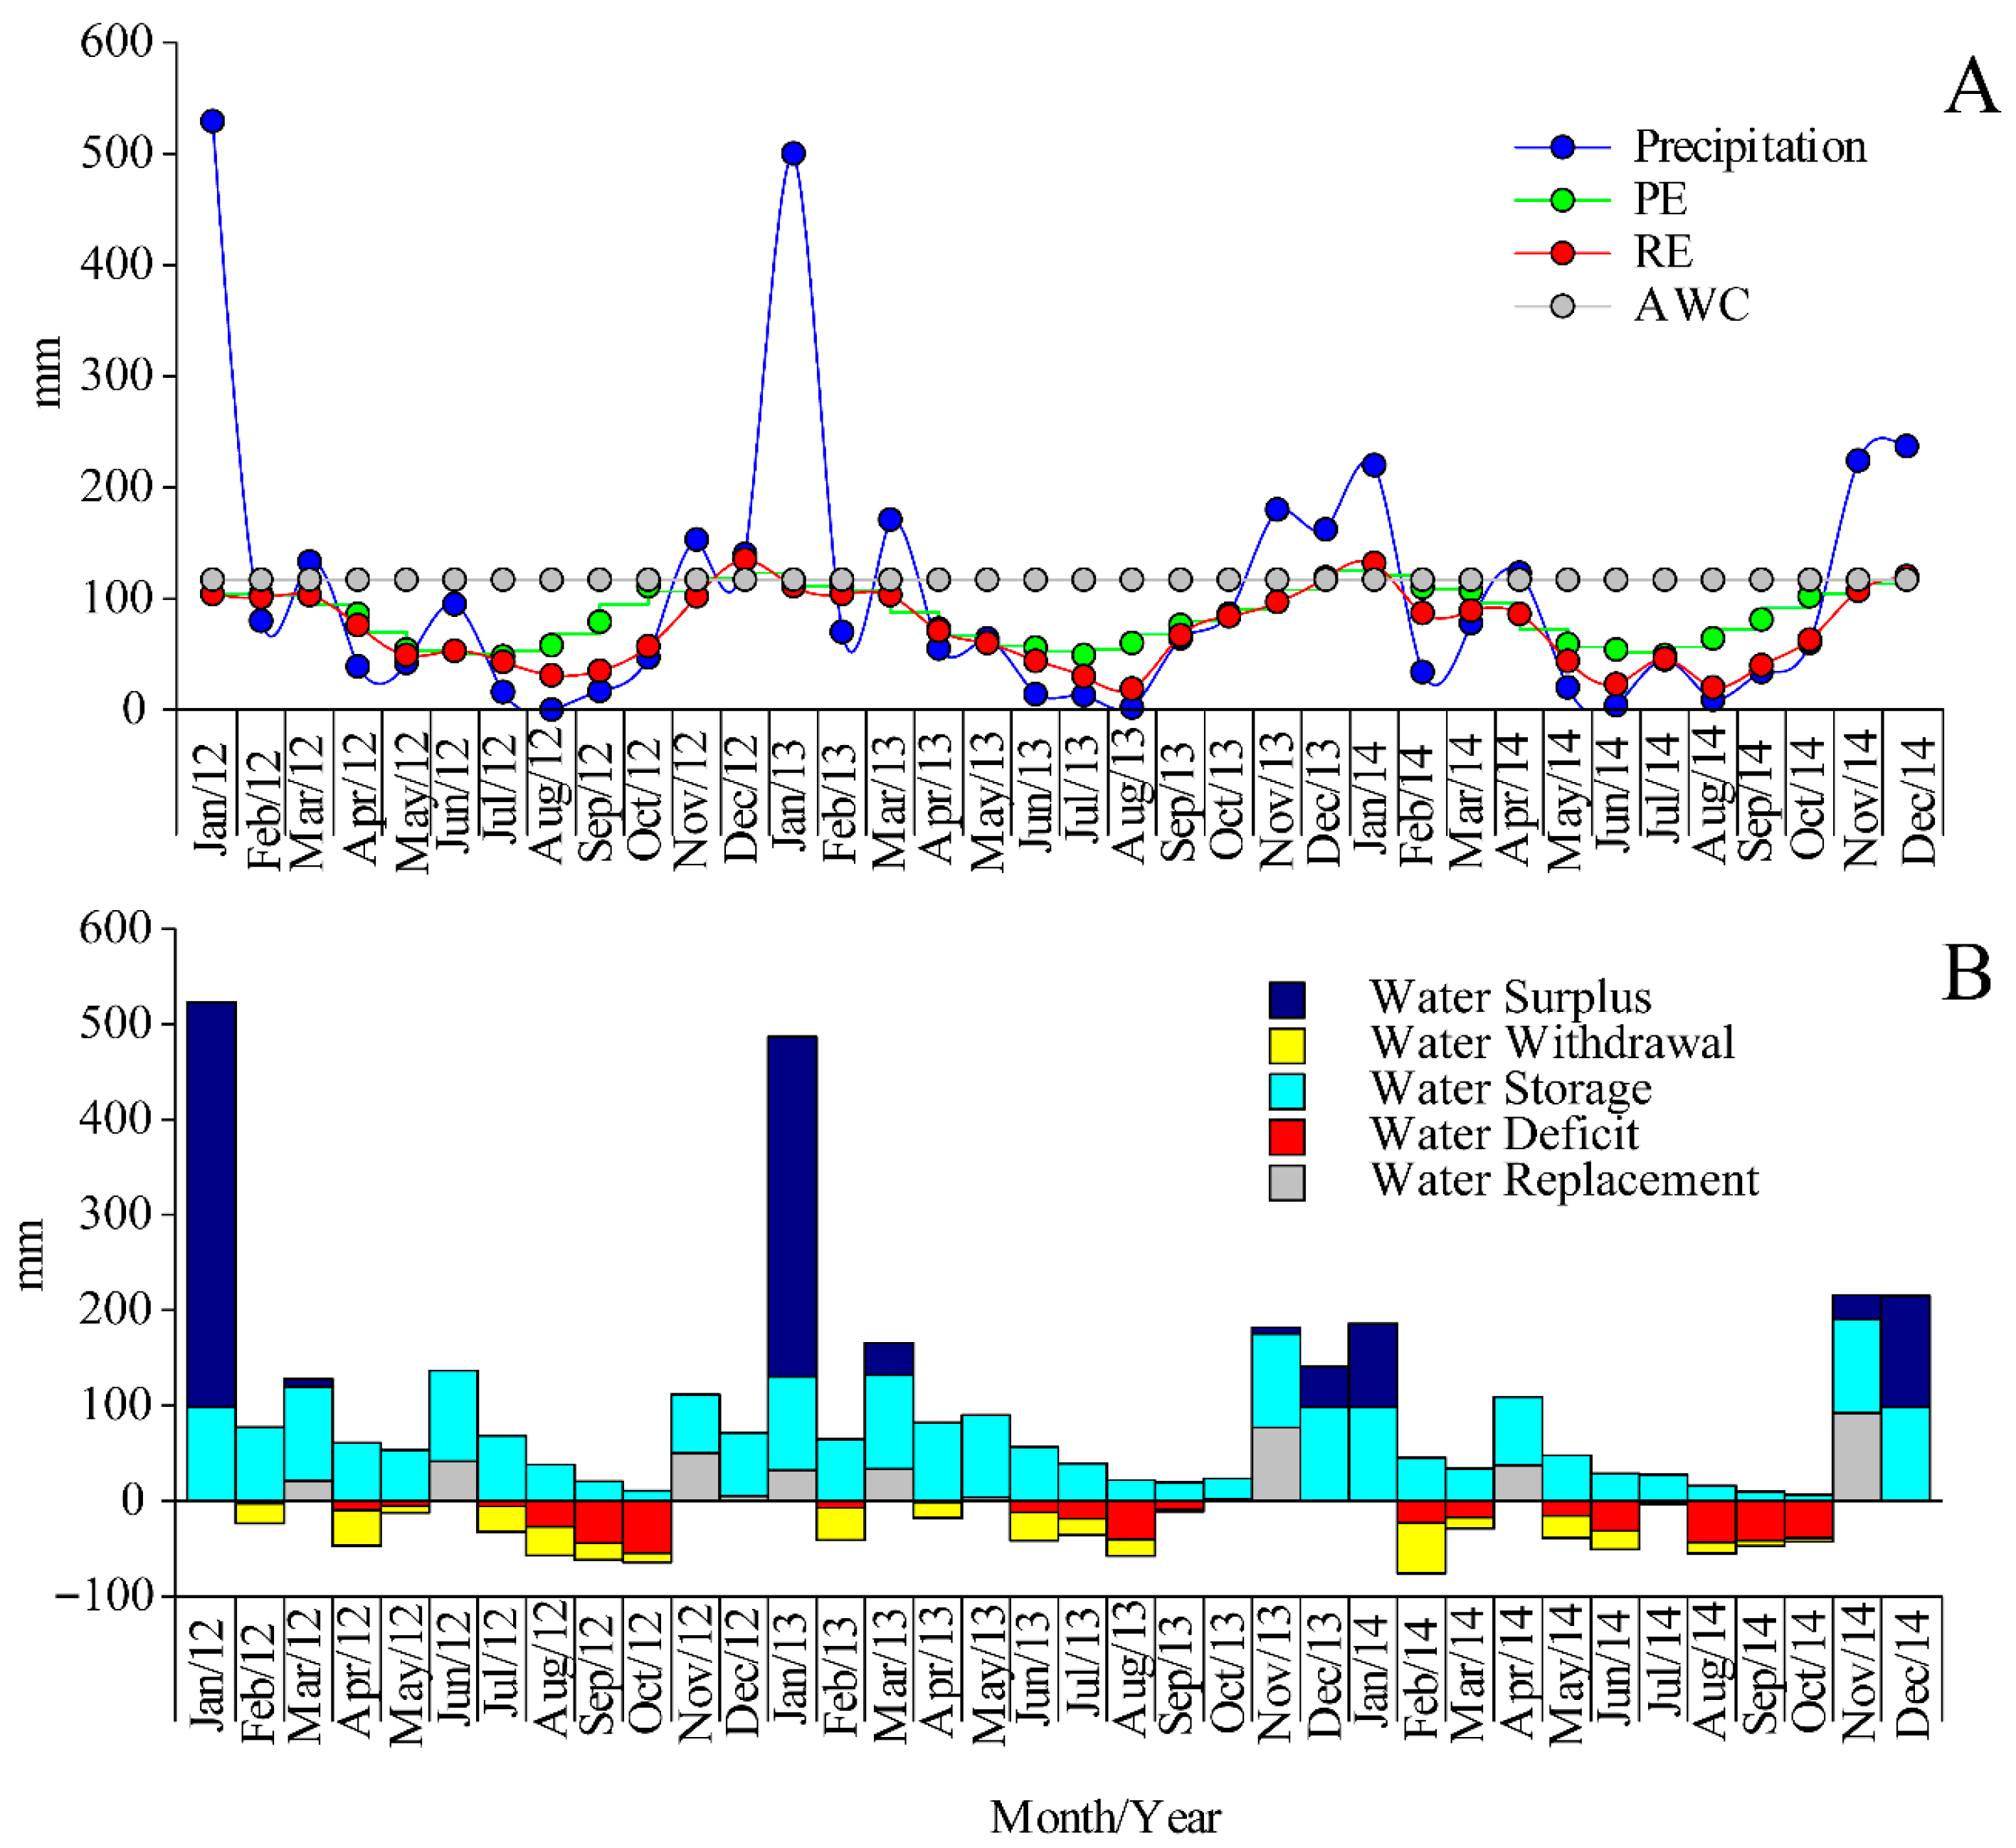
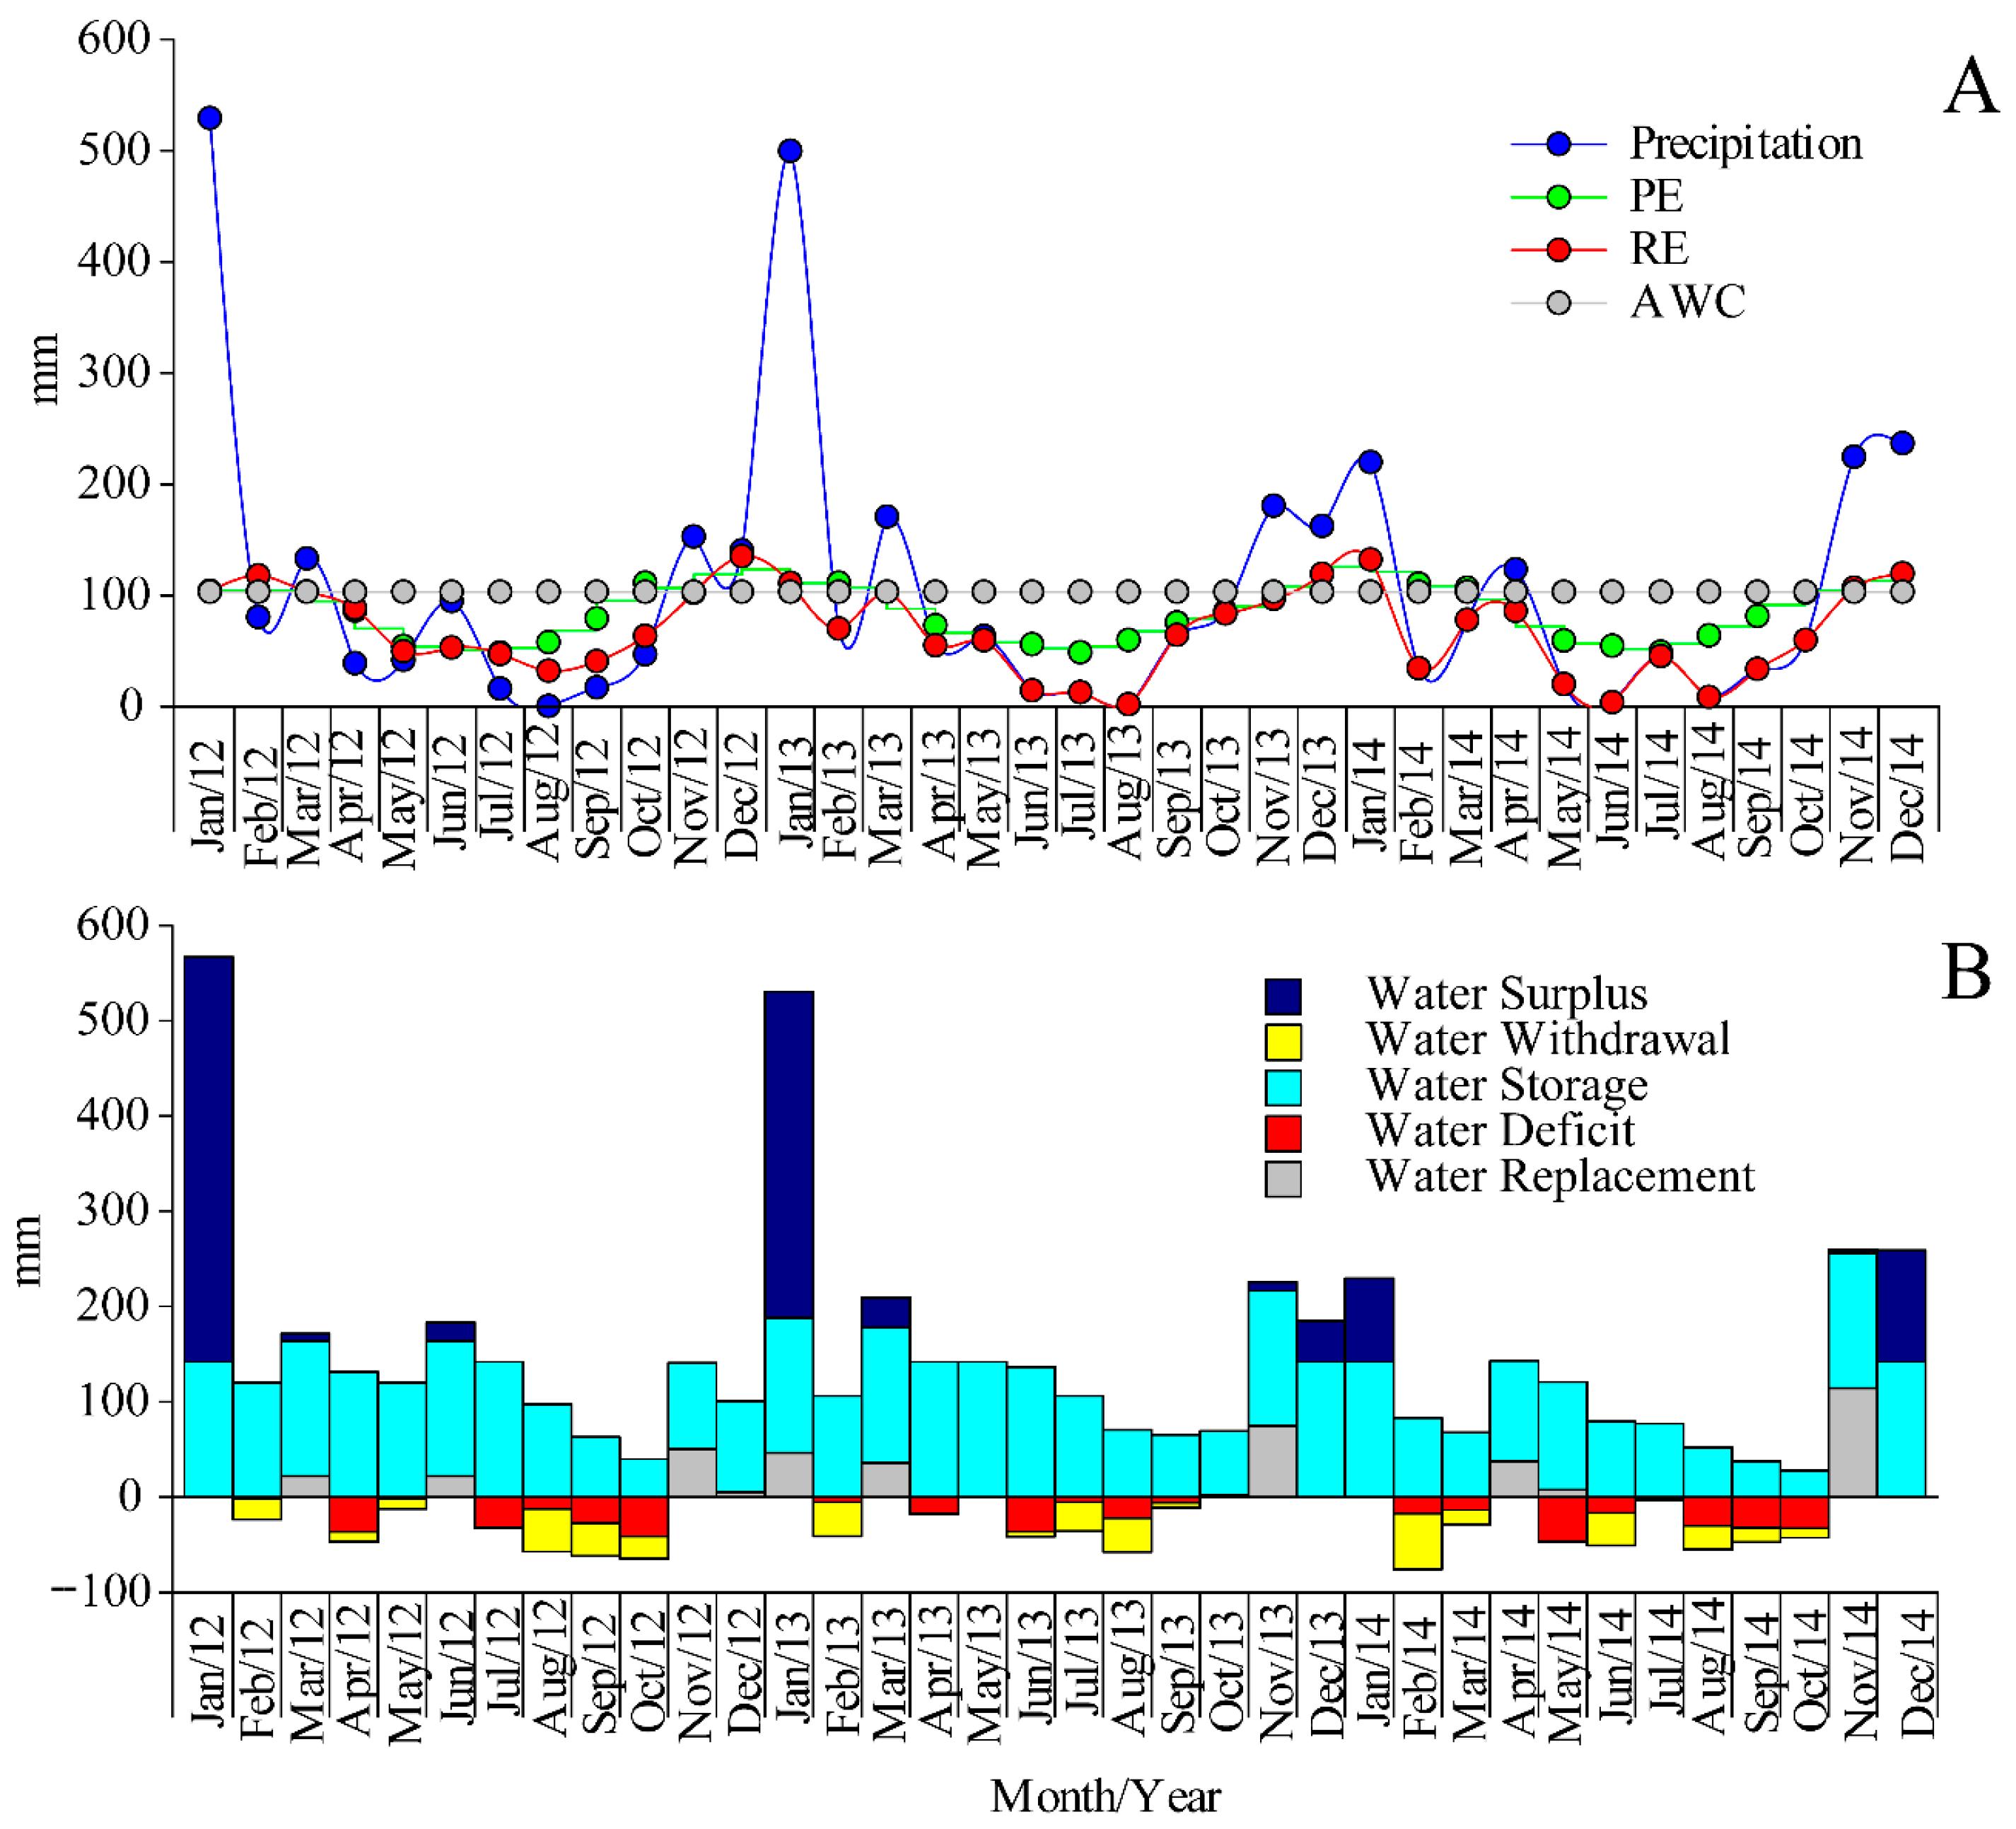
The monthly water balance (Figure 3 and Figure 4) shows that in 2012 and 2013, January had the highest precipitation (Figure 3A and Figure 4A). However, water deficit situations can be observed for both Inceptisols (I and II) from February to October, regardless of the years evaluated (Figure 3B and Figure 4B). Also, in both soils, from February to October, irrespective of the year, water storage and replacement can be observed, except for some months in which a water surplus was confirmed (Figure 3B and Figure 4B). On the other hand, water withdrawal was noticed from February to May and September to October (Figure 3B and Figure 4B), regardless of the years evaluated.

3.2. Water Retention and Root System

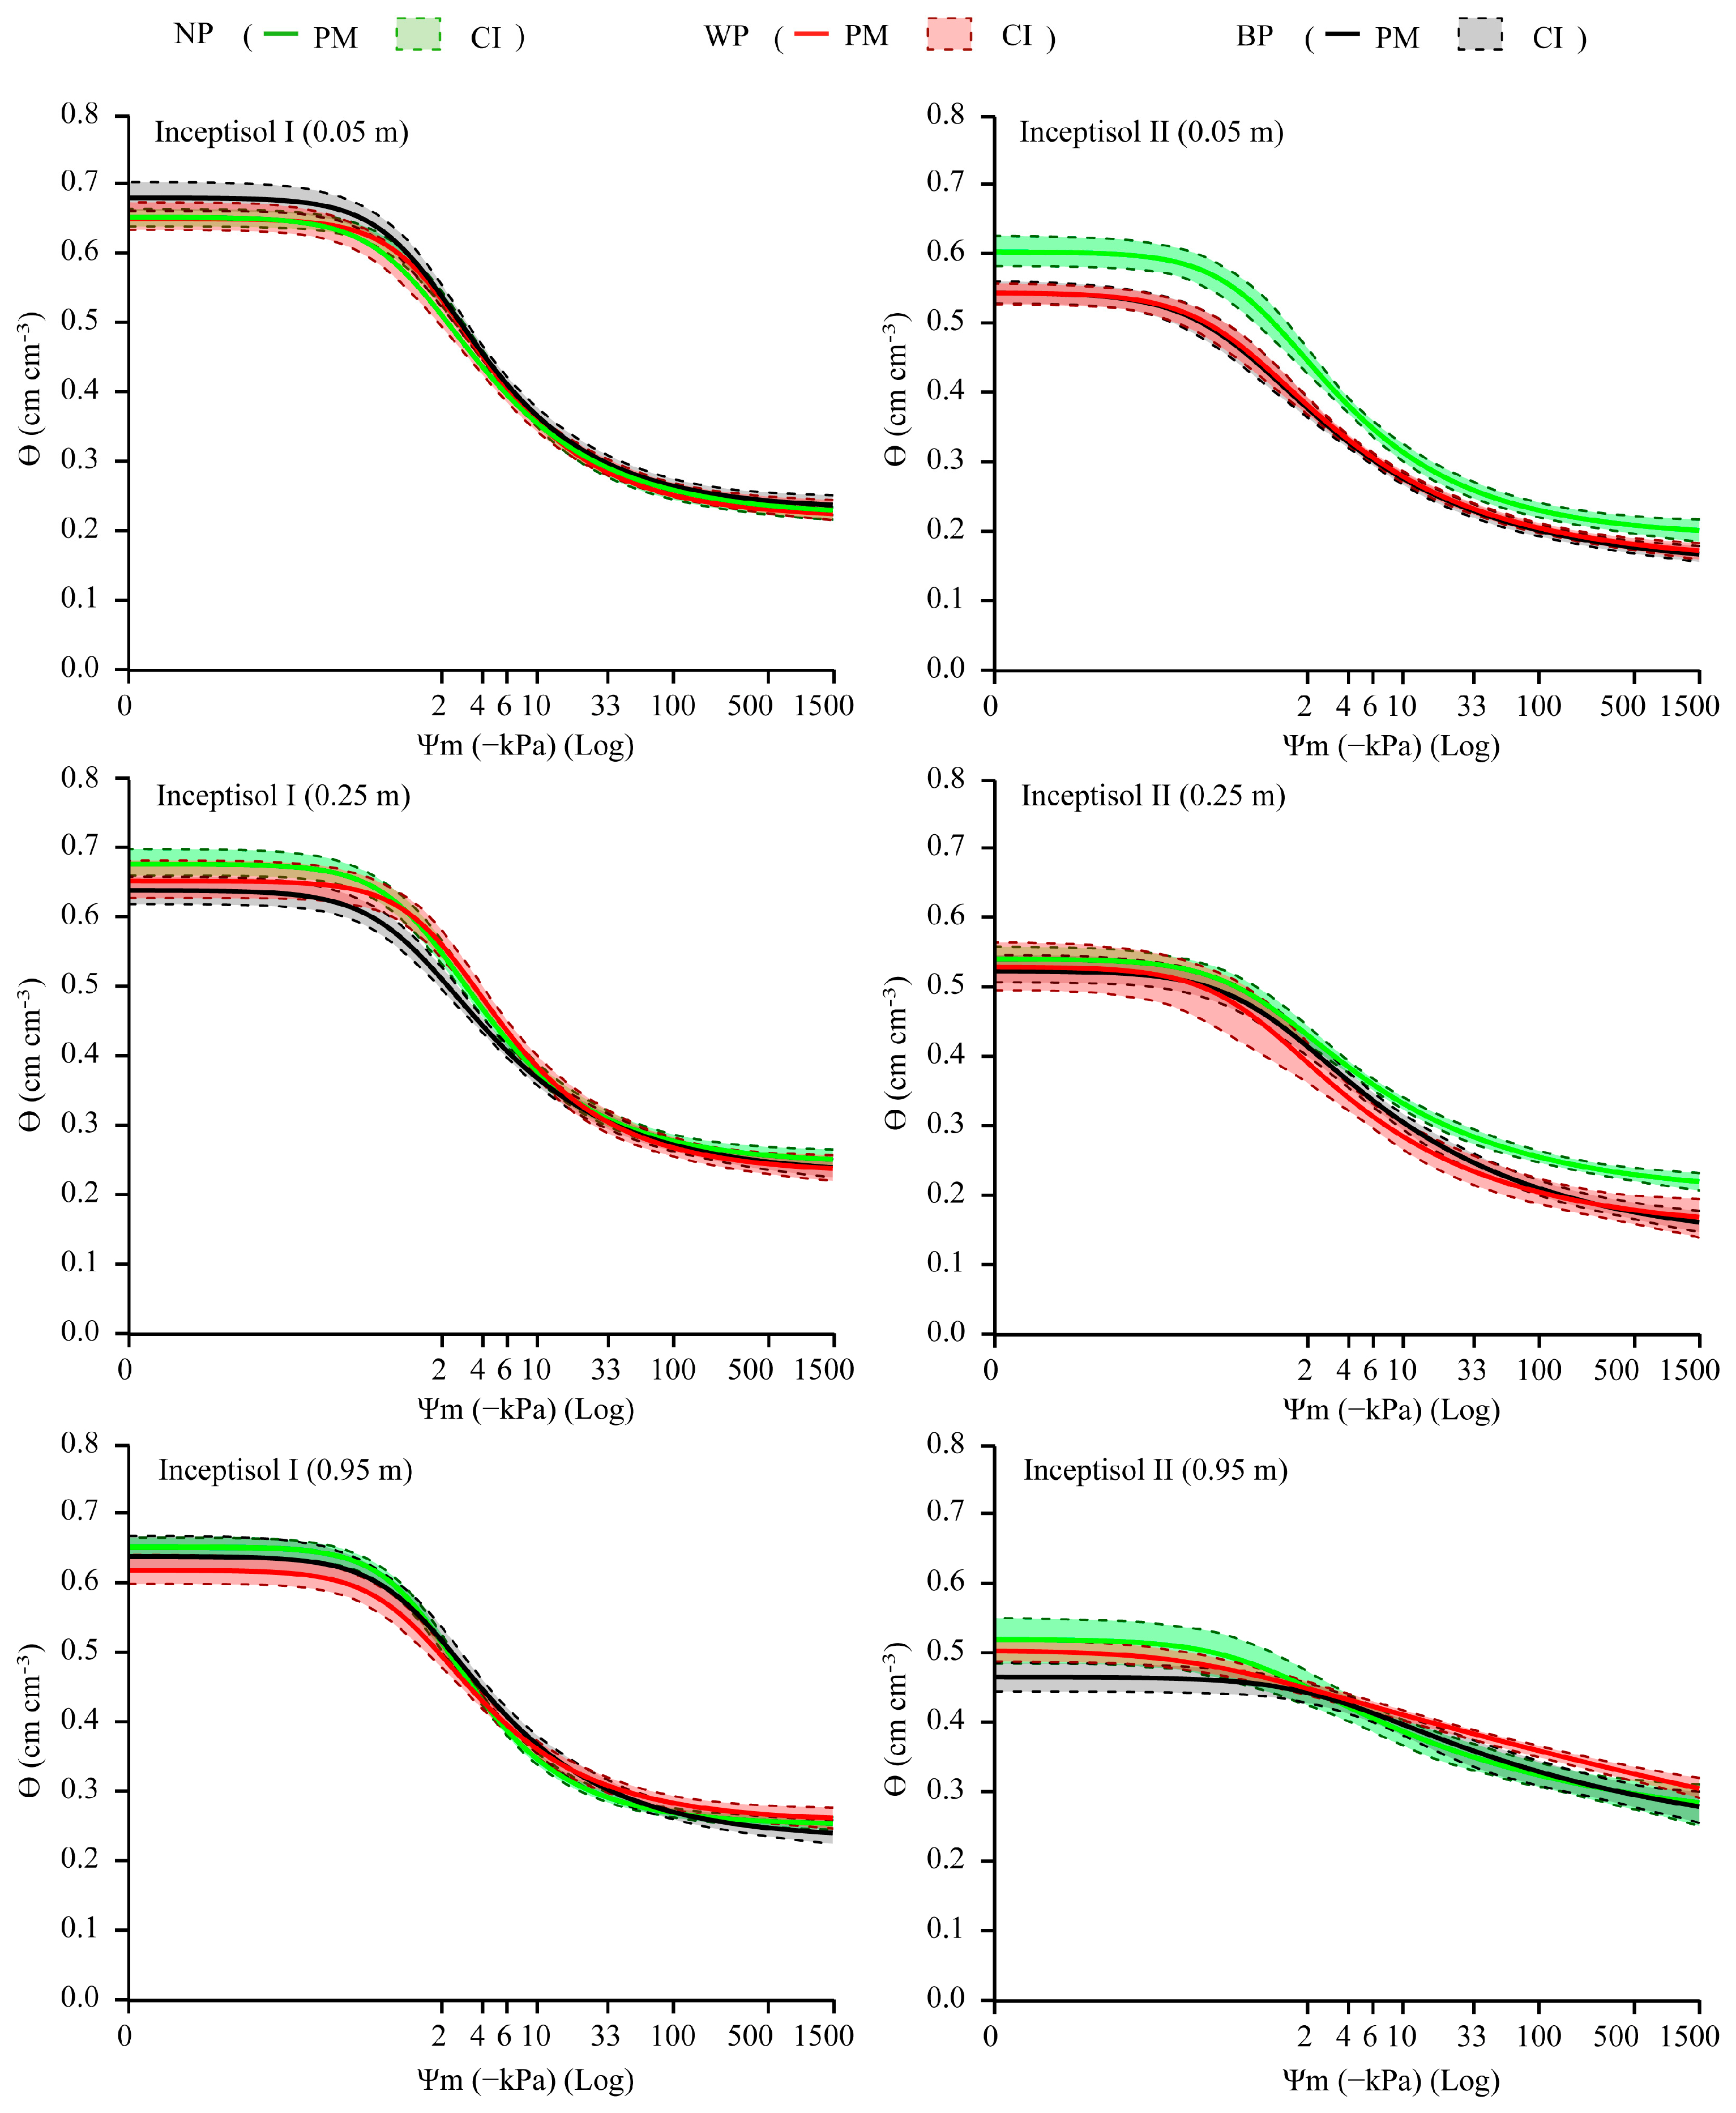
According to Table 3, the management with plastic covering interferes with the position of the inflection point (Ψi). For Inceptisol I, the white plastic cover (WP) contributed to a leftward shift in Ψi at 0.25 m (4.73), the highest value for this soil. The Inceptisol I also showed an increase in the water saturation capacity (Ɵsat) at 0.05 m after the use of the black plastic cover (BP) (Table 3), at low matric potentials (0–4 kPa), confirmed by the water retention curve (WRC) shown in Figure 5. At 0.25 m, regardless of soil type, a decrease in the retention capacity was observed throughout the WRC interval, especially under BP coverage (Figure 5).
The WRC of Inceptisol II is smoother than that of Inceptisol I, with a lower water content at Ɵsat, as confirmed by Table 3 up to 33 kPa (Figure 5), demonstrating a reduced water capacity available to plants. The changes in the physical and hydraulic attributes were more visible in Inceptisol II. At the most superficial depths (up to 0.25 m), the plastic cover reduced water retention along the entire curve, especially between the saturation point at 0.05 m and 10 kPa, and between 10 and 1500 kPa at 0.25 m (Figure 5). At 0.95 m, the BP cover reduced water retention at low matric potentials (0–4 kPa), and the WP cover, at the same matric potentials (0–4 kPa), increased the water volume until the residual moisture (1500 kPa) (Figure 5).
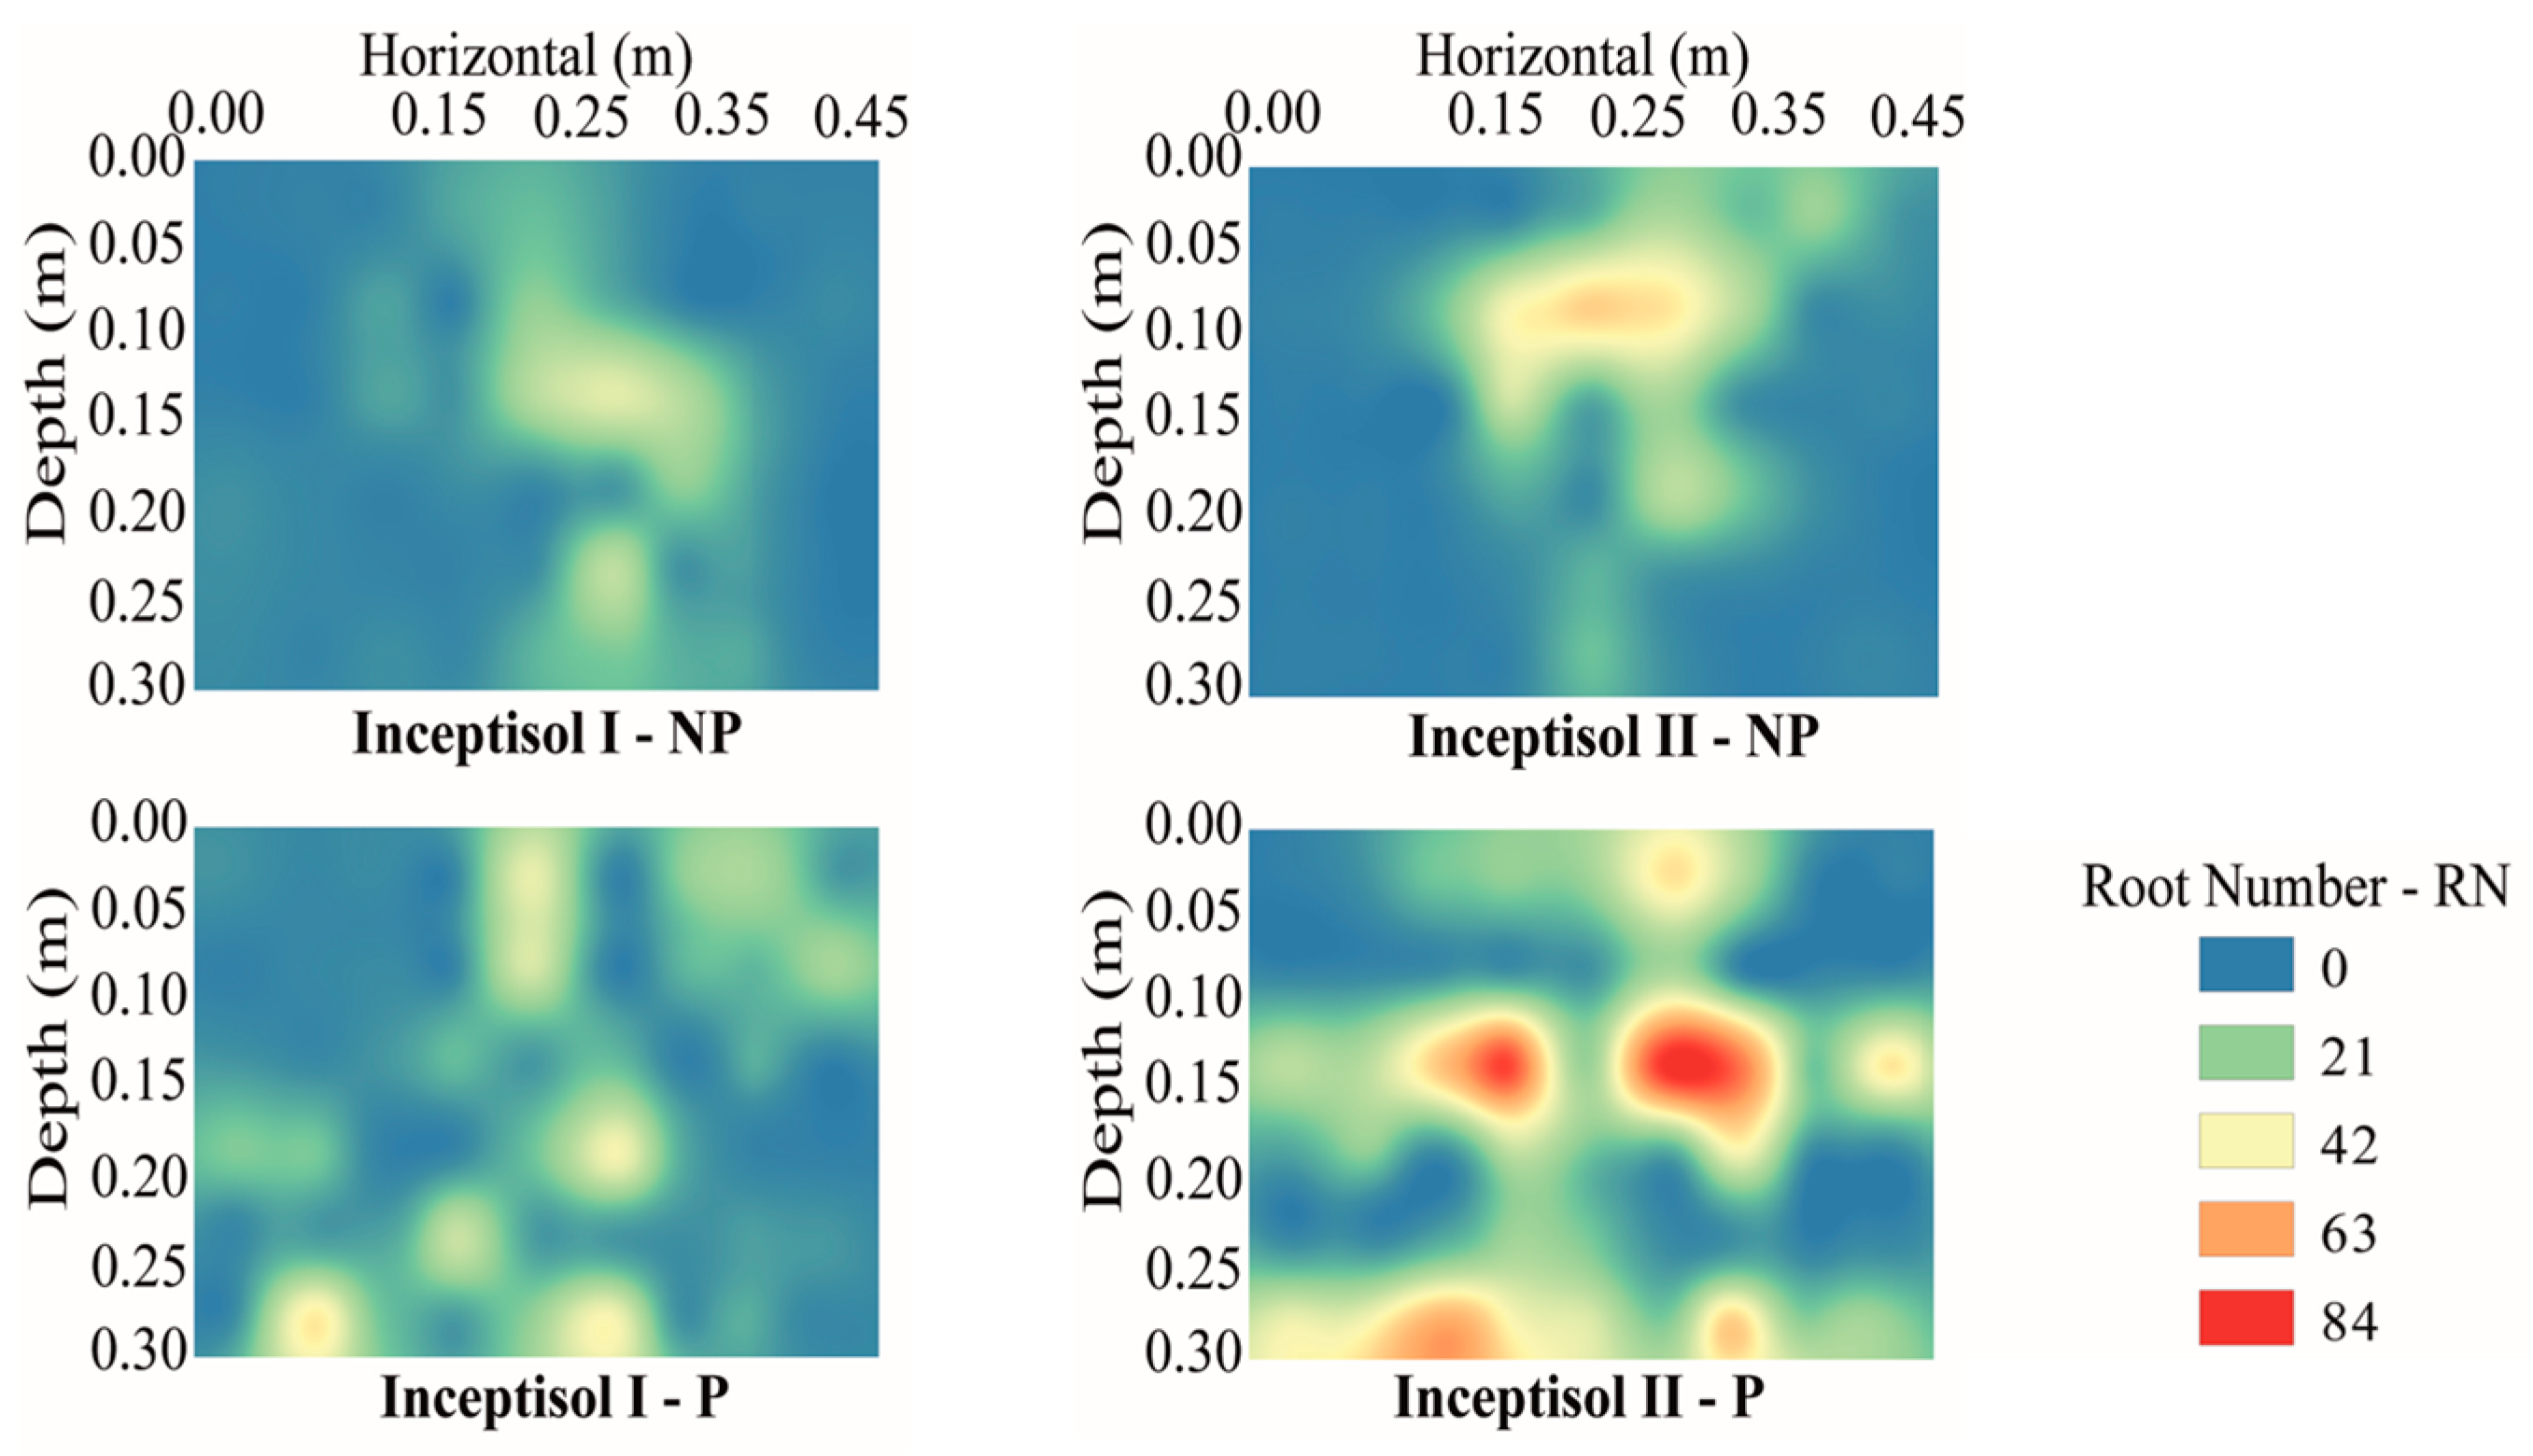
The number of roots (NR) showed that covering with plastic, regardless of the color (black or white), promoted better distribution of the root system along the soil profile, which was not verified for the soil without the use of plastic cover (NP), with Inceptisol II having a higher RN than Inceptisol I (Figure 6).

3.3. Soil Physical Indicators

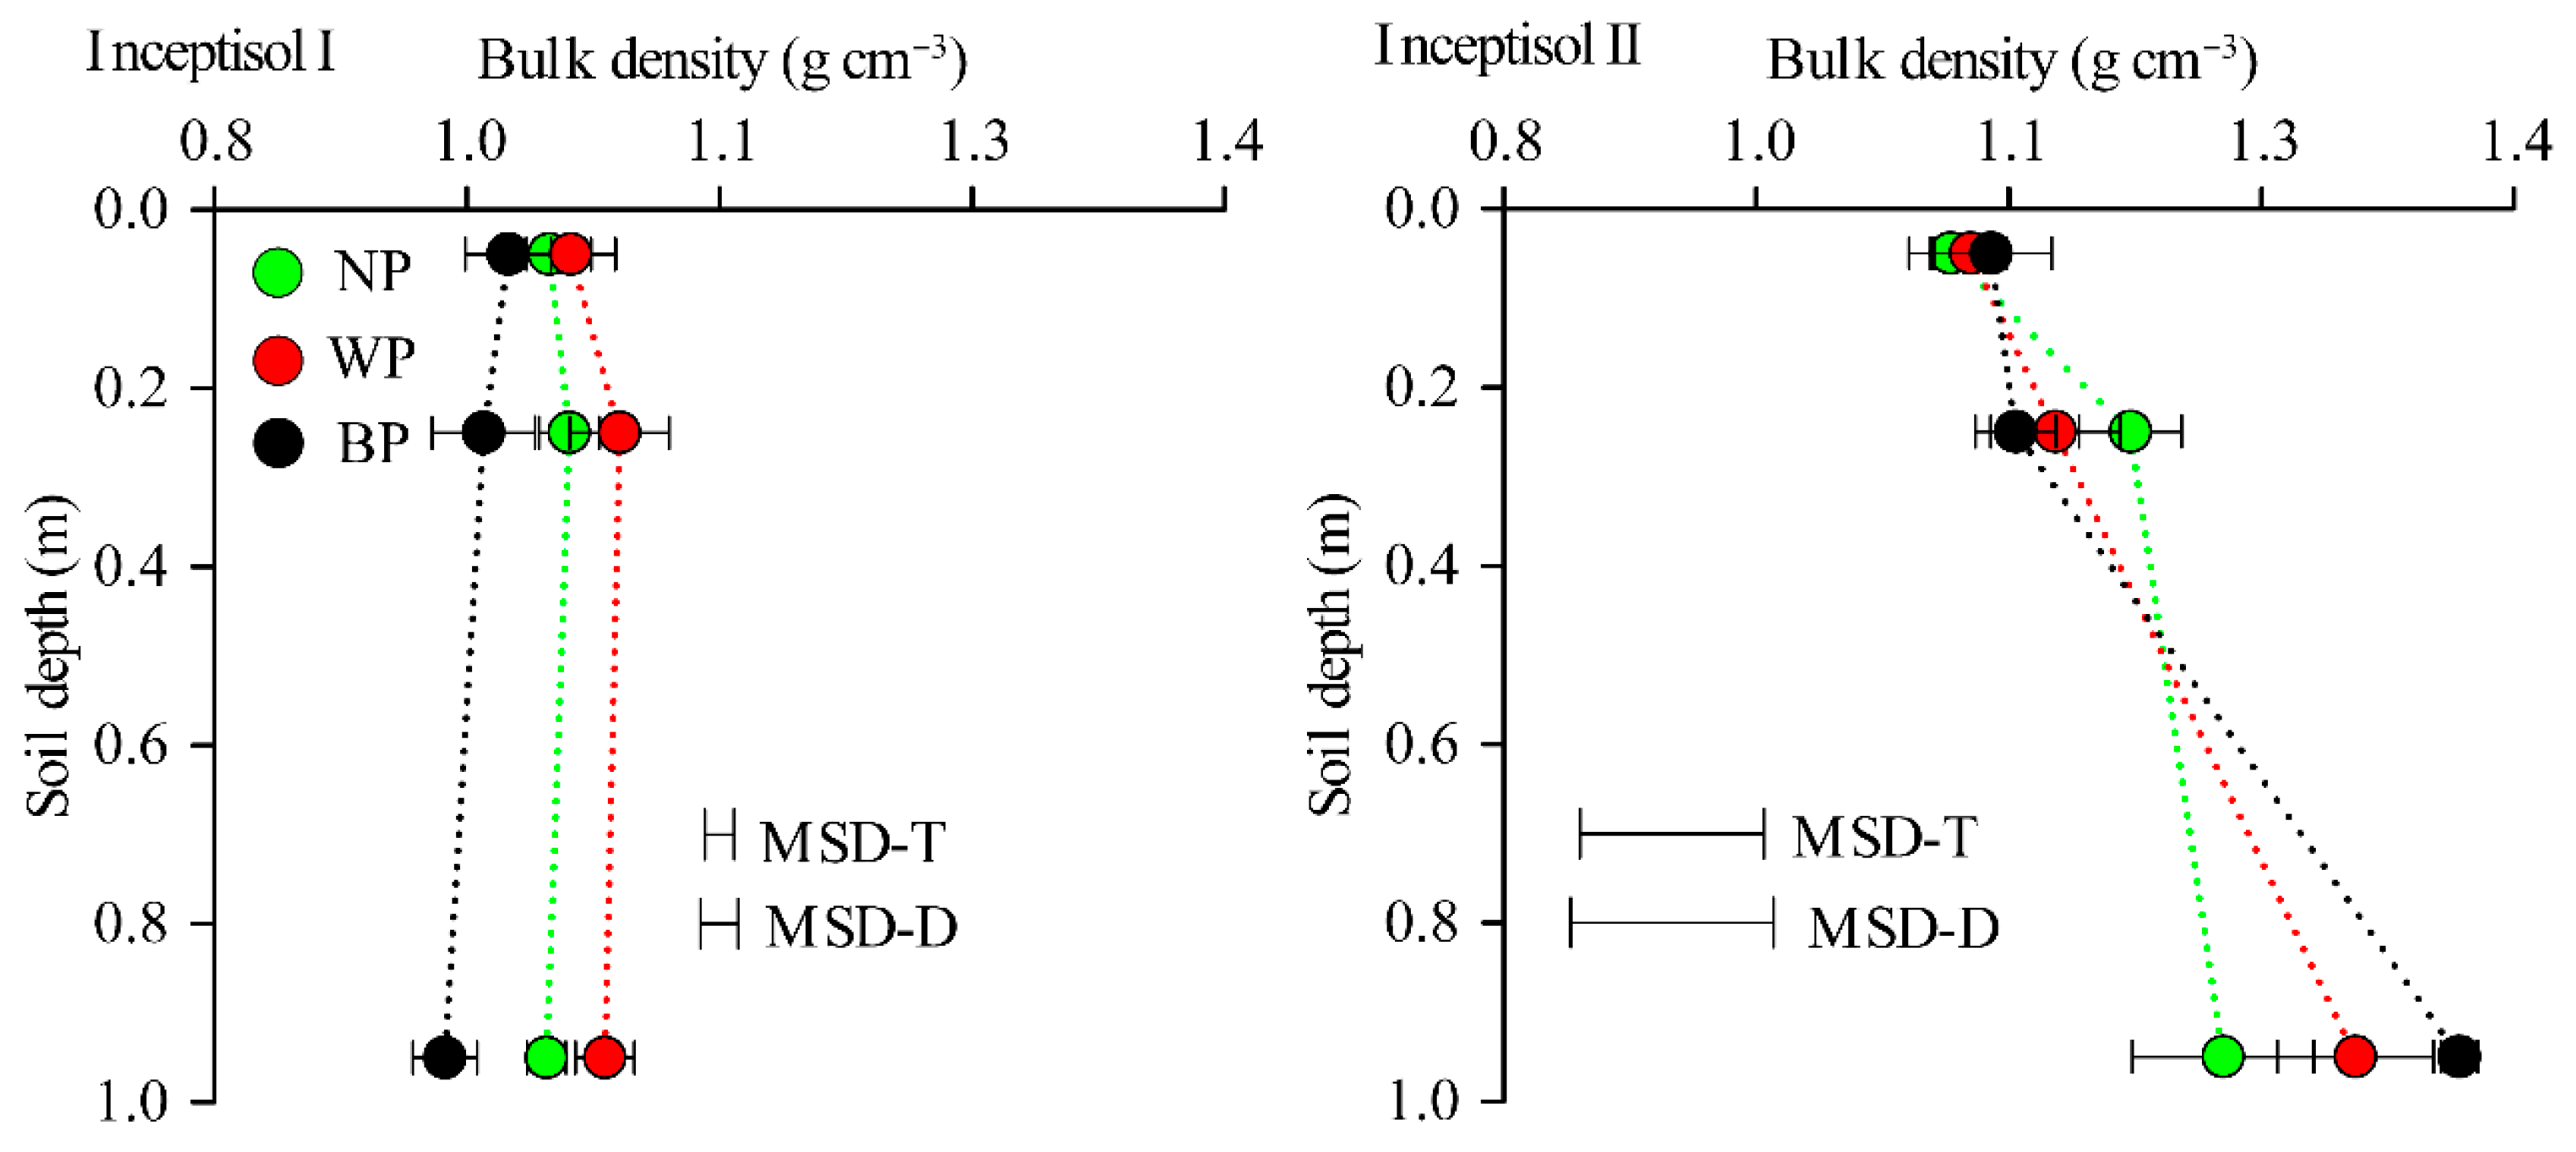
Analyzing bulk density (BD), the most pronounced effect was an increase in porosity of Inceptisol I (Figure 5) and a reduction in BD with BP, mainly at 0.25 m (Figure 7). There was no difference in soil depth across the treatments studied. The 0.95 m depth showed an increase in density at the surface (0.05 and 0.25 m) with the WP and BP use treatments.
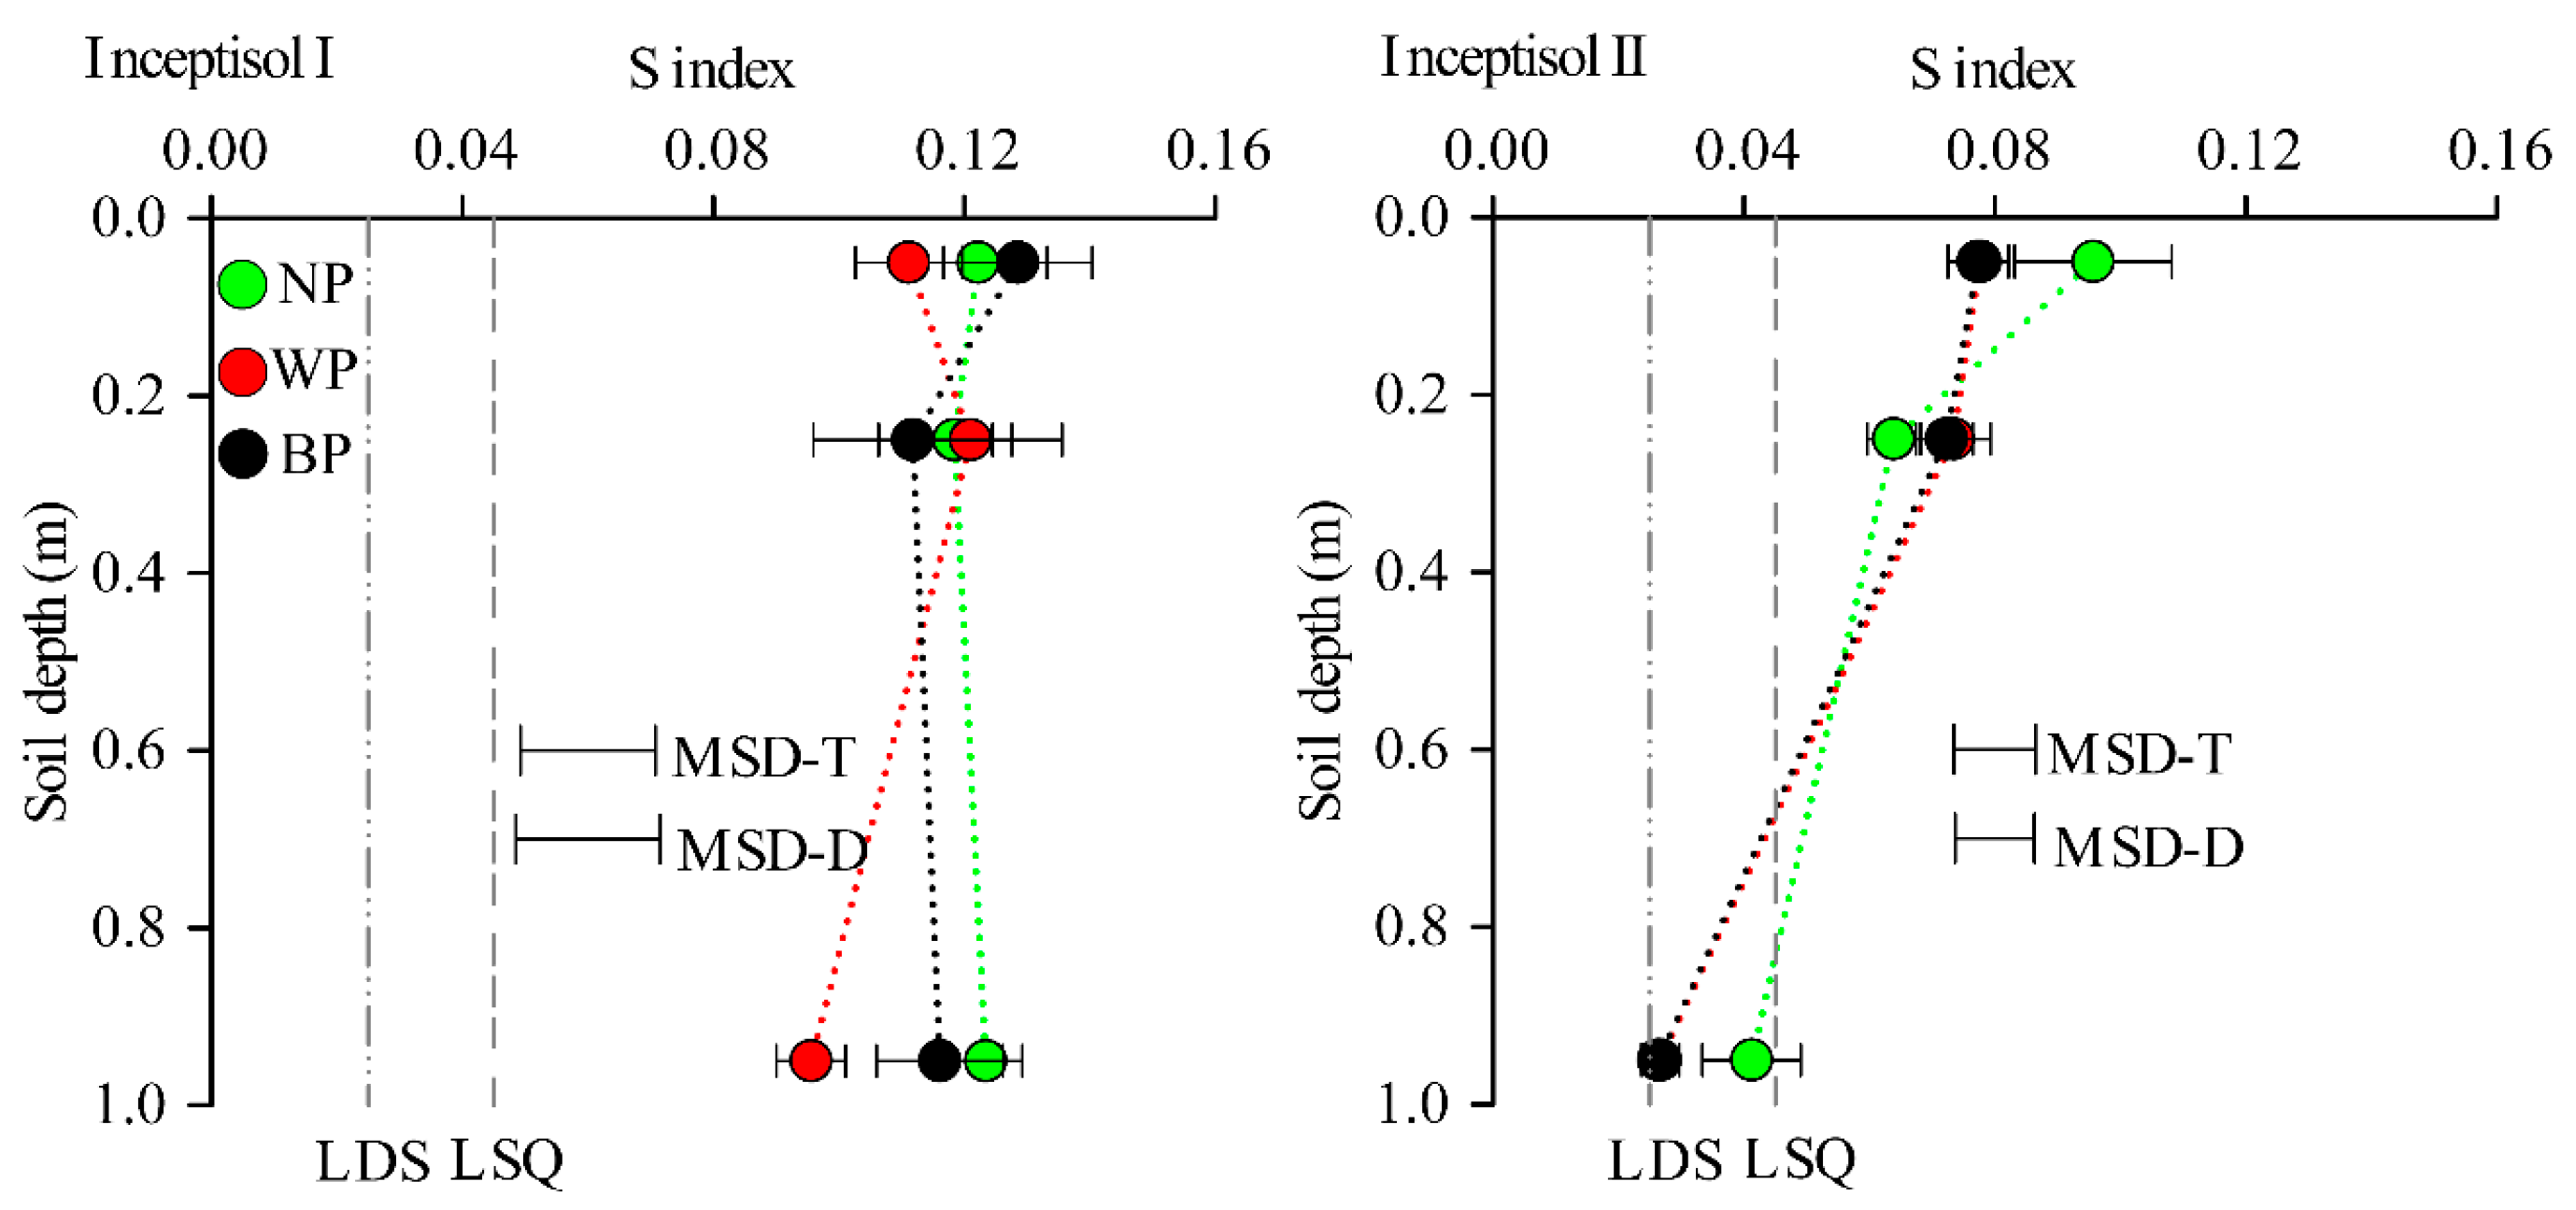
The S index (Figure 8) did not promote significant changes in soil quality for any soil when comparing the treatments with the control (without using the plastic cover—NP). In Inceptisol I, the S index did not differ across soil depths; in Inceptisol II, the surface layer (0.00–0.25 m) had a higher S index across all treatments.
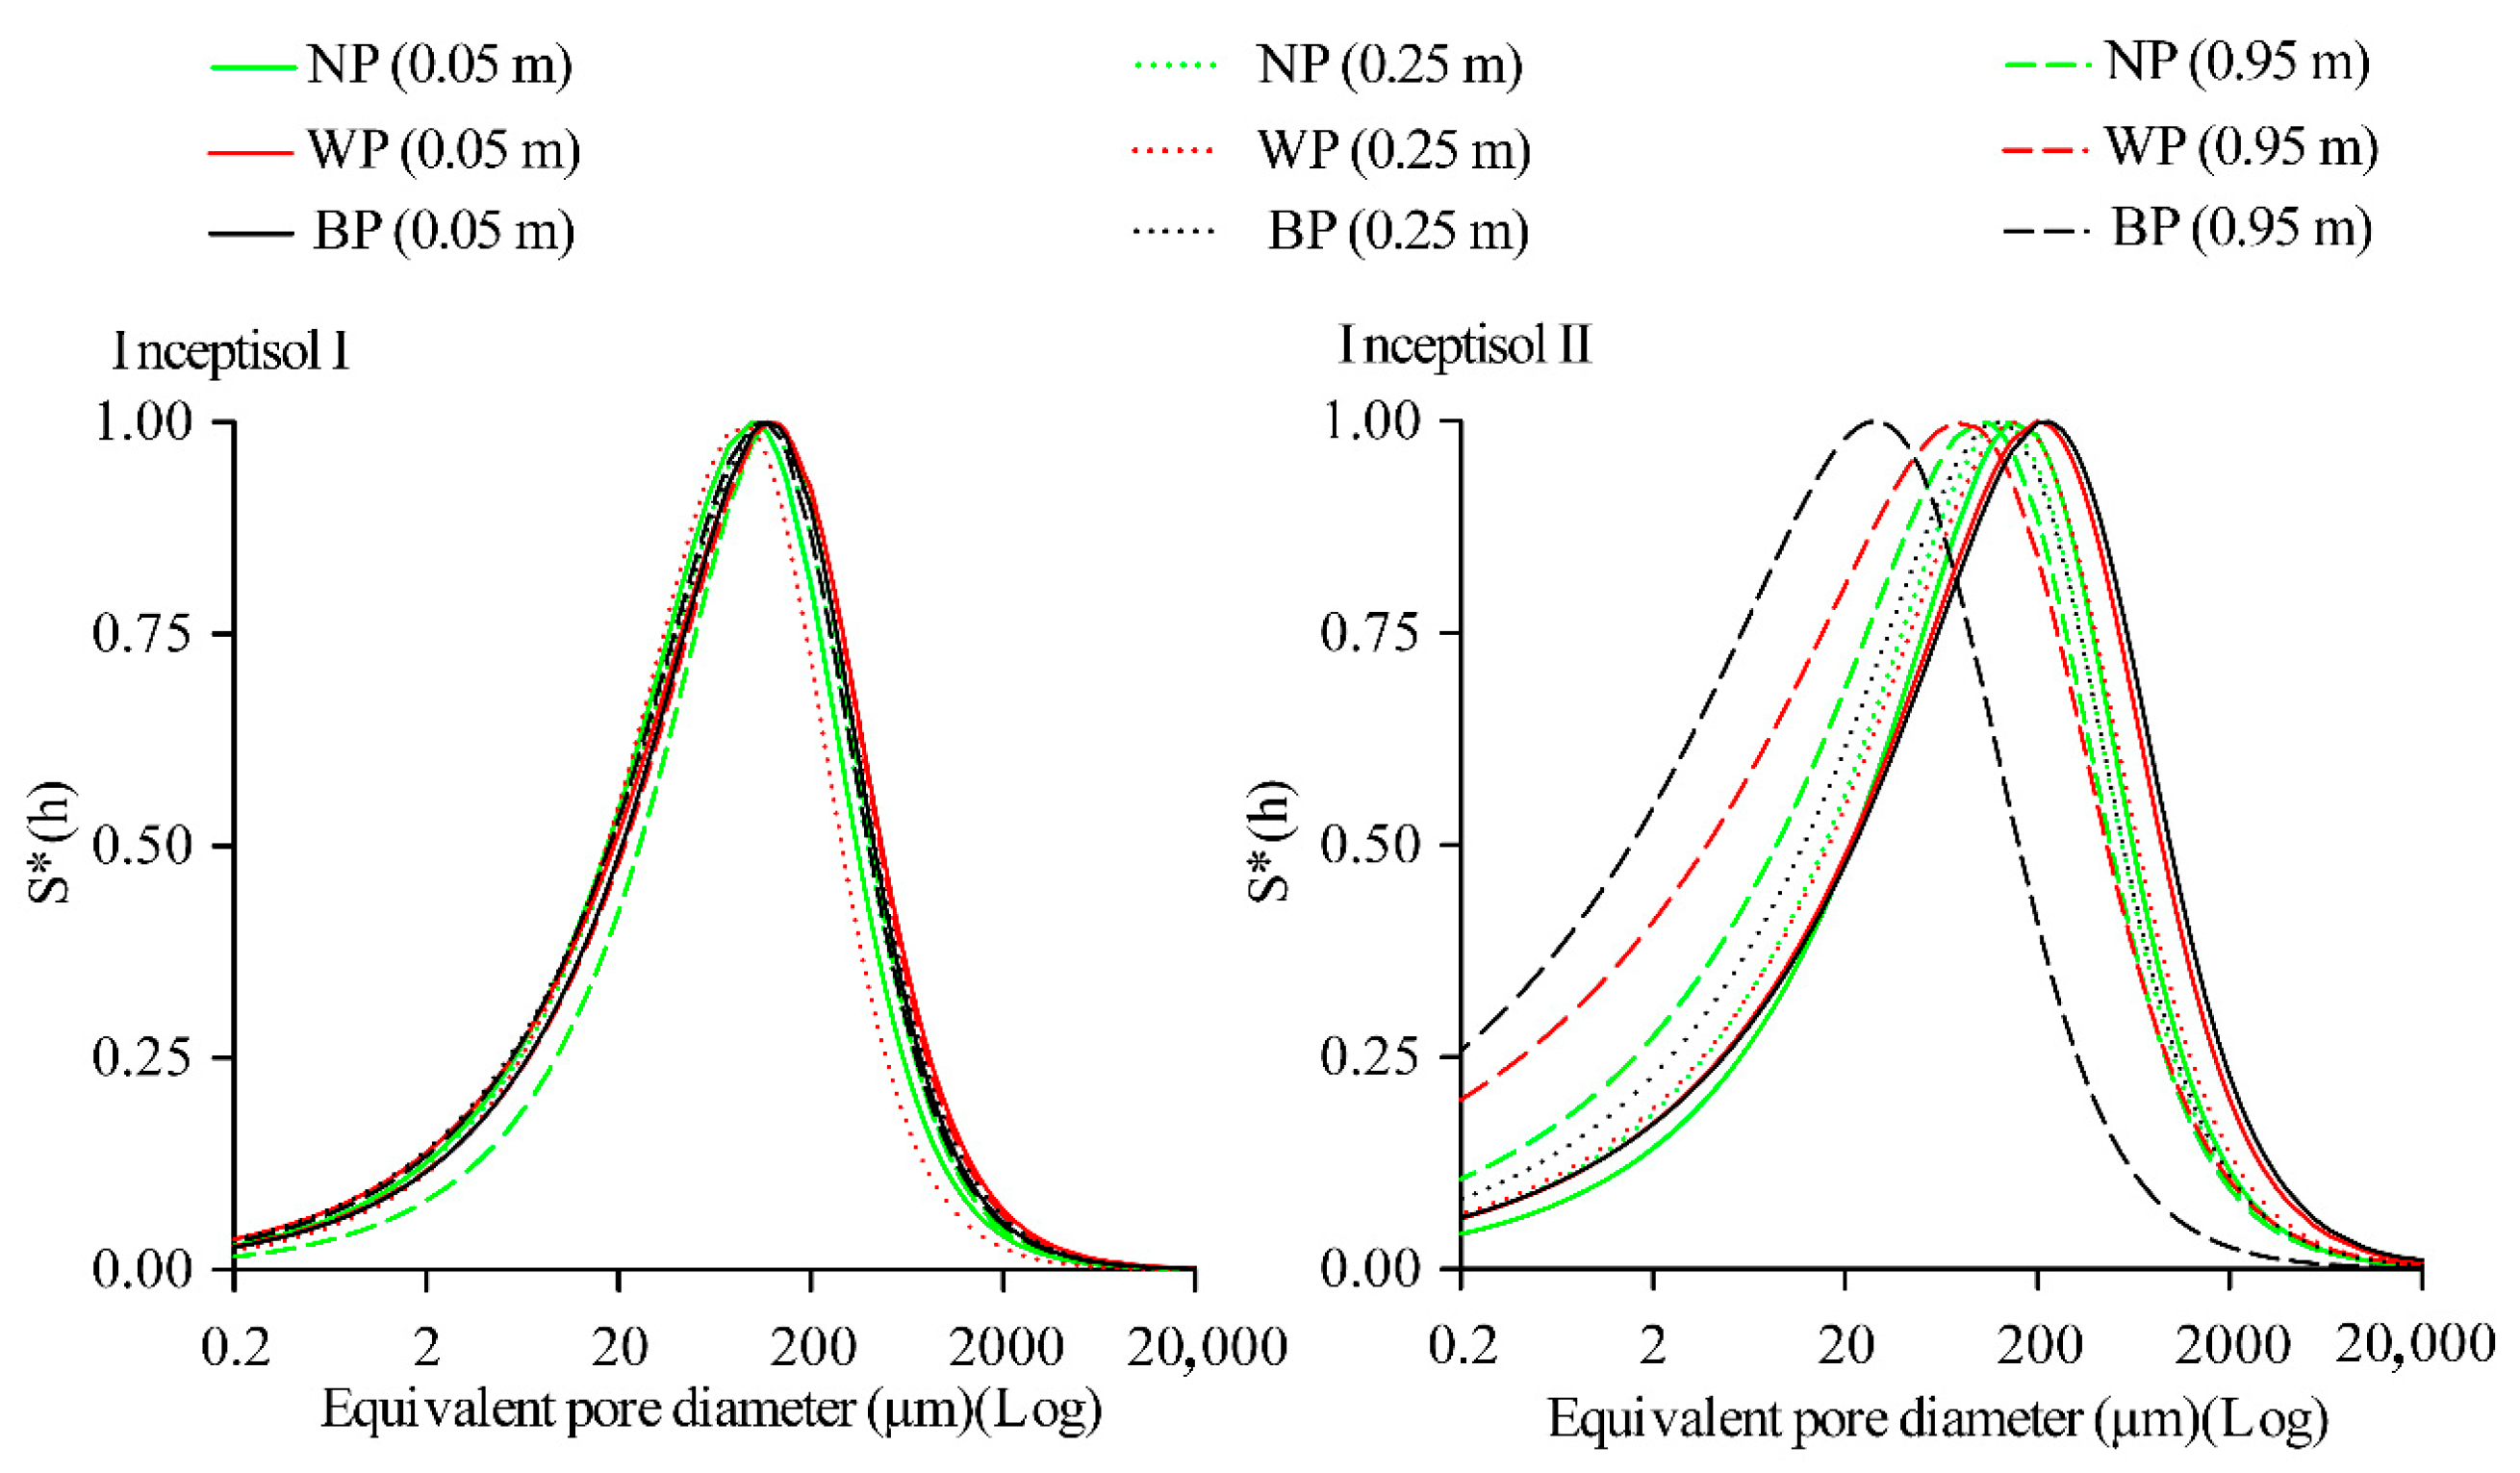
Compared to Inceptisol I, Inceptisol II showed a greater response to the plastic cover, resulting in a noticeable shift in the standard pore distribution curve to the left at depths of 0.25 m (Figure 9).
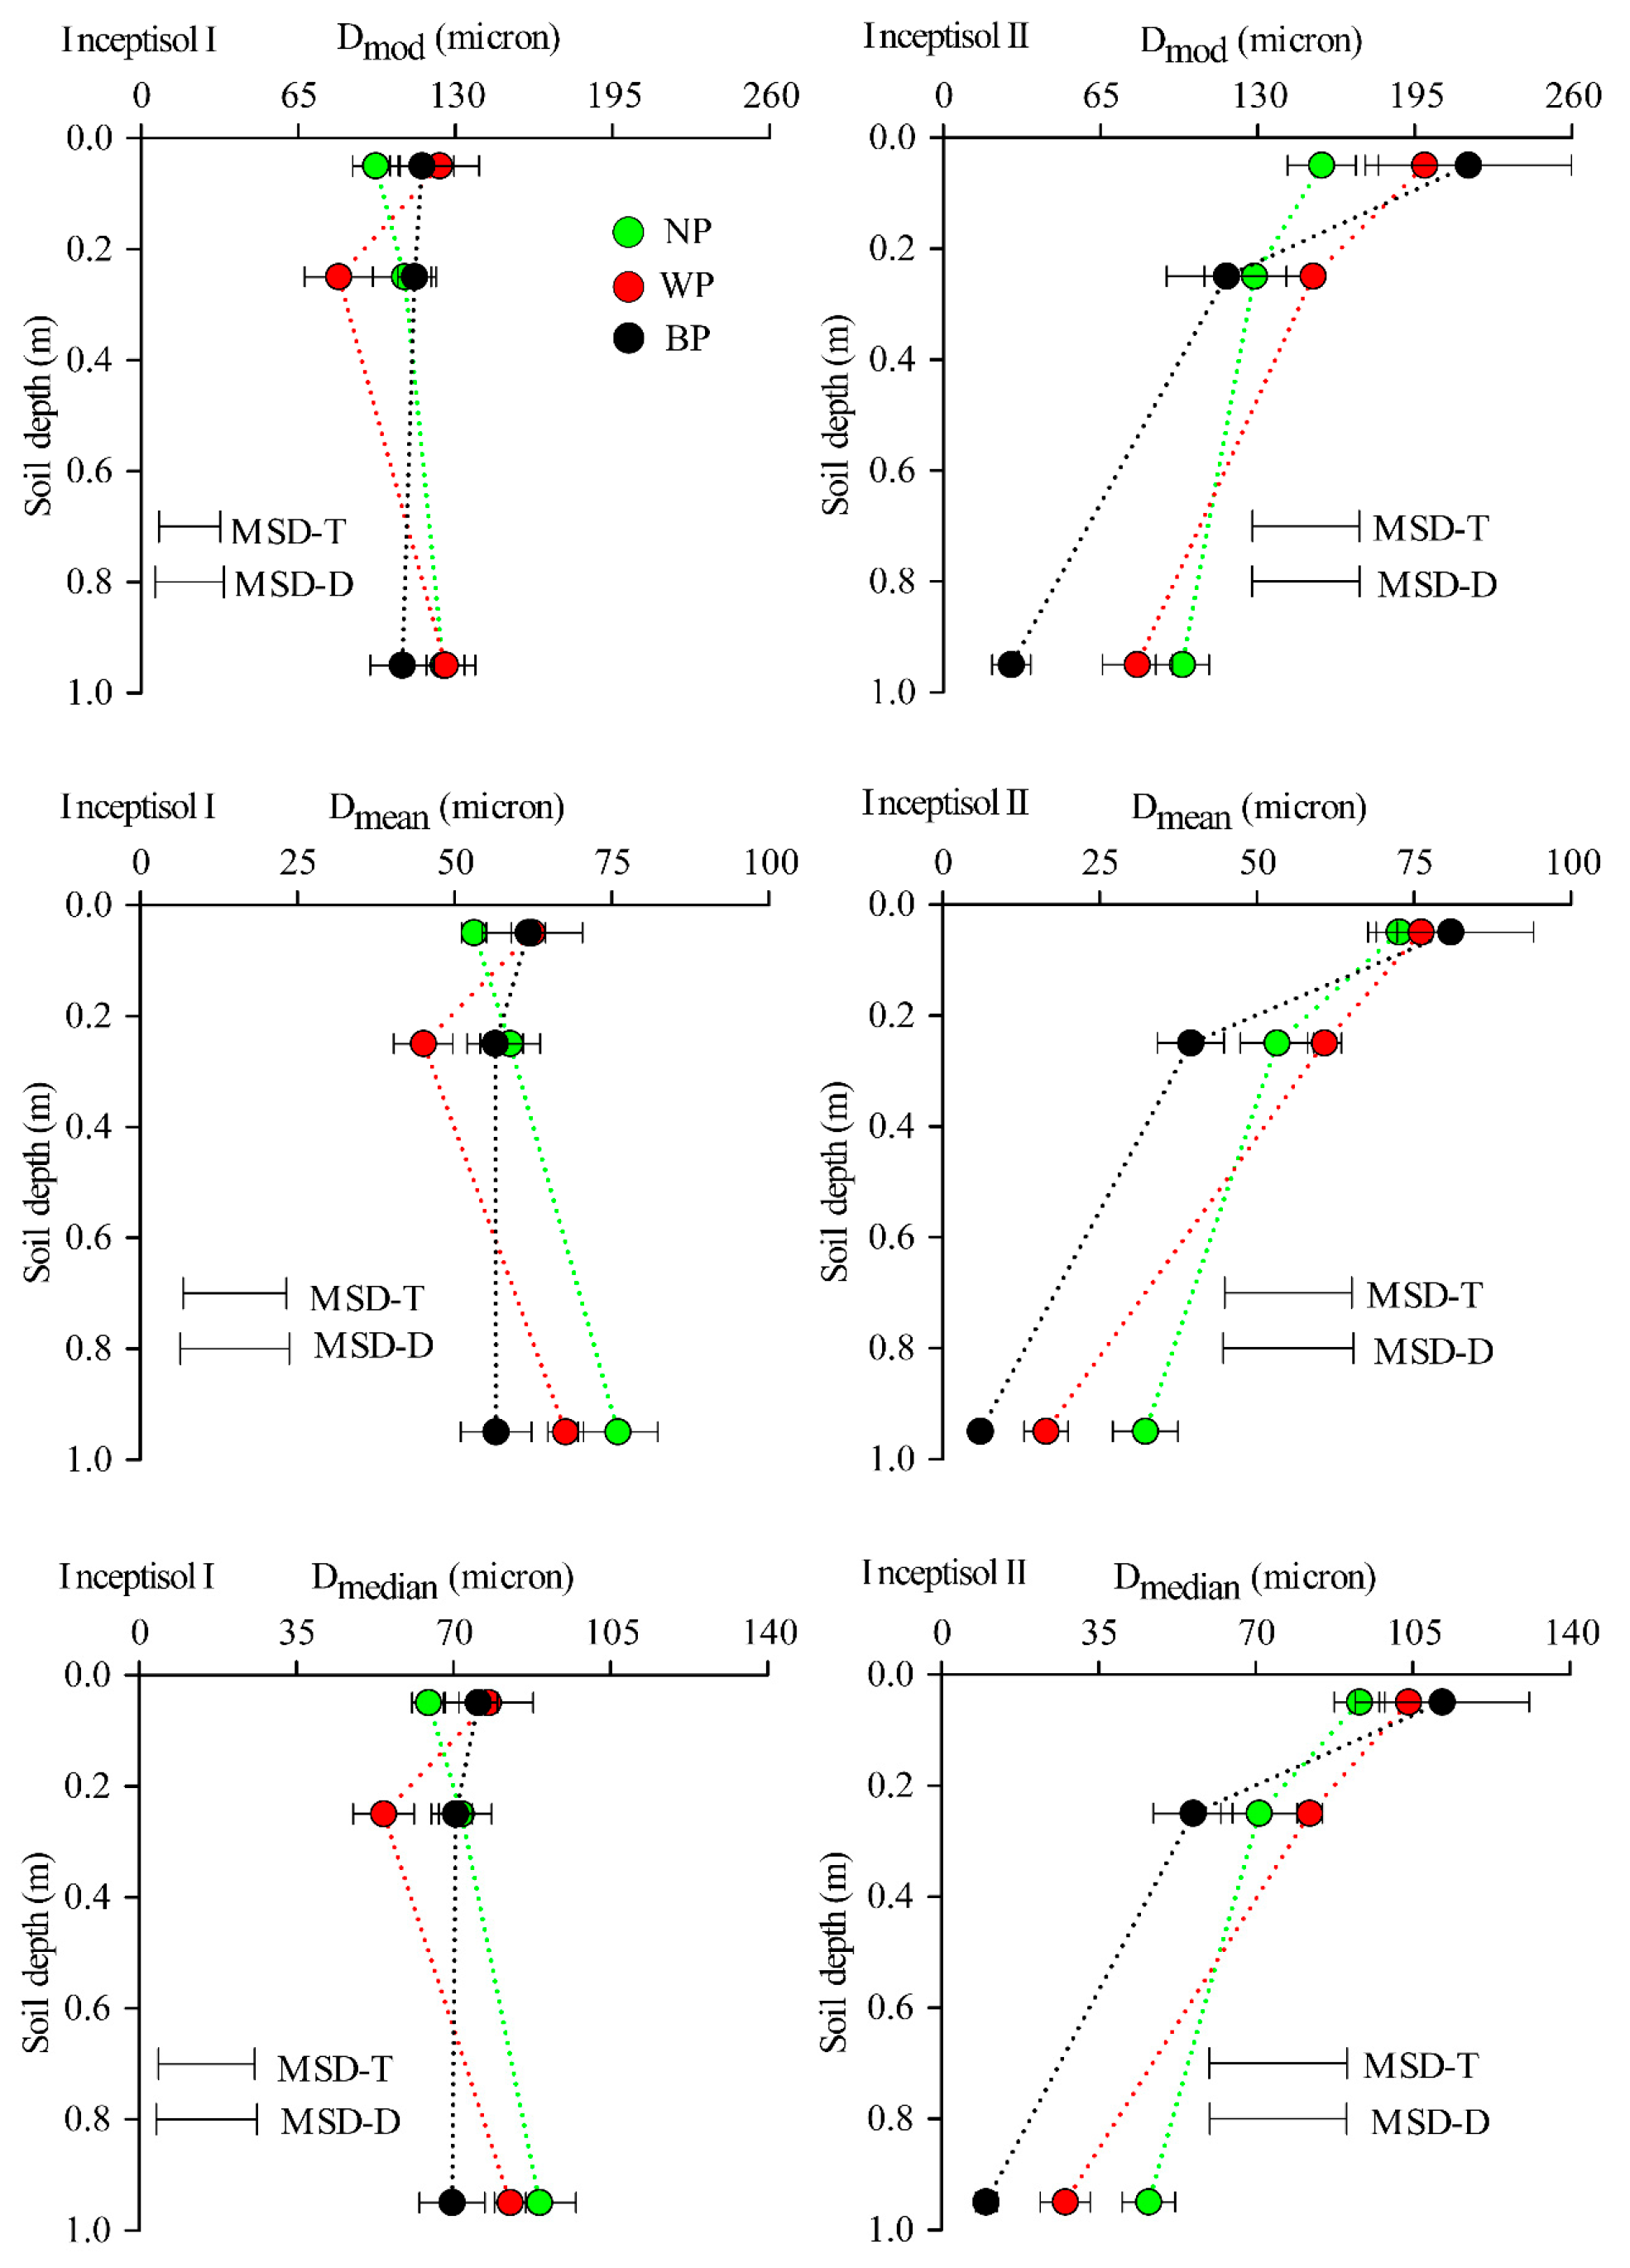
The mode equivalent pore diameter (Dmod) was unaffected by plastic mulching in any soil type or layer. In Inceptisol II, the application of BP decreased the mean equivalent pore diameter (Dmean) more than NP or WP. Inceptisol II had a median equivalent pore diameter (Dmedian) of 0.25 m at the other depths with WP application (Figure 10).
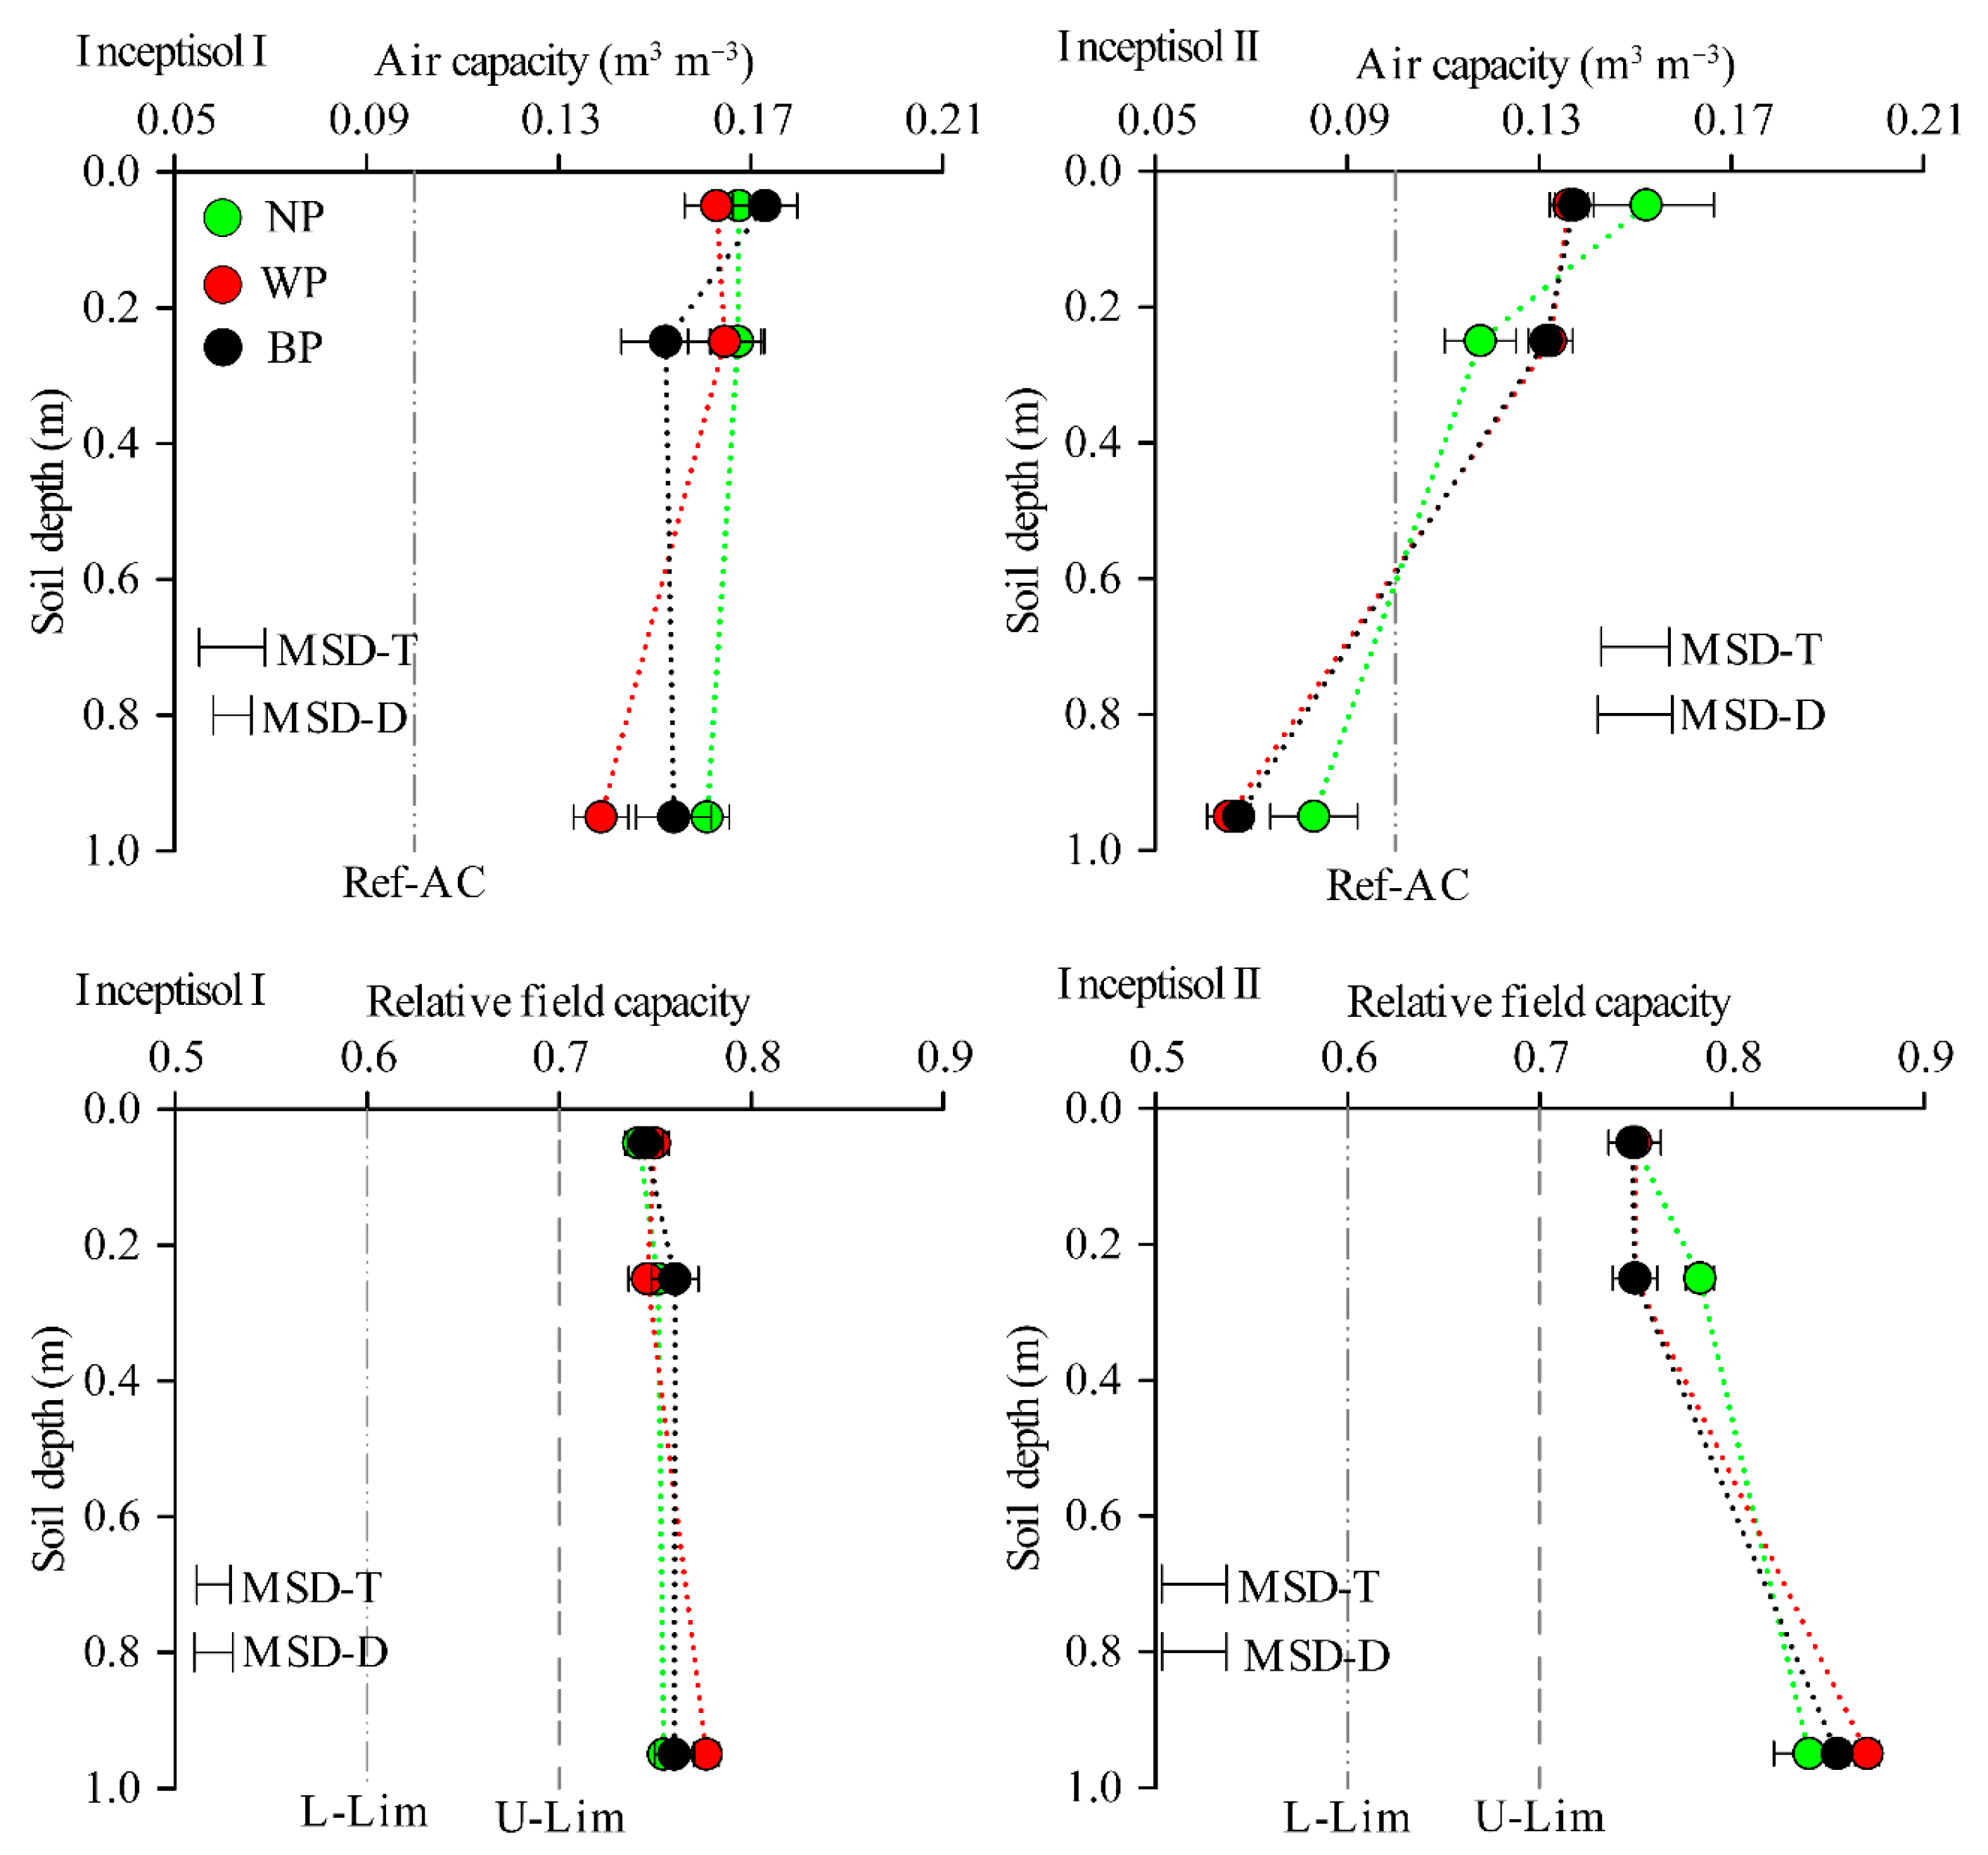
The air capacity (AC) did not change in both soils after plastic mulching (Figure 11). However, in the soil profile with the WP and BP (plastic covering), the AC was smaller at 0.95 m in depth for Inceptisol I and at 0.05 m and 0.25 m in depth for Inceptisol II.
There was no difference in relative field capacity (RFC) among treatments or at different depths in Inceptisol I. Inceptisol II showed a treatment effect only at 0.25 m, where the highest RFC values were observed without covering (Figure 11).
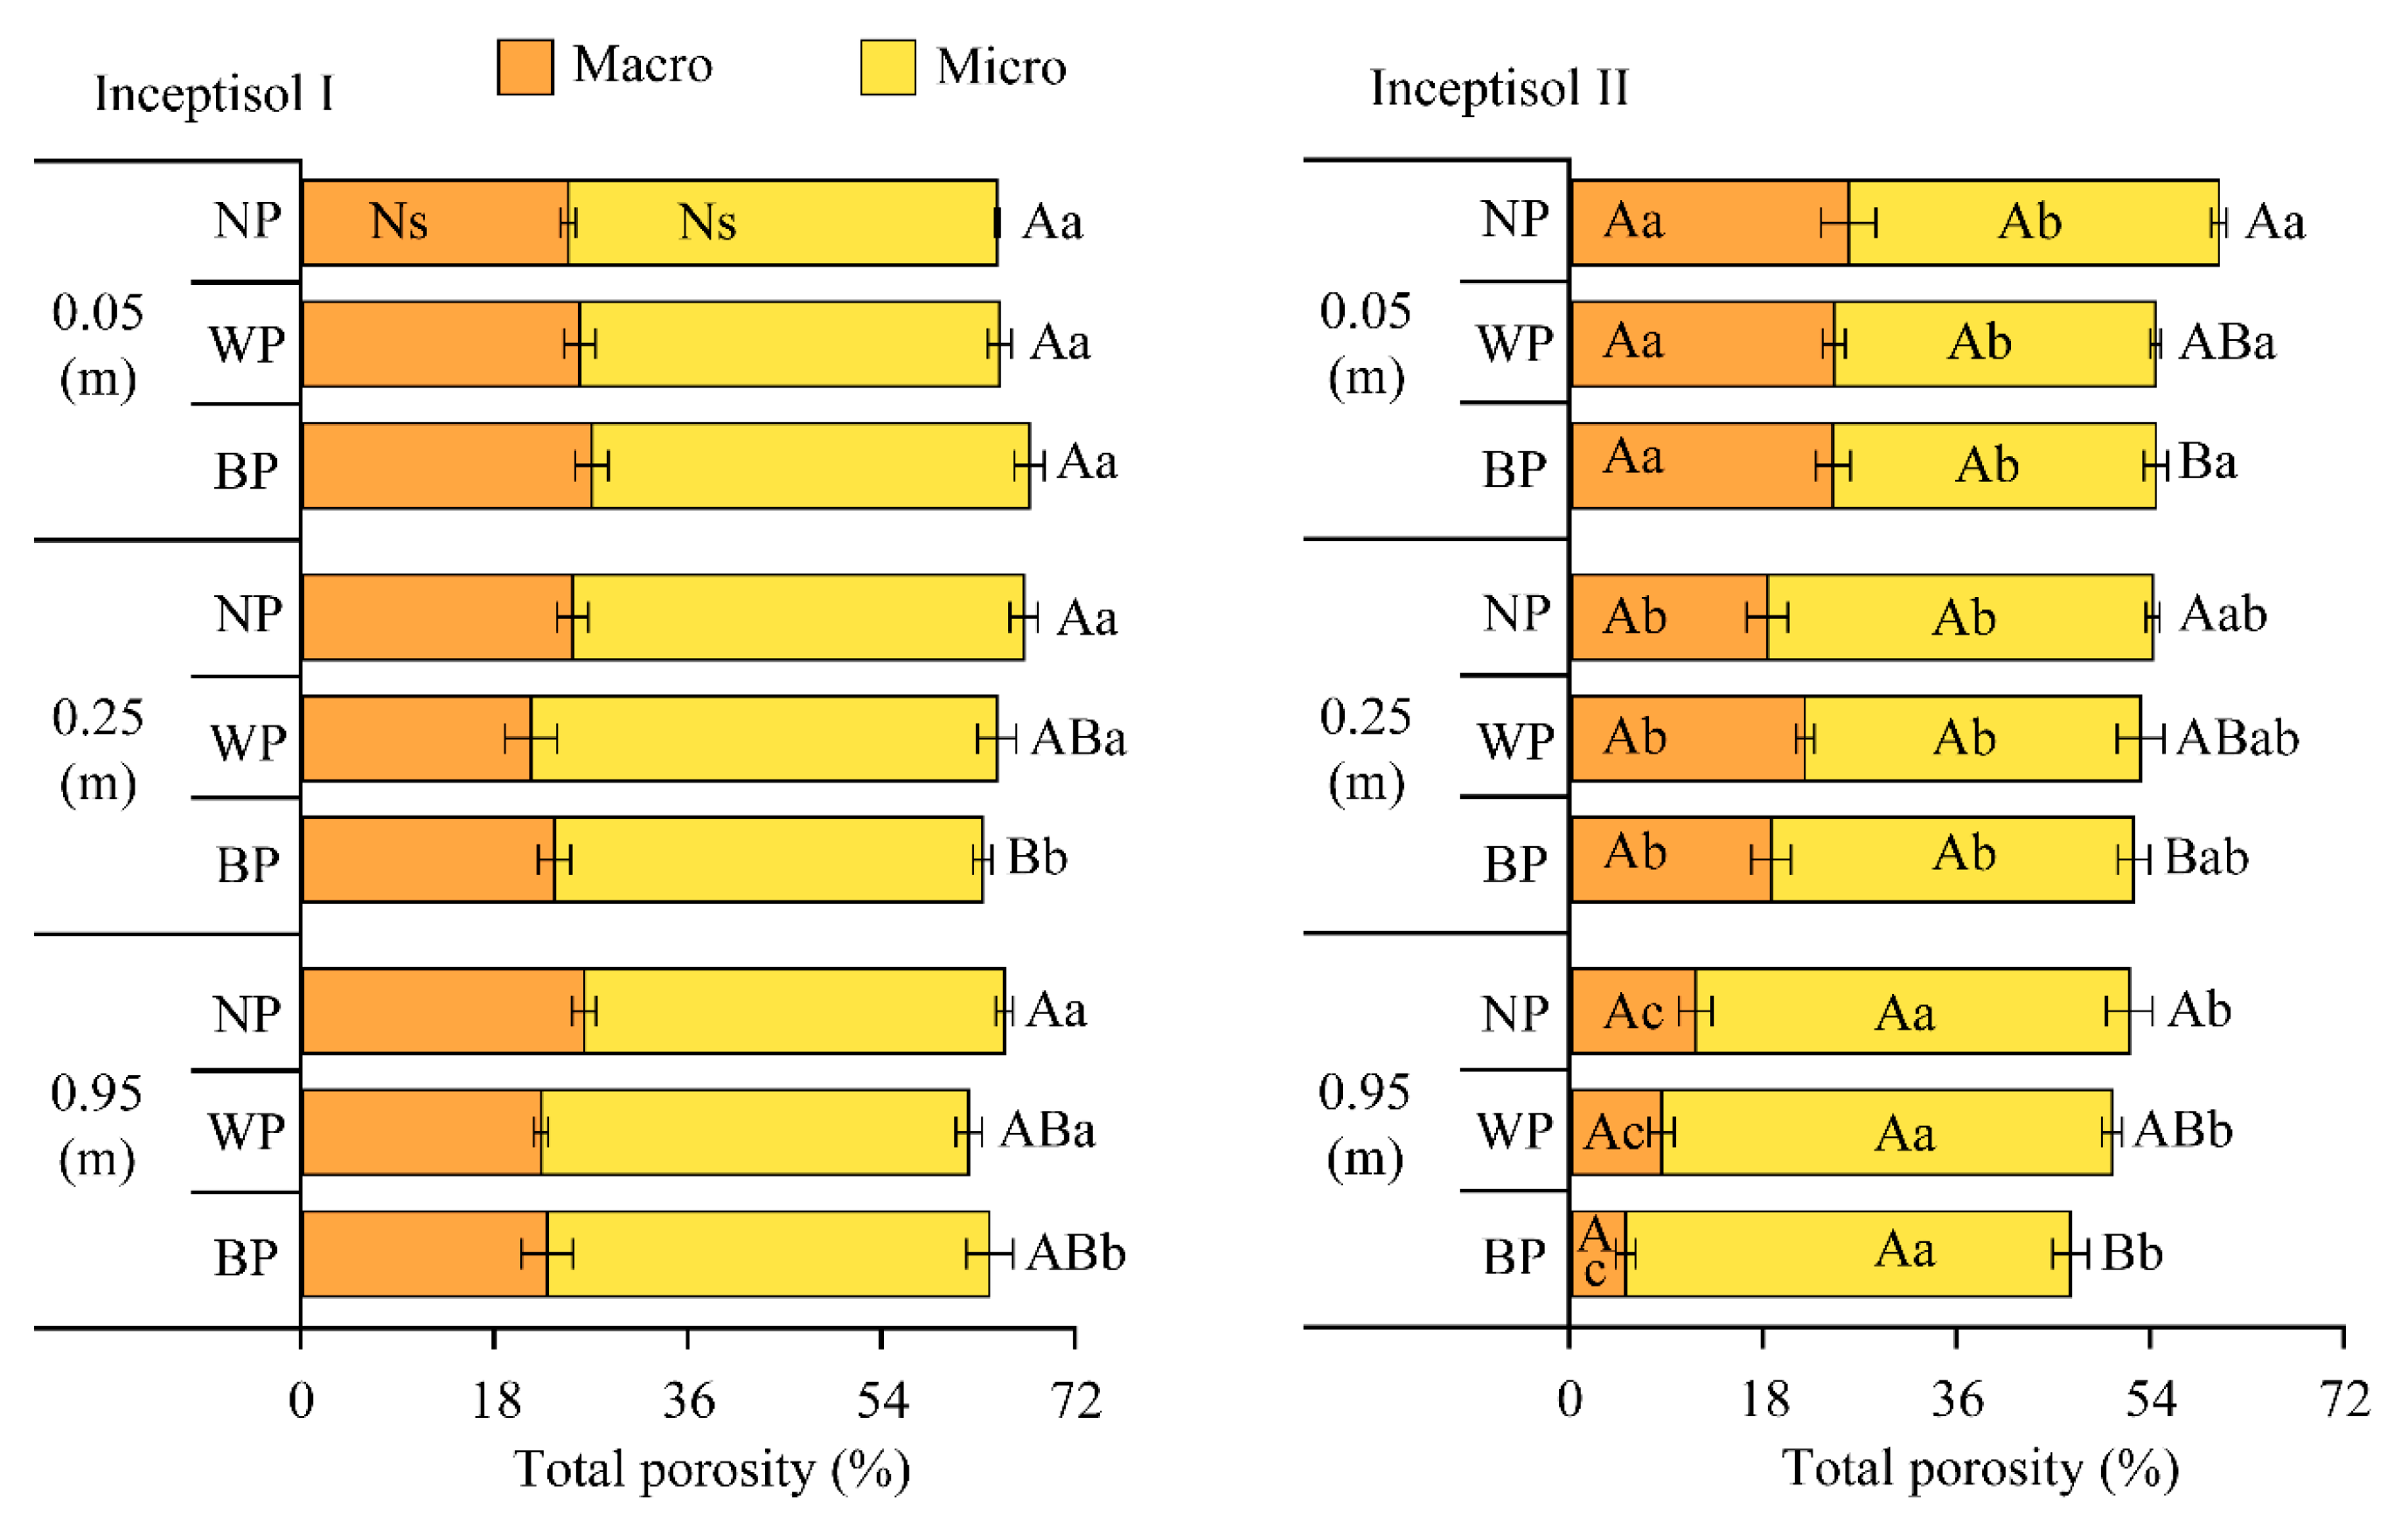
No significant differences were observed for micropores (Micro) and macropores (Macro) in Inceptisol I. The soil’s total porosity (TP) at 0.05 and 0.95 m was the least affected by mulching, regardless of plastic color. At 0.25 m layers, the BP showed lower TP. The TP of Inceptisol II was reduced in its entirety after plastic covering, highlighting the decrease in this variable with the use of the BP, regardless of soil depth. Macro was not influenced by plastic covering but by soil depth, decreasing in the following order: 0.05 > 0.25 > 0.95 m. Micropores exhibited the opposite behavior, being greater at 0.95 m (Figure 12).
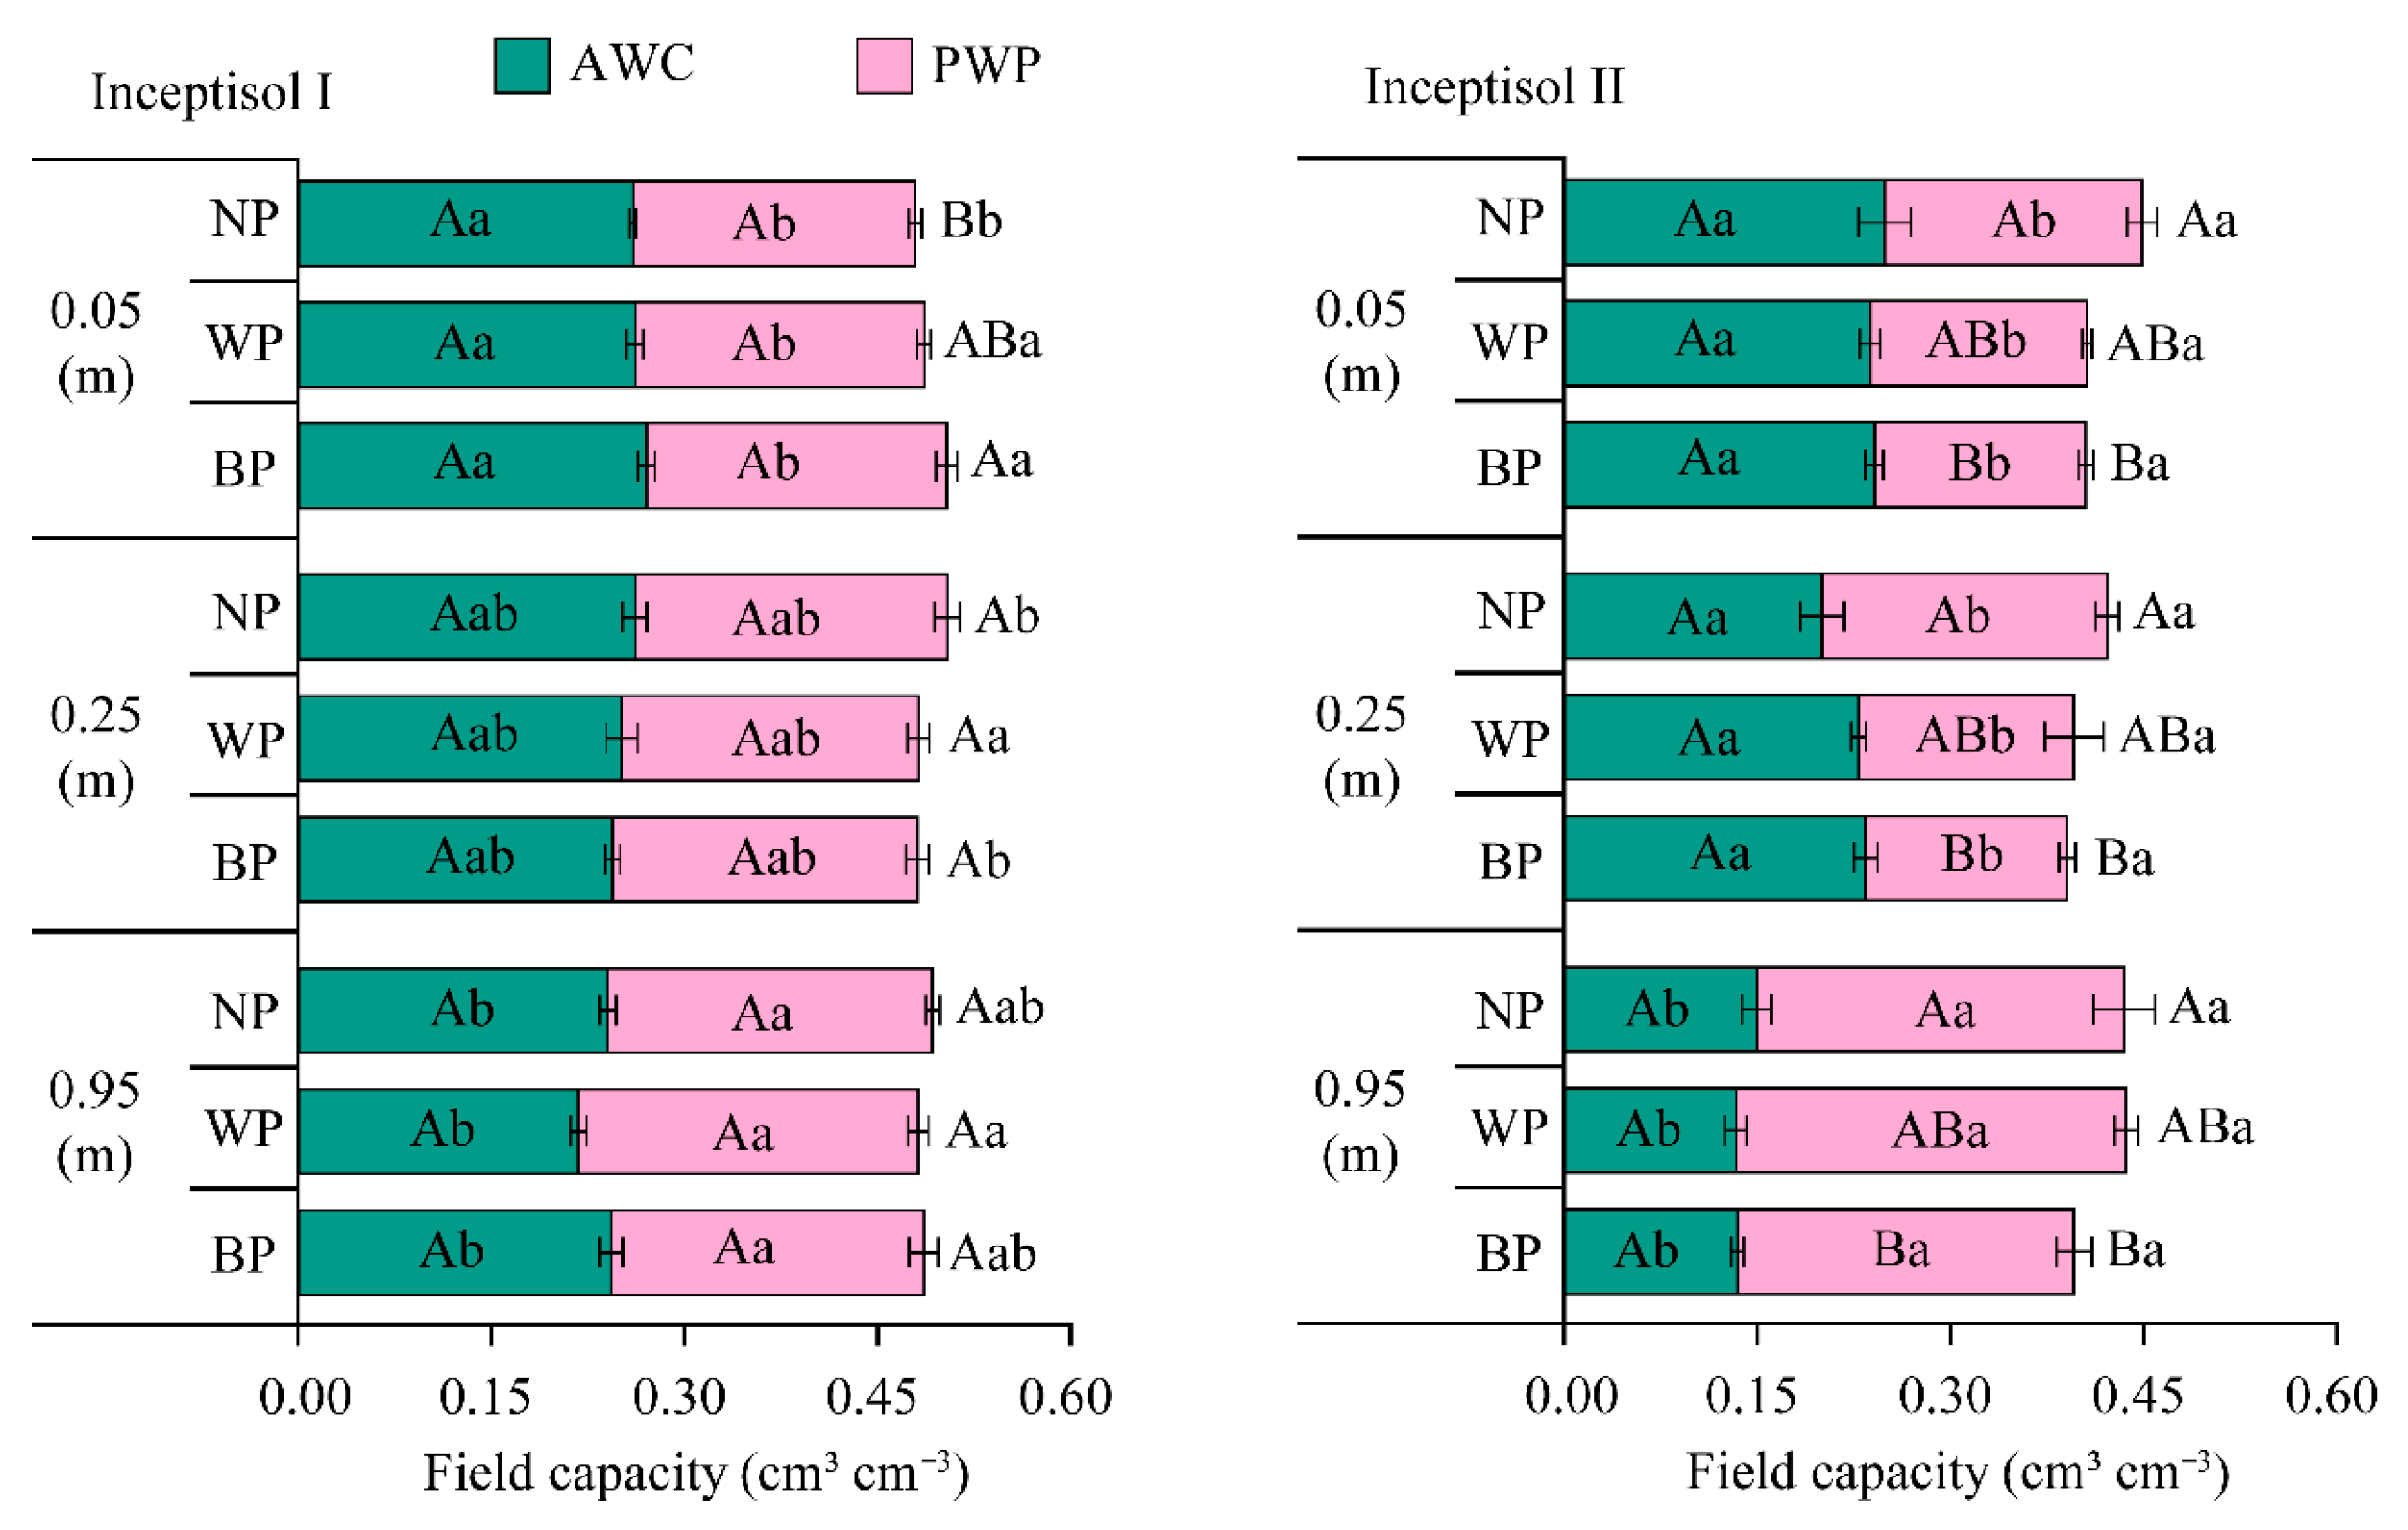
Figure 13 shows the field capacity data related to the available water capacity (AWC) and permanent wilting point (PWP). For Inceptisol I, it did not promote significant changes in the AWC and PWP between treatments within each depth. On the other hand, at a 0.95 m depth, the absence of plastic mulching in Inceptisol I resulted in a reduced AWC, and the use of plastic, regardless of color (WP and BP), increased this variable at the superficial depth (0.05–0.25 m). Inceptisol II did not show significant differences in the AWC between treatments at each depth. Controversially, the PWP was reduced in both WP and BP compared with NP within each depth. For the same soil, a depth of 0.95 m showed an increased AWC and a decreased PWP across treatments.

3.4. Physiological Parameters

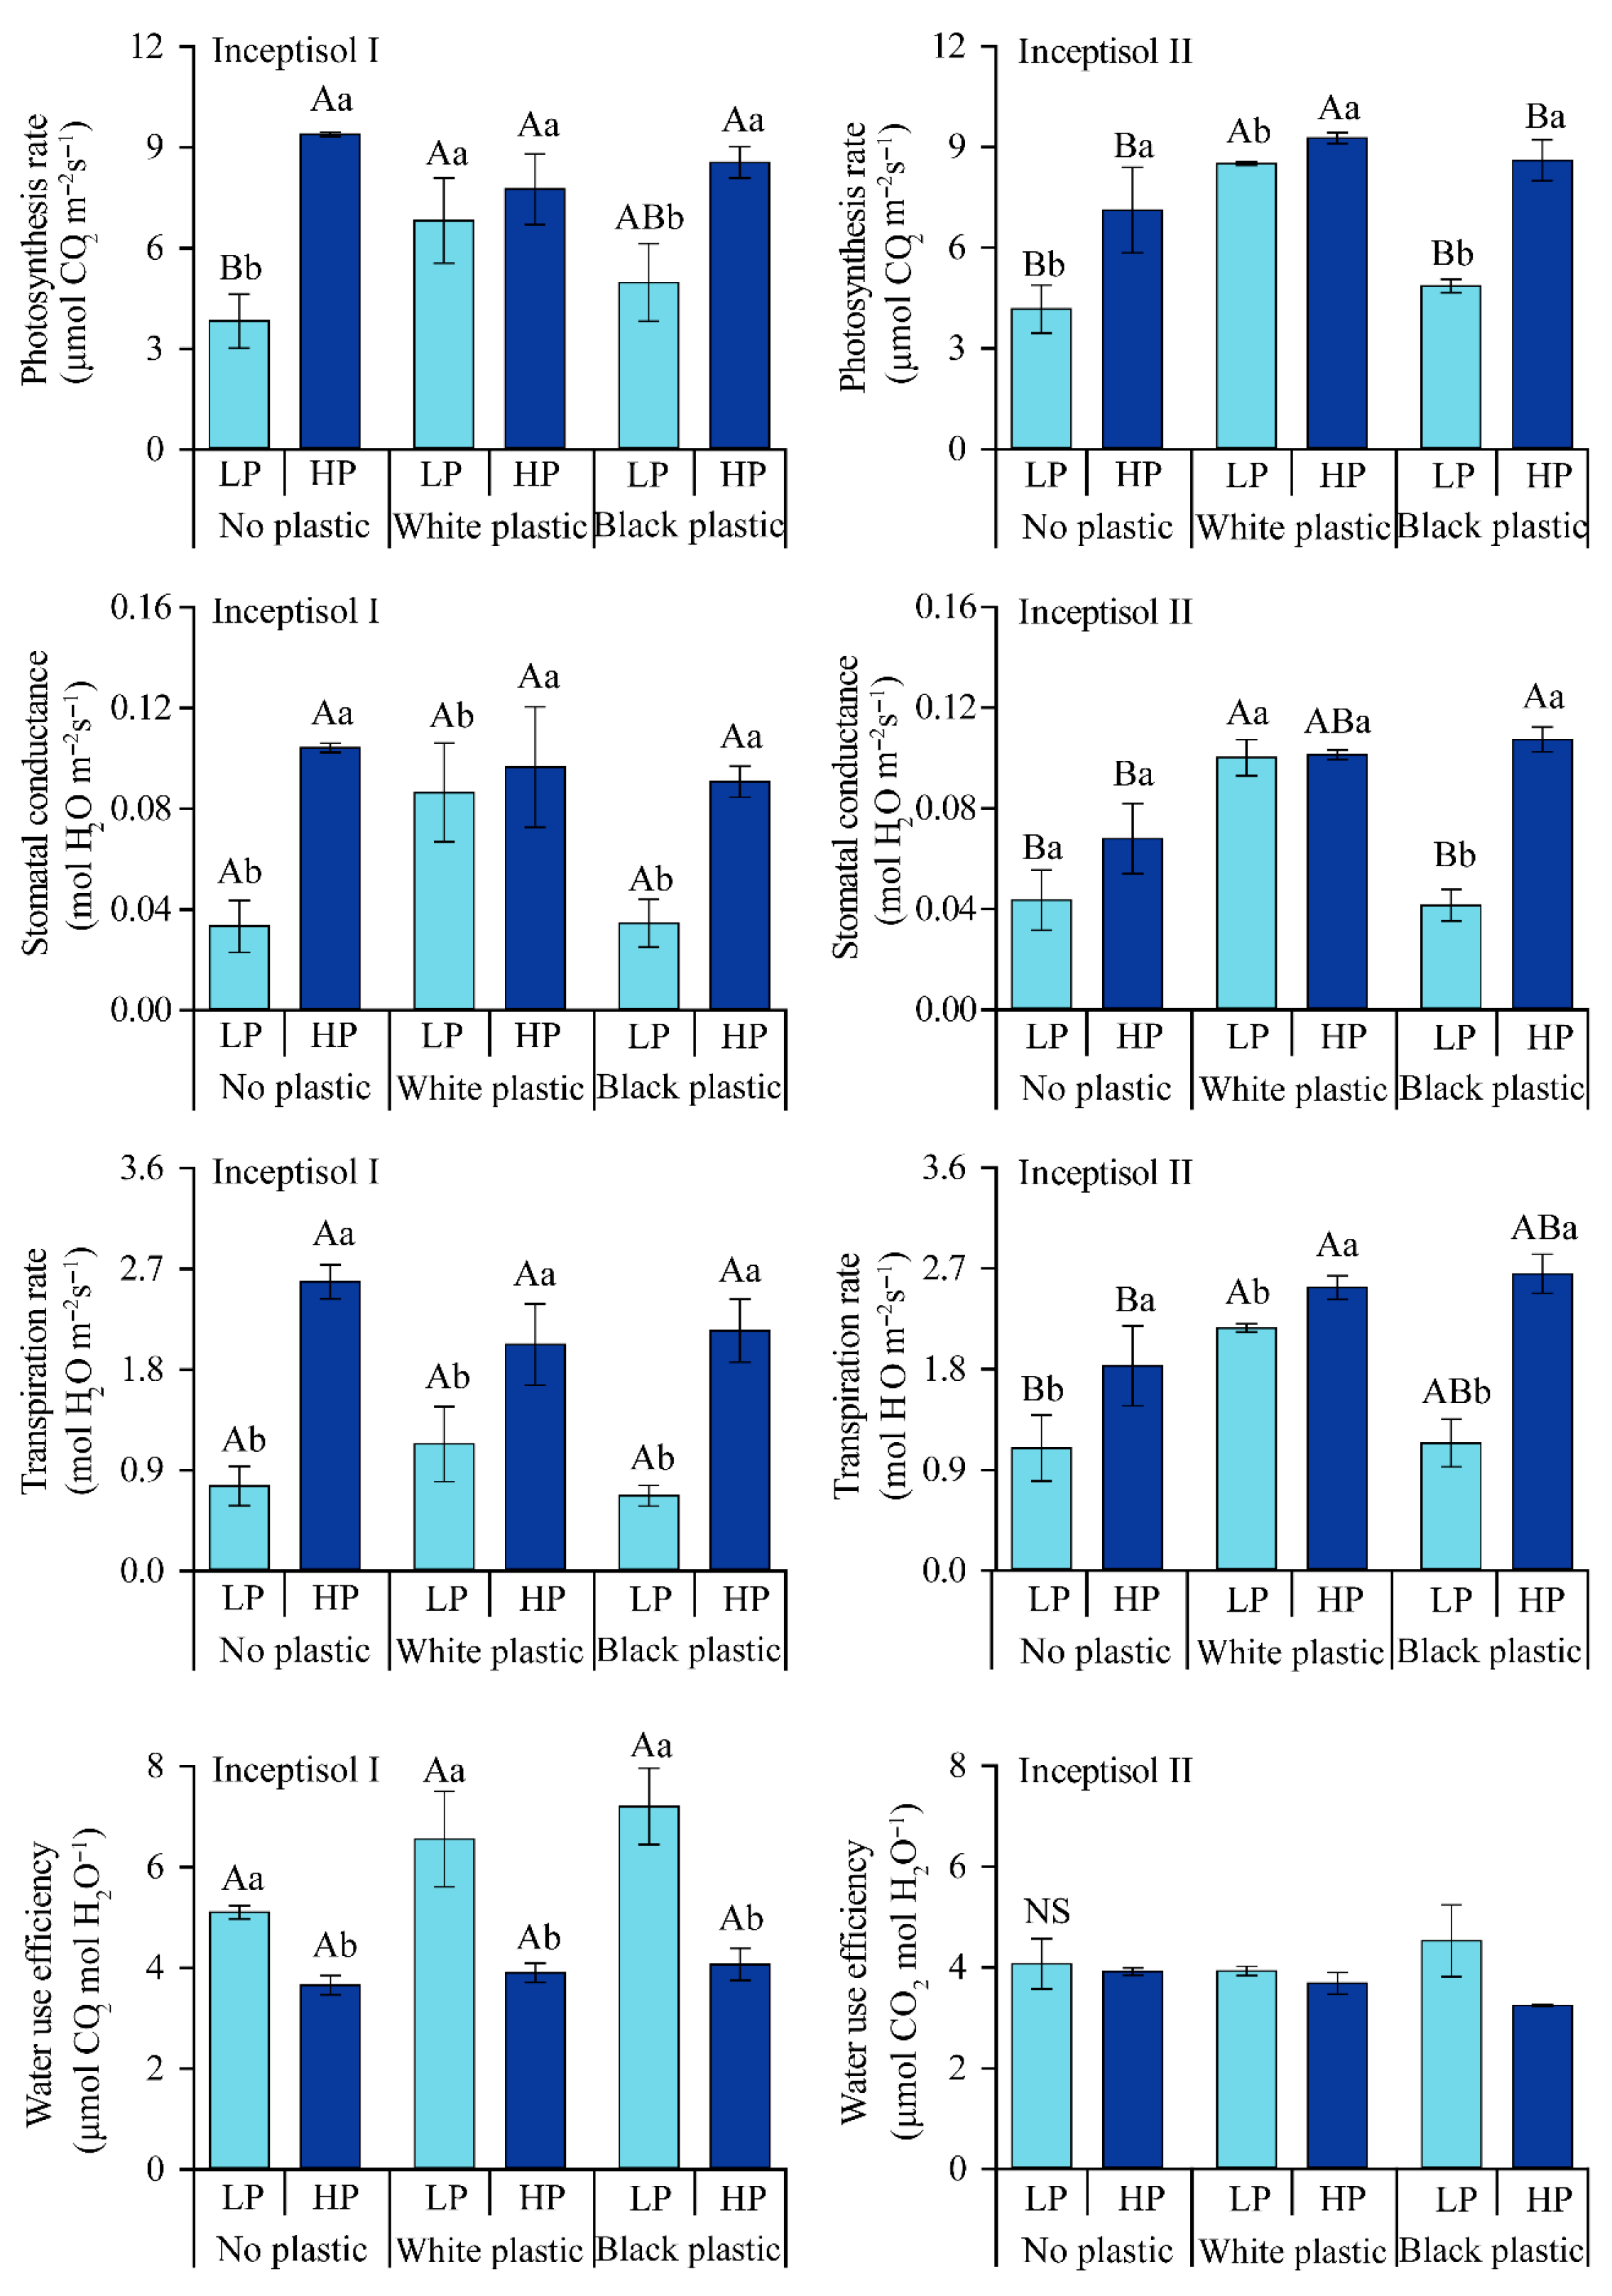
In high-precipitation (HP) conditions, the physiological endpoints evaluated (photosynthetic rate (PR), transpiration rate (TR), and stomatal conductance (SC)) did not differ significantly between treatments for Inceptisol I (Figure 14), as well as the efficiency of water use, which is obtained from the relationship between the variables PR and TR (A/E). However, the PR had significantly higher WP coverage under low-precipitation (LP) conditions than the NP. There were no significant differences from whether the plastic cover was used for the other physiological endpoints analyzed during the LP, SC, and TR periods, or in the efficiency of water use (Figure 14).
In LP and HP conditions, the photosynthetic rate was higher in the WP treatment in Inceptisol II (Figure 14). Stomatal conductance in the LP condition was higher in the WP treatment. In the HP condition, the BP treatment was higher than the NP treatment. However, it does not differ from the WP treatment (Figure 14). The transpiration rate in LP and HP was higher in WP compared with NP, but did not differ from BP.
The water use efficiency did not differ significantly between treatments in Inceptisol II. However, the WP was the treatment that showed greater improvements in the endpoints evaluated in Inceptisol II, as observed in the photosynthetic rate in Inceptisol I, regardless of rainfall. Physiological variables were generally higher under HP conditions across the soils and treatments tested (Figure 14).

3.5. Correlation Insights

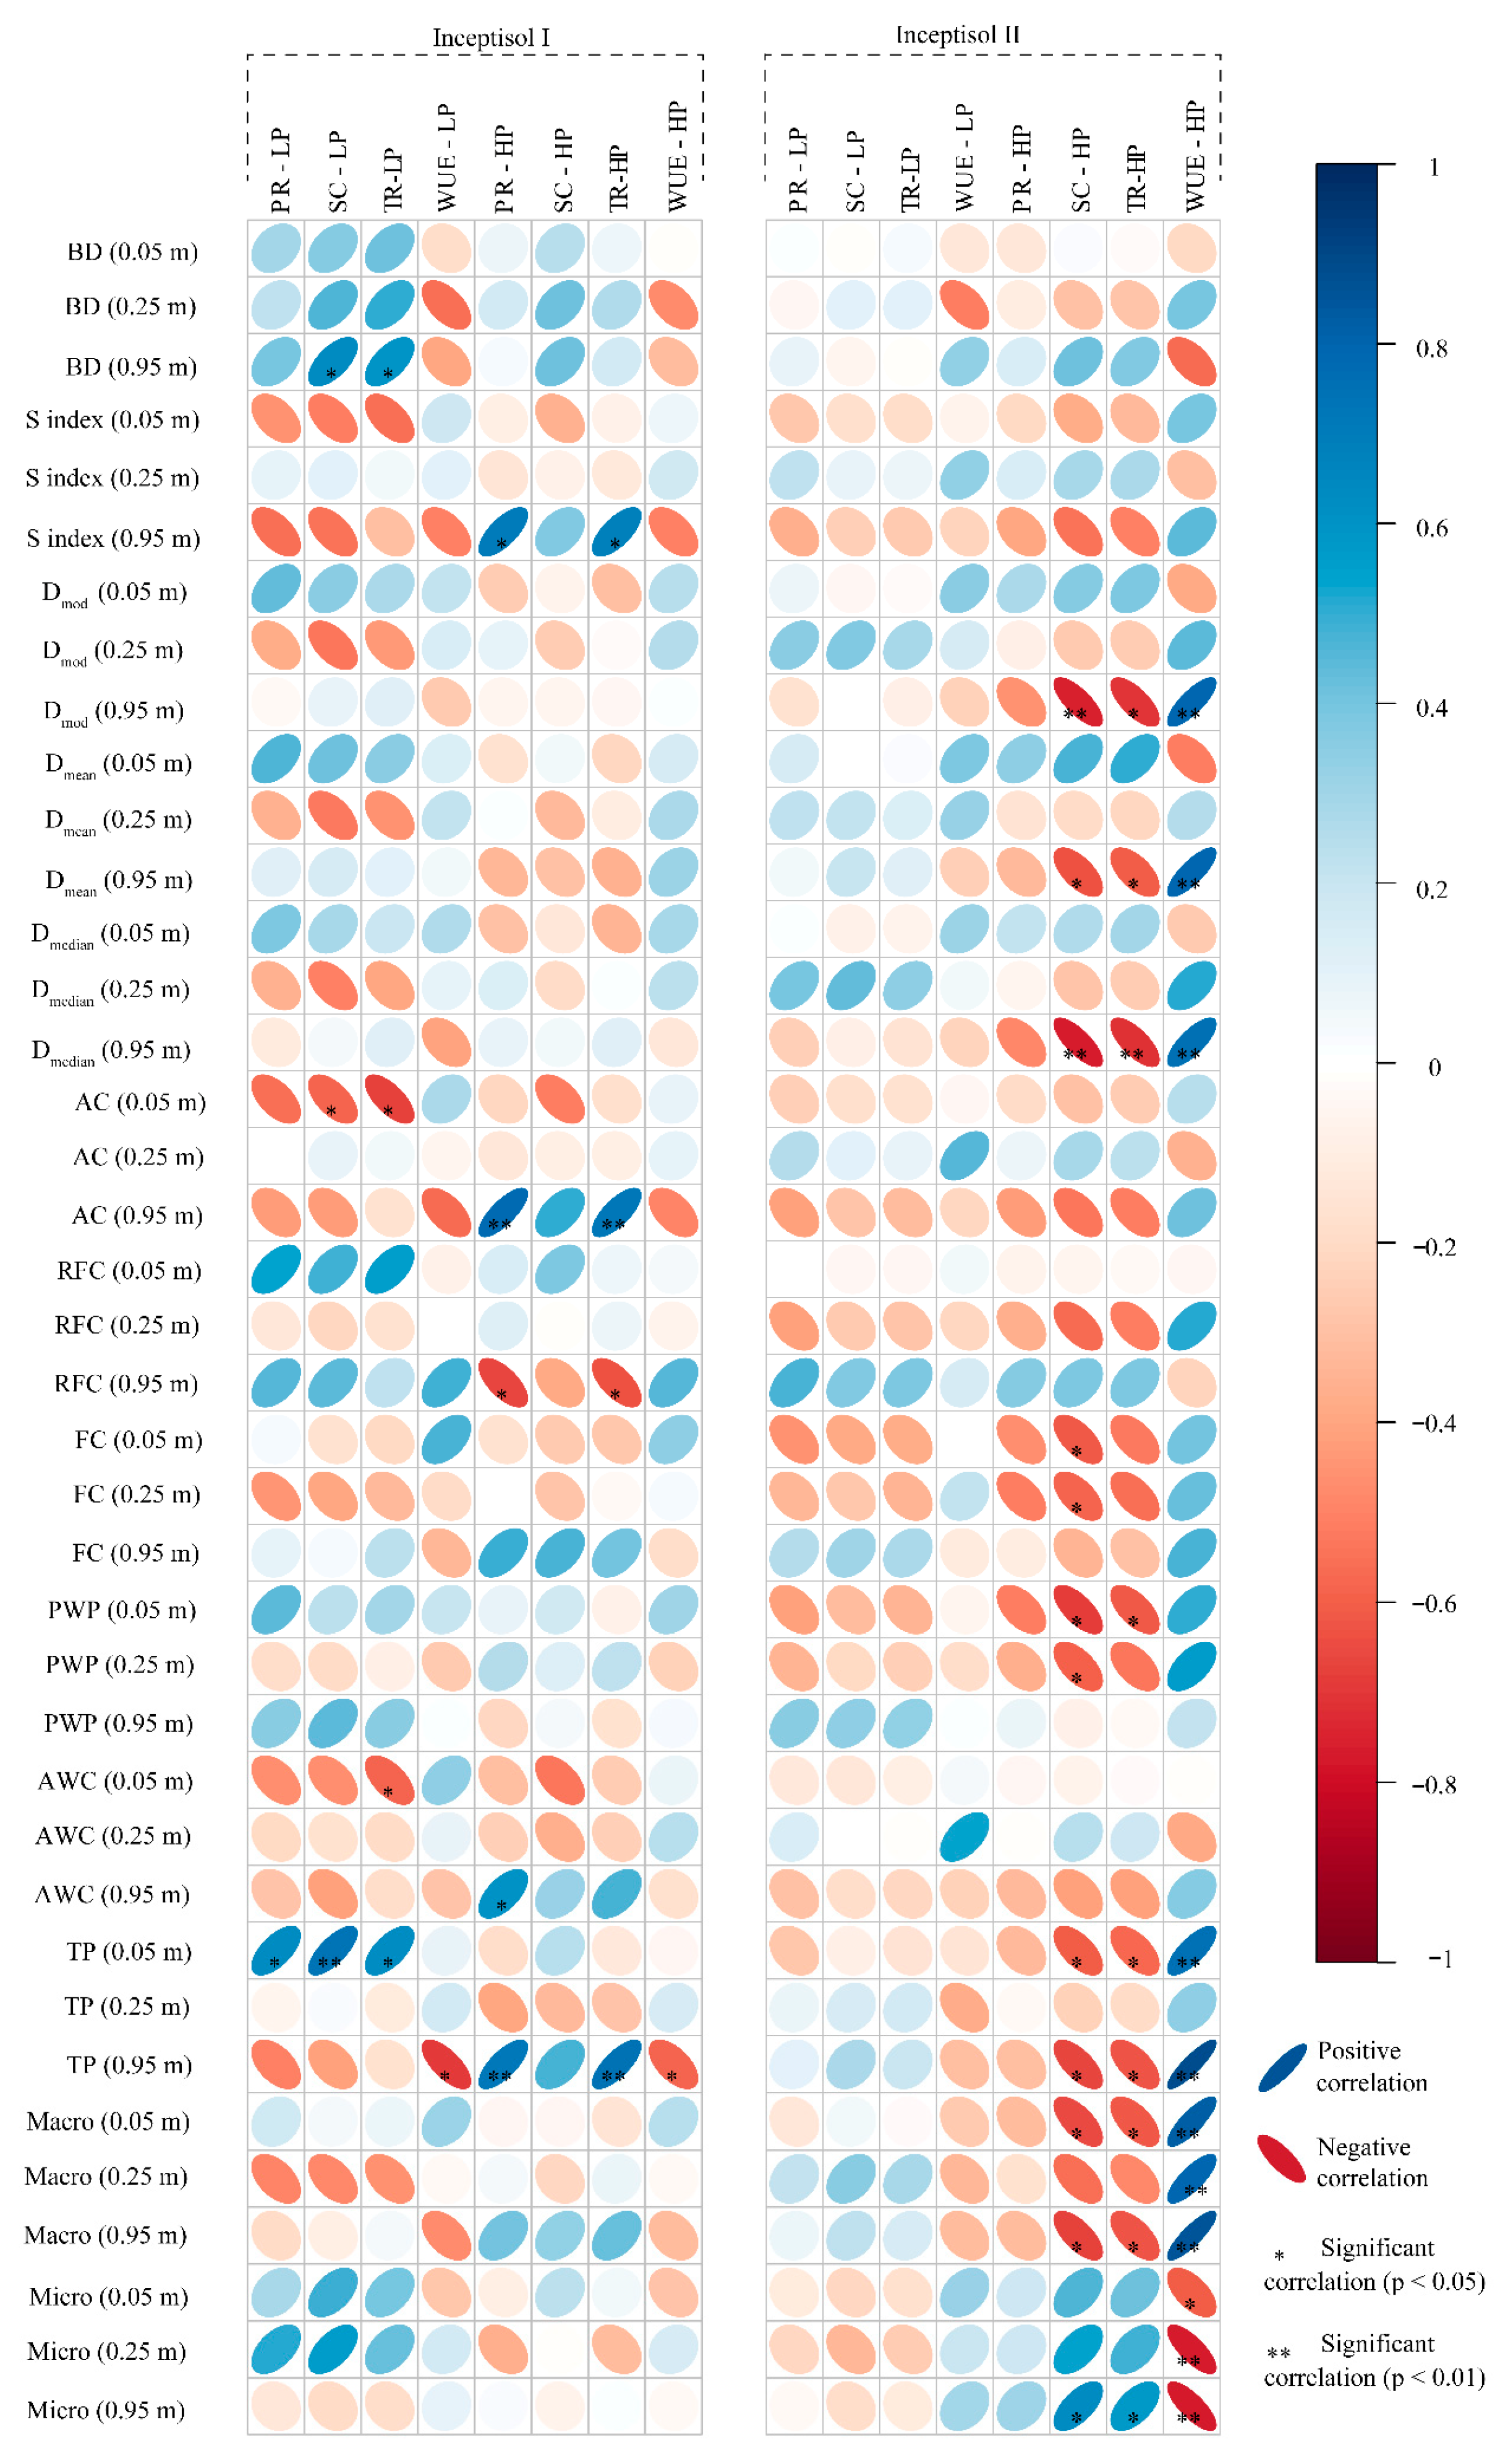
The significant correlations (Figure 15) regarding Inceptisol I show that the soil bulk density (BD) has a positive relationship with SC and TR for the low rainfall season at 0.95 m, that is, higher BD (within the observed values: 1 to 1.3 g cm−3) results in higher SC and TR values. Higher AC values in the surface layer significantly reduced SC and TR during dry periods, but not the PR. Regarding the surface, this results in a decrease in the total porosity (TP). The correlations were significant only for the wet season in Inceptisol II. There was an increase in the TR, with a greater proportion of macroporosity at the expense of microporosity (under the established experimental conditions), and a considerable rise in WUE across the entire profile.

4. Discussion

4.1. Rainfall Variability and Soil Water Balance

The unexpectedly high water precipitation in January 2012 and 2013 (Figure 3A and Figure 4A) contradicted the typical climatological pattern, as depicted in Figure 2. Precipitation at the beginning of these two years was about twice that of the same month in 2014 (Figure 2). During these periods, rainfall water can infiltrate deep layers of the soil profile, flowing to the water table or the drainage channel through subsurface runoff [64]. This condition explains why the water surplus is higher for January 2012 and 2013 than for 2014 (Figure 3B and Figure 4B).

4.2. Soil Water Deficit and Implications for Perennial Crop Development

The water deficit conditions observed in both Inceptisols from February to October, regardless of the years evaluated (Figure 3B and Figure 4B), are a worrisome condition for citrus development, as water availability is a prerequisite for terrestrial plant life, and water deficits frequently limit plant growth [65]. Carvalho et al. [66] studied coffee, a perennial crop like citrus. They reported that the plant’s water demand is often higher than its crop transpiration, leading to a water deficit. For this reason, as a water deficit is observed (Figure 3B and Figure 4B), water accumulated in the soil is required, demanding water replacement [67].

4.3. Available Water Capacity and Soil Physical Controls

Soil water storage is an efficient method for quantifying the plant’s available water [18,68,69]. Still, it depends on some variables, such as texture, organic matter content, and soil structure [14,15,70]. The Inceptisol I showed a higher AWC (117 mm) (Figure 3A) when compared to Inceptisol II (103 mm) (Figure 4A), which may be related to a higher concentration of silt and clay, to the detriment of sand-sized particles in the Inceptisol I composition (Table 2), in addition to its better structure in the soil profile than Inceptisol II, as confirmed by the Supplementary Data.
The water withdrawal from February to May and from September to October (Figure 3B and Figure 4B) is not expected for the region, so it is an atypical event, which was repeated from 2012 to 2014, justifying the use of agronomic techniques that offer alternatives to meet the perennial crop water demand, like soil covering as plastic mulch [23]. According to Gonçalves, [71], the underwater deficit can be said to retain water through the soil matrix force. Therefore, this water is maintained by adsorption, which is unfavorable to plant growth, mainly under Inceptisol [15]. Additionally, the increase in temperature and the decrease in precipitation (Figure 2) directly affect flowering and, therefore, the productivity of citrus crops [72]. The optimization of fruit production with the maximum use of available resources has gained force not only to increase productivity, but also for social reasons [3]. Thus, citrus producers must adopt good agricultural practices in compliance with labor and environmental legislation and sustainability standards [6,7]. In this scenario, the plastic cover is shown to be an advantageous alternative [23].

4.4. Effects of Plastic Mulching on Soil Physical and Hydric Properties

The inflection point is an alternative method for estimating the field capacity [14,15,73], indicating the optimal water content for satisfactory soil management and plant uptake [47]. The inflection point can be displaced to a point of greater stress in degraded soils due to the increase in microporosity [74]. For Inceptisol II, this situation is observed at depth (0.95 m) when the BP raises the Ψi to 12 kPa, which is much higher than that of the NP condition (3.29) (Table 3).
Corroborating with the data shown in Figure 5, Inceptisol I, under BP covering, was more effective in the superficial layer (0.05 m). This response is likely associated with changes in the surface soil structure and pore size distribution induced by reduced evaporation and rainfall impact, suggesting a temporary enhancement in water retention at low matric potentials (−4 kPa). At a 0.25 m depth, the reduced water retention observed in both soils, particularly under black plastic mulching, may be associated with changes in pore size distribution and enhanced drainage, likely driven by increased macropore continuity (Figure 9 and Figure 11), possibly due to the moisture redistribution under the plastic cover. Similar results were found in mulching studies [75,76,77,78,79]. Explicitly using the plastic cover promotes more significant moisture conservation on the soil surface [23,79,80,81]. In this way, protecting the surface layer helps conserve water and favors crop productivity, such as citrus [82]. According to Libardi, [83] more than 60% of the citrus root volume is found within the top 0.20 m of soil; therefore, improving water absorption efficiency by plants, especially in this soil layer, is beneficial. This condition confirmed the results of the present study because the presence of the plastic cover at 0.95 m (Figure 5) may indirectly improve soil conditions, potentially facilitating deeper root growth, as evidenced by greater root development (Figure 6).
The beneficial effect of water retention has been more pronounced in Inceptisol II (Figure 5) due to its soil intrinsic characteristics, such as the B incipient horizon. However, pedogenetic processes, such as clay translocation and mineral transformation, are still incipient and have not progressed sufficiently to form a well-developed B horizon with pronounced structural differentiation, color development, or clay accumulation [17]. It is emphasized that having greater water retention in the Inceptisol and greater efficiency in the water use by the plant are determining factors for better crop performance [15,16], especially in regions of hot and dry climates, with extended droughts [84], or with a critical dry period for the study region [55,85]. As reported by [86], irrigation is unavailable in this region, and evaporation exceeds the rainfall season during the year, which can be confirmed in Figure 3A and Figure 4A. According to INMET [55], the 2013/2014 rainy season showed irregular rainfall distribution, and a high rainfall deficit was observed in Minas Gerais. In this way, strong and prolonged dry spells were identified in January and February, and the water absorbed by the soil was lost through evaporation, leading to a water crisis mainly in the second half of 2014 (Figure 2).
Based on the analysis of the cultural profile (Supplementary Data), it is noteworthy that Inceptisol II had a clear stony structure at 0.95 m, which mainly reflects the general increase in BD in all treatments studied (Figure 7). A general decrease in soil BD after the plastic mulching application, as shown in Figure 7, has been reported by many studies due to better conditions maintained under the mulched plots that avoided soil crusting and compactness [35,87]. Van der Meulen et al. [88] classified soils as being loose, friable, and well-aerated, and also roots have easy access to adequate oxygen, promoting high microbial activity in plastic mulch systems [89].
However, a lack of effect on the soil bulk density was also reported, and a mitigating impact of plastic mulching on soil compaction, in that case, was observed based on other variables such as the soil penetration resistance, especially on surface layers [24]. On the other hand, Sintim et al. [24] found that plastic mulching had no significant effects on the BD of two types of soil with wheat and clover crops in the USA within the four years assessed (from 2015 to 2018).
As proposed by Dexter [48], the S index is an indicator of soil quality and estimates the soil microstructure responsible for many essential physical properties. According to the limits set by Andrade and Stone [90], both soils have a good structural quality with S index values above 0.045 (Figure 8). However, when comparing the treatments studied with the NP, the plastic cover did not promote significant changes in soil quality for any soil, as assessed by the S index, even though it is considered a soil conditioner [91], which was not expected [75]. Vasques et al. [92] stated that the S index should not be considered alone to distinguish the effects of soil management, but together with other indicators such as soil bulk density, porosity, and visual assessment of the soil profile, as can also be inferred from the soil profile data from this present study. On the other hand, the lower values of the S index for Inceptisol II were attributed to 0.95 m (Figure 8), where the physical restriction due to stoniness conditions becomes quite evident for this same soil (Supplementary Data).
The different effects of plastic mulching across the two soils reflect the greater homogeneity of Inceptisol I (Supplementary Data) in pore size distribution throughout the profile, with its structural stability less affected by management (Figure 9). The opposite is observed for Inceptisol II, mainly at a depth of 0.25 m. This condition can also be associated with root development (>root number) in these depths for the same soil, as shown in Figure 6. It implies a decrease in the pore volume with a large diameter (>200 µm) (aeration function) for those with a smaller diameter (water retention function), with the most prominent variations observed when using the BP (Figure 9).
The remarkable effectiveness of black plastic in altering soil physical properties remains poorly studied. Still, the significant efficacy of black plastic material has already been demonstrated for yield, vegetative growth, and water use efficiency (WUE) due to its ability to alter the soil hydrothermal regime [93,94]. The pore space was reduced by 15% at 0.15 m by using transparent plastic mulch during two harvests (Vigna mungo and Arachis hypogaea) in Tamil Nadu, with a tropical climate in a red sandy loam soil [87]. The authors also reported reduced soil bulk density and increased hydraulic conductivity, and both soil properties contributed to higher yields and the highest net returns for these crops. Confirming this condition, Silva et al. [16] stated that the compaction caused by soil preparation equipment beyond the soil’s friability zone increased the soil density, which led to a decrease in the hydraulic conductivity of the Inceptisol.
The parameters proposed by Reynolds et al. [50], i.e., Dmod, Dmean, and Dmedian, were also extracted from the displacement of the standard pore distribution curves of both Inceptisols (Figure 10). This data corroborates Figure 9 concerning the most homogeneous Inceptisol I soil profile. Both pore size parameters are larger (>microns) in Inceptisol II, corroborating the soil profile description in the Supplementary Data, and have a higher sand content than Inceptisol I (Table 2), with a considerable and visible stone content (>0.02 m), also confirmed by the Supplementary Data. Dmod is related to the most frequent-diameter pores, complementing the information already extracted from Figure 10. The BP cover decreased Dmean, which is consistent with previously analyzed higher bulk density (Figure 7). This fact is associated with the leptokurtic kurtosis of the pore distribution, as shown in Figure 9 and Figure 10, indicating a greater probability of obtaining values closer to the median or mode than to the mean [6,50].
There is a greater AC and plant water availability pattern at surface layers (Figure 11, Figure 12 and Figure 13). The physical barrier of a plastic cover could mitigate erosion and the impact of rain droplets on the soil [10], thereby affecting the aggregate stability and air capacity, corroborating the results from Figure 11. Sintim et al. [24] observed this positive effect of plastic mulching. Still, significant differences between the two studies can be highlighted: experiment duration, since our research lasted half the time, and climate, since the latter was conducted in a humid subtropical and cool Mediterranean climate.
According to Reynolds et al. [50], the reference value for AC is >0.10 m3 m−3, and both Inceptisols presented within this limit with or without any plastic cover in all the surface layers (Figure 11). The AC in Inceptisol II is outside the optimum range at 0.95 m due to its inherent blocky structure. Reynolds et al. [50] also proposed an optimum range for AWC: 0.20 m3 m−3, and, as with AC, Inceptisol I had values above this threshold, but Inceptisol II is below it at 0.95 m (Figure 11). Again, the blocky structure of Inceptisol II can be responsible for this fact (Supplementary Data). Some authors have already described the RFC results (Figure 11) since using a plastic cover in the field can decrease rainwater capture and its use by plants [36].
Regarding the results shown in Figure 12, soil physical attributes, particularly macro- and microporosity, exhibited high sensitivity within Inceptisol II. This response may be attributed to the soil structure of Inceptisol II, which presents stony blocks in the subsurface, as previously described. These results are consistent with AC (Figure 11) and AWC (Figure 13) values being outside the optimal range, indicating that plastic mulching management was insufficient to improve the soil physical quality in Inceptisol II at deeper layers.

4.5. Soil–Plant Interactions and Physiological Responses of Citrus

The data relating to Figure 14 corroborate those of Liao et al. [95], who found an increase in the PR in growing apple trees under varied mulching conditions compared with cultivation without covering. Hou et al. [96] attributed the increase in the net photosynthetic rate in plastic-soil mulching treatment to optimizing the C/N, C/P, and N/P nutritional ratios in wheat leaves. For maize, Niu et al. [97] found an increase in the PR associated with a higher stomatal density and larger ostiole opening size. Li et al. [98] tested different mulches (no mulch, transparent film mulch, biodegradable transparent film mulch, and biodegradable black film mulch). They indicated that biodegradable black film mulching was the best treatment for increasing the photosynthetic capacity and productivity of the corn crop. Yamamoto and Miyamoto [99], when studying fruit crops (cherry and pear trees) in the integrated field and greenhouse experiments, verified an increase in the photosynthetic rate of 2.1 µmol CO2 m−2 s−1 for cherry trees and 3.2 µmol CO2 m−2 s−1 for pear trees in reflective sheet mulching conditions. Although the water use efficiency was not altered by the treatments tested in HP or LP, the suggestion of using WP coverage for Inceptisol I proved interesting, as agricultural productivity is directly associated with the higher photosynthetic rate achieved with this treatment (Figure 14) [100].
Concerning the data related to the photosynthetic and transpiration rates (Figure 14), Niu et al. [97] reported an increase in the PR when using plastic film mulching compared to no mulching in the booting and grain filling stages. According to the authors, this may have occurred because of the high photosynthetic capacity required during these phases, suggesting the need to increase transpiration to enhance nutrient absorption.
Although the process of stomatal conductance regulates both the entry of external carbon into the plant, which will be diffused into the interior of the plant until it is assimilated by the Calvin cycle and the amount of water vapor eliminated by the plant, which is called transpiration, it is known that in the same stomatal opening, the CO2 input is much greater than the water vapor output. Thus, the greater CO2 input at a given stomatal conductance may intensify photosynthesis by increasing CO2 assimilation in the biochemical phase, thereby increasing the net photosynthetic rate, but not always promoting a proportional increase in transpiration. On the other hand, regarding water use efficiency (Figure 14), the WP was the most indicated for better performance, suggesting a possible increase in productivity.
According to Brito et al. [101] and Fernandes et al. [102], in a condition of greater water availability, when an anoxic condition is not present, plant performance tends to be high or maintained. The fact that in the WP cover, the PR was maintained both in low and high precipitation (with no significant difference for the rainfall regimes) (Figure 14) demonstrates that the plastic cover can be indicated to maintain the photosynthetic rate regardless of water availability, so that the productivity of the citrus crop is not affected in a situation of water scarcity, in the different types of soils studied here. However, the ratio of the parameters PR and TR, which allows for the inference of the water use efficiency, was higher in all treatments installed in Inceptisol I under an LP condition. This situation indicates that in a condition of lower water availability, the water use efficiency of plants is adjusted, tending to an increase, so that their water-dependent functions are maintained, even with a lower availability of water in the soil [103].
The correlations presented by BD with SC and TR for the low rainfall season at 0.95 m (positive) and AC with SC and TR at 0.05 m (negative) indicate plant mechanisms to reduce water losses under water deficit conditions [103,104], corroborating the data in Figure 14. Under more humid conditions, higher AC values at a 0.95 m depth promote increases in the PR and TR. Good physical conditions favor root system development (Figure 6) and increase photosynthesis and transpiration rates (Figure 14). Due to the precipitation deficit, a reduced surface AWC (0.05 m) tends to limit actual transpiration through stomatal regulation under water stress. During the wet season, greater water availability at depth (0.95 m) may enhance root water uptake, allowing for a higher PR when absorption roots access deeper soil moisture.
A decrease in the surface total porosity (TP) significantly reduces the PR, SC, and TR, as the plant can have difficulty absorbing water in dry soil with reduced porosity. This relationship is significant only at depth (0.95 m) for wetter conditions. These soils, with oxic horizons, have good water infiltration and percolation through the profile. When associated with good root development at depth (Figure 6 and Supplementary Data), these factors favor the use of plants’ resources to increase the PR. However, this same configuration of pores with a high TP for the oxic horizon in Inceptisol I at depth (0.95 m) can lead to a decrease in the efficient use of water (WUE) by the plant, once the water balance may favor drainage rather than absorption by the roots [105,106].
In the surface layers (0.05–0.25 m), the increase in larger-diameter pores can reduce the SC and TR (Figure 15) as a plant mechanism to alleviate the water deficit. This mechanism will also be activated if, in subsoil conditions (0.95 m), the pore diameter (Dmod, Dmean, and Dmedian) is increased, considering that these values are already considered macropores (>73 µm) [9,52].
With increasing microporosity, meaning pores that retain water in the soil matrix with greater tension, the SC and TR rates tend to increase significantly at 0.95 m (Figure 15). However, the excess of micropores that retain water at very high tensions (PWP), characterizing the water deficit, can significantly impair plant development [14,15] by reducing the SC and TR (Figure 15), as observed at the surface (0.05 to 0.25 m). Regarding Figure 13, the reduction in the PWP observed under both plastic mulching treatments, regardless of color, may be associated with improved soil physical conditions resulting from a more favorable pore-size distribution (Figure 9 and Figure 15), which reduces the proportion of water retained at high matric potentials (Table 3 and Figure 5). These results suggest that soil protection provided by plastic mulching minimizes water retention in small pores compared with the no-cover treatment (no plastic).

4.6. Agronomic Implications of Plastic Mulching Under Water-Limited Conditions

In general, our data show that the use of plastic cover under citrus crops for Inceptisol I (deeper) and Inceptisol II (shallow) promoted changes in the physical-hydric attributes, with a greater influence in the surface layer (0.00–0.25 m). Concerning the evaluated period (2012–2014), characterized by a water deficit driven by persistent dry spells, the management based on white plastic had the best response for the photosynthetic rate, regardless of the soil studied. The superior photosynthetic performance under white plastic mulching may be attributed to its higher reflectance, a well-established property of light-colored materials, which reduces excessive soil and canopy heating and promotes a more favorable microclimate for physiological processes by maintaining more stable soil temperature and moisture conditions. The white mulching treatment was suggested to alleviate thermal and water stress, thereby enhancing photosynthetic activity. Our results corroborate those presented in studies using soil management with plastic cover for crops such as watermelon [107], tomato [108], potato [109], sweet pepper [110], onion [111], vine [112], melon [113], conventional peanut [114], maize [81], wheat [115], and more recently also for perennial fruit crops [23], such as citrus [116].
In this way, the practice of using plastic covers proved to be beneficial, as the loss of water via evaporation is generally lower when using the cover, improving water use and its conservation in the agricultural scenario [117], reflected in better fruit plant growth [23].

5. Conclusions

The use of plastic mulching on the soil surface in regions characterized by recurrent drought and water deficits proved effective in reducing physiological stress in citrus plants and improving soil physical quality indicators. Inceptisol II showed evident changes in physical-hydric attributes, particularly in the surface layer (0.00–0.25 m), where a lower soil bulk density, improved structural quality, and reduced micropore volume were observed. White plastic mulching promoted higher photosynthetic rates under both high- and low-precipitation conditions. This same plastic cover was associated with inefficient water use and showed a positive and significant correlation with macropores and micropores at all depths evaluated in Inceptisol II. Inceptisol I, due to its greater structural stability, did not show substantial impacts related to the use of plastic mulching, except for the physical attributes of soil bulk density and total porosity. Black plastic mulching produced the best results, with reductions in soil bulk density and increases in total porosity, both of which showed positive, significant correlations with the transpiration rate. However, it should be emphasized that adopting plastic mulch requires consideration of agronomic and environmental limitations, such as reduced rainwater infiltration and difficulties with fertilizer application, which require careful management practices. In addition, the accumulation of plastic residues represents an environmental concern, highlighting the importance of appropriate disposal strategies and the use of alternative materials, such as biodegradable mulches. Overall, the results indicate strong potential for the use of plastic mulching in citrus cultivation, encouraging further research focused on the operational and environmental limitations associated with soil physical quality indices and their relationships with different physiological variables, particularly in long-term studies and in areas with frequent water scarcity or economic constraints on irrigation systems across different soil types.

Supplementary Materials

The following supporting information can be downloaded at: https://www.mdpi.com/article/10.3390/agronomy16010083/s1.

Author Contributions

Conceptualization, P.A.N.B., S.M.B., B.M.S., G.C.d.O., E.A.F., C.d.O. and E.G.d.M.; methodology, P.A.N.B., S.M.B., B.M.S., C.d.O., I.C.F.V. and E.G.d.M.; software, P.A.N.B. and E.G.d.M.; validation, P.A.N.B. and E.G.d.M.; formal analysis, P.A.N.B. and E.G.d.M.; investigation, P.A.N.B., S.M.B., B.M.S., G.C.d.O., E.A.F., C.d.O. and I.C.F.V.; resources, B.M.S., G.C.d.O. and E.A.F.; data curation P.A.N.B. and S.M.B.; writing—original draft preparation, P.A.N.B., S.M.B., B.M.S. and G.C.d.O.; writing—review and editing, P.A.N.B., S.M.B., B.M.S. and I.C.F.V.; visualization, P.A.N.B., S.M.B. and E.G.d.M.; supervision, B.M.S., G.C.d.O. and E.A.F.; project administration, G.C.d.O. and E.A.F.; funding acquisition, G.C.d.O. and E.A.F. All authors have read and agreed to the published version of the manuscript.

Funding

This research was funded by the Agricultural Research Company of Minas Gerais—EPAMIG unit in the South of Minas Gerais (Southern Regional Unit of Minas Gerais—URESM) (Grant Code-001). The funder was not involved in the study design, collection, analysis, interpretation of data, the writing of this article, or the decision to submit it for publication.

Data Availability Statement

The data supporting this study’s findings are available on request from the corresponding author.

Acknowledgments

The authors thank Dulce Claret Monteiro Moraes, Doroteo de Abreu, and José Roberto Fernandes for their technical support and Erika Andressa da Silva and Vinícius Moribe Pereira for their field assistance. To the Agricultural Research Company of Minas Gerais (EPAMIG) for donating the experimental area and their interest in soil physics research. We are also grateful to CNPq, CAPES, and FAPEMIG from Brazil for their financial support for the research project and scholarships. Thank the Federal University of Lavras (UFLA) and the Postgraduate Program in Soil Science (PPGCS) for their support.

Conflicts of Interest

The author, Ester Alice Ferreira, was employed by the Agricultural Research Company of Minas Gerais. The remaining authors declare that the research was conducted in the absence of any commercial or financial relationships that could be construed as potential conflicts of interest.

References

  1. Tang, Y.; Lou, W.; Yan, X.; Li, S.; Wang, P.; Zhou, Y.; Zhan, T.; Zhang, S.; Hu, C.; Wang, X.; et al. The Pivotal Role of Secondary Nutrients and Micronutrients in Regulating Fruit Quality and Root Exudates Metabolism Profile of Citrus. Plant Soil 2024, 500, 461–479. [Google Scholar] [CrossRef]
  2. FAO Citrus Fruit Statistical Compendium 2020. Available online: https://www.fao.org/markets-and-trade/commodities-overview/food-and-agriculture-market-analysis-(FAMA)/citrus/2/en (accessed on 1 October 2025).
  3. Fundecitrus Reestimativa da Safra de Laranja 2022/23 do Cinturão Citrícola de São Paulo e Triângulo/Sudoeste Mineiro–Cenário em Dezembro/2022 [Re-estimation of the 2022/23. Orange Crop in the Citrus Belt of São Paulo and Triângulo/Southwest of Minas Gerais–April 2023 Closure]. Available online: https://www.noticiasagricolas.com.br/noticias/laranja-citrus/340959-fundecitrus-divulga-a-terceira-reestimativa-da-safra-2022-23-do-cinturao-citricola-de-sp-e-mg-projetada-em-316-23-milhoes-de-caixas.html (accessed on 29 November 2025).
  4. Hoang, B.X.; Shaw, G.; Fang, W.; Han, B. Possible Application of High-Dose Vitamin C in the Prevention and Therapy of Coronavirus Infection. J. Glob. Antimicrob. Resist. 2020, 23, 256–262. [Google Scholar] [CrossRef]
  5. Vitamin C Fact Sheet for Health Professionals. Available online: https://ods.od.nih.gov/factsheets/VitaminC-HealthProfessional/ (accessed on 23 October 2024).
  6. Benevenute, P.A.N.; Melo, L.B.B.; Barbosa, S.M.; Domingues, M.I.S.; Vasques, I.C.F.; Morais, E.G.d.; Castro, L.R.d.; Oliveira, G.C.d.; Ferreira, E.A.; Silva, B.M. Soil Physical Properties, Root Distribution, and “Ponkan” Tangerine Yield Across Different Rootstocks in a Deep Tillage Ultisol. Soil. Syst. 2024, 8, 110. [Google Scholar] [CrossRef]
  7. Vidal, M.F. Orange Production in the Area of Operation of BNB; Escritório Técnico de Estudos Econômicos do Nordeste–ETENE: Passaré, Brasil, 2021. [Google Scholar]
  8. Panigrahi, P.; Srivastava, A.K. Water and Nutrient Management Effects on Water Use and Yield of Drip Irrigated Citrus in Vertisol under a Sub-Humid Region. J. Integr. Agric. 2017, 16, 1184–1194. [Google Scholar] [CrossRef]
  9. Carducci, C.E.; Oliveira, G.C.; Curi, N.; Heck, R.J.; Rossoni, D.F.; de Carvalho, T.S.; Costa, A.L. Gypsum Effects on the Spatial Distribution of Coffee Roots and the Pores System in Oxidic Brazilian Latosol. Soil. Tillage Res. 2015, 145, 171–180. [Google Scholar] [CrossRef]
  10. Kader, M.A.; Senge, M.; Mojid, M.A.; Onishi, T.; Ito, K. Effects of Plastic-Hole Mulching on Effective Rainfall and Readily Available Soil Moisture under Soybean (Glycine max) Cultivation. Paddy Water Environ. 2017, 15, 659–668. [Google Scholar] [CrossRef]
  11. Mosleh, Z.; Salehi, M.H.; Amini Fasakhodi, A.; Jafari, A.; Mehnatkesh, A.; Esfandiarpoor Borujeni, I. Sustainable Allocation of Agricultural Lands and Water Resources Using Suitability Analysis and Mathematical Multi-Objective Programming. Geoderma 2017, 303, 52–59. [Google Scholar] [CrossRef]
  12. Soil Survey Staff. Official Soil Series Descriptions; USDA–NRCS: Washington, DC, USA, 2015.
  13. Santos, H.G.; Carvalho Junior, W.D.; Dart, R.D.O.; Áglio, M.L.D.; de Sousa, J.S.; Pares, J.G.; Fontana, A.; Martins, A.D.S.; Oliveira, A.P. O Novo Mapa de Solos Do Brasil Legenda Atualizada; [The New Soil Map of Brazil–Updated Legend]; Embrapa Solos: Rio de Janeiro, Brazil, 2011. [Google Scholar]
  14. Benevenute, P.A.N.; Pereira, F.A.C.; Barbosa, S.M.; da Silva, R.F.; Domingues, M.I.S.; Marques Filho, A.C.; de Oliveira, G.C.; Silva, B.M. Deep Soil Tillage in the Coffee Planting Furrow Has Long-Lasting Benefits for Improving Soil Physical Quality and Enhancing Plant Vigor in Dense Soils. Soil. Tillage Res. 2025, 248, 106448. [Google Scholar] [CrossRef]
  15. Barbosa, S.M.; Silva, B.M.; Oliveira, G.C.d.; Benevenute, P.A.N.; da Silva, R.F.; Curi, N.; da Silva Moretti, B.; Silva, S.H.G.; Norton, L.D.; Pereira, V.M. Deep Furrow and Additional Liming for Coffee Cultivation under First Year in a Naturally Dense Inceptisol. Geoderma 2020, 357, 113934. [Google Scholar] [CrossRef]
  16. Silva, R.F.; Severiano, E.C.; Oliveira, G.C.; Barbosa, S.M.; Peixoto, D.S.; Tassinari, D.; Silva, B.M.; Silva, S.H.G.; Dias Júnior, M.S.; Figueiredo, T.A.F.R. Changes in Soil Profile Hydraulic Properties and Porosity as Affected by Deep Tillage Soil Preparation and Brachiaria Grass Intercropping in a Recent Coffee Plantation on a Naturally Dense Inceptisol. Soil. Tillage Res. 2021, 213, 105127. [Google Scholar] [CrossRef]
  17. Santos, H.G.d.; Jacomine, P.K.T.; Anjos, L.H.C.D.; Oliveira, V.A.d.; Lumbreras, J.F.; Coelho, M.R.; Almeida, J.A.d.; Araujo Filho, J.C.d.; Oliveira, J.B.d.; Cunha, T.J.F. Sistema Brasileiro de Classificação de Solos; [Brazilian System of Soil Classification]; Embrapa Solos: Rio de Janeiro, Brazil, 2018. [Google Scholar]
  18. Benevenute, P.A.N.; Pereira, F.A.C.; Barbosa, S.M.; da Silva, R.F.; Silva, M.A.; Silva, G.F.d.; Lima, J.d.S.; Santos, L.C.; Rabêlo, F.H.S.; Marques Filho, A.C.; et al. Deep Tillage Improves the Rhizosphere Environment in Rainfed Coffee Cultivation on Dense Cambisols through Plant-Soil Interaction. Rhizosphere 2025, 34, 101080. [Google Scholar] [CrossRef]
  19. Daryanto, S.; Wang, L.; Jacinthe, P.-A. Can Ridge-Furrow Plastic Mulching Replace Irrigation in Dryland Wheat and Maize Cropping Systems? Agric. Water Manag. 2017, 190, 1–5. [Google Scholar] [CrossRef]
  20. Suo, G.-D.; Xie, Y.-S.; Zhang, Y.; Luo, H. Long-Term Effects of Different Surface Mulching Techniques on Soil Water and Fruit Yield in an Apple Orchard on the Loess Plateau of China. Sci. Hortic. 2019, 246, 643–651. [Google Scholar] [CrossRef]
  21. Filipović, V.; Romić, D.; Romić, M.; Borošić, J.; Filipović, L.; Mallmann, F.J.K.; Robinson, D.A. Plastic Mulch and Nitrogen Fertigation in Growing Vegetables Modify Soil Temperature, Water and Nitrate Dynamics: Experimental Results and a Modeling Study. Agric. Water Manag. 2016, 176, 100–110. [Google Scholar] [CrossRef]
  22. Martín-Closas, L.; Costa, J.; Pelacho, A.M. Agronomic Effects of Biodegradable Films on Crop and Field Environment. In Soil Degradable Bioplastics For A Sustainable Modern Agriculture; Springer: Berlin/Heidelberg, Germany, 2017; pp. 67–104. [Google Scholar]
  23. Zhang, H.; Miles, C.; Gerdeman, B.; LaHue, D.G.; DeVetter, L. Plastic Mulch Use in Perennial Fruit Cropping Systems–A Review. Sci. Hortic. 2021, 281, 109975. [Google Scholar] [CrossRef]
  24. Sintim, H.Y.; Bandopadhyay, S.; English, M.E.; Bary, A.; Liquet y González, J.E.; DeBruyn, J.M.; Schaeffer, S.M.; Miles, C.A.; Flury, M. Four Years of Continuous Use of Soil-Biodegradable Plastic Mulch: Impact on Soil and Groundwater Quality. Geoderma 2021, 381, 114665. [Google Scholar] [CrossRef]
  25. Haque, M.A.; Jahiruddin, M.; Clarke, D. Effect of Plastic Mulch on Crop Yield and Land Degradation in South Coastal Saline Soils of Bangladesh. Int. Soil. Water Conserv. Res. 2018, 6, 317–324. [Google Scholar] [CrossRef]
  26. Gao, Y.; Li, Y.; Wang, Y.; Wu, B.; Ke, J.; Niu, J.; Guo, L. Effect of Different Film Color Mulching on Dry Matter and Grain Yield of Oil Flax in Dry-Land. Oil Crop Sci. 2020, 5, 17–22. [Google Scholar] [CrossRef]
  27. Bozzolo, A.; Pecenka, J.; Smith, A. Living Mulches, Rolled Cover Crops, and Plastic Mulch: Effects on Soil Properties, Weed Suppression, and Yield in Organic Strawberry Systems. Plants 2025, 14, 3385. [Google Scholar] [CrossRef]
  28. Klar, A.E.; Jadoski, S.O.; Jadoski, S.O. Irrigation and Mulching Management for Sweet Pepper Crop in Protected Environment. Irriga 2004, 9, 217–224. [Google Scholar] [CrossRef]
  29. Melo Filho, J.S.d.; Silva, T.I.d.; Gonçalves, A.C.d.M.; Sousa, L.V.d.; Véras, M.L.M.; Dias, T.J. Physiological Responses of Beet Plants Irrigated with Saline Water and Silicon Application. Comun. Sci. 2020, 11, E3113. [Google Scholar] [CrossRef]
  30. Shakeel, H.; Jahan, S.; Rafiq, K.; Iqbal, S.; Rasul, F. Efficacy of Biochar-Supplemented Soil for Modification of Physio-Biochemical Attributes of Canola (Brassica napus L.) Genotypes under Different Moisture Regimes. J. Soil. Sci. Plant Nutr. 2022, 22, 3667–3684. [Google Scholar] [CrossRef]
  31. Bronick, C.J.; Lal, R. Soil Structure and Management: A Review. Geoderma 2005, 124, 3–22. [Google Scholar] [CrossRef]
  32. Eden, M.; Bachmann, J.; Cavalaris, C.; Kostopoulou, S.; Kozaiti, M.; Böttcher, J. Soil Structure of a Clay Loam as Affected by Long-Term Tillage and Residue Management. Soil. Tillage Res. 2020, 204, 104734. [Google Scholar] [CrossRef]
  33. Oliveira, G.C.; Dias Junior, M.S.; Resck, D.V.S.; Curi, N. Caracterização Química e Físico-Hídrica de Um Latossolo Vermelho Após Vinte Anos de Manejo e Cultivo Do Solo; [Chemical and Physical–Hydric Characterization of a Red Latosol After Twenty Years of Soil Management and Cultivation]. Rev. Bras. Cienc. Solo 2004, 28, 327–336. [Google Scholar] [CrossRef]
  34. Galdos, M.V.; Pires, L.F.; Cooper, H.V.; Calonego, J.C.; Rosolem, C.A.; Mooney, S.J. Assessing the Long-Term Effects of Zero-Tillage on the Macroporosity of Brazilian Soils Using X-Ray Computed Tomography. Geoderma 2019, 337, 1126–1135. [Google Scholar] [CrossRef]
  35. Steinmetz, Z.; Wollmann, C.; Schaefer, M.; Buchmann, C.; David, J.; Tröger, J.; Muñoz, K.; Frör, O.; Schaumann, G.E. Plastic Mulching in Agriculture. Trading Short-Term Agronomic Benefits for Long-Term Soil Degradation? Sci. Total Environ. 2016, 550, 690–705. [Google Scholar] [CrossRef]
  36. Shah, F.; Wu, W. Use of Plastic Mulch in Agriculture and Strategies to Mitigate the Associated Environmental Concerns. In Advances in Agronomy; Elsevier: Amsterdam, The Netherlands, 2020; pp. 231–287. [Google Scholar]
  37. Wan, Y.; Wu, C.; Xue, Q.; Hui, X. Effects of Plastic Contamination on Water Evaporation and Desiccation Cracking in Soil. Sci. Total Environ. 2019, 654, 576–582. [Google Scholar] [CrossRef]
  38. Köppen, W. Das Geographisca System Der Klimate; Borntraeger, G., Ed.; Gebrüder Borntraeger: Berlin, Germany, 1936. [Google Scholar]
  39. Soil Survey Staff. Keys to Soil Taxonomy, 12th ed.; USDA-NRCS: Washington, DC, USA, 2014.
  40. Anjos, L.; Gaistardo, C.; Deckers, J.; Dondeyne, S.; Eberhardt, E.; Gerasimova, M.; Harms, B.; Jones, A.; Krasilnikov, P.; Reinsch, T.; et al. World Reference Base for Soil Resources International Soil Classification System For Naming Soils And Creating Legends For Soil Maps; FAO: Rome, Italy, 2014. [Google Scholar]
  41. Ribeiro, A.C.; Guimarães, P.T.G.; Alvarez, V.V.H. Recomendações Para o Uso de Corretivos e Fertilizantes Em Minas Gerais–5ª Aproximação; [Recommendations for the Use of Soil Amendments and Fertilizers in Minas Gerais–5th Approximation]; Comissão de Fertilidade do Solo do Estado de Minas Gerais: Viçosa, Brazil, 1999. [Google Scholar]
  42. Teixeira, P.C.; Donagemma, G.K.; Fontana, A.; Teixeira, W.G. Manual de Métodos de Análise de Solo. 3a Edição Revista e Ampliada; [Manual of Soil Analysis Methods. 3rd Revised and Expanded Edition]; Embrapa: Brasília, Brazil, 2017. [Google Scholar]
  43. Boizard, H.; Peigné, J.; Sasal, M.C.; de Fátima Guimarães, M.; Piron, D.; Tomis, V.; Vian, J.-F.; Cadoux, S.; Ralisch, R.; Tavares Filho, J.; et al. Developments in the “Profil Cultural” Method for an Improved Assessment of Soil Structure under No-Till. Soil Tillage Res. 2017, 173, 92–103. [Google Scholar] [CrossRef]
  44. Fernandes, K.L.; Ribon, A.A.; Marques Junior, J.; Bahia, A.S.R.d.S.; Tavares Filho, J. Characterization, Classification and Analysis of the Main Properties of the Southwestern Goias Soil. Semin. Cienc. Agrar. 2016, 37, 1135. [Google Scholar] [CrossRef]
  45. van Genuchten, M.T. A Closed-form Equation for Predicting the Hydraulic Conductivity of Unsaturated Soils. Soil. Sci. Soc. Am. J. 1980, 44, 892–898. [Google Scholar] [CrossRef]
  46. Mualem, Y. A New Model for Predicting the Hydraulic Conductivity of Unsaturated Porous Media. Water Resour. Res. 1976, 12, 513–522. [Google Scholar] [CrossRef]
  47. Dexter, A.R.; Bird, N.R.A. Methods for Predicting the Optimum and the Range of Soil Water Contents for Tillage Based on the Water Retention Curve. Soil. Tillage Res. 2001, 57, 203–212. [Google Scholar] [CrossRef]
  48. Dexter, A.R. Soil Physical Quality. Geoderma 2004, 120, 201–214. [Google Scholar] [CrossRef]
  49. Dexter, A.R.; Czyż, E.A.; Richard, G.; Reszkowska, A. A User-Friendly Water Retention Function That Takes Account of the Textural and Structural Pore Spaces in Soil. Geoderma 2008, 143, 243–253. [Google Scholar] [CrossRef]
  50. Reynolds, W.D.; Drury, C.F.; Tan, C.S.; Fox, C.A.; Yang, X.M. Use of Indicators and Pore Volume-Function Characteristics to Quantify Soil Physical Quality. Geoderma 2009, 152, 252–263. [Google Scholar] [CrossRef]
  51. Bouma, J. Guide to the Study of Water Movement in Soil Pedons Above the Watertable, 1st ed.; Wisconsin Geological and Natural History Survey: Madison, WI, USA, 1973. [Google Scholar]
  52. Bullock, P.; Fedoroff, N.; Jongerius, A.; Stoops, G.; Tursina, T. Handbook for Soil Thin Section Description; Waine Research: Wolverhampton, UK, 1985; ISBN 978-0-905184-09-8. [Google Scholar]
  53. Costa, M.C.G.; Cunha, I.M.d.L.; Jorge, L.A.d.C.; Araújo, I.C.d.S. Public-Domain Software for Root Image Analysis. Rev. Bras. Cienc. Solo 2014, 38, 1359–1366. [Google Scholar] [CrossRef]
  54. Thornthwaite, C.W.; Mather, J.R. The Water Balance. Centerton, Drexel Institute of Technology-Laboratory of Climatology. Publ. Climatol. 1955, 8, 104. [Google Scholar]
  55. INMET. Instituto Nacional de Meteorologia. Available online: https://portal.inmet.gov.br/ (accessed on 17 May 2023).
  56. Larcher, W. Plant Ecophysiology (Ecofisiologia Vegetal); Springer: São Carlos, Brazil, 2006. [Google Scholar]
  57. R Core Team. R: A Language and Environment for Statistical Computing; R Foundation for Statistical Computing: Vienna, Austria, 2023. [Google Scholar]
  58. Wickham, H.; Francois, R.; Henry, L.; Müller, K. Dplyr: A Grammar of Data Manipulation. R Package Version 0.4, 2015, 3, 156. Available online: https://dplyr.tidyverse.org/ (accessed on 2 December 2024).
  59. Baty, F.; Ritz, C.; Charles, S.; Brutsche, M.; Flandrois, J.-P.; Delignette-Muller, M.-L. A Toolbox for Nonlinear Regression in R: The Package Nlstools. J. Stat. Softw. 2015, 66, 1–21. [Google Scholar] [CrossRef]
  60. Mendiburu, F. Statistical Procedures for Agricultural Research; John Wiley & Sons: Hoboken, NJ, USA, 2023; p. 155. [Google Scholar]
  61. Wei, T.; Simko, V. R Package “Corrplot”: Visualization of a Correlation Matrix. (Version 0.92). 2021. Available online: https://CRAN.R-project.org/package=dplyr (accessed on 2 December 2024).
  62. QGIS. QGIS: Development Team, Geographic Information System. Open-Source Geospatial Foundation. 2021. Available online: https://www2.qgis.org/ (accessed on 2 December 2024).
  63. Lee, S.; Wolberg, G.; Shin, S.Y. Scattered Data Interpolation with Multilevel B-Splines. IEEE Trans. Vis. Comput. Graph. 1997, 3, 228–244. [Google Scholar] [CrossRef]
  64. De Sousa, F.A. Identificação Das Zonas de Recarga e Caracterização Dos Sistemas Freáticos de Iporá–GO; [Identification of Recharge Zones and Characterization of the Phreatic Systems of Iporá, Goiás, Brazil]. Geoambiente Online 2019, 33, 23. [Google Scholar] [CrossRef]
  65. Chai, Q.; Gan, Y.; Zhao, C.; Xu, H.-L.; Waskom, R.M.; Niu, Y.; Siddique, K.H.M. Regulated Deficit Irrigation for Crop Production under Drought Stress. A Review. Agron. Sustain. Dev. 2016, 36, 3. [Google Scholar] [CrossRef]
  66. Carvalho, H.D.P.; Dourado Neto, D.; Teodoro, R.E.F.; De Melo, B. Balanço Hídrico Climatológico, Armazenamento Efetivo Da Água No Solo e Transpiração Na Cultura de Café; [Climatological Water Balance, Effective Soil Water Storage, and Transpiration in Coffee Crops]. Biosci. J. 2011, 27, 221–229. [Google Scholar]
  67. Guimarães, H.S. Estimativa Do Balanço Hídrico Como Ferramenta Para Planejamento Agrícola No Brejo Paraibano; [Estimation of the Water Balance as a Tool for Agricultural Planning in the Brejo Paraibano Region]. Bachelor’s Thesis, Universidade Federal da Paraíba, João Pessoa, Brazil, 2019. [Google Scholar]
  68. Sousa, F.A.; Da Assunção, H.F. Capacidade de Armazenamento de Água No Solo (CAD) e Características Físicas Dos Solos Na Avaliação Da Distribuição Da Água Das Chuvas Na Alta Bacia Do Ribeirão Santo Antônio; [Soil Water Storage Capacity (AWC) and Physical Soil Properties in the Evaluation of Rainwater Distribution in the Upper Santo Antônio Stream Basin]. Rev. Bras. Geogr. Física 2021, 14, 3635–3647. [Google Scholar] [CrossRef]
  69. Silva, B.M.; Oliveira, G.C.; Serafim, M.E.; Silva, É.A.; Ferreira, M.M.; Norton, L.D.; Curi, N. Critical Soil Moisture Range for a Coffee Crop in an Oxidic Latosol as Affected by Soil Management. Soil. Tillage Res. 2015, 154, 103–113. [Google Scholar] [CrossRef]
  70. Klein, C.; Klein, V.A. Estratégias Para Potencializar a Retenção e Disponibilidade de Água No Solo; [Strategies to Enhance Soil Water Retention and Availability]. Revista Eletrônica em Gestão, Educação e Tecnologia Ambiental 2015, 19, 21–29. [Google Scholar] [CrossRef]
  71. Gonçalves, M.C.P.B. Características Hidrodinâmicas Dos Solos: Sua Determinação e Funções de Pedo-Transferência; [Soil Hydrodynamic Properties: Their Determination and Pedotransfer Functions]. Ph.D. Thesis, Universidade Técnica de Lisboa, Lisbon, Portugal, 1994. [Google Scholar]
  72. Shafqat, W.; Naqvi, S.A.; Maqbool, R.; Haider, M.S.; Jaskani, M.J.; Khan, I.A. Climate Change and Citrus. In Citrus-Research, Development and Biotechnology; Khan, M.S., Khan, I.A., Eds.; IntechOpen: London, UK, 2021; p. 147. [Google Scholar]
  73. Ferreira, M.M.; Marcos, Z.Z. Estimativa Da Capacidade de Campo de Latossolo Roxo Distrófico e Regossolo Através Do Ponto de Inflexão Da Curva Característica de Umidade; [Estimation of Field Capacity of a Dystrophic Red Latosol and a Regosol Using the Inflection Point of the Soil Water Retention Curve]. Ciência Prática 1983, 7, 96–101. [Google Scholar]
  74. Alencar, T.L.d.; Chaves, A.F.; Santos, C.L.A.d.; Assis Júnior, R.N.d.; Mota, J.C.A. Atributos Físicos de Um Cambissolo Cultivado e Tratado Com Biofertilizante Na Chapada Do Apodi, Ceará; [Physical Attributes of a Cultivated Cambisol Treated with Biofertilizer in the Chapada do Apodi, Ceará, Brazil]. Rev. Bras. Cienc. Solo 2015, 39, 737–749. [Google Scholar] [CrossRef]
  75. Gonçalves, A.O.; Fagnani, M.A.; Peres, J.G. Efeitos Da Cobertura Do Solo Com Filme de Polietileno Azul No Consumo de Água Da Cultura Da Alface Cultivada Em Estufa; [Effects of Blue Polyethylene Film Soil Cover on Water Consumption of Lettuce Grown in a Greenhouse]. Eng. Agrícola 2005, 25, 622–631. [Google Scholar] [CrossRef]
  76. Araújo, R.; Goedert, W.J.; Lacerda, M.P.C. Qualidade de Um Solo Sob Diferentes Usos e Sob Cerrado Nativo; [Soil Quality Under Different Land Uses and Native Cerrado Vegetation]. Rev. Bras. Cienc. Solo 2007, 31, 1099–1108. [Google Scholar] [CrossRef]
  77. Capeche, C.L. Noções Sobre Tipos de Estrutura Do Solo e Sua Importância Para o Manejo Conservacionista. Embrapa Solos–Comunicado Técnico 51; [Basic Concepts of Soil Structure Types and Their Importance for Conservation Management. Embrapa Soils–Technical Bulletin No. 51]. Available online: http://www.infoteca.cnptia.embrapa.br (accessed on 29 September 2025).
  78. Fidalski, J.; Auler, P.A.M.; Beraldo, J.M.G.; Marur, C.J.; Faria, R.T.d.; Barbosa, G.M.d.C. Availability of Soil Water under Tillage Systems, Mulch Management and Citrus Rootstocks. Rev. Bras. Cienc. Solo 2010, 34, 917–924. [Google Scholar] [CrossRef]
  79. Carvalho, D.F.d.; Souza, W.d.J.; Pinto, M.F.; Oliveira, J.R.d.; Guerra, J.G.M. Perdas de Água e Solo Sob Diferentes Padrões de Chuva Simulada e Condições de Cobertura Do Solo; [Water and Soil Losses Under Different Simulated Rainfall Patterns and Soil Cover Conditions]. Eng. Agrícola 2012, 32, 708–717. [Google Scholar] [CrossRef]
  80. Dantas, M.S.M.; Grangeiro, L.C.; Medeiros, J.F.d.; Cruz, C.A.; Cunha, A.P.A.d. Rendimento e Qualidade de Melancia Cultivada Sob Proteção de Agrotêxtil Combinado Com Mulching Plástico; [Yield and Quality of Watermelon Grown Under Agrotextile Protection Combined with Plastic Mulching]. Rev. Bras. Eng. Agrícola Ambient. 2013, 17, 824–829. [Google Scholar] [CrossRef]
  81. Liu, Q.; Chen, Y.; Liu, Y.; Wen, X.; Liao, Y. Coupling Effects of Plastic Film Mulching and Urea Types on Water Use Efficiency and Grain Yield of Maize in the Loess Plateau, China. Soil. Tillage Res. 2016, 157, 1–10. [Google Scholar] [CrossRef]
  82. Neves, C.S.V.; Dechen, A.R. Sistemas de Manejo de Solo Em Pomar de Tangerina’Ponkan’sobre Limão’Cravo’em Latossolo Roxo; [Soil Management Systems in a ‘Ponkan’ Tangerine Orchard Grafted onto ‘Rangpur’ Lime in a Red Latosol]. Laranja 2001, 22, 167–184. [Google Scholar]
  83. Libardi, P.L. Distribuição Do Sistema Radicular de Porta Enxertos de Citrus Em Ecossistema de Tabuleiros Costeiro; [Distribution of the Root System of Citrus Rootstocks in a Coastal Tablelands Ecosystem]. Rev. Bras. Frutic. 1999, 21, 313–317. [Google Scholar]
  84. Zhou, L.-M.; Jin, S.-L.; Liu, C.-A.; Xiong, Y.-C.; Si, J.-T.; Li, X.-G.; Gan, Y.-T.; Li, F.-M. Ridge-Furrow and Plastic-Mulching Tillage Enhances Maize–Soil Interactions: Opportunities and Challenges in a Semiarid Agroecosystem. Field Crops Res. 2012, 126, 181–188. [Google Scholar] [CrossRef]
  85. Carvalho, D.F.d.; Faria, R.A.d.; Sousa, S.A.V.d.; Borges, H.Q. Espacialização Do Período de Veranico Para Diferentes Níveis de Perda de Produção Na Cultura Do Milho, Na Bacia Do Rio Verde Grande, MG; [Spatialization of Dry-Spell Periods for Different Levels of Yield Loss in Maize in the Verde Grande River Basin, Minas Gerais, Brazil]. Rev. Bras. Eng. Agrícola Ambient. 2000, 4, 172–176. [Google Scholar] [CrossRef]
  86. Chai, Y.; Chai, Q.; Li, R.; Li, Y.; Yang, C.; Cheng, H.; Chang, L.; Chai, S. Straw Strip Mulching in a Semiarid Rainfed Agroecosystem Achieves Winter Wheat Yields Similar to Those of Full Plastic Mulching by Optimizing the Soil Hydrothermal Regime. Crop J. 2022, 10, 879–892. [Google Scholar] [CrossRef]
  87. Subrahmaniyan, K.; Veeramani, P.; Harisudan, C. Heat Accumulation and Soil Properties as Affected by Transparent Plastic Mulch in Blackgram (Vigna mungo) Doubled Cropped with Groundnut (Arachis hypogaea) in Sequence under Rainfed Conditions in Tamil Nadu, India. Field Crops Res. 2018, 219, 43–54. [Google Scholar] [CrossRef]
  88. Van der Meulen, E.S.; Nol, L.; Cammeraat, L.H. Effects of Irrigation and Plastic Mulch on Soil Properties on Semiarid Abandoned Fields. Soil. Sci. Soc. Am. J. 2006, 70, 930–939. [Google Scholar] [CrossRef]
  89. Wang, X.; Wang, G.; Guo, T.; Xing, Y.; Mo, F.; Wang, H.; Fan, J.; Zhang, F. Effects of Plastic Mulch and Nitrogen Fertilizer on the Soil Microbial Community, Enzymatic Activity and Yield Performance in a Dryland Maize Cropping System. Eur. J. Soil. Sci. 2021, 72, 400–412. [Google Scholar] [CrossRef]
  90. Andrade, R.d.S.; Stone, L.F. Índice S Como Indicador Da Qualidade Física de Solos Do Cerrado Brasileiro; [The S Index as an Indicator of the Physical Quality of Soils in the Brazilian Cerrado]. Rev. Bras. Eng. Agrícola Ambient. 2009, 13, 382–388. [Google Scholar] [CrossRef]
  91. Zhang, Y.; Wang, R.; Wang, S.; Wang, H.; Xu, Z.; Jia, G.; Wang, X.; Li, J. Effects of Different Sub-Soiling Frequencies Incorporated into No-Tillage Systems on Soil Properties and Crop Yield in Dryland Wheat-Maize Rotation System. Field Crops Res. 2017, 209, 151–158. [Google Scholar] [CrossRef]
  92. Vasques, I.C.F.; Souza, A.A.; Morais, E.G.; Benevenute, P.A.N.; Silva, L.d.C.M.d.; Homem, B.G.C.; Casagrande, D.R.; Silva, B.M. Improved Management Increases Carrying Capacity of Brazilian Pastures. Agric. Ecosyst. Environ. 2019, 282, 30–39. [Google Scholar] [CrossRef]
  93. Nair, S.A. Effect of Mulching on Hydrothermal Regime and Fruit Yield of Tomato (Lycopersicon esculentum Mill). Int. J. Curr. Microbiol. Appl. Sci. 2018, 7, 1005–1013. [Google Scholar] [CrossRef]
  94. Liu, R.; Wang, Z.; Ye, H.; Li, W.; Zong, R.; Tian, X. Effects of Different Plastic Mulching Film on Soil Hydrothermal Status and Water Utilization by Spring Maize in Northwest China. Front. Mater. 2021, 8, 774833. [Google Scholar] [CrossRef]
  95. Liao, Y.; Cao, H.-X.; Xue, W.-K.; Liu, X. Effects of the Combination of Mulching and Deficit Irrigation on the Soil Water and Heat, Growth and Productivity of Apples. Agric. Water Manag. 2021, 243, 106482. [Google Scholar] [CrossRef]
  96. Hou, H.; Zhang, X.; Wang, J.; Yin, J.; Fang, Y.; Yu, X.; Wang, H.; Ma, Y. Plastic-Soil Mulching Increases the Photosynthetic Rate by Relieving Nutrient Limitations in the Soil and Flag Leaves of Spring Wheat in a Semiarid Area. J. Soils Sediments 2020, 20, 3158–3170. [Google Scholar] [CrossRef]
  97. Niu, L.; Yan, Y.; Hou, P.; Bai, W.; Zhao, R.; Wang, Y.; Li, S.; Du, T.; Zhao, M.; Song, J.; et al. Influence of Plastic Film Mulching and Planting Density on Yield, Leaf Anatomy, and Root Characteristics of Maize on the Loess Plateau. Crop J. 2020, 8, 548–564. [Google Scholar] [CrossRef]
  98. Li, H.; Kuang, N.; Gou, Q.; Ma, Y.; Li, Q. Effects of Different Film Mulches on Photosynthetic Characteristics and Yield of Summer Maize (Zea mays L.) in the North China Plain. Arch. Agron. Soil. Sci. 2021, 67, 179–190. [Google Scholar] [CrossRef]
  99. Yamamoto, T.; Miyamoto, K. Effects of Reflective Sheet Mulching on Net Photosynthesis, Leaf Character and Fruit Quality of Cherry and Pear. Environ. Control Biol. 2005, 43, 71–82. [Google Scholar] [CrossRef]
  100. Nascimento, S.P.d.; Bastos, E.A.; Araújo, E.C.E.; Freire Filho, F.R.; Silva, E.M.d. Tolerância Ao Déficit Hídrico Em Genótipos de Feijão-Caupi; [Tolerance to Water Deficit in Cowpea Genotypes]. Rev. Bras. Eng. Agrícola Ambient. 2011, 15, 853–860. [Google Scholar] [CrossRef]
  101. Brito, M.E.B.; Soares, L.A.A.; Fernandes, P.D.; Lima, G.S.; Sá, F.V.S.; Melo, A.S. Comportamento Fisiológico de Combinações Copa/Porta-Enxerto de Citros Sob Estresse Hídrico; [Physiological Behavior of Citrus Scion/Rootstock Combinations under Water Stress]. Rev. Bras. Ciências Agrárias Braz. J. Agric. Sci. 2012, 7, 857–865. [Google Scholar] [CrossRef]
  102. Fernandes, K.A.; Raimundo, C.S.; Rêgo, P.L.; Rodrigues, W.P.; Fernandes, W.G.; Luiz, V.S. Desenvolvimento inicial de combinações copa/porta-enxerto da laranjeira ‘Pêra’ [Citrus sinensis (L.) Osbeck] sob diferentes níveis de disponibilidade hídrica em área do Cerrado [Initial Development of ‘Pêra’ Sweet Orange Scion/Rootstock Combinations under Varying Water Availability in a Cerrado Area]. In Proceedings of the 10th JICE—Jornada de Iniciação Científica e Extensão, Palmas, Brazil, 22 November 2019. [Google Scholar]
  103. Lyra, G.B.; Souza, J.L.d.; Teodoro, I.; Lyra, G.B.; Filho, G.M.; Júnior, R.F.A. Conteúdo de Água No Solo Em Cultivo de Milho Sem e Com Cobertura Morta Na Entrelinha Na Região de Arapiraca-AL; [Soil Water Content in Maize Cultivation with and without Mulch in the Inter-Row Area in the Arapiraca Region, Alagoas, Brazil]. Irriga 2010, 15, 173–183. [Google Scholar] [CrossRef][Green Version]
  104. Rodríguez-Gamir, J.; Primo-Millo, E.; Forner, J.B.; Forner-Giner, M.A. Citrus Rootstock Responses to Water Stress. Sci. Hortic. 2010, 126, 95–102. [Google Scholar] [CrossRef]
  105. Carducci, C.E.; Oliveira, G.C.d..; Severiano, E.C.; Zeviani, W.M. Modelagem Da Curva de Retenção de Água de Latossolos Utilizando a Equação Duplo Van Genuchten; [Modeling of the Soil Water Retention Curve of Latosols Using the Double van Genuchten Equation]. Rev. Bras. Cienc. Solo 2011, 35, 77–86. [Google Scholar] [CrossRef]
  106. Pessoa, T.N.; Libardi, P.L. Physical-Hydric Properties of Oxisols as Influenced by Soil Structure and Clay Mineralogy. Catena 2022, 211, 106009. [Google Scholar] [CrossRef]
  107. Li, H.; Yang, X.; Chen, H.; Cui, Q.; Yuan, G.; Han, X.; Wei, C.; Zhang, Y.; Ma, J.; Zhang, X. Water Requirement Characteristics and the Optimal Irrigation Schedule for the Growth, Yield, and Fruit Quality of Watermelon under Plastic Film Mulching. Sci. Hortic. 2018, 241, 74–82. [Google Scholar] [CrossRef]
  108. Mendonça, S.R.; Ávila, M.C.R.; Vital, R.G.; Evangelista, Z.R.; Pontes, N.d.C.; Nascimento, A.d.R. The Effect of Different Mulching on Tomato Development and Yield. Sci. Hortic. 2021, 275, 109657. [Google Scholar] [CrossRef]
  109. Gao, H.; Yan, C.; Liu, Q.; Ding, W.; Chen, B.; Li, Z. Effects of Plastic Mulching and Plastic Residue on Agricultural Production: A Meta-Analysis. Sci. Total Environ. 2019, 651, 484–492. [Google Scholar] [CrossRef]
  110. Ćosić, M.; Stričević, R.; Djurović, N.; Moravčević, D.; Pavlović, M.; Todorović, M. Predicting Biomass and Yield of Sweet Pepper Grown with and without Plastic Film Mulching under Different Water Supply and Weather Conditions. Agric. Water Manag. 2017, 188, 91–100. [Google Scholar] [CrossRef]
  111. Vavrina, C.S.; Roka, F.M. Comparison of Plastic Mulch and Bare-Ground Production and Economics for Short-Day Onions in a Semitropical Environment. Horttechnology 2000, 10, 326–330. [Google Scholar] [CrossRef]
  112. Chavarria, G.; Santos, H.P.d.; Felippeto, J.; Marodin, G.A.B.; Bergamaschi, H.; Cardoso, L.S.; Fialho, F.B. Relações Hídricas e Trocas Gasosas Em Vinhedo Sob Cobertura Plástica; [Plant Water Relations and Gas Exchange in a Vineyard under Plastic Cover]. Rev. Bras. Frutic. 2008, 30, 1022–1029. [Google Scholar] [CrossRef]
  113. Queiroga, G.M.T.; Sousa, M.L.R.; Silva, J.K.; Rodrigues, D.N.J.; Siqueira, E.S. Os Impactos Da Tecnologia de Mulching Utilizada No Cultivo Do Melão Na Região de Mossoró; [Impacts of Mulching Technology Used in Melon Cultivation in the Mossoró Region]. Rev. Verde Agroecol. Desenvolv. Sustentável 2015, 10, 77. [Google Scholar] [CrossRef][Green Version]
  114. Zhang, H.; Liu, Q.; Yu, X.; Lü, G.; Wu, Y. Effects of Plastic Mulch Duration on Nitrogen Mineralization and Leaching in Peanut (Arachis hypogaea) Cultivated Land in the Yimeng Mountainous Area, China. Agric. Ecosyst. Environ. 2012, 158, 164–171. [Google Scholar] [CrossRef]
  115. Li, C.; Wen, X.; Wan, X.; Liu, Y.; Han, J.; Liao, Y.; Wu, W. Towards the Highly Effective Use of Precipitation by Ridge-Furrow with Plastic Film Mulching Instead of Relying on Irrigation Resources in a Dry Semi-Humid Area. Field Crops Res. 2016, 188, 62–73. [Google Scholar] [CrossRef]
  116. Jiang, N.; Jin, L.-F.; Teixeira da Silva, J.A.; Islam, M.Z.; Gao, H.-W.; Liu, Y.-Z.; Peng, S.-A. Activities of Enzymes Directly Related with Sucrose and Citric Acid Metabolism in Citrus Fruit in Response to Soil Plastic Film Mulch. Sci. Hortic. 2014, 168, 73–80. [Google Scholar] [CrossRef]
  117. Zhu, G.; Yong, L.; Zhang, Z.; Sun, Z.; Wan, Q.; Xu, Y.; Ma, H.; Sang, L.; Liu, Y.; Wang, L.; et al. Effects of Plastic Mulch on Soil Water Migration in Arid Oasis Farmland: Evidence of Stable Isotopes. Catena 2021, 207, 105580. [Google Scholar] [CrossRef]
Figure 1. Location and design of the experimental area in UTM zones.
Agronomy 16 00083 g001
Figure 2. Lavras weather station (83687/−21.226111° E; −44.979722° S) data from 2012 to 2014, and climatological standard normal from 1981 to 2010. Source: [55]. The pink line indicates the installation of plastic mulching, while the green line represents the physiological analysis, with 1a and 2a referring to the first and second physiological measurements (sampling events), respectively. Soil sampling was carried out alongside the second physiological assessment.
Agronomy 16 00083 g002
Figure 3. Monthly soil water balance from 2012 to 2014 for Inceptisol I under citrus crops. (A) Monthly climatic and water-related variables were used to calculate the soil water balance over the evaluated period (2012–2014). (B) Monthly components of the soil water balance derived from the variables shown in panel (A). PE: potential evapotranspiration; RE: real evapotranspiration; AWC: available water capacity.
Agronomy 16 00083 g003
Figure 4. Monthly soil water balance from 2012 to 2014 for Inceptisol II under citrus crops. (A) Monthly climatic and water-related variables were used to calculate the soil water balance over the evaluated period (2012–2014). (B) Monthly components of the soil water balance derived from the variables shown in panel (A). PE: potential evapotranspiration; RE: real evapotranspiration; AWC: available water capacity.
Agronomy 16 00083 g004
Figure 5. Water retention curves of Inceptisol I and Inceptisol II in each treatment: no plastic (NP); white plastic (WP); black plastic (BP); model curve predicted (PM); and confidence interval (CI).
Agronomy 16 00083 g005
Figure 6. Spatial variability mapping of the citrus root system under different conditions of covering, no plastic (NP), and with plastic cover, regardless of the color (P), in both Inceptisol I and Inceptisol II.
Agronomy 16 00083 g006
Figure 7. Bulk density of Inceptisol I and Inceptisol II in each treatment: no plastic (NP); white plastic (WP); black plastic (BP); minimum significant difference from Tukey’s mean test between treatments (MSD-T) and between depths (MSD-D). When the difference between the treatments’ means at the same soil depth exceeds the minimum significant difference (MSD-T), the treatments differ at that depth. When the difference between the means of soil depths for the same treatment is greater than the minimum significant difference in depths (MSD-D), there is a difference between the depths evaluated for the same treatment.
Agronomy 16 00083 g007
Figure 8. S index of Inceptisol I and Inceptisol II in each treatment: no plastic (NP); white plastic (WP); black plastic (BP); minimum significant difference from Tukey’s mean test between treatments (MSD-T) and between depths (MSD-D); the upper limit of degradation of soil (LDS); and limit of soil quality (LSQ). When the difference between the treatments’ means at the same soil depth exceeds the minimum significant difference (MSD-T), the treatments differ at that depth. When the difference between the means of soil depths for the same treatment is greater than the minimum significant difference in depths (MSD-D), there is a difference between the depths evaluated for the same treatment.
Agronomy 16 00083 g008
Figure 9. Normalized pore volume distribution function for different treatments at different soil depths: no plastic (NP), white plastic (WP), and black plastic (BP).
Agronomy 16 00083 g009
Figure 10. Localization parameters for the normalized pore volume distribution function for the different treatments throughout the soil profile: no plastic (NP); white plastic (WP); black plastic (BP); minimum significant difference from Tukey’s mean test between treatments (MSD-T) and between depths (MSD-D). When the difference between the treatments’ means at the same soil depth exceeds the minimum significant difference (MSD-T), the treatments differ at that depth. When the difference between the means of soil depths for the same treatment is greater than the minimum significant difference in depths (MSD-D), there is a difference between the depths evaluated for the same treatment.
Agronomy 16 00083 g010
Figure 11. Values of soil physical quality indicators throughout the soil profile in Inceptisol I and Inceptisol II: no plastic (NP); white plastic (WP); and black plastic (BP). Optimal limit values (lower critical limit (L-Lim) and upper critical limit (U-Lim), and reference value for air capacity (Ref-AC). The minimum significant difference (MSD) from Tukey’s mean test is used to test the difference between treatments (MSD-T) and depths (MSD-D). When the difference between the treatments’ means at a given soil depth exceeds the minimum significant difference (MSD-T), the treatments differ at that depth. When the difference between the means of soil depths for the same treatment is greater than the minimum significant difference in depths (MSD-D), there is a difference between the depths evaluated for the same treatment.
Agronomy 16 00083 g011
Figure 12. Total porosity in Inceptisol I and Inceptisol II for the different treatments in the soil profile: no plastic (NP); white plastic (WP); and black plastic (BP). Means followed by the same capital letter do not differ for treatments within the same depth, and the same lowercase letter does not differ for depth within the same treatment in Tukey’s test (p > 0.05). Macroporosity (Macro) and microporosity (Micro).
Agronomy 16 00083 g012
Figure 13. Field capacity throughout the soil profile in Inceptisol I and II for the different treatments: no plastic (NP); white plastic (WP); and black plastic (BP). Means followed by the same capital letter do not differ from each other for treatments within the same depth, and by the same lowercase letter, do not differ among each other for depth within the same treatment in the Tukey test (p > 0.05). Available water capacity (AWC) and permanent wilting point (PWP).
Agronomy 16 00083 g013
Figure 14. Physiological endpoints were evaluated in citrus crops under different plastic mulching treatments, grown in Inceptisol I and Inceptisol II, during contrasting rainfall periods: LP (low precipitation) and HP (high precipitation). Means followed by the same capital letter do not differ from each other for treatments, and by the same lowercase letter, do not differ among rainfall periods within the same treatment in the Tukey test (p > 0.05).
Agronomy 16 00083 g014
Figure 15. Correlations to soil physical parameters and citrus physiological responses under different plastic mulching and soil types. LP: period of low precipitation, HP: period of high precipitation, PR: photosynthesis rate, ST: stomatal conductance, TR: transpiration rate, and WUE: water use efficiency.
Agronomy 16 00083 g015
Table 1. Soil chemical and physical attributes of the entire area before the installation of the experiments.
Soil Chemical and Physical Attributes (0.00–0.20 m Depth)
pH (H2O)5.3
P (mg dm−3)19.4
K (mg dm−3)87.3
Ca2+ (cmolc dm−3)1.2
Mg2+ (cmolc dm−3)0.9
Al3+ (cmolc dm−3)0.4
H + Al (cmolc dm−3)5.6
SB (cmolc dm−3)2.32
t (cmolc dm−3)2.72
T (cmolc dm−3)7.92
SOM (dag kg−1)3.2
P-rem (mg l−1)27.2
V (%)29.3
m (%)14.7
Zn (mg dm−3)1.4
Fe (mg dm−3)28.7
Mn (mg dm−3)11.2
Cu (mg dm−3)3.9
B (mg dm−3)0.2
S (mg dm−3)35.9
Sand (g kg−1)220
Clay (g kg−1)360
Silt (g kg−1)420
Soil pH was measured in water at a 1:2.5 soil-to-water ratio (10 g of air-dried soil (<2 mm) to 25 mL of distilled water). The available contents of potassium (K), phosphorus (P), zinc (Zn), iron (Fe), manganese (Mn), copper (Cu), and sodium (Na) were determined using the Mehlich-1 extraction method. Exchangeable aluminum (Al), calcium (Ca), and magnesium (Mg) were extracted with a 1 mol L−1 KCl solution. Available boron (B) was determined using the hot water extraction method, and available sulfur (S) was measured using the monocalcium phosphate method diluted in acetic acid. The following chemical parameters were calculated: H+Al using the SMP extractor, sum of bases (SB), effective cation exchange capacity (t), potential cation exchange capacity (T), base saturation (V), and aluminum saturation (m). Soil organic matter (SOM) was determined using the Walkley–Black method, and remaining phosphorus (P-Rem) was also measured. Soil particle size distribution (clay, silt, and sand) was assessed using the pipette method. All procedures follow the methodologies described in Teixeira et al. [42].
Table 2. Soil particle size distribution for soils of the experimental area.
SandSiltClay
Depth
(m)
Soil Horizons(g kg−1)
Inceptisol I
0.00–0.05 A217.4399.7382.9
0.20–0.25 B215.5439.8344.7
0.90–0.95 C179.9346.7473.4
Inceptisol II
0.00–0.05 A332.6292.2375.2
0.20–0.25 Bw319.6317.0363.4
0.90–0.95 C297.9380.7321.4
Clay, silt, and sand were assessed using the pipette method, as described by Teixeira et al. [42]. A: Surface mineral horizon enriched with organic matter; B: Subsurface horizon altered by pedogenetic processes; Bw: Incipient B horizon with weak pedogenetic development; C: Slightly altered or unaltered parent material [39,40].
Table 3. Parameters of the water retention curve.
SoilDepth (m)TreatmentαnmƟsatƟresƟiΨiR2
Inceptisol I0.05NP0.561.640.390.650.220.483.840.99
WP0.781.560.360.650.220.493.000.98
BP0.701.610.380.680.230.513.200.98
0.25NP0.641.620.380.670.240.513.450.98
WP0.461.640.390.650.230.484.730.96
BP0.791.510.340.630.240.493.150.98
0.95NP0.671.750.430.650.250.493.000.99
WP0.781.590.370.620.260.482.890.97
BP0.701.550.360.640.240.493.380.97
Inceptisol II0.05NP1.101.500.330.600.200.452.280.97
WP1.731.400.290.540.170.411.690.98
BP1.891.380.280.540.160.411.600.98
0.25NP1.121.390.280.540.220.432.660.97
WP1.351.390.280.530.170.402.190.90
BP1.011.340.260.520.160.403.220.97
0.95NP1.241.260.210.520.290.453.290.78
WP3.351.050.050.500.300.485.790.91
BP0.381.220.180.470.260.4112.520.86
α, n, and m: empiric parameters; Ɵsat: saturation water content; Ɵres: residual water content; Ɵi: soil moisture in water content at the inflection point of the van Genuchten model; Ψi: matric potential at the inflection point of the van Genuchten model; and R2: coefficient of determination. No plastic (NP), white plastic (WP), and black plastic (BP).
Disclaimer/Publisher’s Note: The statements, opinions and data contained in all publications are solely those of the individual author(s) and contributor(s) and not of MDPI and/or the editor(s). MDPI and/or the editor(s) disclaim responsibility for any injury to people or property resulting from any ideas, methods, instructions or products referred to in the content.