Article

Microbially Mediated Carbon Regulation by Straw Mulching in Rainfed Maize Rhizosphere

1
State Key Laboratory of Arid and Crop Science, Gansu Agricultural University, Lanzhou 730070, China
2
College of Agronomy, Gansu Agricultural University, Lanzhou 730070, China
3
Key Laboratory of Ecological Safety and Sustainable Development in Arid Lands, Northwest Institute of Eco-Environment and Resources, Chinese Academy of Sciences, Lanzhou 730000, China
4
Institute of Molecular Biology and Biotechnology, The University of Lahore, Lahore 54000, Pakistan
*
Authors to whom correspondence should be addressed.
Agronomy 2025, 15(6), 1412; https://doi.org/10.3390/agronomy15061412
Submission received: 24 March 2025 / Revised: 28 May 2025 / Accepted: 30 May 2025 / Published: 8 June 2025
(This article belongs to the Section Innovative Cropping Systems)

Abstract

:
Soil carbon dynamics and microbial communities are critical to soil health. However, the specific effects of mulching on soil microbial community and carbon dynamics in semi-arid rainfed regions remain insufficiently understood. This study aims to identify optimal mulching practices that promote soil carbon sequestration and enhance soil microbial functionality. Mulching treatments were applied in furrows before maize sowing, including black plastic film (TB), white plastic film (TW), straw mulching without sowing (TC), and straw mulching with sowing (TG), and were compared with flat sowing without mulching (TN). Results revealed that TG treatment promoted soil carbon dynamics by increasing total carbon (9%), organic carbon (19%), microbial biomass carbon (100%), easily oxidized carbon (10%), particulate-associated carbon (77%), carbon stability index (7%), active carbon fraction (45%), dissolved carbon proportion (30%), and microbial quotient (34%) compared to TN. A higher abundance and composition of bacterial communities were observed compared to fungal communities. The highest bacterial abundance of Kaistobacter, iii1_15, Sinobacteraceae, and Xanthomonadaceae, and fungal abundance of unspecified fungi, Laiosphaeriaceae, and Sordariomycetes, with the dominant aerobic respiration metabolic pathway involved in organic matter decomposition, were observed in TG and TC. The results indicated that TG treatment most effectively promoted carbon fractions and microbial activity that could strengthen soil health.

1. Introduction

Dryland agriculture globally accounts for approximately 41% of the world’s population and provides food for more than 38% of the world’s population [1]. The dryland area of northern China comprises approximately 50% of the country’s total land area. Crop production in semi-arid rainfed regions of the Loess Plateau has been threatened by poor soil management and low precipitation, resulting in a significant impact of global climate change on agriculture [2]. Plastic film mulching is widely used to conserve moisture in global agricultural production. However, straw mulching is a simple, cost-effective, and more environmentally friendly technology than plastic film mulching. It conserves soil moisture, reduces soil temperature, and promotes the accumulation of carbon fraction in soil [3].
Rainfed agriculture depends on natural precipitation affected by climate change-induced soil degradation through soil erosion, drought, and nutrient depletion, which reduce soil productivity [4]. Sustaining soil health through mulching is crucial for agricultural productivity [5]. Plastic film mulching promotes soil temperature and moisture, and suppresses weeds, but degrades soil health and causes environmental pollution [6]. Straw mulching conserves soil moisture, water use efficiency, and crop yields in dryland areas [7] by limiting water evaporation and acts as an insulating layer to moderate soil temperatures [8]. Microorganisms decompose these organic mulching materials over time, enriching the soil with organic matter and carbon fractions. Soil carbon exists in various forms, including labile, particulate, mineral-associated, and microbial biomass carbon, which are crucial for maintaining soil health [9]. Soil carbon has a profound effect on soil’s physical, chemical, and biological properties. It reduces C emissions from soil and promotes labile and dissolved C in soil [10]. It is a vital component of organic matter, influencing nutrient availability, soil aggregation, and climate change mitigation. It improves soil fertility, C cycling, soil aggregation, and stability [11].
Although it is known that bacteria respond to mulching, their relationship with active carbon under semi-arid conditions remains insufficiently explored [12]. Mulching practices directly change soil physical properties and indirectly affect soil biochemical properties, such as enzymes participating in critical metabolic processes, such as the decomposition of organic matter and nutrient transformation [13]. However, the mechanism of these connections needs further studies. Previous studies mainly focused on the differences in soil organic carbon under different fertilization and tillage measures and the abundance of specific bacterial groups related to certain soil characteristics [14].
Straw mulching had a significant impact on maize productivity through improving labile and microbial biomass carbon, and soil aggregation and moisture retention [15]. There is a lack of information on how mulching under rainfed semi-arid climatic conditions affects specific soil C fractions, including labile and dissolved carbon fractions. Limited studies compared the long-term impact of straw mulching and plastic film mulching on soil moisture contents and nutrient accumulation in rainfed semi-arid conditions. In semi-arid climates, how soil enzymes and microbial communities respond to practices is poorly documented. The current study measured the soil carbon fractions, the soil’s physicochemical properties, enzymatic activities, and microbial diversity under different organic and inorganic mulching methods. We hypothesize that the TG treatment will lead to the highest increase in microbial biomass carbon and dissolved organic carbon compared to TN and TC. This experiment aimed to compare the effects of different mulching practices on the active carbon pool, moisture retention, soil catalase, and invertase activities, as well as microbial diversity and community structure. The results of this study could enrich the theoretical research on the improvement of soil quality by mulching cultivation techniques of dryland farmland in Northwest China.

2. Materials and Methods

2.1. Site Description

The experiment was conducted in the dry farming experiment station of Gansu Agricultural University, Pingxiang Town, Tongwei County, Dingxi City, Gansu Province (35°11′ N, 105°19′ E), which is a semi-arid temperate climate with an altitude of 1750 m. This area has an average annual temperature of 7.2 °C, a yearly sunshine duration of 2100–2430 h, a frost-free period of 120–170 d, and an average annual precipitation of 339.7 mm. The weather data for the experimental year 2022 is presented in Figure S1. The soil type was loessal soil. The average bulk density of 0–200 cm soil was 1.25 g cm−3. Soil’s available nitrogen, phosphorus, and potassium contents were 5.5 g kg−1, 10.6 mg kg−1, and 107.6 mg kg−1, respectively.

2.2. Crops and Nutrient Management

The monoculture maize field experiment was started in 2017 and repeated annually in the same season. The data on soil physicochemical properties, enzymatic activities, carbon fractions, and soil microbial community were taken from the experiment in 2022. This experiment consists of four mulching treatments, including white film double furrow mulching (TW), black film double furrow mulching (TB), straw banding mulch without maize planting (TC), and straw banding mulch with maize planting (TG). Flat cropping without furrow and without mulching (TN) was used as a control for comparison. The experimental plot area was 200 m2 (20 m × 10 m), with three replications of each treatment arranged randomly in a randomized complete block design (RCBD). The plots were fertilized with 120 K hm−2 nitrogen and 120 Kg hm−2 phosphorus (P2O5) as urea and diammonium phosphate. The ridges were prepared to have a width of 60 cm, a height of 15 cm, and a distance between ridges of 50 cm. These ridges were covered with white and black film for TW and TB treatments. Similar ridges were covered with corn straw mulching belts before sowing in treatments TC and TG. The straw covers about 52,500 plants hm−2, equivalent to about 9000 Kg hm−2, equal to corn straw in 1 hm2 of dry land. Each planting belt was sown with maize with two rows in treatment TG with a plant spacing of about 33 cm. In comparison, treatment TC was maintained without sowing maize seeds. In the flat cropping plot without mulching, TN treatment was sown with maize seeds without mulching. Plantings with equal row spacing (60 cm) and plant spacing (33 cm) were maintained. The maize–wheat cropping system was adopted in this mulching field experiment. The spring maize variety of Dunyu 12 was used for maize sowing. The maize was sown in the first week of April and harvested every year in mid-October 185 days after germination to allow the crop to dry in the field. This experiment was conducted under rainfed conditions without applying an external water source.

2.3. Soil Analysis

2.3.1. Soil Sampling

The soil samples from 0 to 20 cm depth were randomly taken by a five-point sampling method with a 5 cm diameter soil drill at the start of the maize maturity stage (150 days after germination). These samples were homogeneously mixed, and plant roots, debris, and other impurities were removed. These soil samples were sieved through a 2 mm sieve and divided into two parts. The first part of the soil samples was stored in a refrigerator at −80 °C to determine the soil microbial community. The other portion was stored in a fridge at 4 °C to assess the soil’s physicochemical and biological properties.

2.3.2. Determination of Soil Physicochemical Properties

The soil’s physical properties, including bulk density, field capacity, and soil water content, were determined from soil samples in triplicate for each treatment. The ring knife method was adopted to measure soil bulk density, field capacity, and soil water content. Soil bulk density was determined using oven-dry soil mass and core volume [16]. The field capacity of the soil was determined by calculating the percentage of the difference between saturated soil and oven-dry soil, divided by dry soil weight. The gravimetric water contents and bulk density were used to determine the soil water contents. Soil pH was measured by a pH meter (Oliron 868 type) with a water/soil ratio of 2.5:1. Soil total nitrogen was determined by the micro Kjeldahl method, and C/N ratio was determined by dividing total C by total nitrogen.

2.3.3. Determination of Soil Enzymatic Activities

Soil catalase activity was determined by the potassium permanganate titration method. The soil sample (2 g) was mixed with 40 mL of distilled water. The 0.3% H2O2 (5 mL) was added for 20 min. and then reacted with 2N H2SO4 (5 mL). The solution was filtered and titrated with 0.02 M KMnO4 up to a faint pink endpoint. Soil urease activity was determined through the indophenol colorimetry method by incubating the soil with urea to produce ammonia. This ammonia is extracted with phenol and sodium hypochlorite, and the absorbance was read at 630 nm. Soil invertase enzymes were determined through 3,5-dinitrosalicylic acid colorimetry by incubating the soil with a sucrose solution. The color intensity was read at 540 nm. For dehydrogenase activity, soil samples were treated with triphenyl tetrazolium chloride and tris buffer (pH 7.4) and incubated overnight at 30 °C. The absorbance of soil extracts was read at 485 nm and the enzymatic activity is expressed per dry mass of soil. The enzymatic activities of each treatment were determined in three replications.

2.3.4. Soil Carbon Fractions Analyses

The soil samples were treated with dilute HCl (1 M) to remove carbonates. These treated soil samples were used to determine soil organic carbon, while untreated soil samples were used to determine total carbon through the elemental analyzer dry combustion method [17]. The soil-dissolved organic carbon was extracted with deionized water. The 15 g fresh soil was taken in a 50 mL centrifuge tube, and 30 mL ultrapure water was added. The soil suspension was incubated at 250 rpm for 30 min and centrifuged at 4000× g for 30 min. The supernatant was taken through a 0.45 μm filter membrane, and a total organic carbon analyzer (METASH TOC-2000 (METASH Instruments Co., Ltd., Beijing, China)) was used to determine dissolved organic carbon. The potassium permanganate oxidation method was adopted to determine the easily oxidized organic carbon. The soil microbial biomass carbon was determined by the chloroform fumigation-K2SO4 extraction method [18]. The particulate organic carbon was determined using the physical separation method. The soil samples were treated with sodium hexametaphosphate and sieved through a 53 µm mesh. The soil samples were dried, and particulate organic carbon was determined through a CN analyzer [19]. All of the soil carbon fractions were determined in three replications. The carbon stability index [20], active carbon fraction [21], labile carbon proportion, dissolved carbon proportion, labile carbon index, and microbial quotient [22] were calculated as reported by using Formulas (1)–(6).
C a r b o n   s t a b i l i t y   i n d e x = T o t a l   c a r b o n E O C E O C
A c t i v e   c a r b o n   f r a c t i o n = M B C T o t a l   c a r b o n × 100
L a b i l e   c a r b o n   p r o p o r t i o n = E O C T o t a l   c a r b o n × 100
D i s s o l v e d   c a r b o n   p r o p o r t i o n = D O C T o t a l   c a r b o n × 100
L a b i l e   c a r b o n   i n d e x = E O C S O C × 100
M i c r o b i a l   q u o t i e n t = M B C S O C × 100

2.4. Determination of Microbial Community

Soil DNA Extraction, Amplification, and Sequencing

Soil DNA from three replications of each treatment was extracted using the E. Z. N. A.® Soil DNA Kit soil kit from Omega Bio-Tek, USA (Norcross, GA, USA). The purity, concentration, and integrity of DNA were tested after extraction. NanoDrop2000 (Thermo Fisher Scientific Inc., Waltham, MA, USA) was used for DNA purity and concentration detection, and 1% agarose gel electrophoresis was used for DNA integrity detection. The voltage was 5 V/cm, and the time was 20 min. The samples with DNA purity, concentration, and integrity up to the standard were subjected to the amplification of the highly variable region in the V3–V4 region using bacterial 16S rDNA amplification primers. The upstream primer was 338F: ACTCCTACGGGAGGCAGCAG, and the downstream primer was 806R: GGACTACHVGGTWTCTAAT. For the fungal community, the ITS1 region was amplified using forward primer ITS1F (5′-CTTGGTCATTTAGAGGAAGTAA-3) and reverse primer ITS2R (5′-GCTGCGTTCTTCATCGATGC-3). The PCR reaction conditions were 35 cycles of initial denaturation at 95 °C for 3 min, denaturation at 95 °C for 30 s, annealing at 55 °C for 30 min, annealing at 72 °C for 45 s, and extension at 72 °C for 10 min. and heat preservation at 4 °C. After further identification, purification, quantification, and homogenization of PCR products, PE library construction, and Illumina sequencing were performed. The NEXTFLEX Rapid DNA-Seq Kit v2.0was used to build the library, and the Miseq PE300 platform (Illumina, San Diego, CA, USA) was used for sequencing (Shanghai Microbiological Pharmaceutical Technology Co., Ltd. Shanghai, China). The original sequencing sequence of Trimmomatic software v0.39 was used for quality control, and FLASH software was used for splicing. The 97% similarity of operational taxonomic units (OTUs) sequences were clustered using UPARSE software (version 7.1; http://drive5.com/uparse/, accessed on 1 January 2025), and chimeric sequences were trimmed using UCHIME software. The RDP classifier algorithm was used to annotate the species classification of each 16S rRNA sequence and ITS sequence, and the Silva database (SSU128; Release132) was compared.

2.5. Statistical and Bioinformatics Analysis

Soil physicochemical, enzymatic activities, and soil carbon fractions data in triplicate under mulching practices were statistically analyzed through the software Statistix 8.1 using a one-way analysis of variance through the Duncan test. The data were presented in bar graphs along with alphabetical letters to compare the treatment means for their significance at p ≤ 0.05. The standard error (SE) was generated by employing a formula in MS Excel, and the SE bar was employed on the bar figure of the treatment. The normality of assumption was assessed with the Shapiro–Wilk test through the software Statistix 8.1. The homogeneity of variance was tested through Levene’s test using SPSS 16.0. For variables where the Shapiro–Wilk test indicated a significant deviation from normality (p < 0.05), the non-parametric Kruskal–Wallis test was conducted to compare groups to ensure valid comparisons in the absence of normal data distribution.
The microbial community data in triplicate were analyzed through various bioinformatics tools. The UPARSE v7.1 software (http://drive5.com/uparse/, accessed on 1 January 2025) was used to cluster the sequences according to 97% similarity. The UCHIME software was used to eliminate chimera sequences. The RDP classifier was used to annotate each sequence, and the comparison threshold was set to 70% by comparing the Silva database (SSU128). Microbial α-diversity was evaluated by analyzing the Chao1 and Shannon indices through Mothur v1.30.1 using the phyloseq R package http://www.mothur.org/, accessed on 1 January 2025). For beta diversity, bon-metric multidimensional scaling (NMDS) and principal coordinate analysis (PCoA) based on Bray–Curtis dissimilarity matrices were performed through R v2.1.3 using the vegan R package to limit the dimensions of the original variables. Group differences in beta diversity were evaluated using PERMANOVA. The LDA coupled with LEfSe analysis was performed through LEfSe software (http://galaxy.biobakery.org/, accessed on 1 January 2025) to search for statistically different biomarkers between applied mulching practices. The relationship between soil microbial community structures and soil attributes was analyzed using the Spearman correlation heatmap using the pheatmap-based R package. The vegan package and ggplot2 were used for redundancy analysis (RDA) to identify the correlation between microbial community composition and soil properties. The variables were standardized (z-score transformation: mean = 0, SD = 1) before RDA to ensure comparability across variables measured in different units. To explore functional metabolic pathway variation among the microbial communities, we conducted PCA on pathway abundance data derived from functional annotations by standardizing data using z-score normalization to ensure uniform scaling across variables. The PCA was performed using the software OriginPro v. 2024, and the percentage of variance explained by each principal component was recorded.
Permutational multivariate analysis of variance (PERMANOVA) was employed to assess the effect of grouping factors on microbial community traits, including bacterial and fungal abundance and functional diversity. The analysis was conducted using the MajorBio Cloud Platform (https://www.majorbio.com/, accessed on 1 January 2025), a web-based bioinformatics tool designed for high-throughput microbiome data analysis. Community dissimilarities were calculated using the Bray–Curtis distance metric, which is suitable for ecological count data and emphasizes compositional differences between samples. The PERMANOVA test was performed using a single-factor design to evaluate whether the centroids (i.e., multivariate means) of predefined groups differed significantly in multivariate space. For each trait, the results were generated in the form of a sum of squares (SS), mean square (MS), F-value (F.Model), coefficient of determination (R2), and a p-value (Pr(>F)) computed via 999 permutations of the data. A significance threshold of p < 0.05 was used to determine statistically significant differences among groups.

3. Results

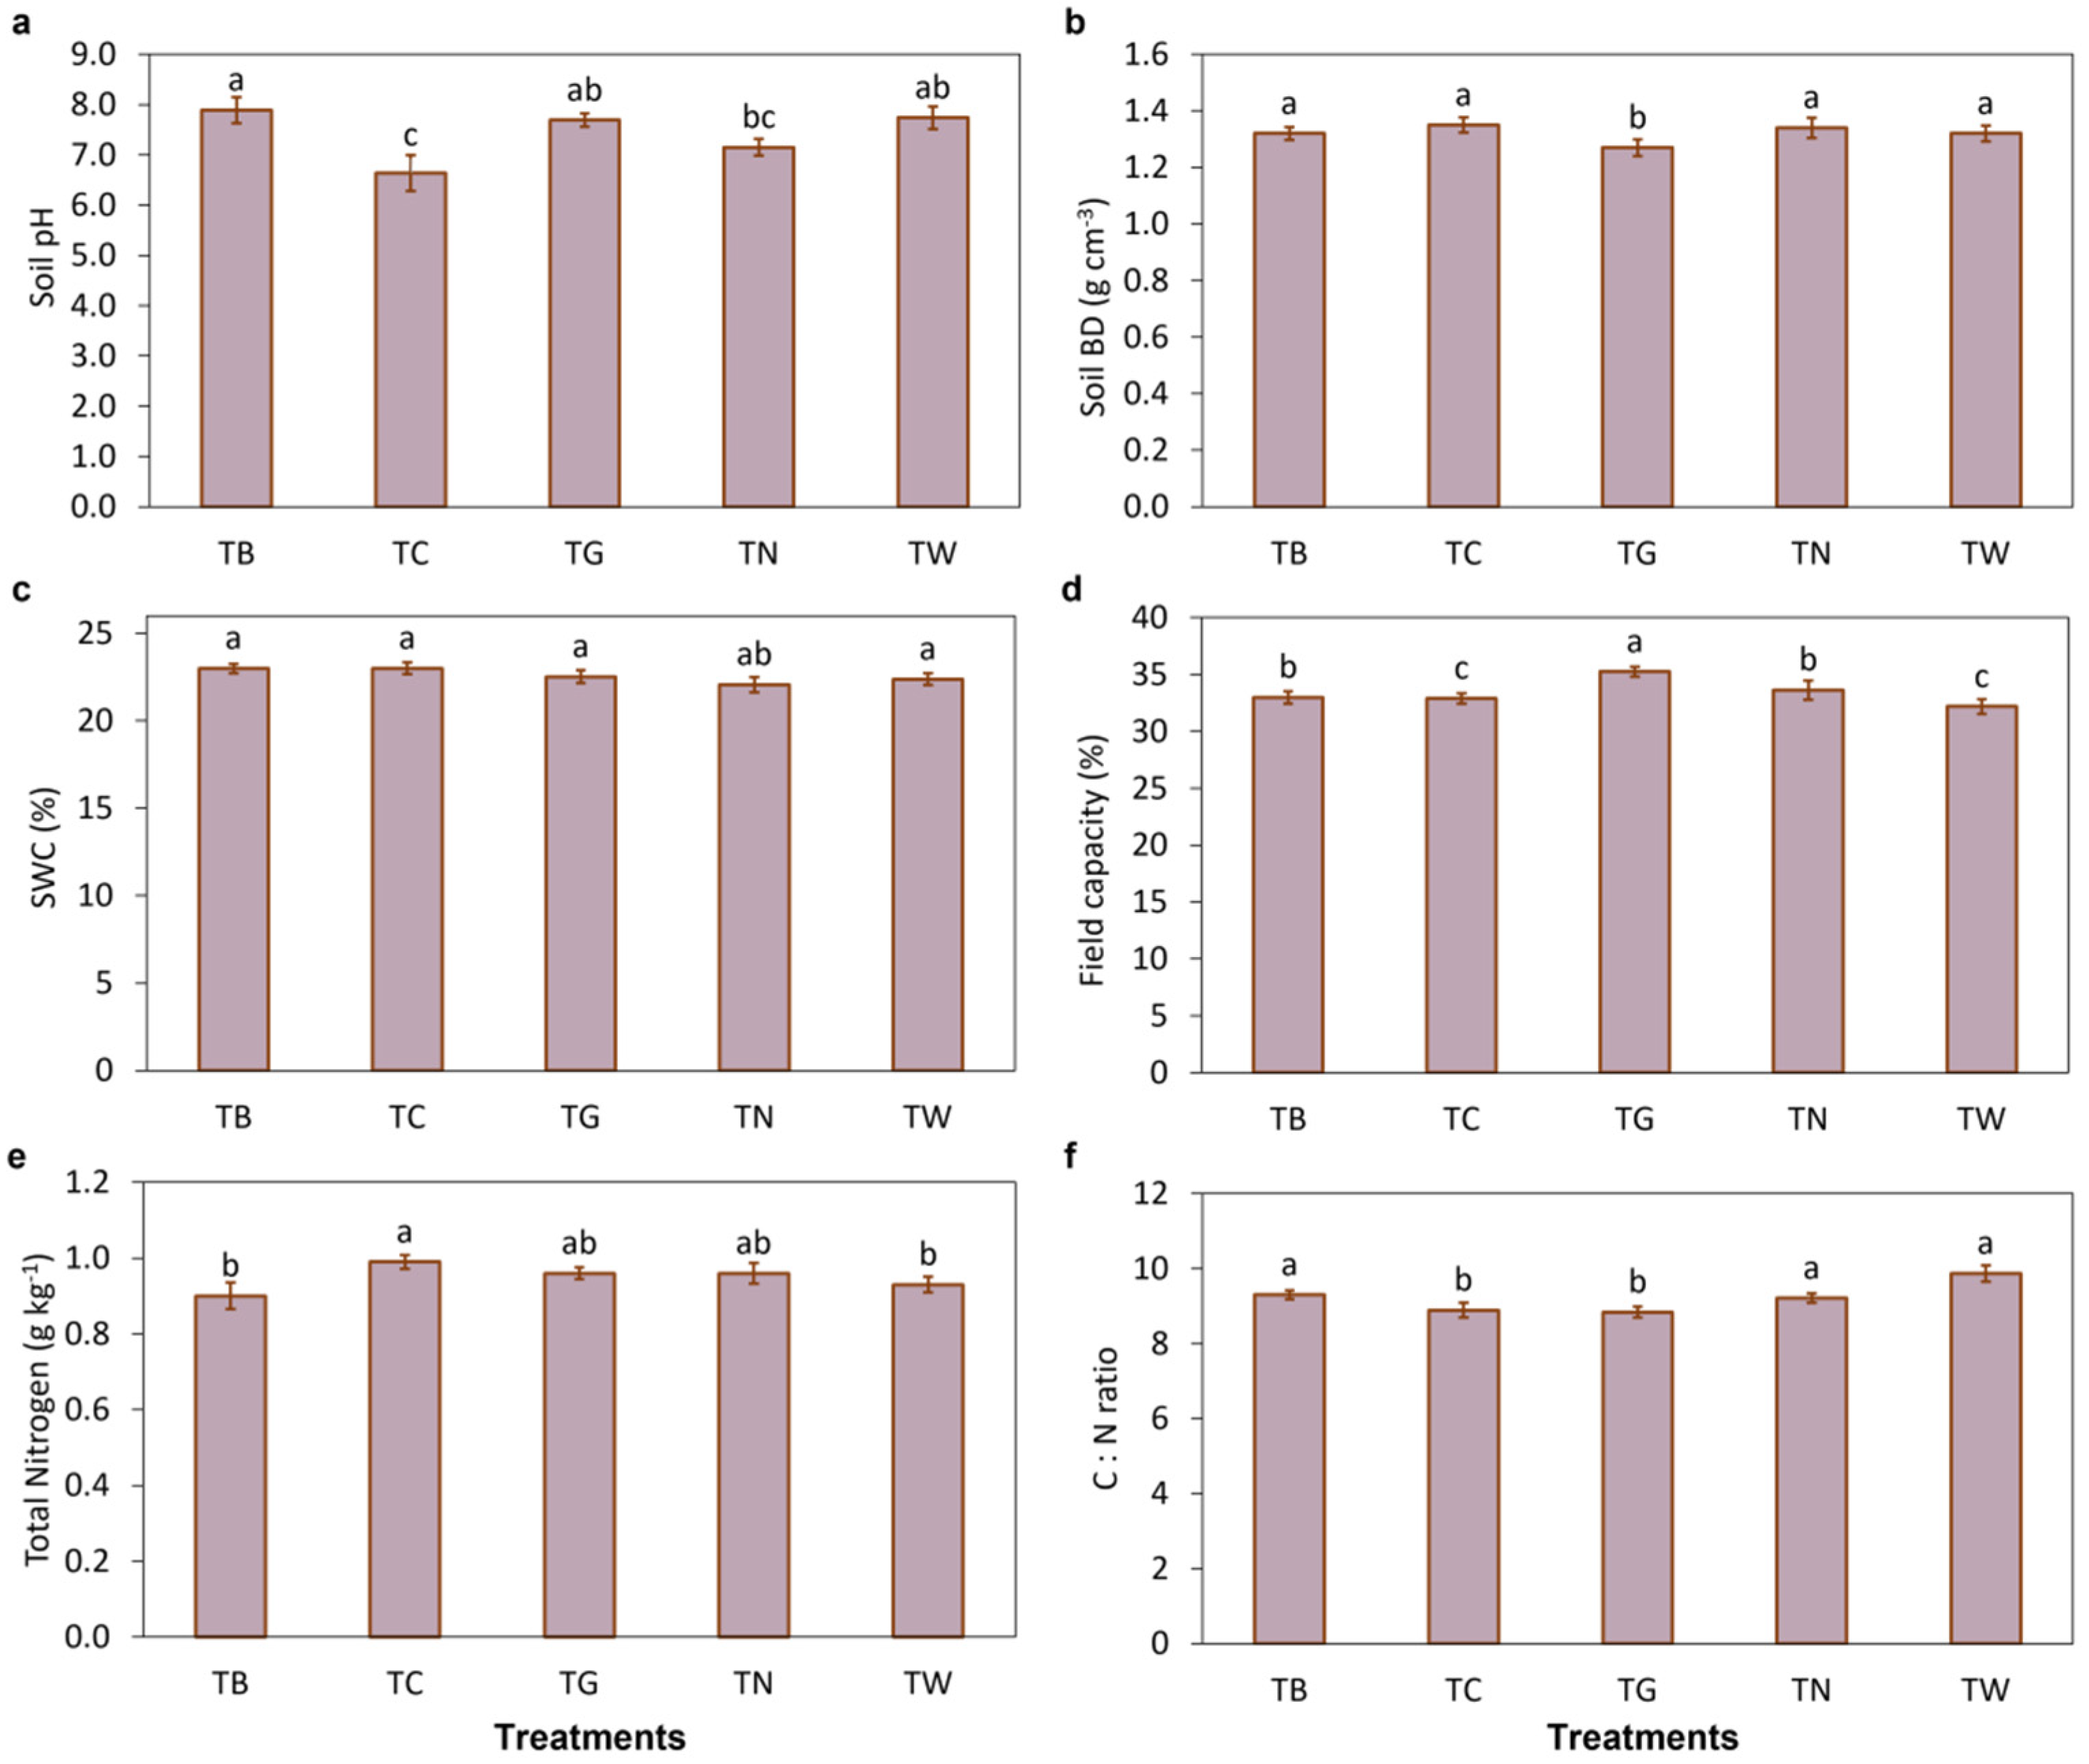
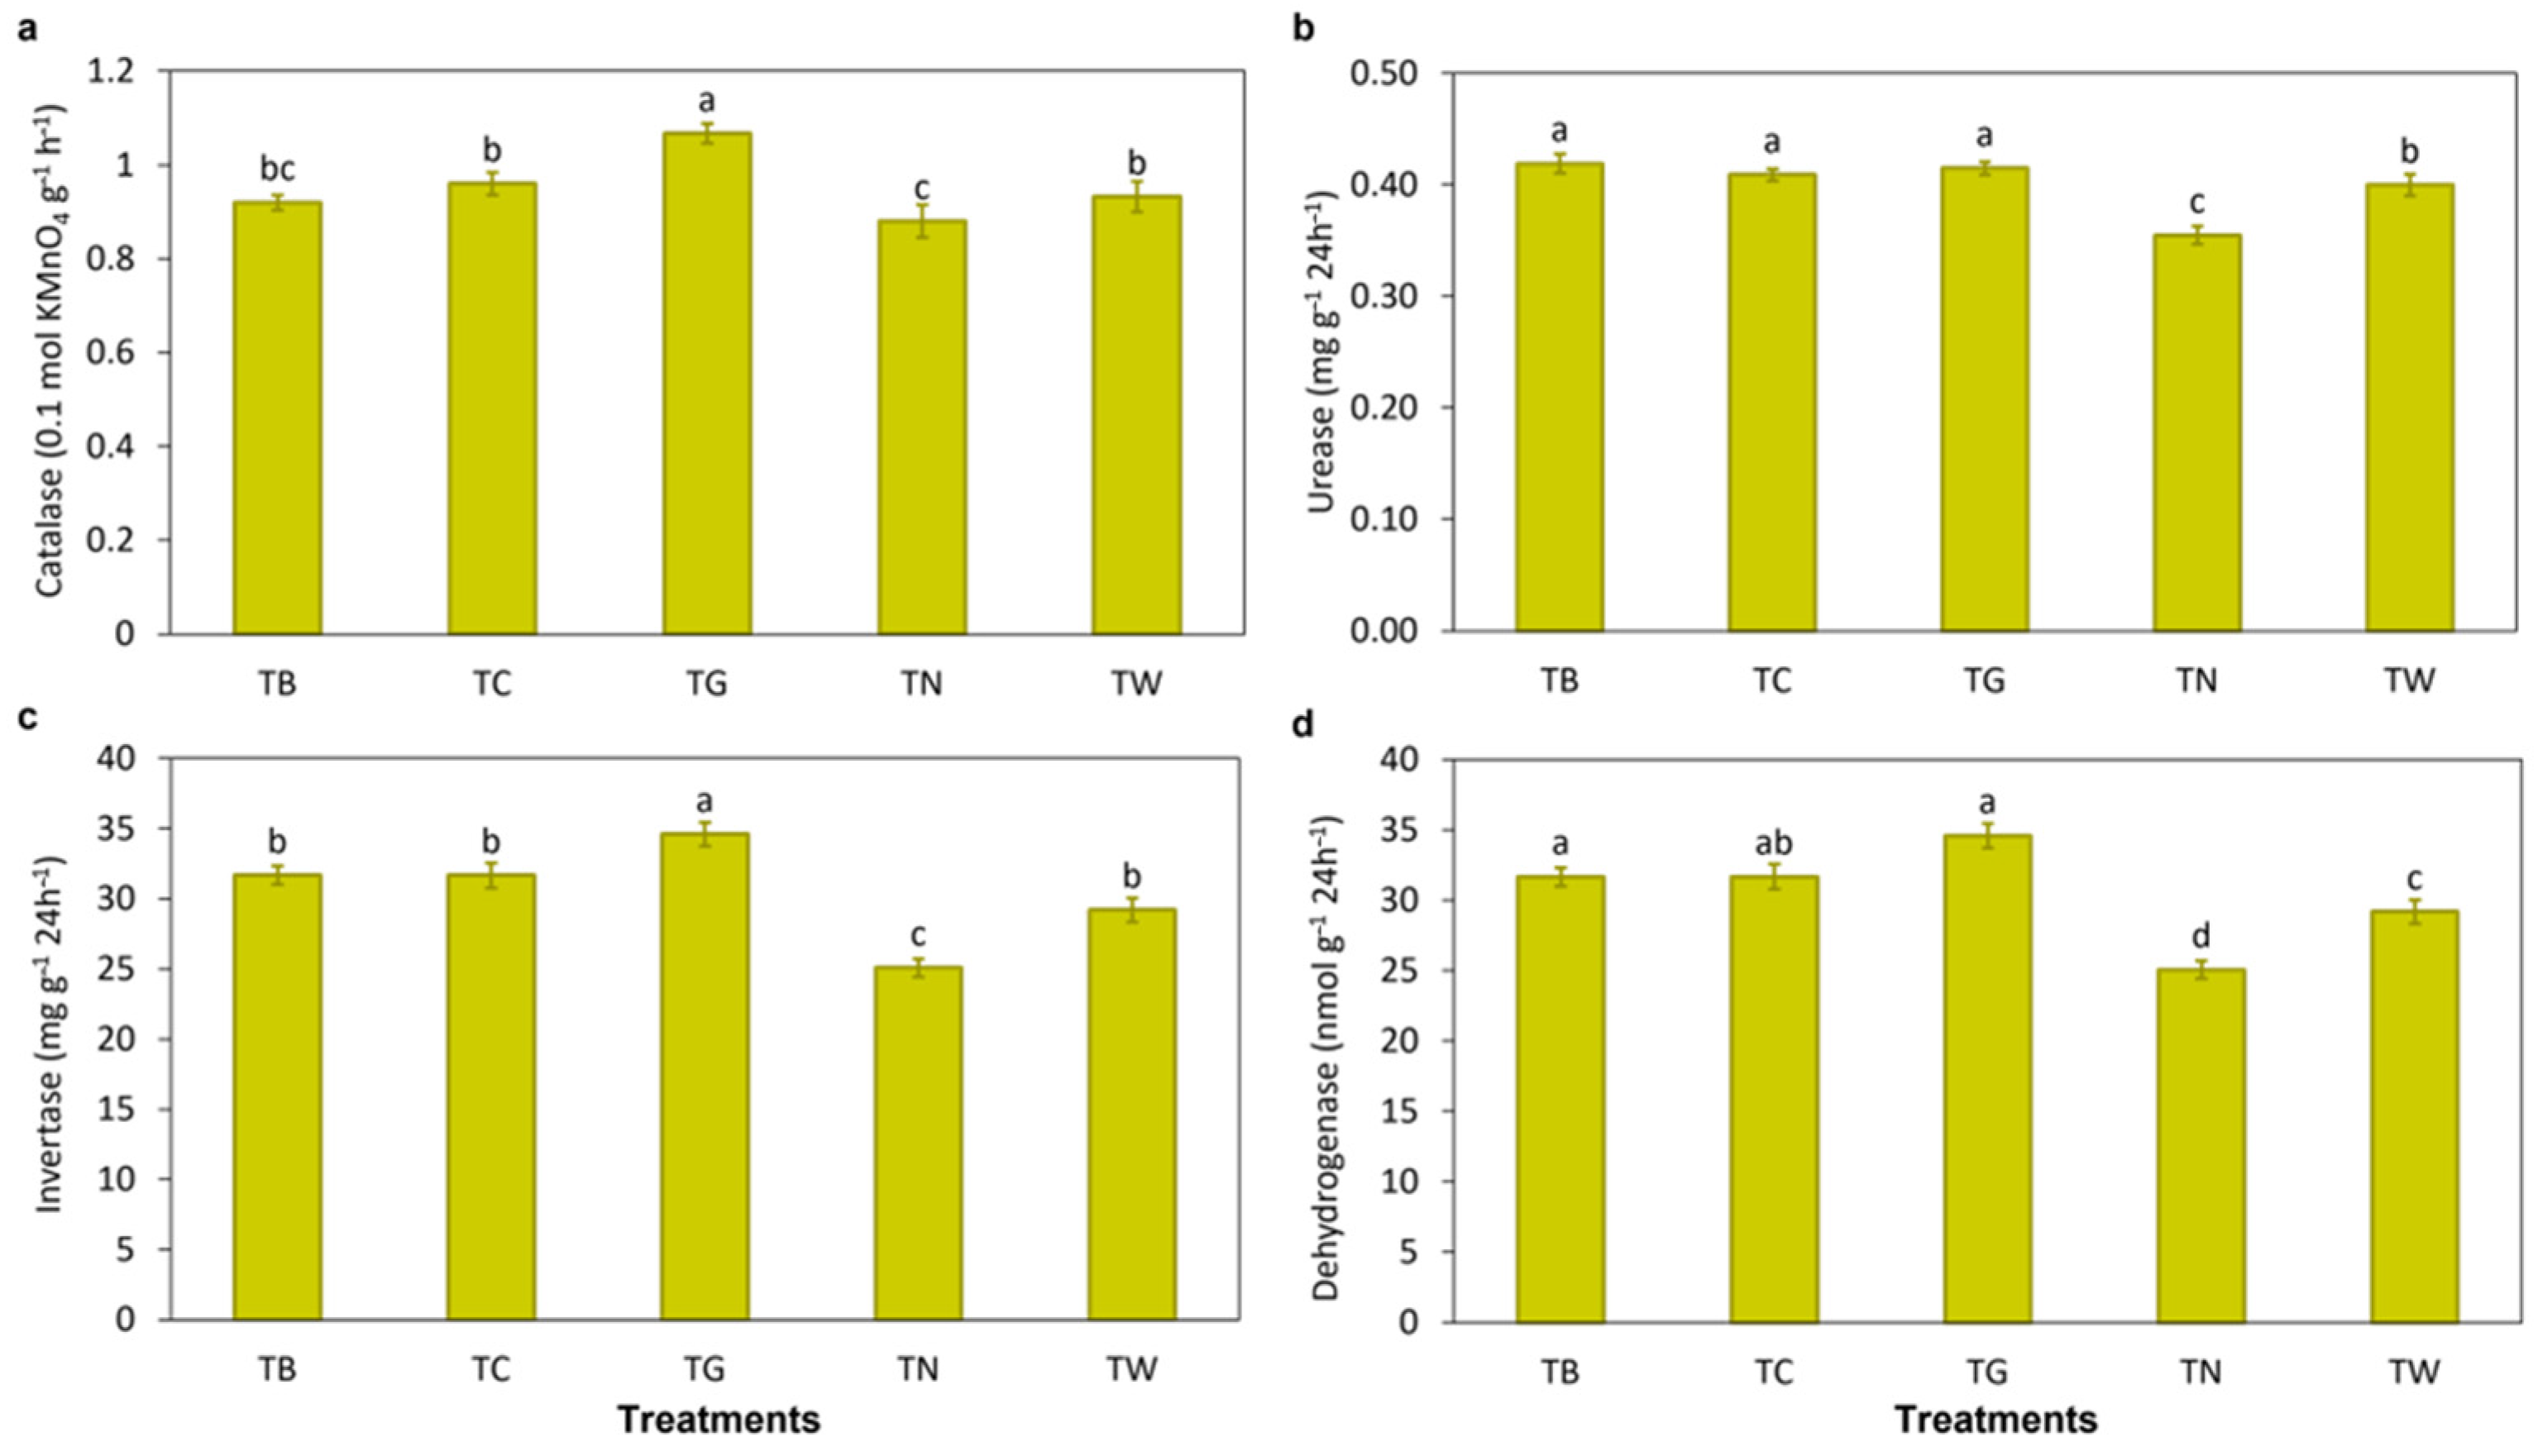
3.1. Effects of Mulching Practices on Soil Characteristics and Enzymatic Activities

The results of the Shapiro–Wilk and Levene’s tests (Table 1) indicated that invertase and sucrase activities met the assumptions of both normality and the homogeneity of variances, validating the use of ANOVA and supporting their statistically significant differences among groups (p = 0.0002 and p = 0.0149, respectively). Field capacity, total nitrogen, and the C/N ratio also satisfied these assumptions; however, only the C/N ratio exhibited significant group differences (p = 0.0184), while total nitrogen and field capacity did not (p = 0.2296 and p = 0.3583, respectively). Soil pH, urease, and particularly catalase activity violated the assumption of normality (p < 0.05), with catalase also showing significant heterogeneity of variances (p = 0.003). Soil water content and bulk density were normally distributed (Shapiro–Wilk p > 0.05). Still, they failed the Levene’s test for equal variances (p = 0.043 and p = 0.017, respectively), suggesting that ANOVA assumptions were partially violated. Several carbon-related indicators, including total carbon, soil organic carbon, dissolved organic carbon, and microbial biomass carbon, also demonstrated significant differences (p < 0.01) despite various departures from normality or variance homogeneity, reinforcing the need for non-parametric validation. In a non-parametric Kruskal–Wallis test, significant group differences were observed in catalase activity, invertase activity, sucrase activity, total carbon, soil organic carbon, dissolved organic carbon, microbial biomass carbon, and other labile carbon fractions (p < 0.05).
Different mulching measures significantly influenced soil pH (Figure 1a). Treatment TC had a higher reduction in soil pH, 7%, than TN, while TB, TC, and TW were less effective in reducing soil pH. The lowest soil bulk density was obtained from treatment TG, with a decrease of 5% compared to TN (Figure 1b). The treatment of TB had the highest increase in soil water content, 4%, compared to TN (Figure 1c). TG treatment reported the highest increase of 5% in field capacity, compared to TN, while TW had the lowest field capacity (Figure 1d). TC treatment had the highest total nitrogen with a 3% increase compared to TN (Figure 1e). The highest C/N ratio was 7% higher due to TW treatment over TN treatment (Figure 1f). The highest catalase activity was observed in TG, followed by TC, with an increase of 21% and 9% compared to TN treatment (Figure 2a). The urease activity in treatments TB, TC, and TG had the highest increase of 18%, 15%, and 17% over TN treatments (Figure 2b). The sucrase content of TG treatment was the highest, which increased by 38% compared with TN (Figure 2c). TG also promoted dehydrogenase activities by up to 31% compared to TN treatments (Figure 2d).

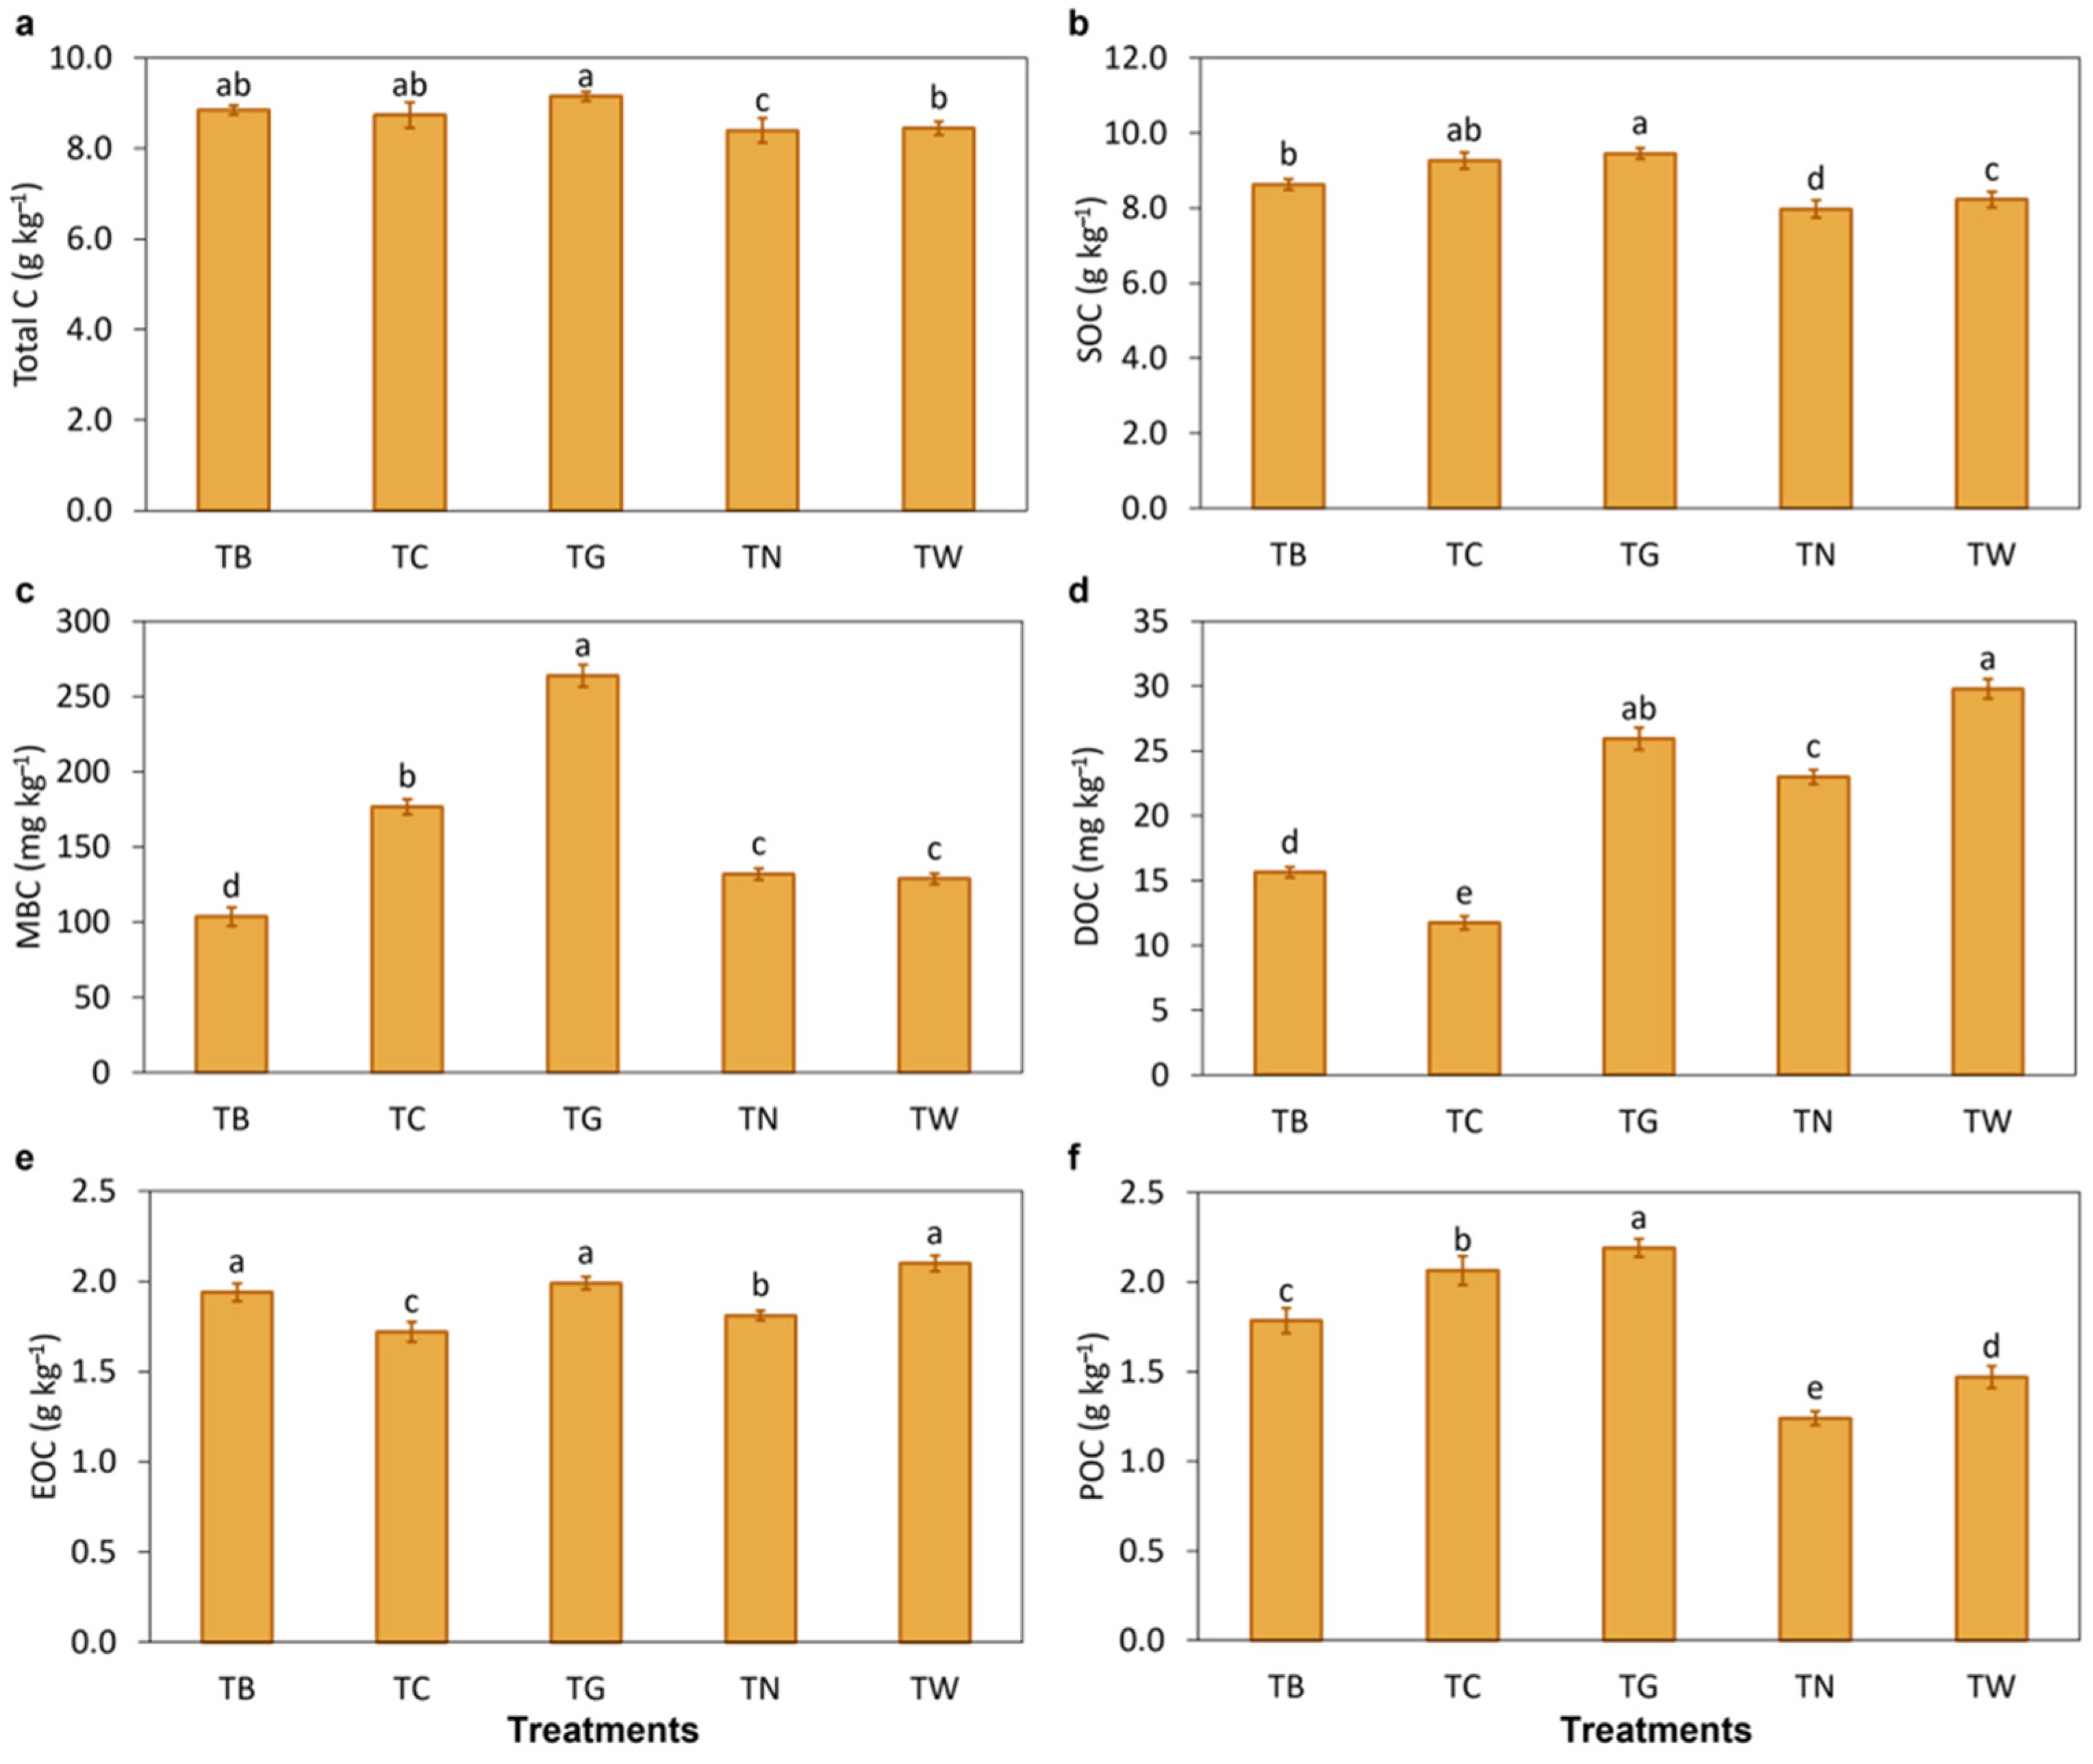
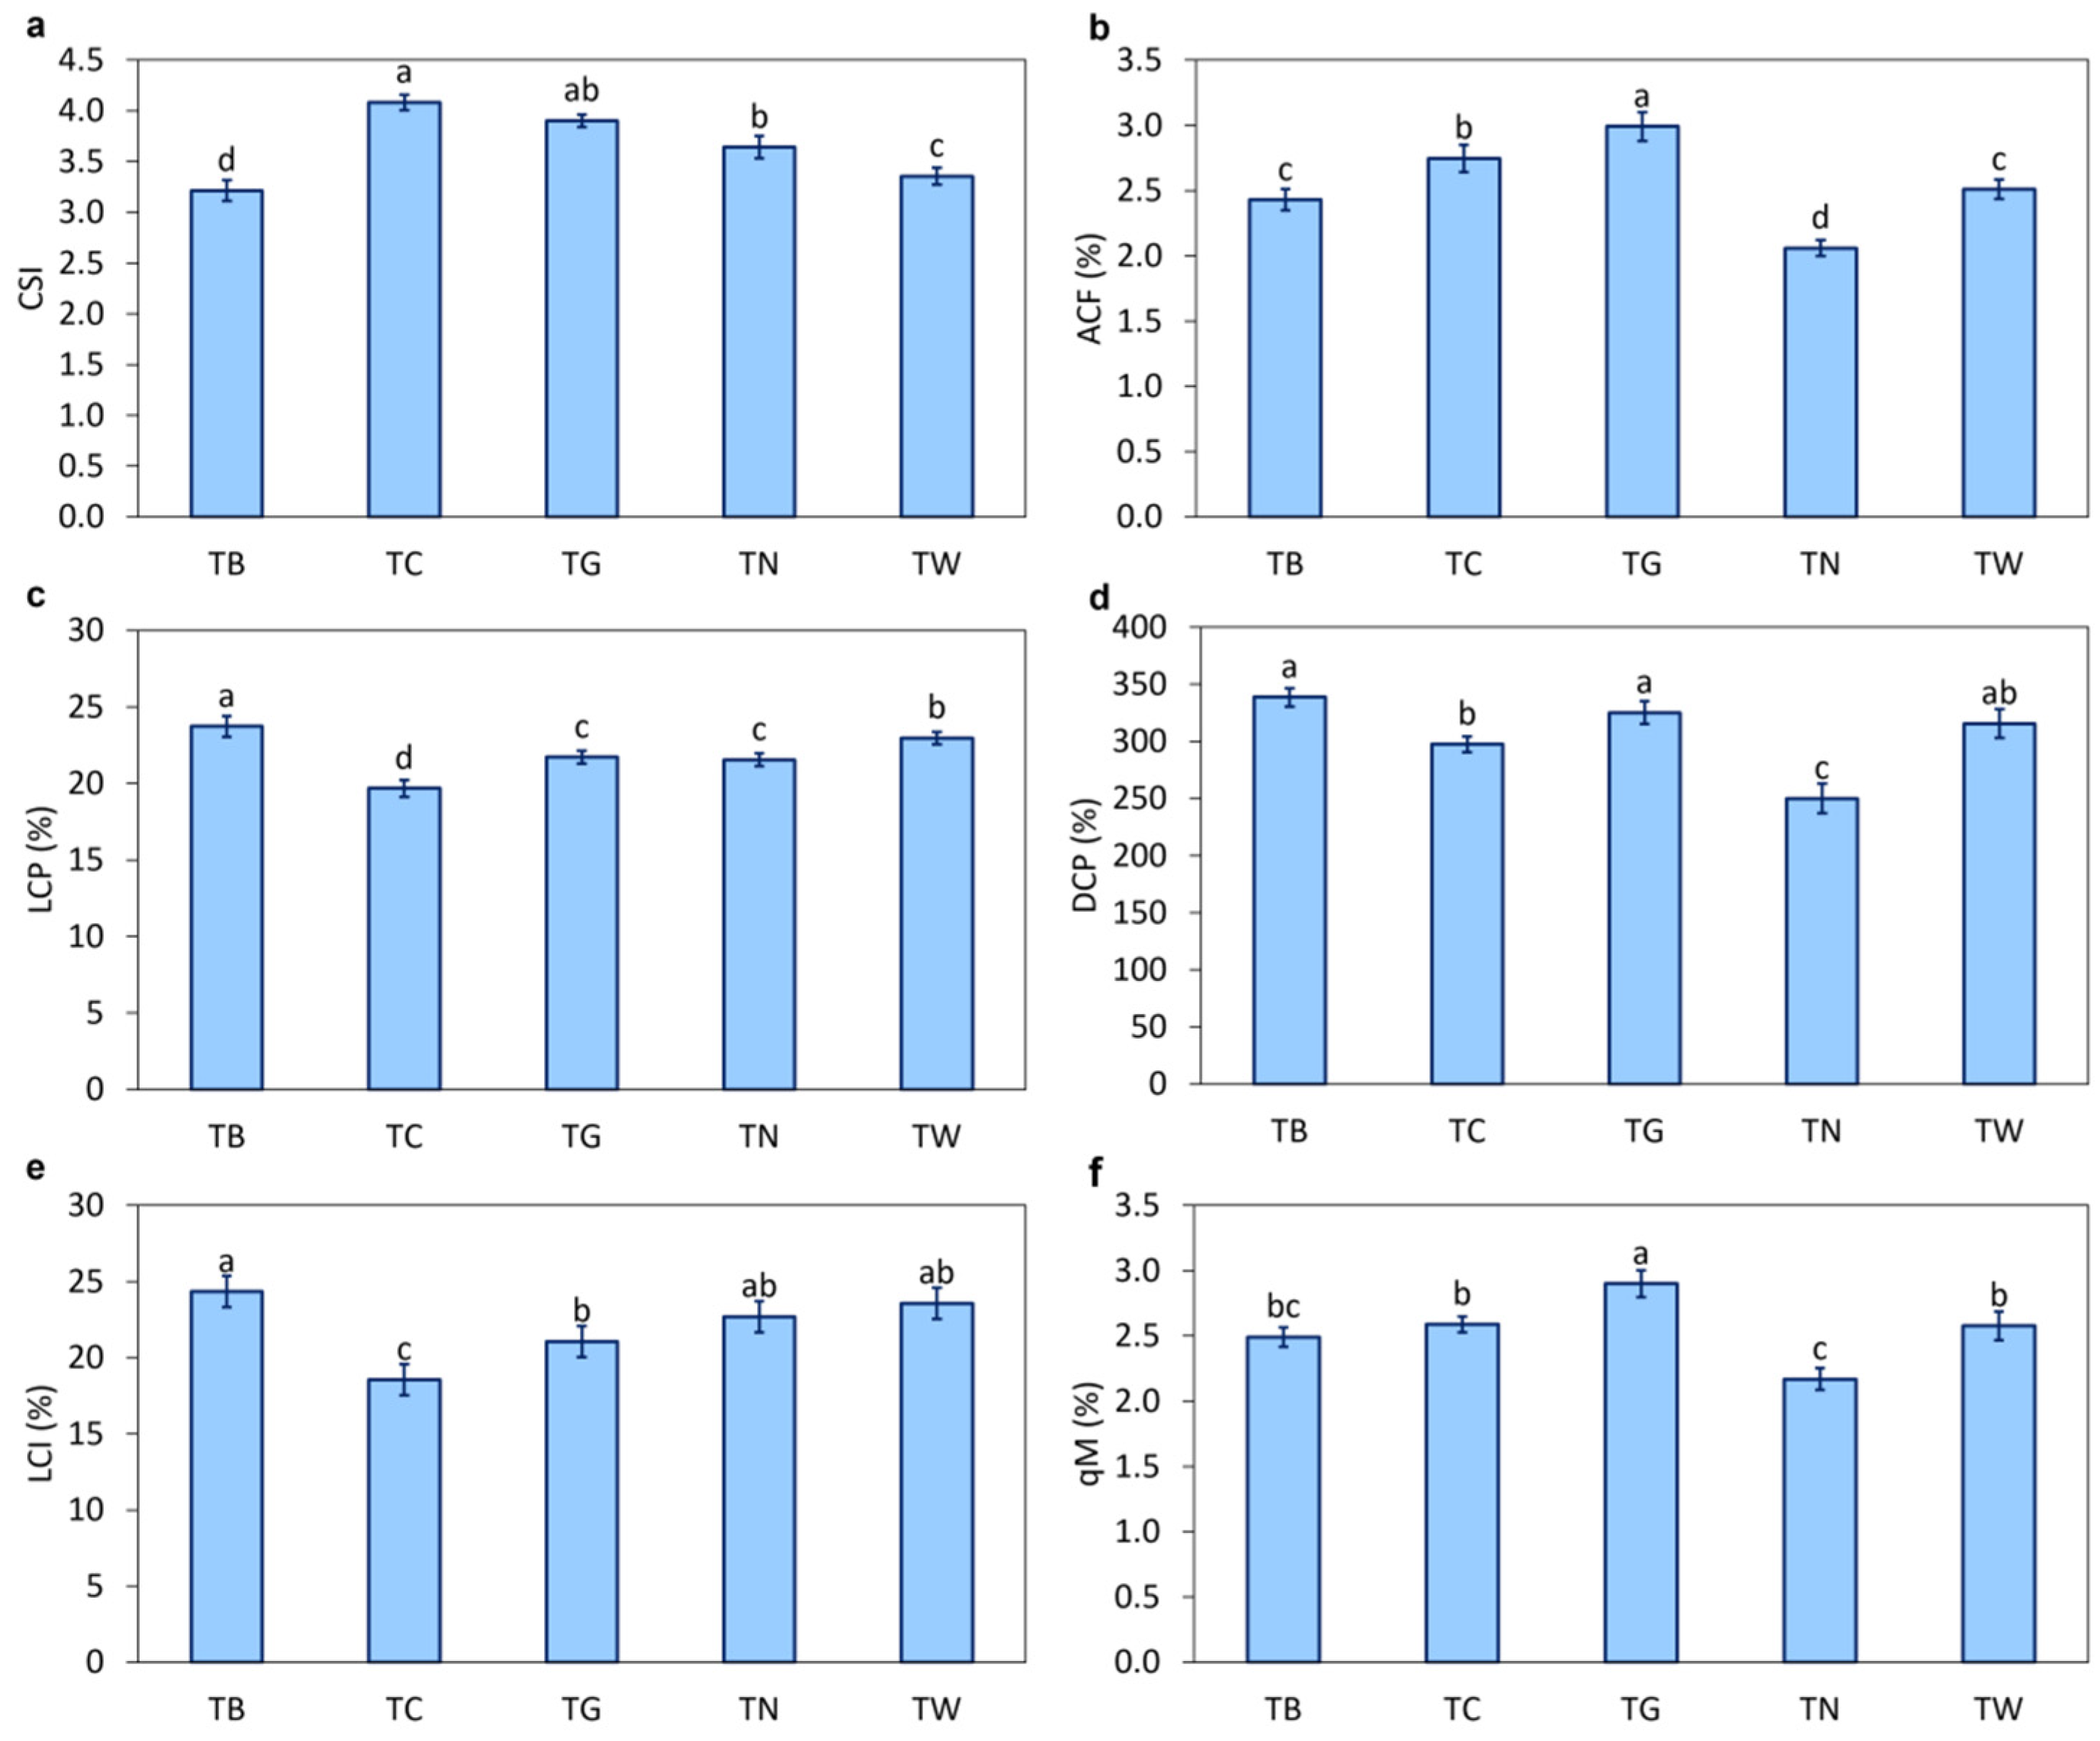
3.2. Effects of Mulching Practices on Soil Carbon Fractions

The soil carbon-related traits met the assumptions of normality and the homogeneity of variances, supporting the validity of the ANOVA outcomes (Table 1). Soil organic carbon, microbial biomass carbon, dissolved organic carbon, particulate organic carbon, and active carbon fraction were normally distributed with homogeneous variances and showed highly significant differences among groups, indicating strong treatment effects. Total carbon and easily oxidizable carbon approached the threshold for normality and had unequal variances, suggesting that ANOVA results for these variables should be interpreted with caution or verified using ANOVA.
Treatment TG promoted total C up to 9% compared to TN (Figure 3a). Treatment TG and TC reported the highest increase of 19% and 16% in soil organic carbon compared to treatment TN (Figure 3b). Treatments TG and TC increased microbial biomass carbon content by up to 100% and 34% compared with TN treatment (Figure 3c). The dissolved organic carbon content of the TW and TG treatments was 30% and 13% higher than that of the TN treatment (Figure 3d). TB, TG, and TW treatments had the highest easily oxidized organic carbon contents, with an increase of 7%, 10%, and 16% compared to TC (Figure 3e). TG treatment had 77% more particulate organic carbon than TN treatment (Figure 3f). The mulching practices also showed improvement in carbon fraction-derived attributes. Treatments TC and TG had 12% and 7% more carbon stability index than TN (Figure 4a). The highest increase in active carbon fraction and microbial quotient, by 45% and 34%, were observed from treatment TG compared to TN treatment (Figure 4b,f). Treatment TB followed by TW showed an increase of 10% and 7% in labile carbon proportion over TN treatment (Figure 4c). The highest dissolved carbon proportion was obtained from treatments TB, TG, and TW, with increases of 36%, 30%, and 26%, respectively, compared to TN (Figure 4d). The labile carbon index was more elevated in the treatment of TB, followed by TW and TN (Figure 4e). The TB had a 7% more labile carbon index than the TN treatment.

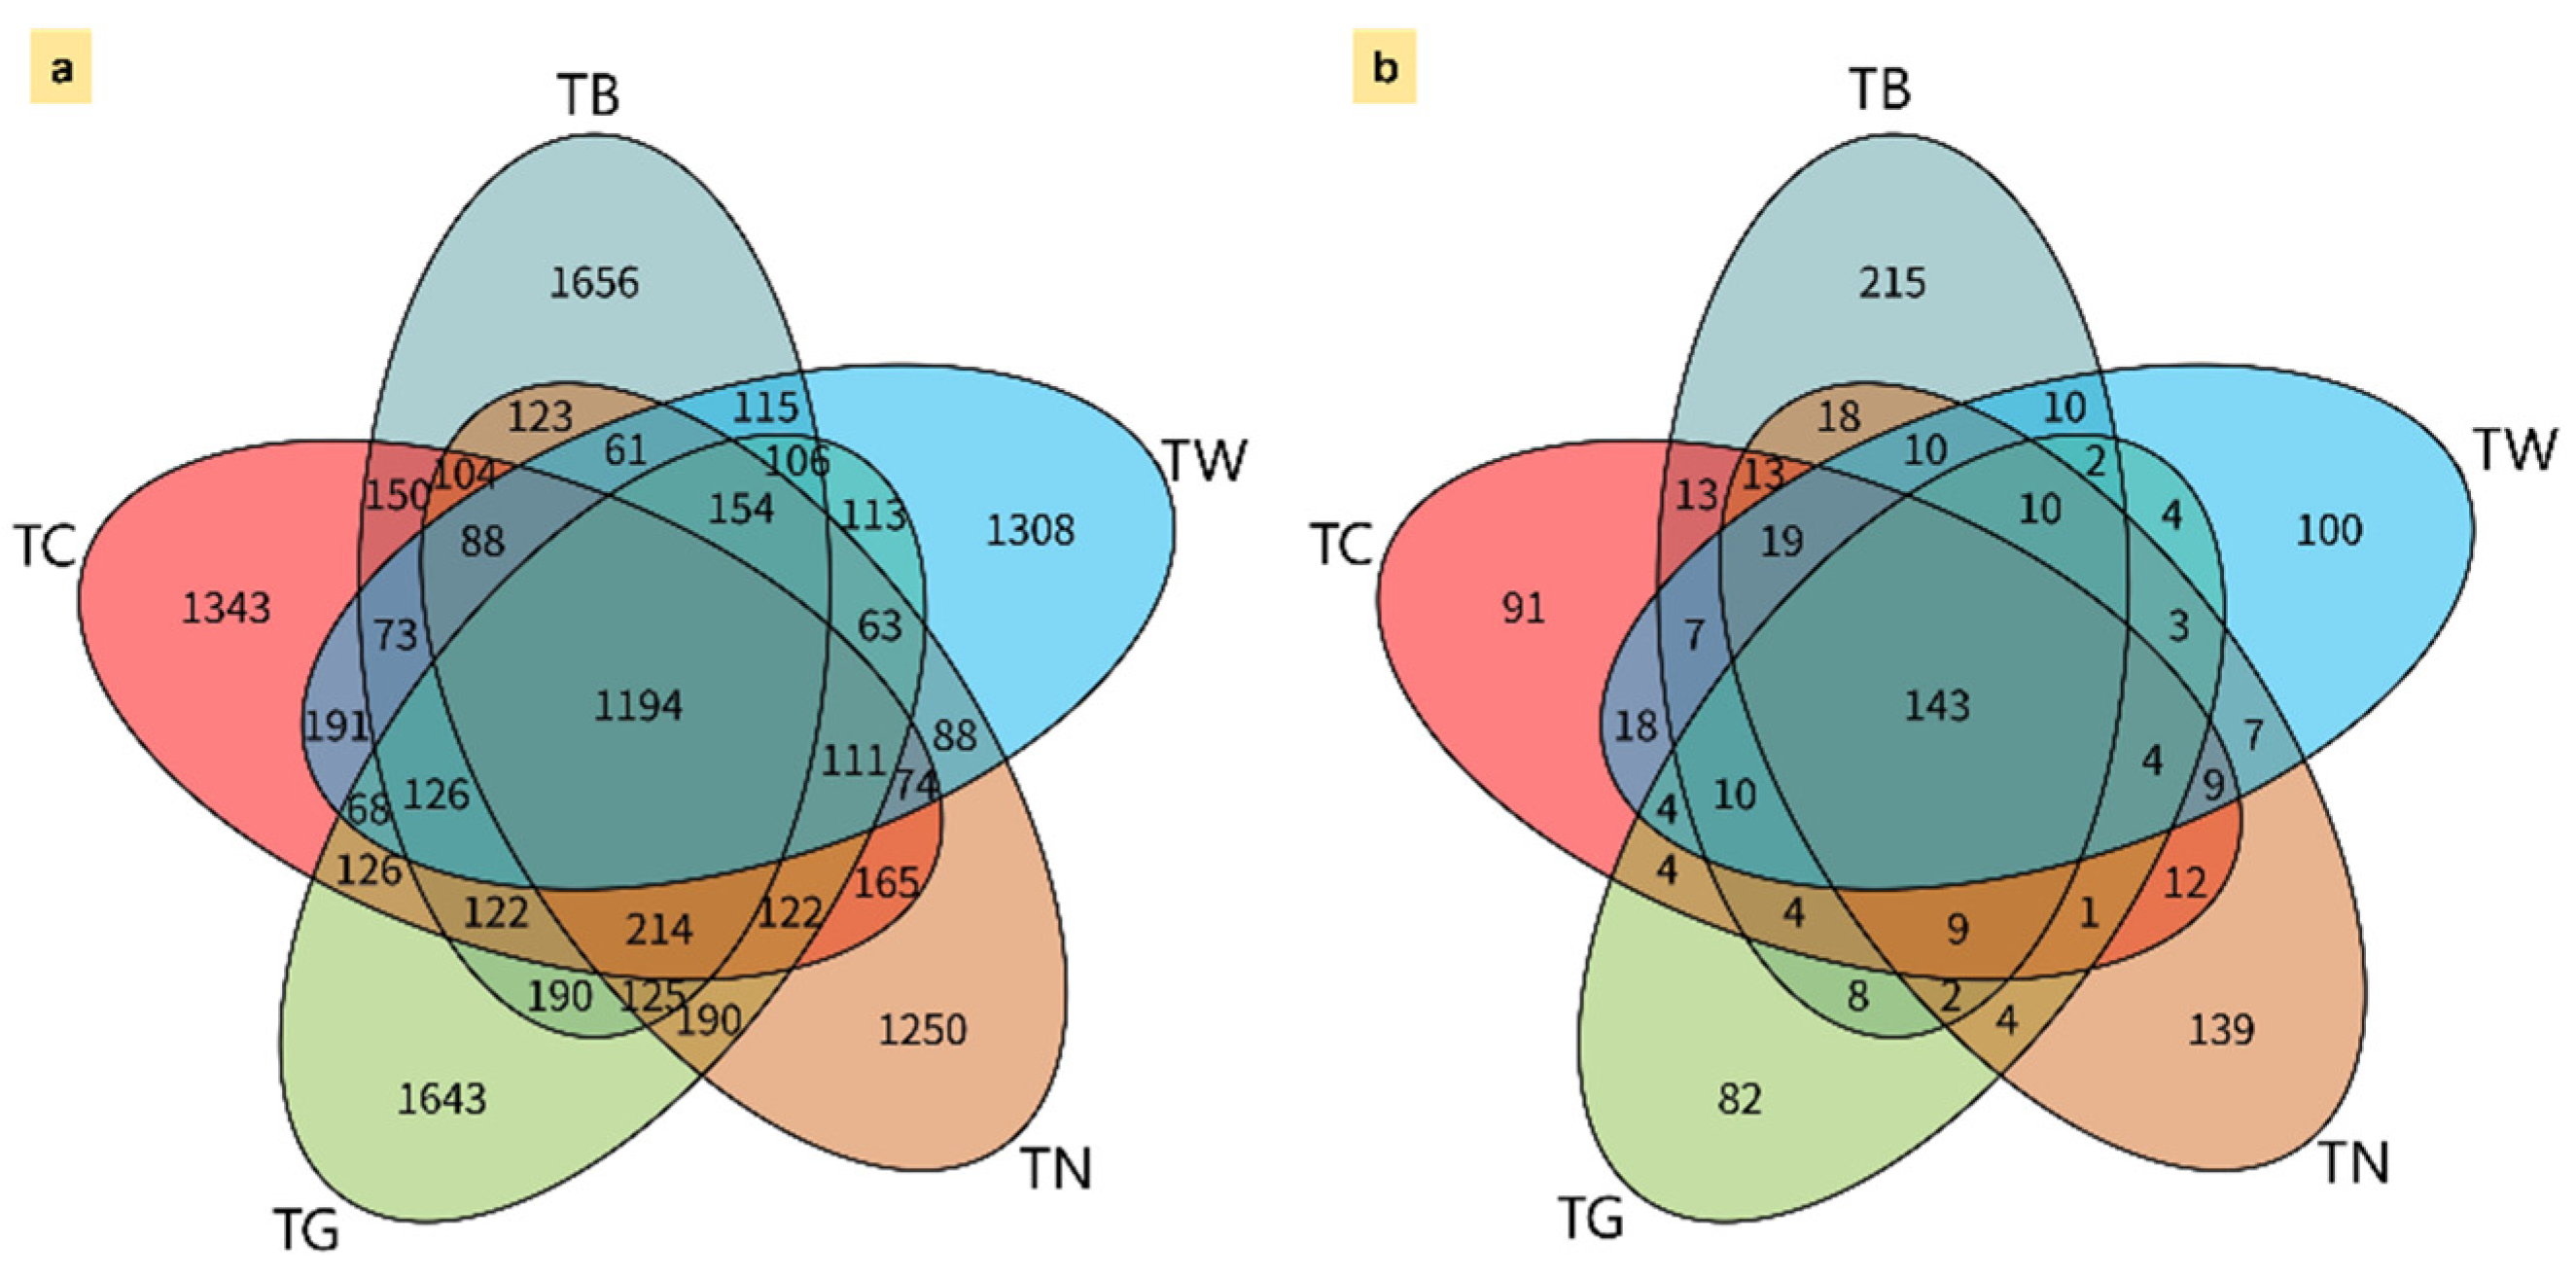
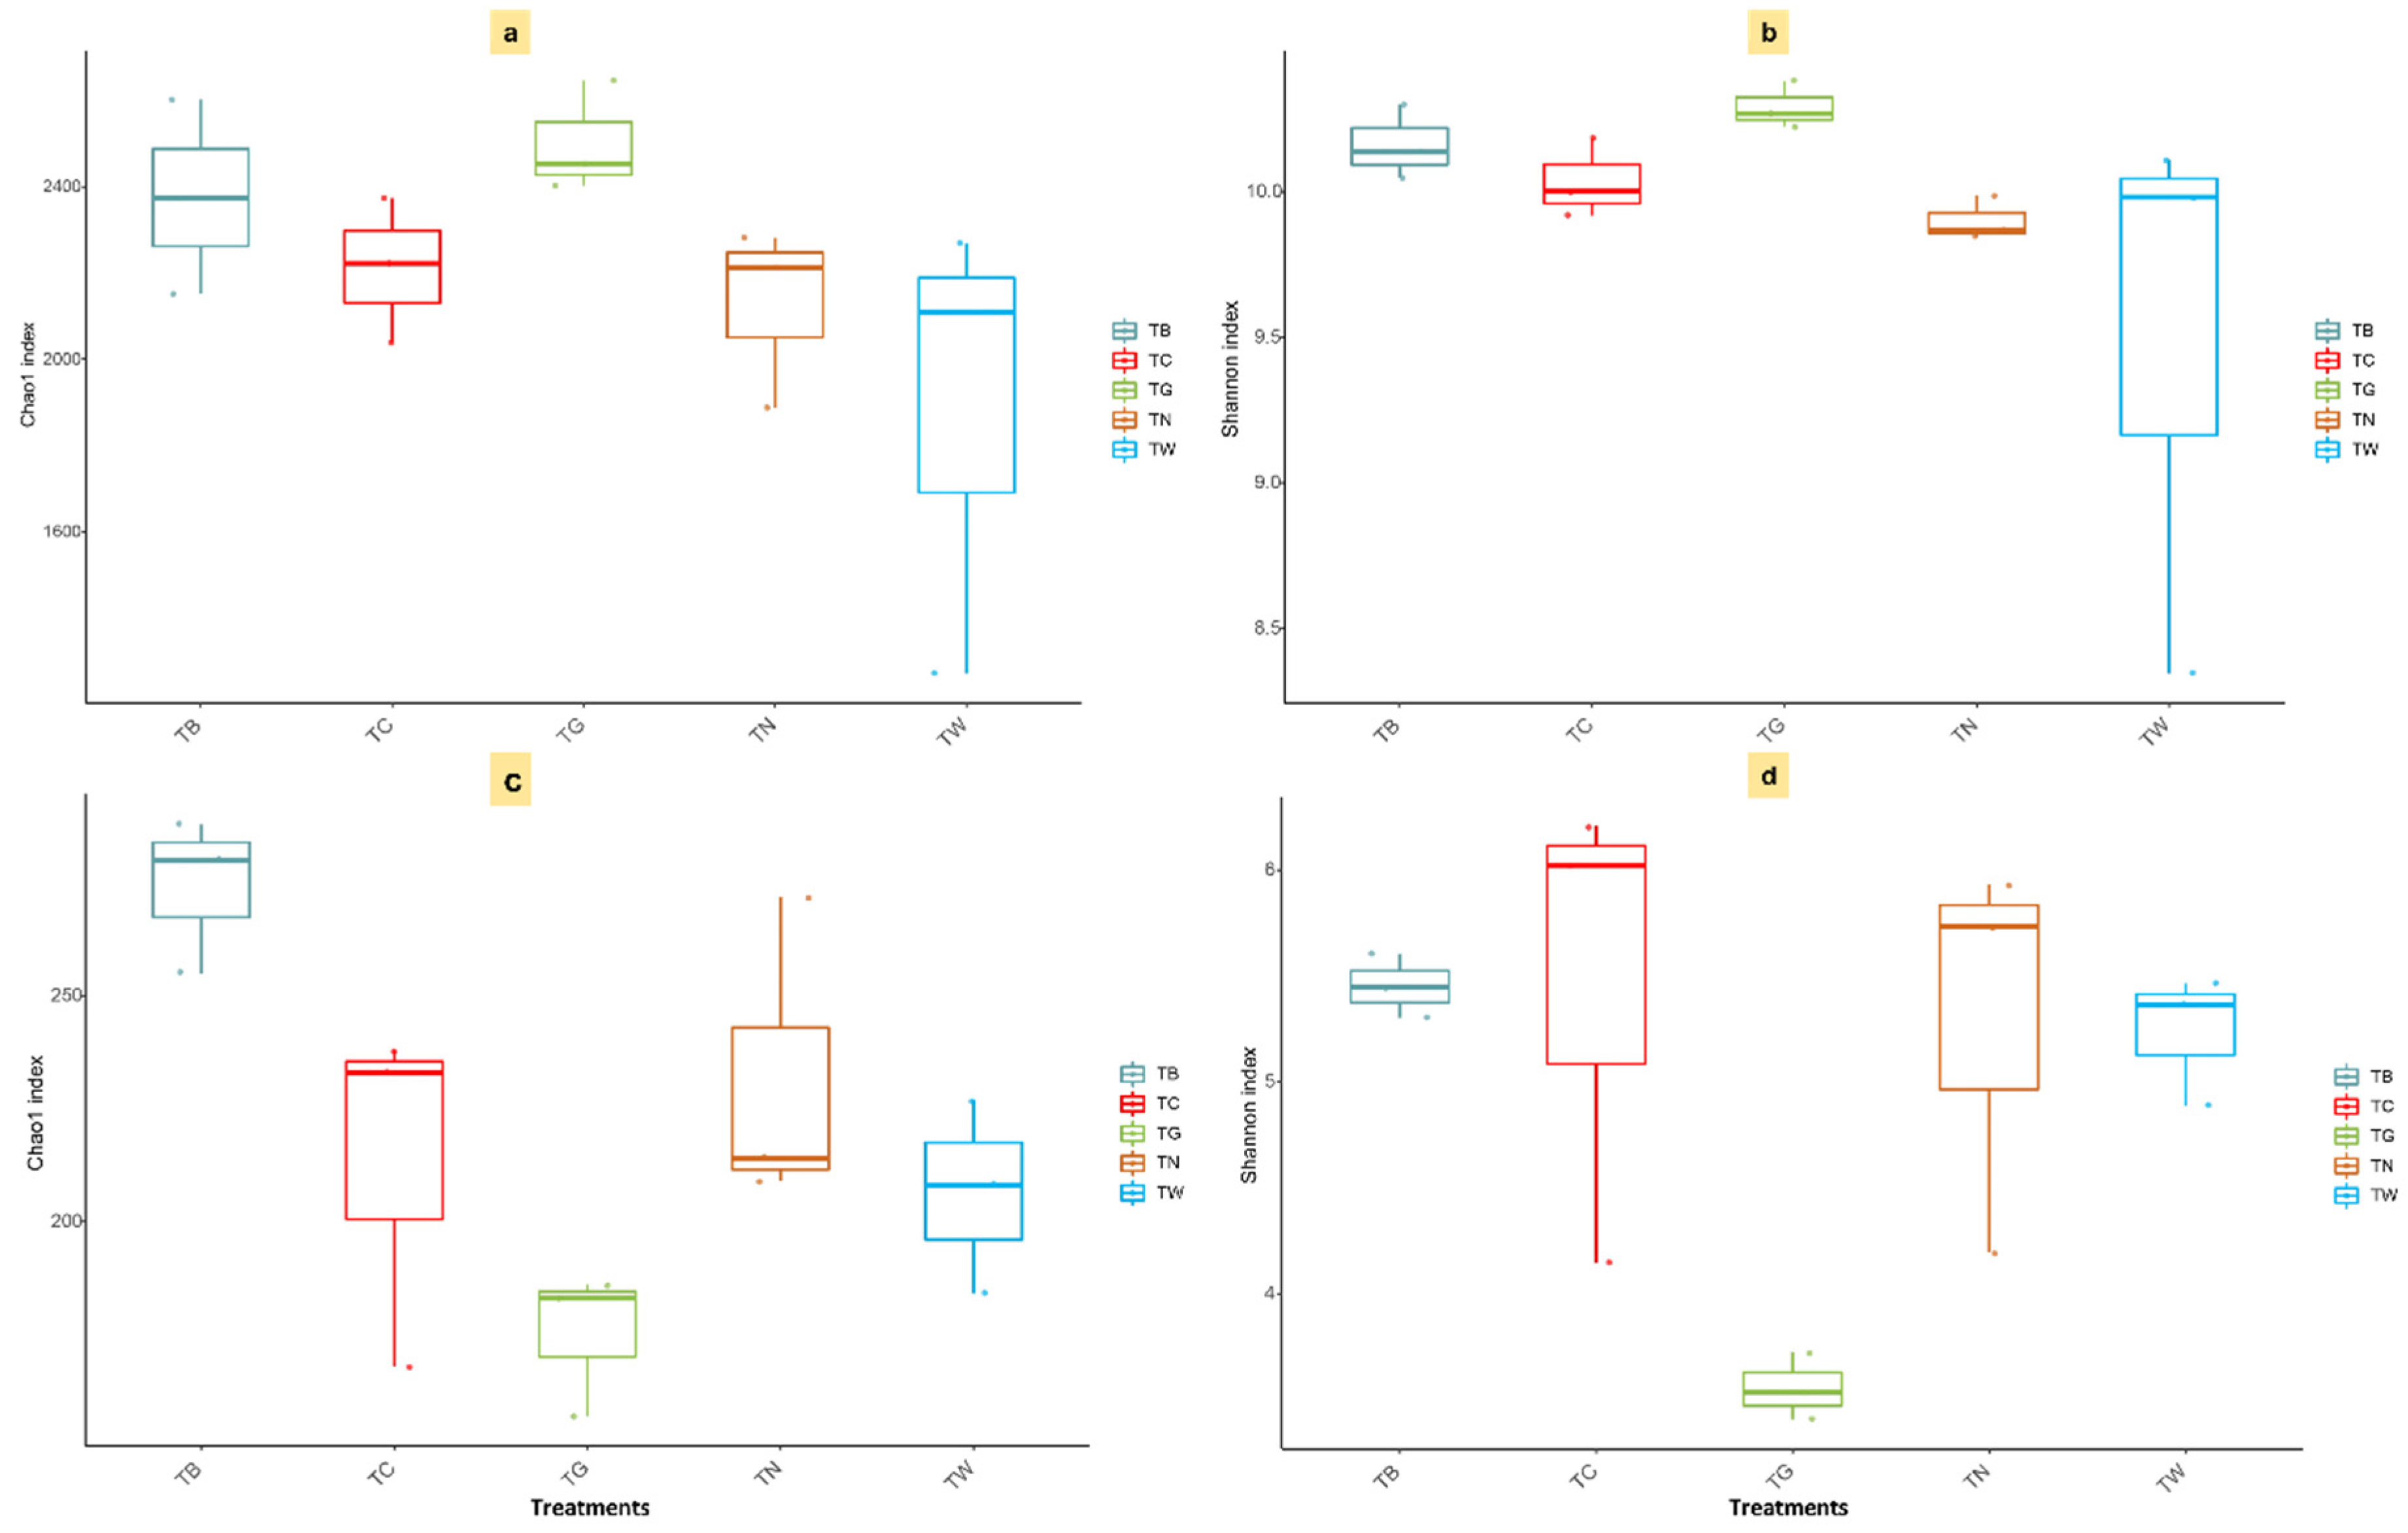
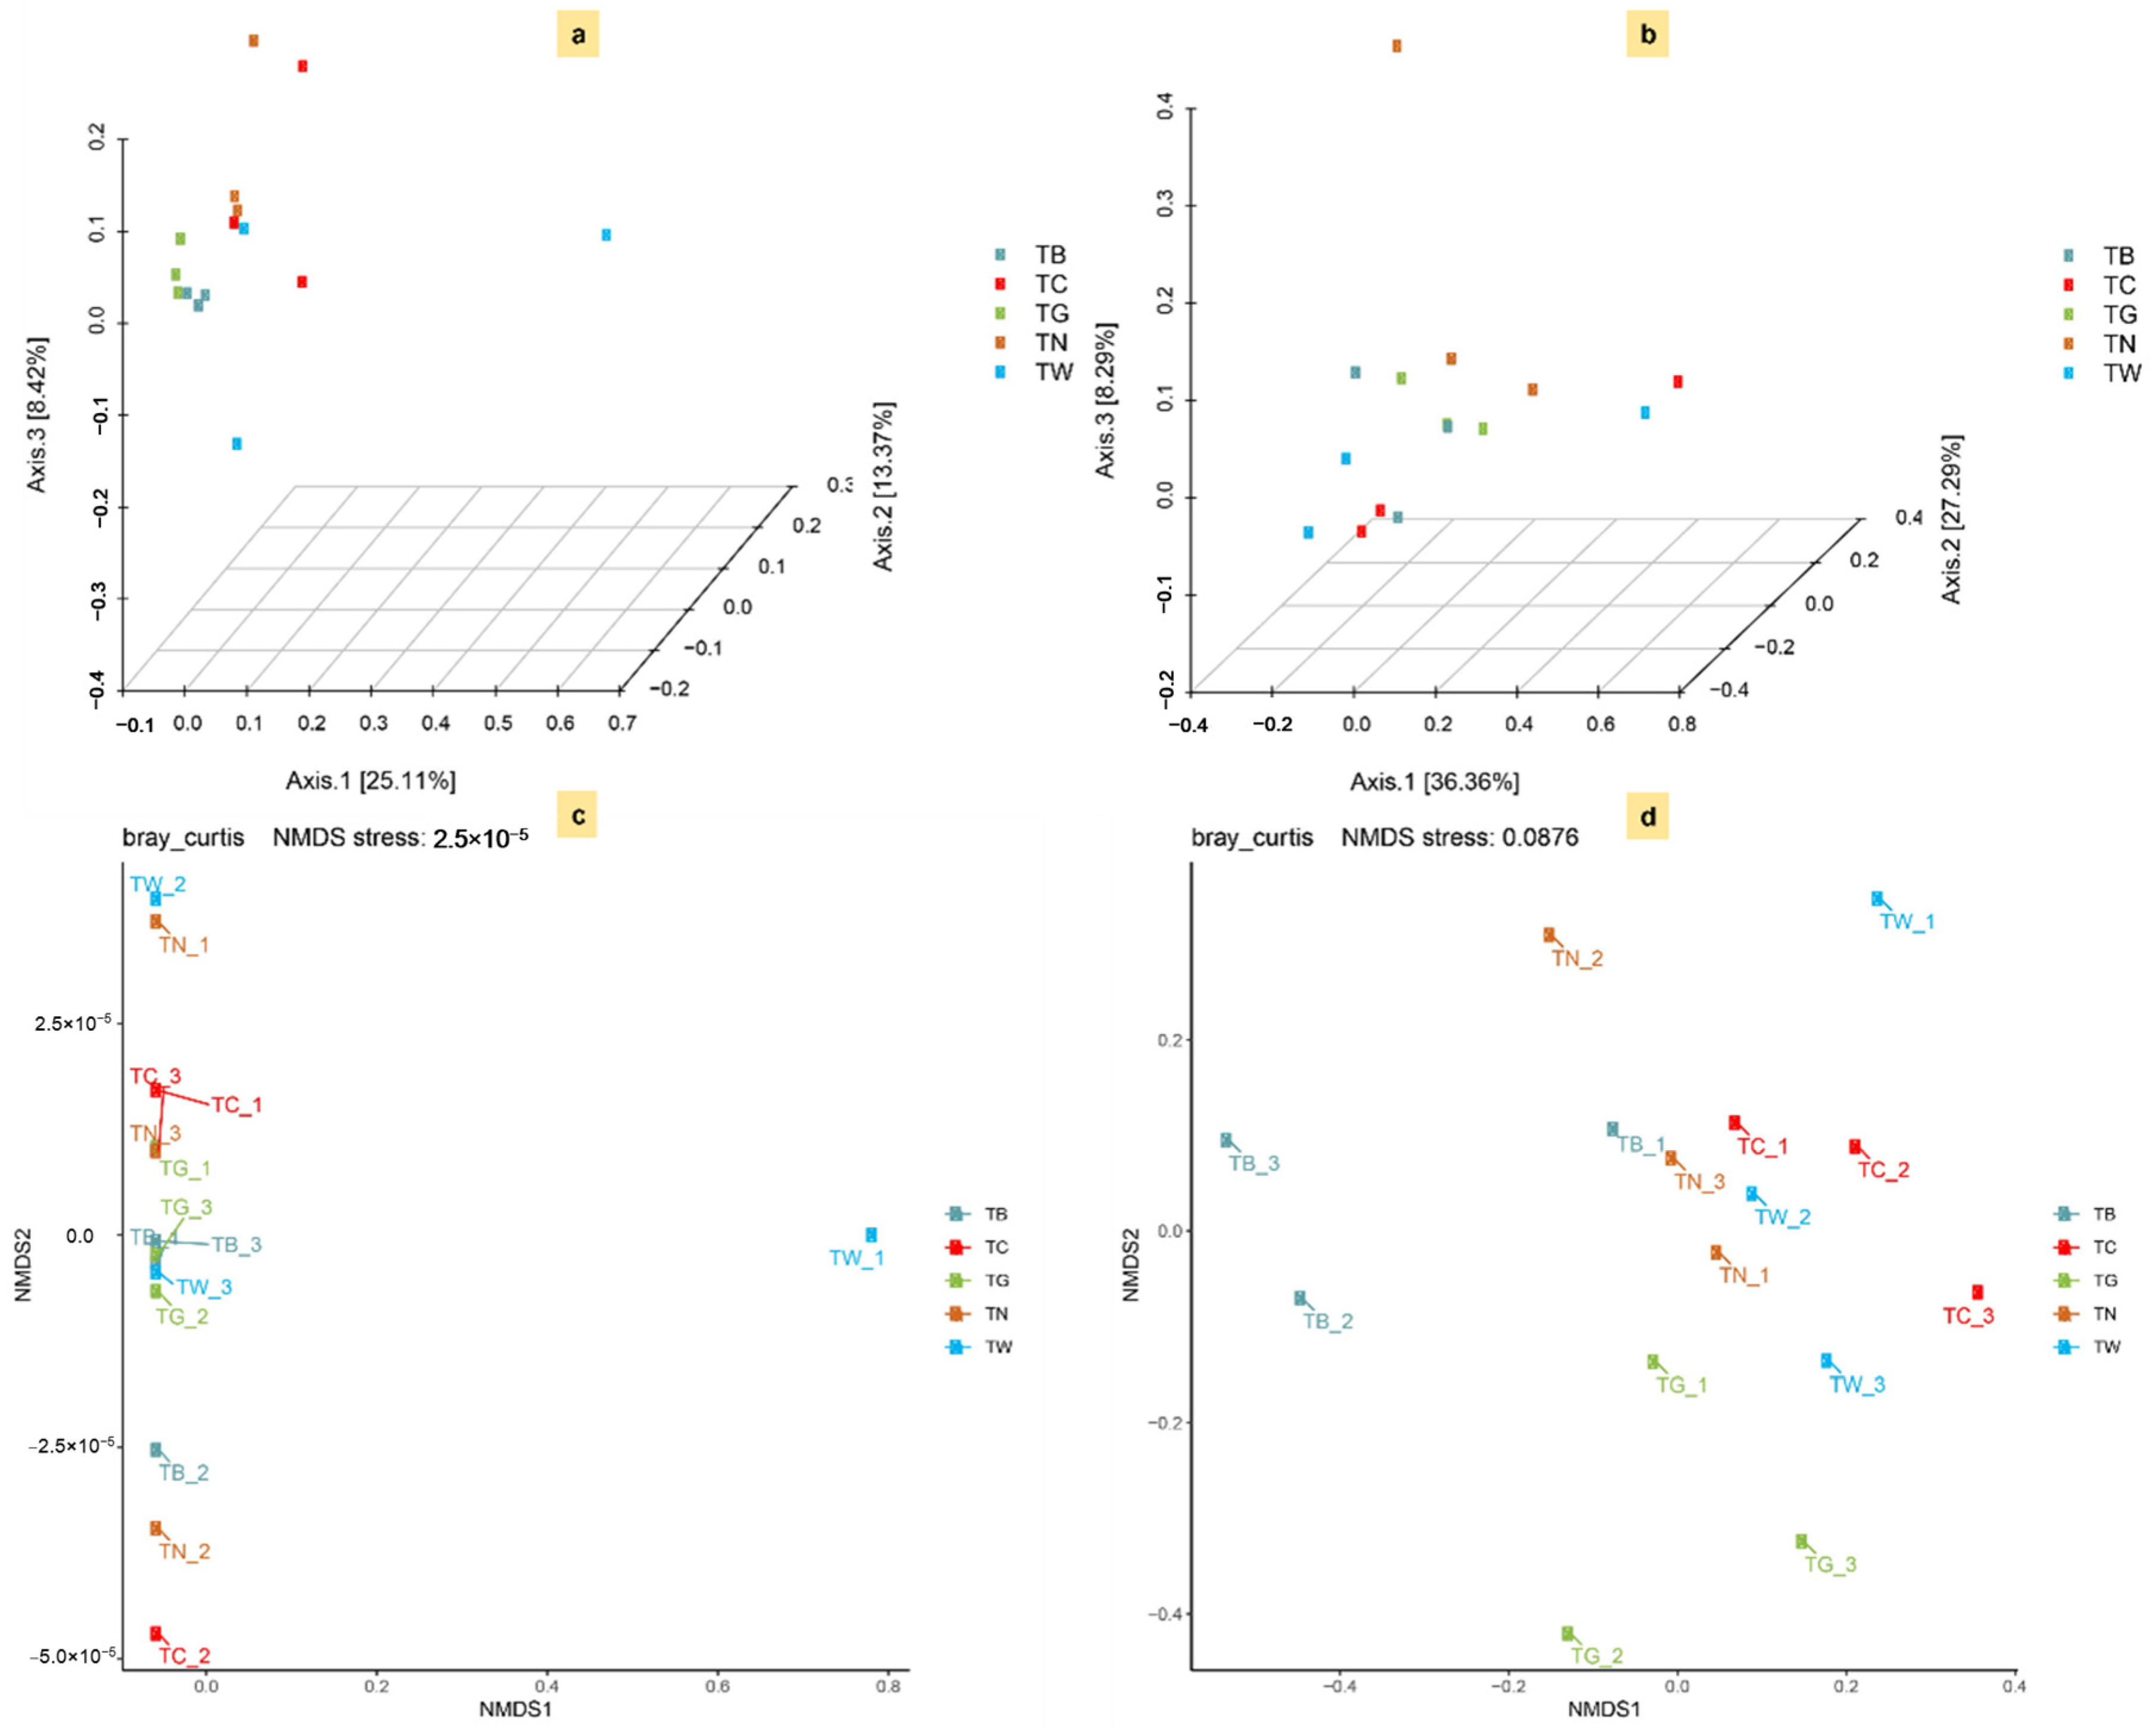
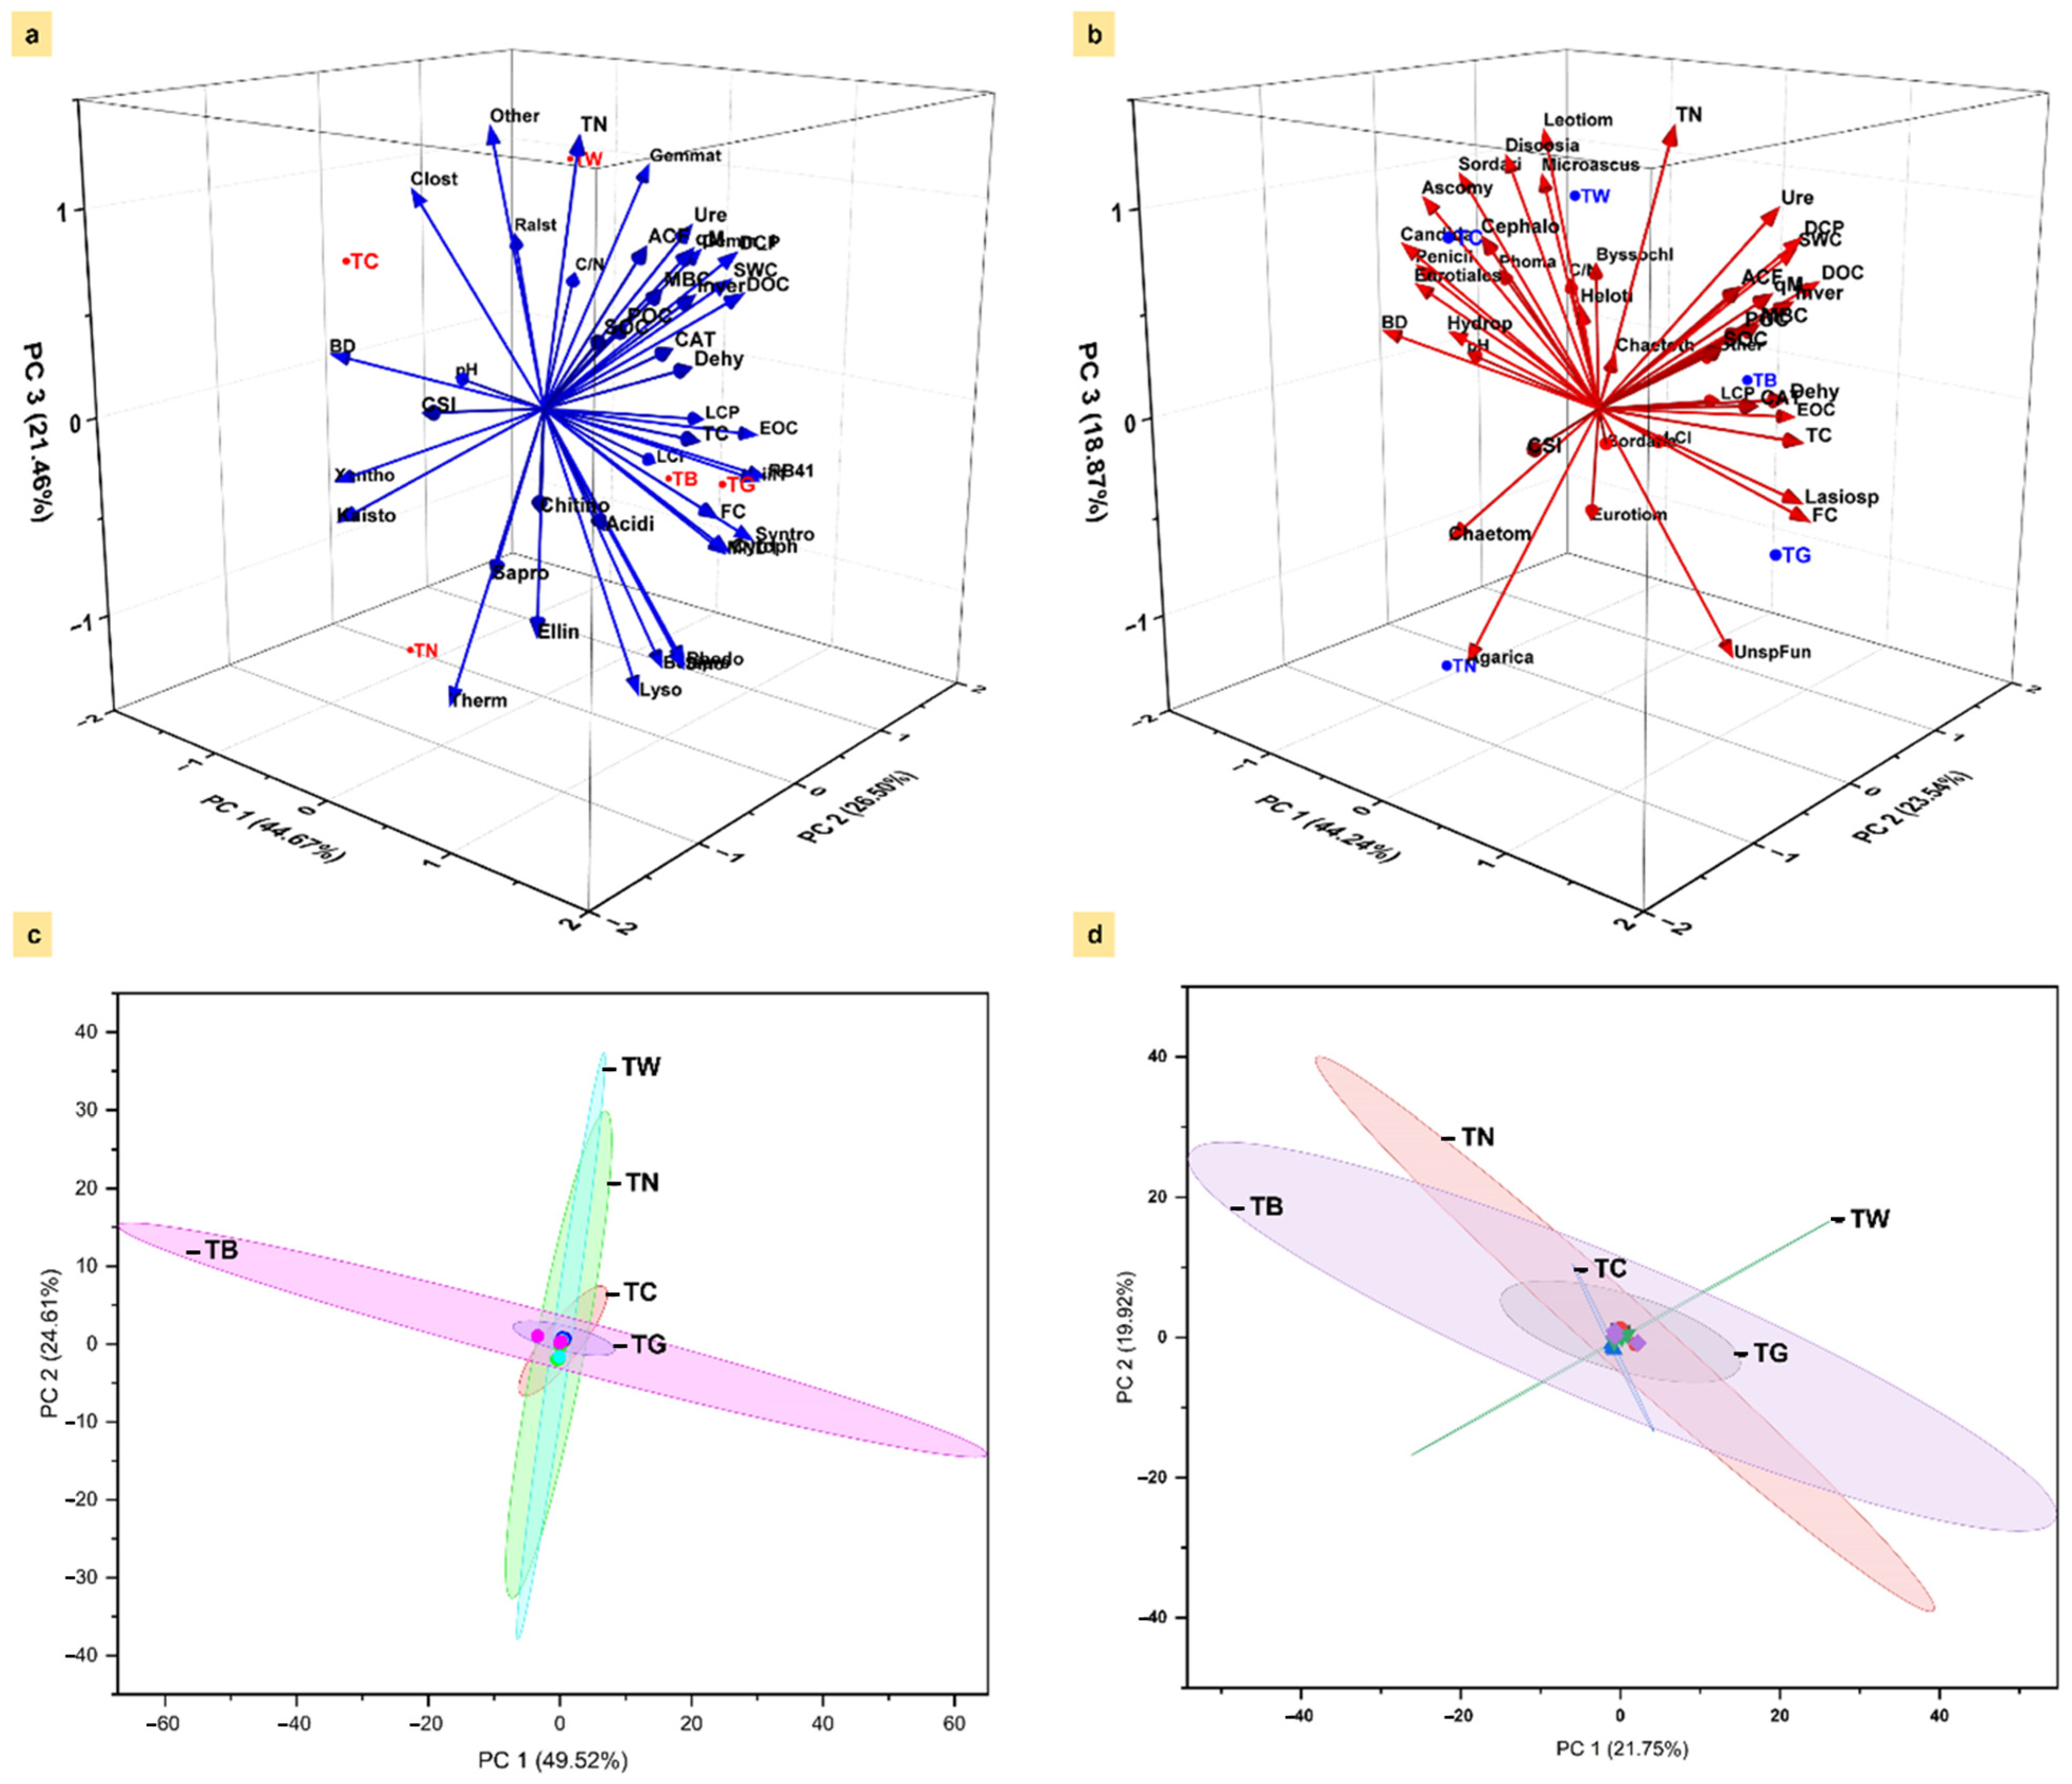
3.3. Microbial α and β-Diversity in Response to Mulching Practices

The results of high-throughput bacterial sequencing showed 2,727,865 valid sequences from three replications of five treatments, of which 104,656, 105,108, 106,460, 99,488, and 95,841 sequences were obtained from TB, TC, TG, TN, and TW treatments, respectively. Total fungal sequences were 2,478,650, of which 99,948, 100,176, 101,218, 101,845, and 106,227 were obtained from TB, TC, TG, TN, and TW treatments. The bacterial OTUs in TB, TC, TG, TN, and TW were 2357, 2193, 2470, 2106, and 1861, respectively, while fungal OTUs were 274, 213, 175, 231, and 206. The unique and common bacterial and fungal OTUs among different treatments are shown in Figure 5. The Venn diagram showed 1656, 1643, 1343, 1308, and 1250 unique bacterial communities OTUs from TB > TG > TC > TW > TN. The specific number of OTUs trend differed in fungal communities, involving 215, 139, 100, 91, and 82 OTUs from treatments TB > TN > TW > TC > TG. The conditions in TB and TG treatments extensively promoted bacterial communities, as these treatments showed extensive OTU numbers for bacterial communities. The number of fungal community OTUs was also more comprehensive in TB treatments, indicating that TB promoted the soil fungal community.
The microbial α-diversity is presented in Figure 6 as Chao1 and Shannon indexes. The coverage indexes from five treatments with three replications were more significant than 0.96 in bacterial and fungal communities sequencing, indicating the acceptability of sequencing capacity. The Chao1 and Shannon indexes in bacterial communities were higher in TG, followed by TB. The TG and TB treatments reported increases of 18% and 12% in the Chao1 index and Shannon index of bacterial communities compared to the TN treatment. TB treatment reported a higher Chao1 index in fungal communities, while the Shannon index was slightly higher in TB and TC. We observed an 18% increase in the Chao1 index of fungal communities of TB treatment compared to TN. The Shannon index of fungal communities was 3% higher in TB and TC treatments than in TN.
The effect of mulching practices on the distribution of soil microbial communities was explored through 3D PCA based on Bray–Curtis distance and NMDS analysis, which are given in Figure 7. The PCA for bacterial communities accounted for 25.11% of Axis 1, 13.37% of Axis 2, and 8.42% of Axis 3 (Figure 7a). Treatment TC, TW, and TN were more associated with the positive side of the 3D axis, while treatment TB and TG were more associated with the negative side of axis 1. The PCA for fungal communities accounted for 36.36% of axis 1, 27.29% of axis 2, and 8.29% of axis 3 (Figure 7b). All of the applied treatments were associated with the positive values of these 3D axes, except for treatment TW, which slightly diverged toward the negative side of axis 1. The NMDS analysis revealed a 0.0001 index for the bacterial community (Figure 7c) and a 0.0876 index for the fungal community (Figure 7d). The distribution of bacterial communities in mulching practices was more closely linked with the NMDS2 side. The fungal communities in mulching practices were uniformly distributed between NMDS1 and NMDS2 axes. However, treatment TG was more associated with the positive side of NMDS1 and the negative side of NMDS2. TB treatment was more closely linked to the positive side of the NMDS2 side and the negative side of the NMDS1. The β-diversity was mainly promoted by soil mulching practices, especially treatments for TB and TG. It indicated that soil mulching with plastic black film (TB) and straw mulching (TG) for maize cultivation provide favorable bacterial and fungal community distribution conditions.

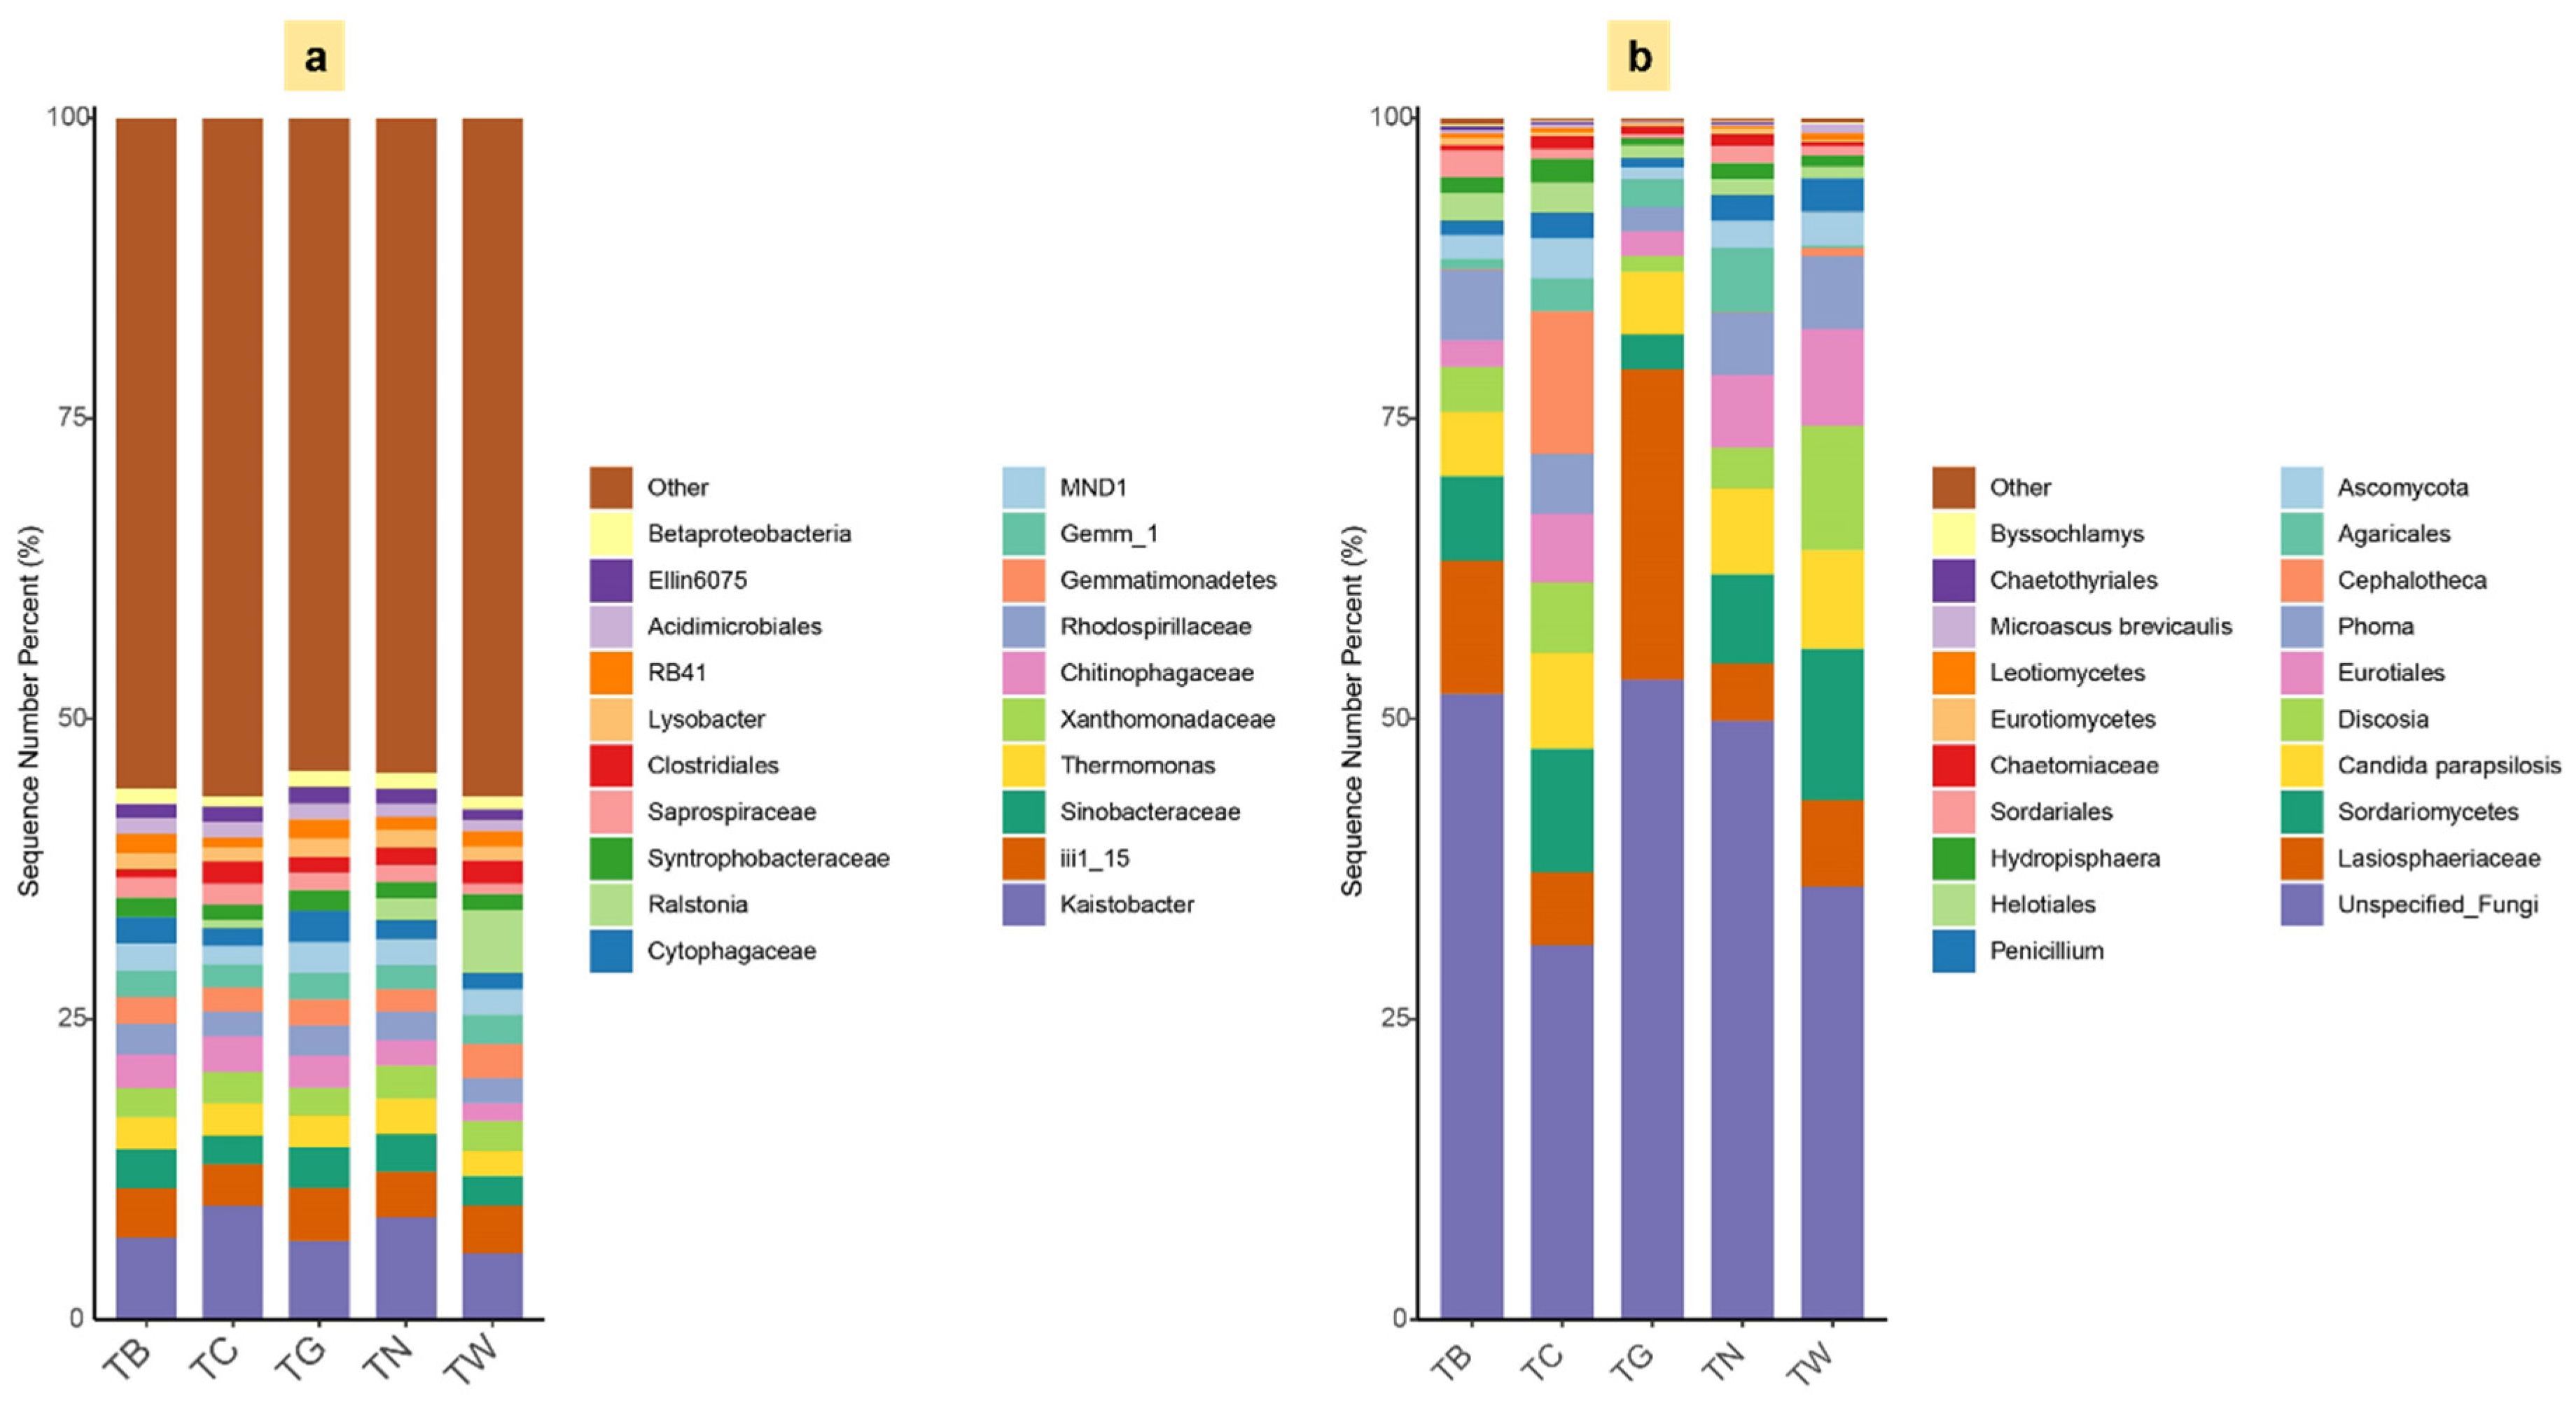
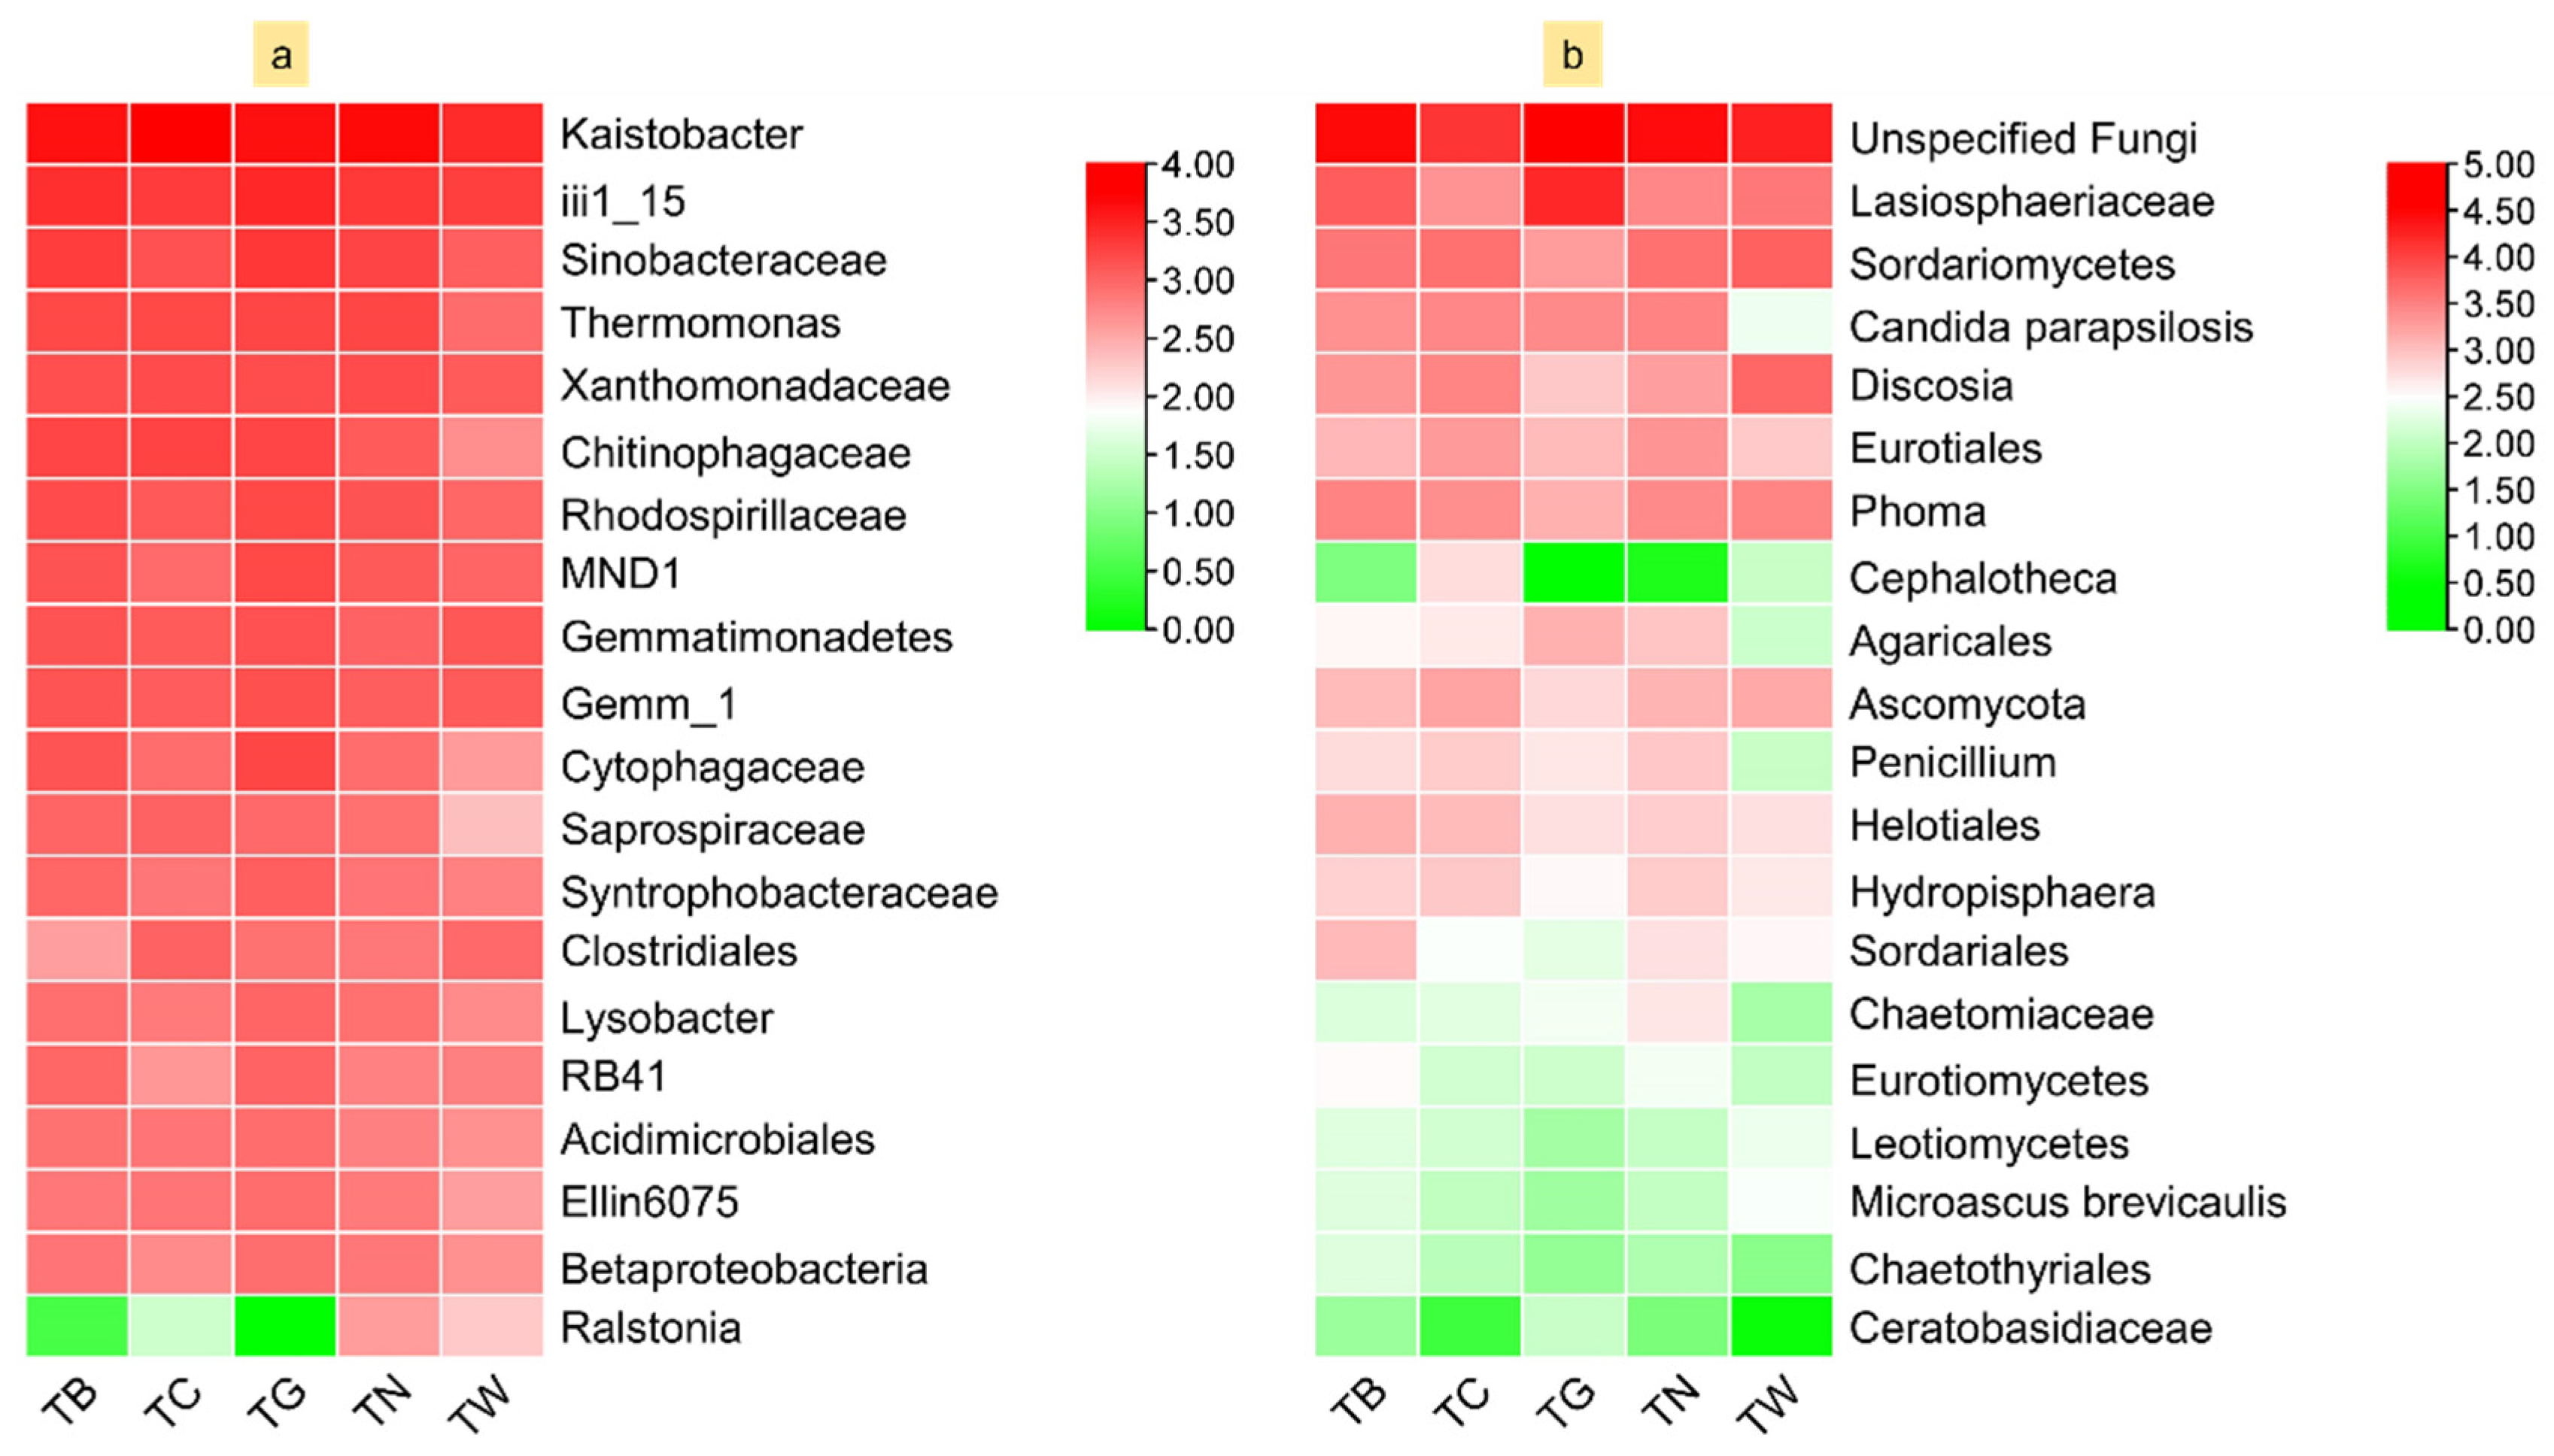
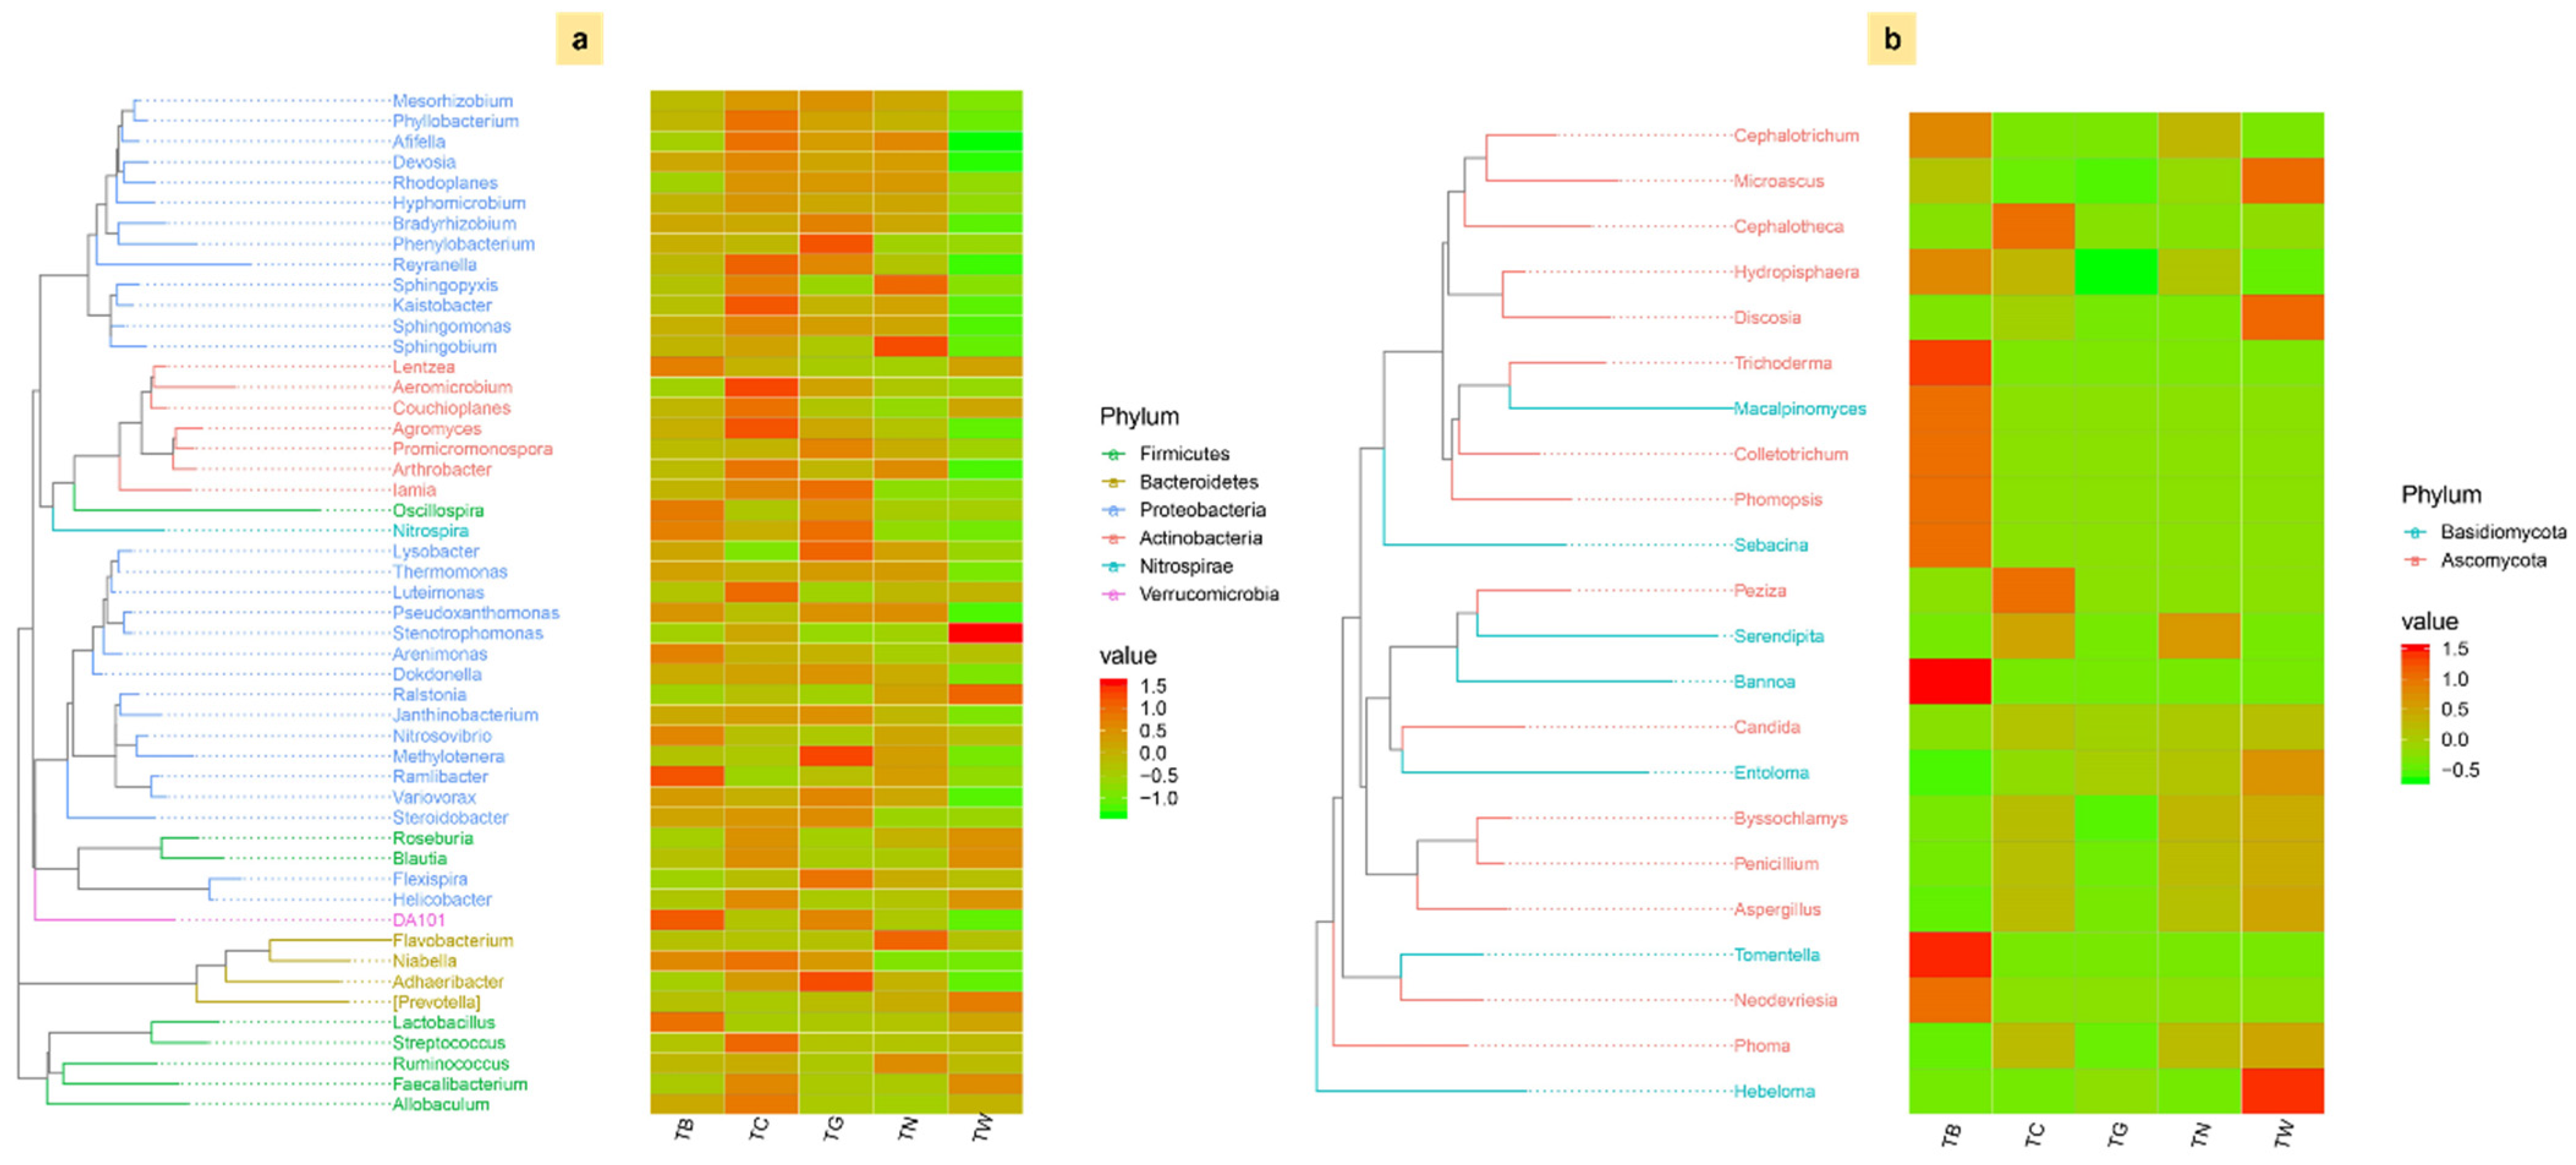
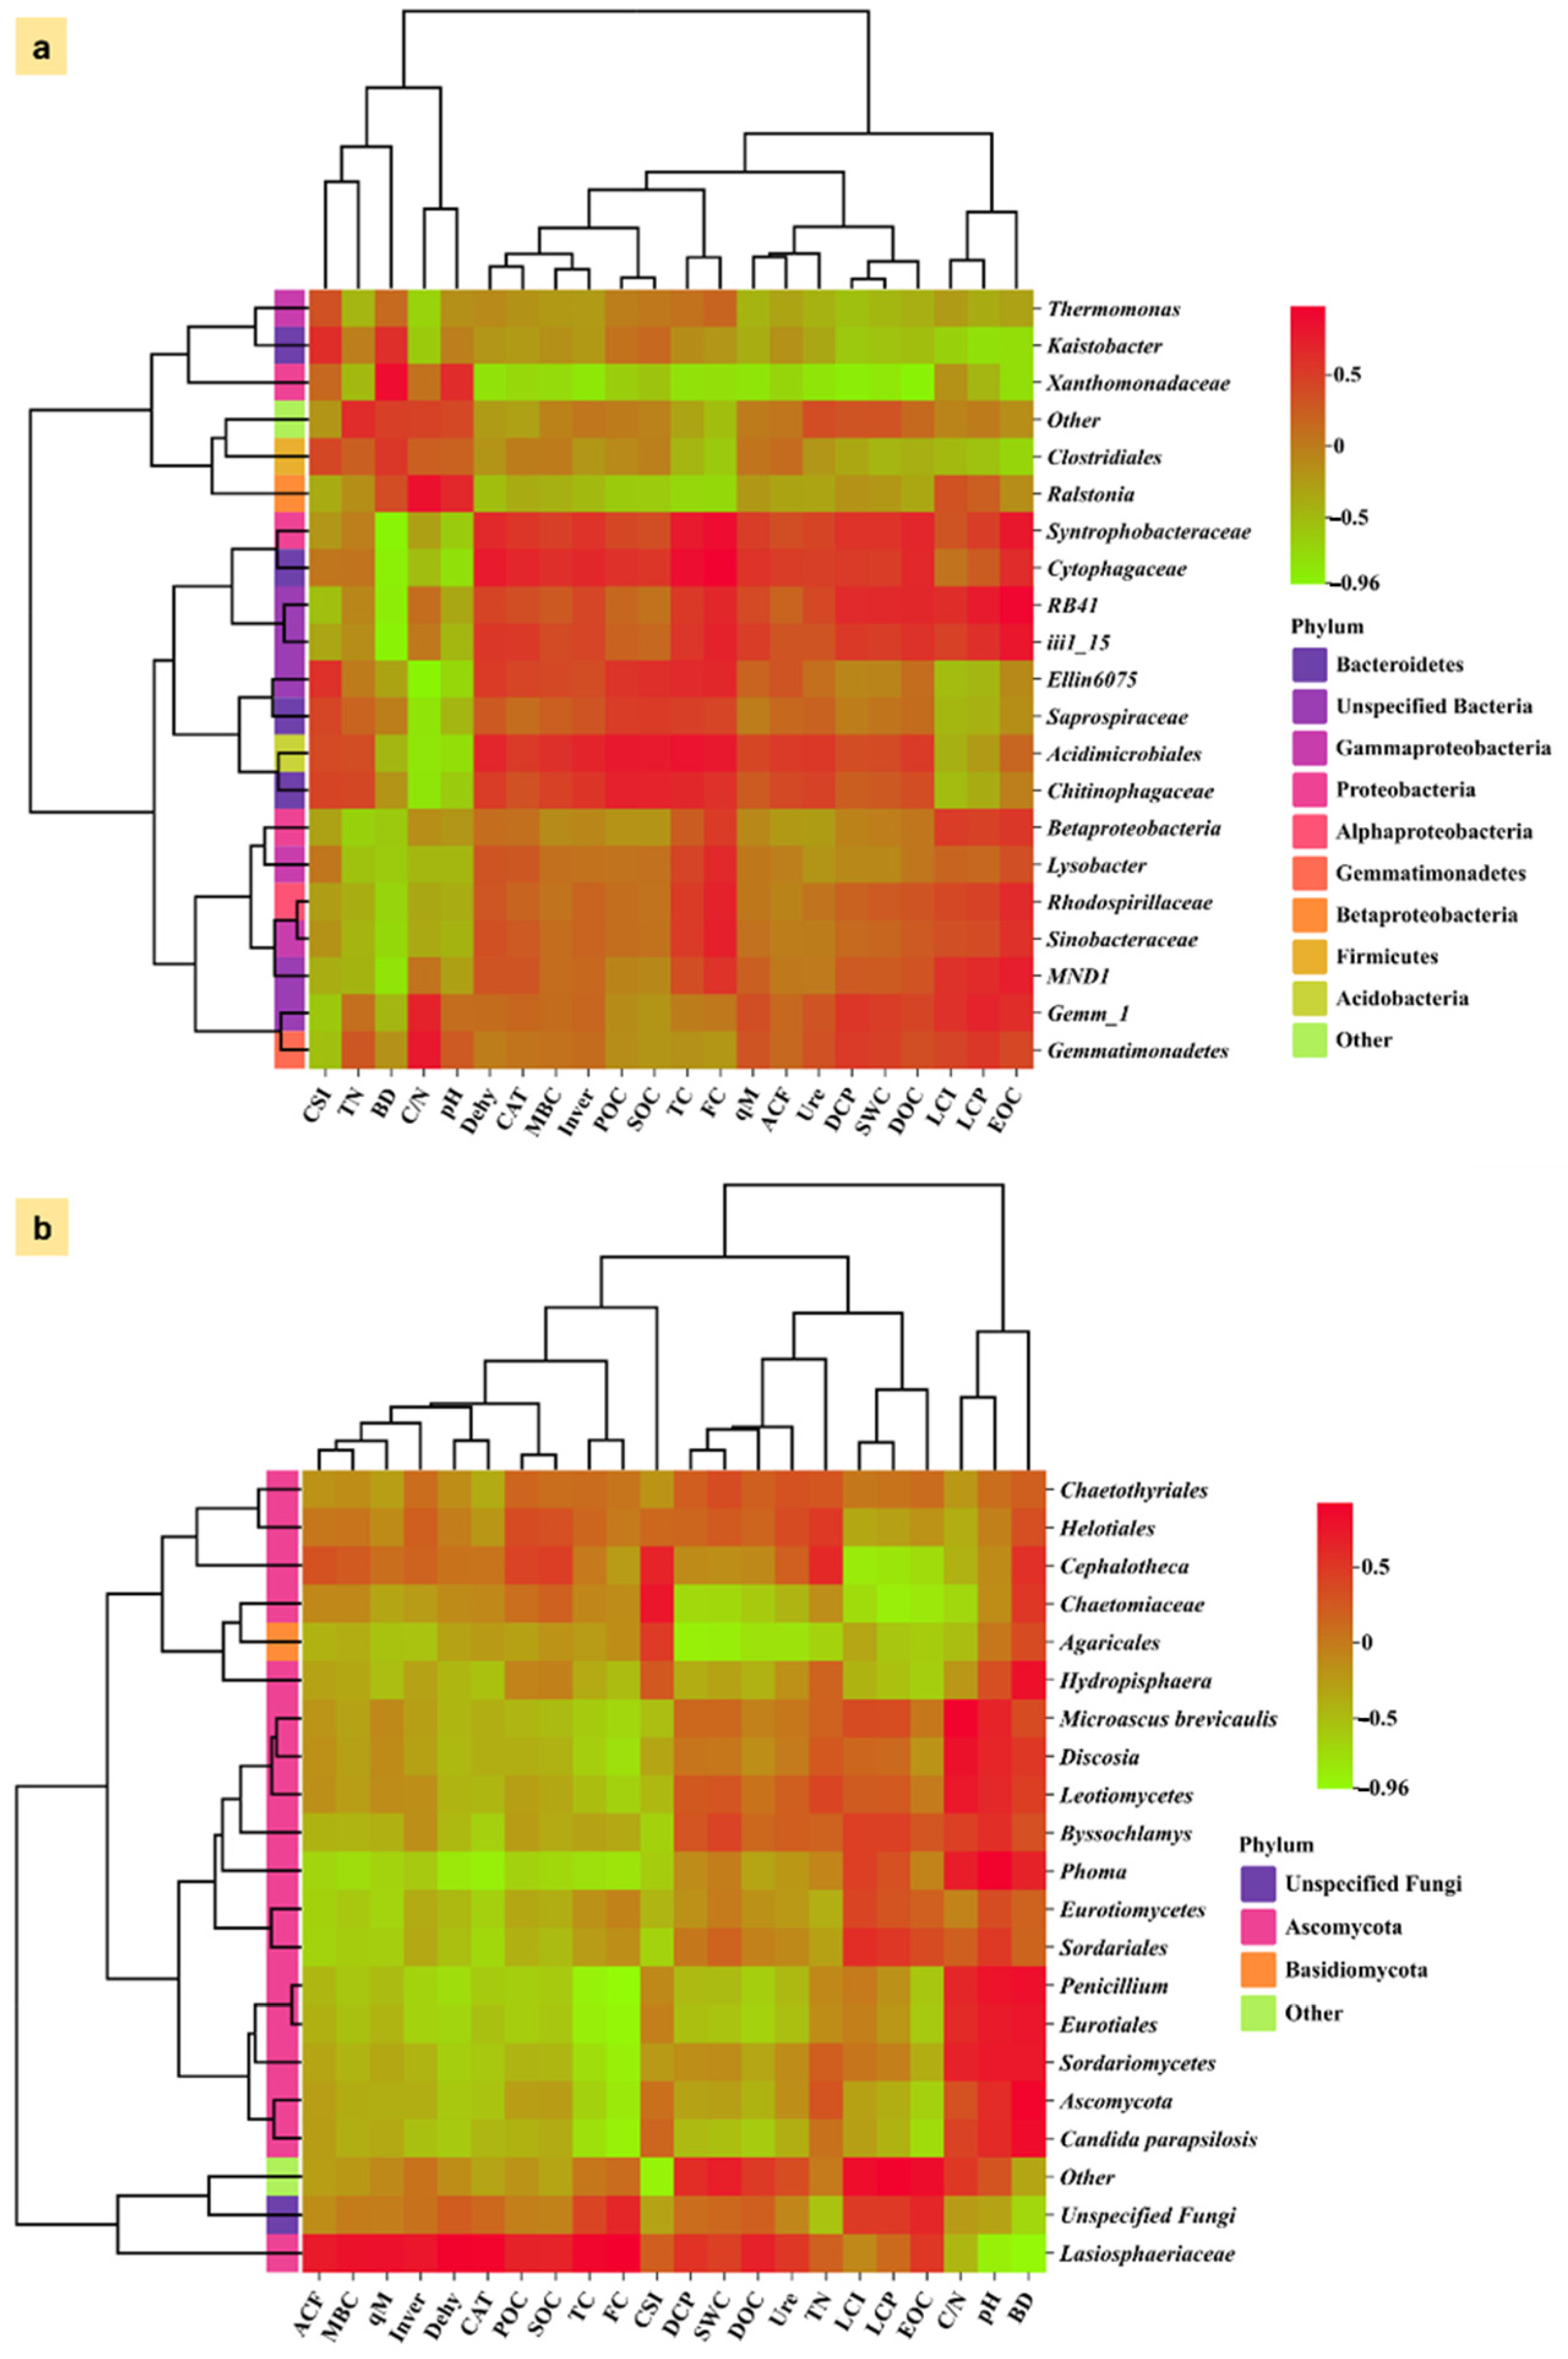
3.4. Composition of Microbial Diversity Under Different Mulching Practices

Mulching practices influenced the composition of the bacterial and fungal communities (Figure 8). The soil bacterial and fungal communities varied among the mulching practices. The top 10 dominant bacterial phyla were Proteobacteria, Acidobacteria, Bacteroidetes, Actinobacteria, Gemmatimonadetes, Firmicutes, Chloroflexi, Verrucomicrobia, Nitrospirae, and Armatimonadetes. Among these bacterial phyla, Proteobacteria, Acidobacteria, Bacteroidetes, Gemmatimonadetes, Verrucomicrobia, and Nitrospirae were more dominant in treatment TG. Treatment TW had the highest abundance of Chloroflexi and Armatimonadetes. In contrast, Firmicutes was most abundant in treatment TW. The dominant fungal phyla were unspecified fungi, Ascomycota, and Basidiomycota. The Ascomycota was more abundant in treatment TW, while treatment TG had more unspecified fungi and Basidiomycota.
Bacterial abundance showed a statistically significant difference among groups (F = 1.43, R2 = 0.365, p = 0.001), suggesting that groupings explained a substantial portion of the variance in bacterial abundance (Table 2). Fungal abundance also demonstrated a significant effect (F = 1.84, R2 = 0.424, p = 0.030), indicating a meaningful difference in fungal abundance among the groups, though with a slightly lower confidence compared to bacterial abundance (Table 2). The top 20 bacterial genera were Kaistobacter, iii1-15, Sinobacteraceae, Thermomonas, Xanthomonadaceae, Chitinophagaceae, Rhodospirillaceae, Gemmatimonadetes, Gemm_1, MND1, Cytophagaceae, Ralstonia, Syntrophobacteraceae, Clostridiales, Lysobacter, RB41, Acidimicrobiales, Ellin6075, and Betaproteobacteria (Figure 8a and Figure 9a). Treatment TC had more abundance of Kaistobacter, Xanthomonadaceae, and Chitinophagaceae. Treatment TG had the highest abundance of iii1-15, Sinobacteraceae, Thermomonas, Rhodospirillaceae, Gemmatimonadetes, and Gemm_1. The dominant 20 fungal genera were unspecified fungi, Lasiosphaeriaceae, Sordariomycetes, Candida, Discosia, Eurotiales, Phoma, Cephalotheca, Agaricales, Ascomycota, Penicillium, Helotiales, Hydropisphaera, Sordariales, Chaetomiaceae, Eurotiomycetes, Leotiomycetes, Microascus, Chaetothyriales, and Byssochlamys (Figure 8b and Figure 9b). Treatment TW had the highest abundance of Lasiosphaeriaceae and Phoma, while Cephalotheca and Ascomycota were the most abundant in treatment TC. The unspecified fungi and Agaricales were abundant in treatment TG, while treatment TW had more Sordariales and Discosia.
The taxonomic distribution of bacterial and fungal communities, along with their relative abundance, influenced by mulching practices, is demonstrated in Figure 10. The bacterial and fungal phylogenetic trees showed the relationships between their genera, while the heatmap represents the microbial abundance influenced by different mulching practices. The top 20 bacterial genera are grouped by their phyla, including Firmicutes, Bacteroidetes, Proteobacteria, Actinobacteria, Nitrospirae, and Verrucomicrobia (Figure 10a). Among these genera, Ruminococcus, Flavobacterium, and Pseudoxanthomonas were most dominant among the bacterial communities. The heatmap demonstrated that Ruminococcus and Lactobacillus had higher abundance in treatments TB and TC while Flavobacterium was more abundant in treatment TW. Fungal genera were grouped into Ascomycota and Basidiomycota (Figure 10b). Among these phyla, Trichoderma and Sebacina were the most dominant fungal genera. The heatmap indicated a higher abundance of Candida and Penicillium under treatments TB and TC. The Sebacina and Serendipita were less abundant but displayed better abundance in treatments TG and TN.
The co-occurrence network of bacterial and fungal communities associated with mulching practices represents interactions within microbial communities (Figure 11). The nodes in bacterial taxa were grouped by their phyla (Figure 11a), including Firmicutes, Bacteroidetes, Proteobacteria, Actinobacteria, Deferribacteres, Verrucomicrobia, and Crenarchaeota. Nodes in fungal taxa were grouped by their phyla, Ascomycota and Basidiomycota (Figure 11b). The co-occurrence network demonstrates the co-occurrence relationships through positive correlations or exclusion relationships through negative correlations. This co-occurrence network showcases inter-phyla and intra-phyla relationships within bacterial and fungal communities under different mulching conditions with dominant interactions among Firmicutes and Bacteroidetes, of the bacterial phyla, and Ascomycota, of the fungal phyla. The bacterial network (Figure 11a) was denser due to the higher bacterial diversity and complex interconnections across various phyla than in the fungal network (Figure 11b).

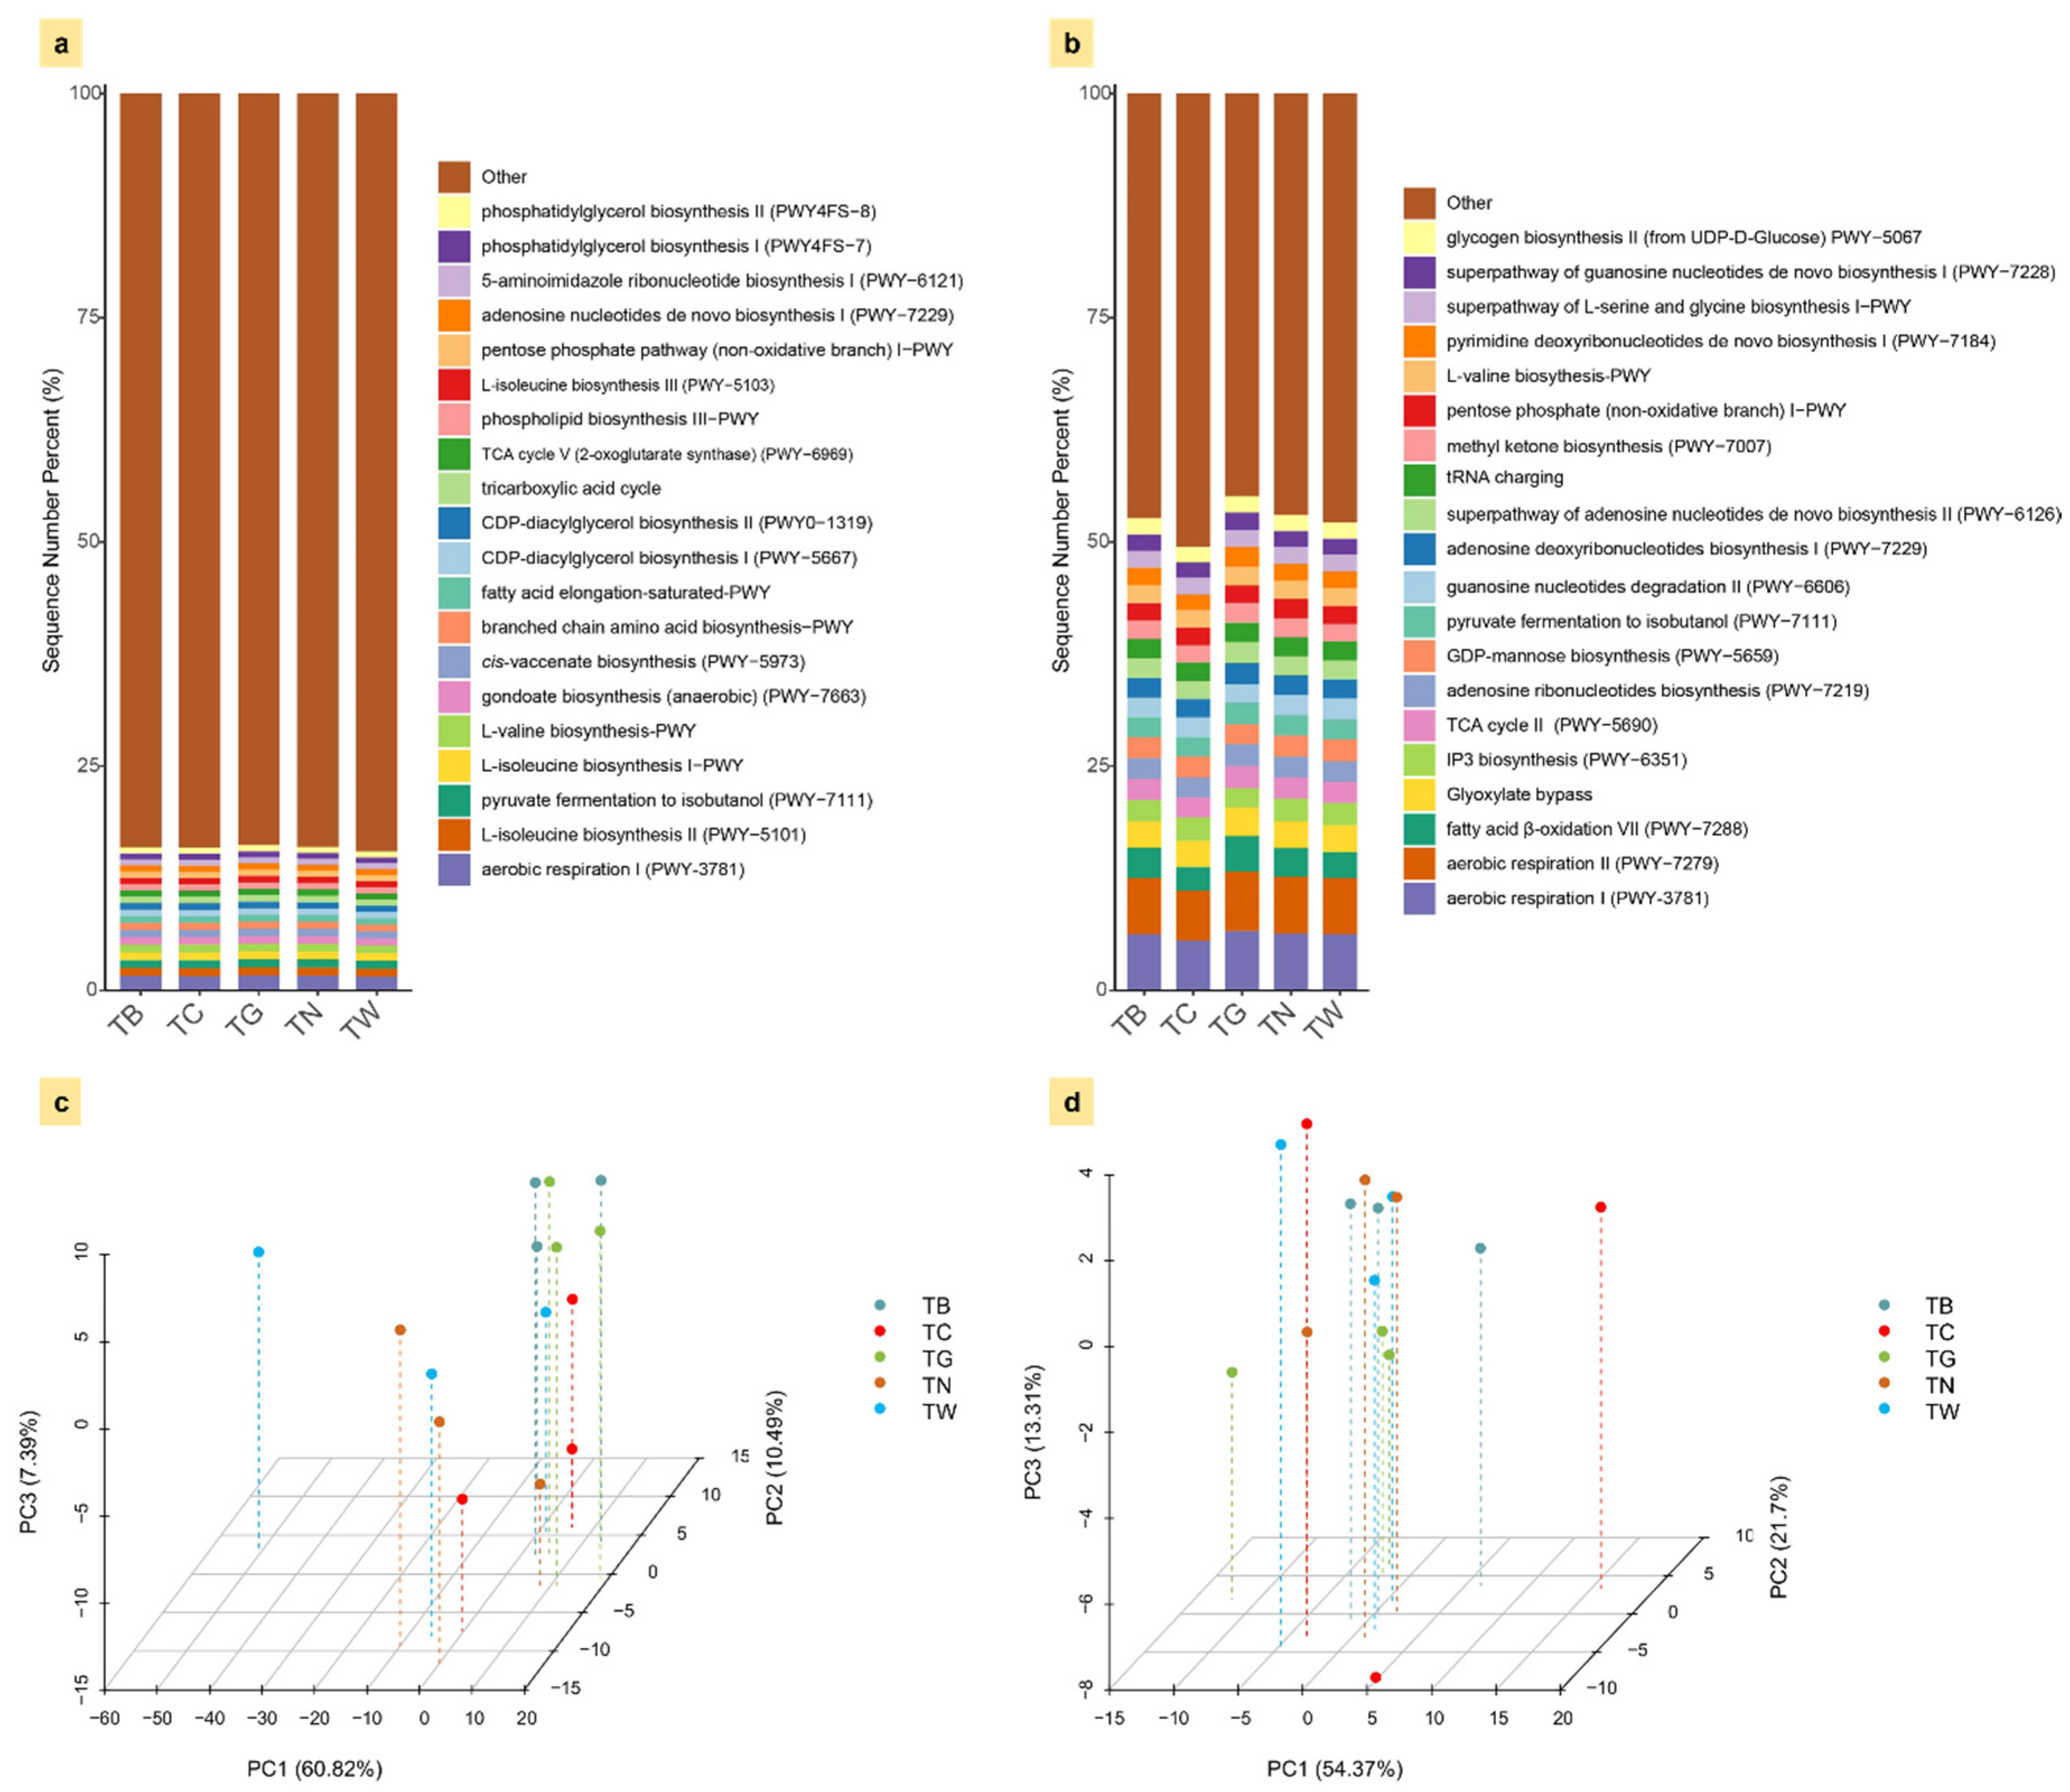
3.5. Functional Prediction of Soil Microbial Communities

Different mulching practices significantly affected microbial metabolic pathways and functional shifts. Bacterial functional diversity did not reach conventional statistical significance (F = 1.62, R2 = 0.393, p = 0.078), suggesting a trend toward group differentiation in bacterial functional profiles, but not strong enough to be conclusive at the 0.05 threshold (Table 2). Fungal functional diversity also lacked statistical significance (F = 1.73, R2 = 0.409, p = 0.121), indicating that differences in fungal functional traits among the groups were not statistically supported (Table 2). Figure 11a,b demonstrates the top 20 bacterial and fungal metabolic pathways under mulching treatments. The most dominant bacterial pathways under mulching practices were aerobic respiration I (PWY-3781), L-isoleucine biosynthesis II (PWY-5101), and pyruvate fermentation to isobutanol (PWY-7111). The dominant fungal pathways under mulching practices were aerobic respiration I (PWY-3781), aerobic respiration II (PWY-7279), and fatty acid β-oxidation (PWY-7288). The bacterial and fungal other metabolites had the most metabolic activity, including minor metabolites (excluding the top 20 metabolites). A higher diversity of bacterial metabolic pathways related to amino acid biosynthesis and aerobic metabolism was observed in treatments TG and TW. Treatment TG also had higher fungal metabolic contributions to energy metabolism and nucleotide biosynthesis.
The PCA of bacterial metabolites explains 78.7% of the variance in mulching practices, with a 60.82% contribution from PC1, 10.49% from PC2, and 7.39% from PCA3 (Figure 12c; Table S3). Across treatments, bacterial PC1 values remained consistently high (~76.5–76.7), suggesting limited variation along the primary component. In contrast, fungal profiles exhibited greater diversity among treatments, with TC and TW showing particularly distinct scores along PC2 (6.96 and 2.90, respectively) and PC3 (2.85 and −1.57), indicating treatment-specific shifts in fungal metabolic functions. Overall, the PCA reveals stable bacterial functional structure and more variable fungal responses across treatments. Mulching treatments influence the clustering pattern of the bacterial metabolic profile. The distinct clustering of bacterial metabolites in treatment TB and TC was observed, while treatments TG, TN, and TW exhibited more dispersed distributions. The PCA of fungal metabolites had an 89.38% variance in mulching practices, with 54.37% from PCA1, 21.7% from PCA2, and 13.31% from PCA3 (Figure 12d; Table S3). Treatment TW had distinct clustering, while treatment TG showed intermediate behavior between TW and other mulching practices, indicating functional shifts in fungal metabolites. Pathway loadings indicated that methane metabolism, nitrogen cycling, and xenobiotics degradation were major contributors to PC1, while carbohydrate metabolism and lipid biosynthesis pathways were dominant along PC2. These findings imply functional adaptations of microbial communities in response to environmental changes.

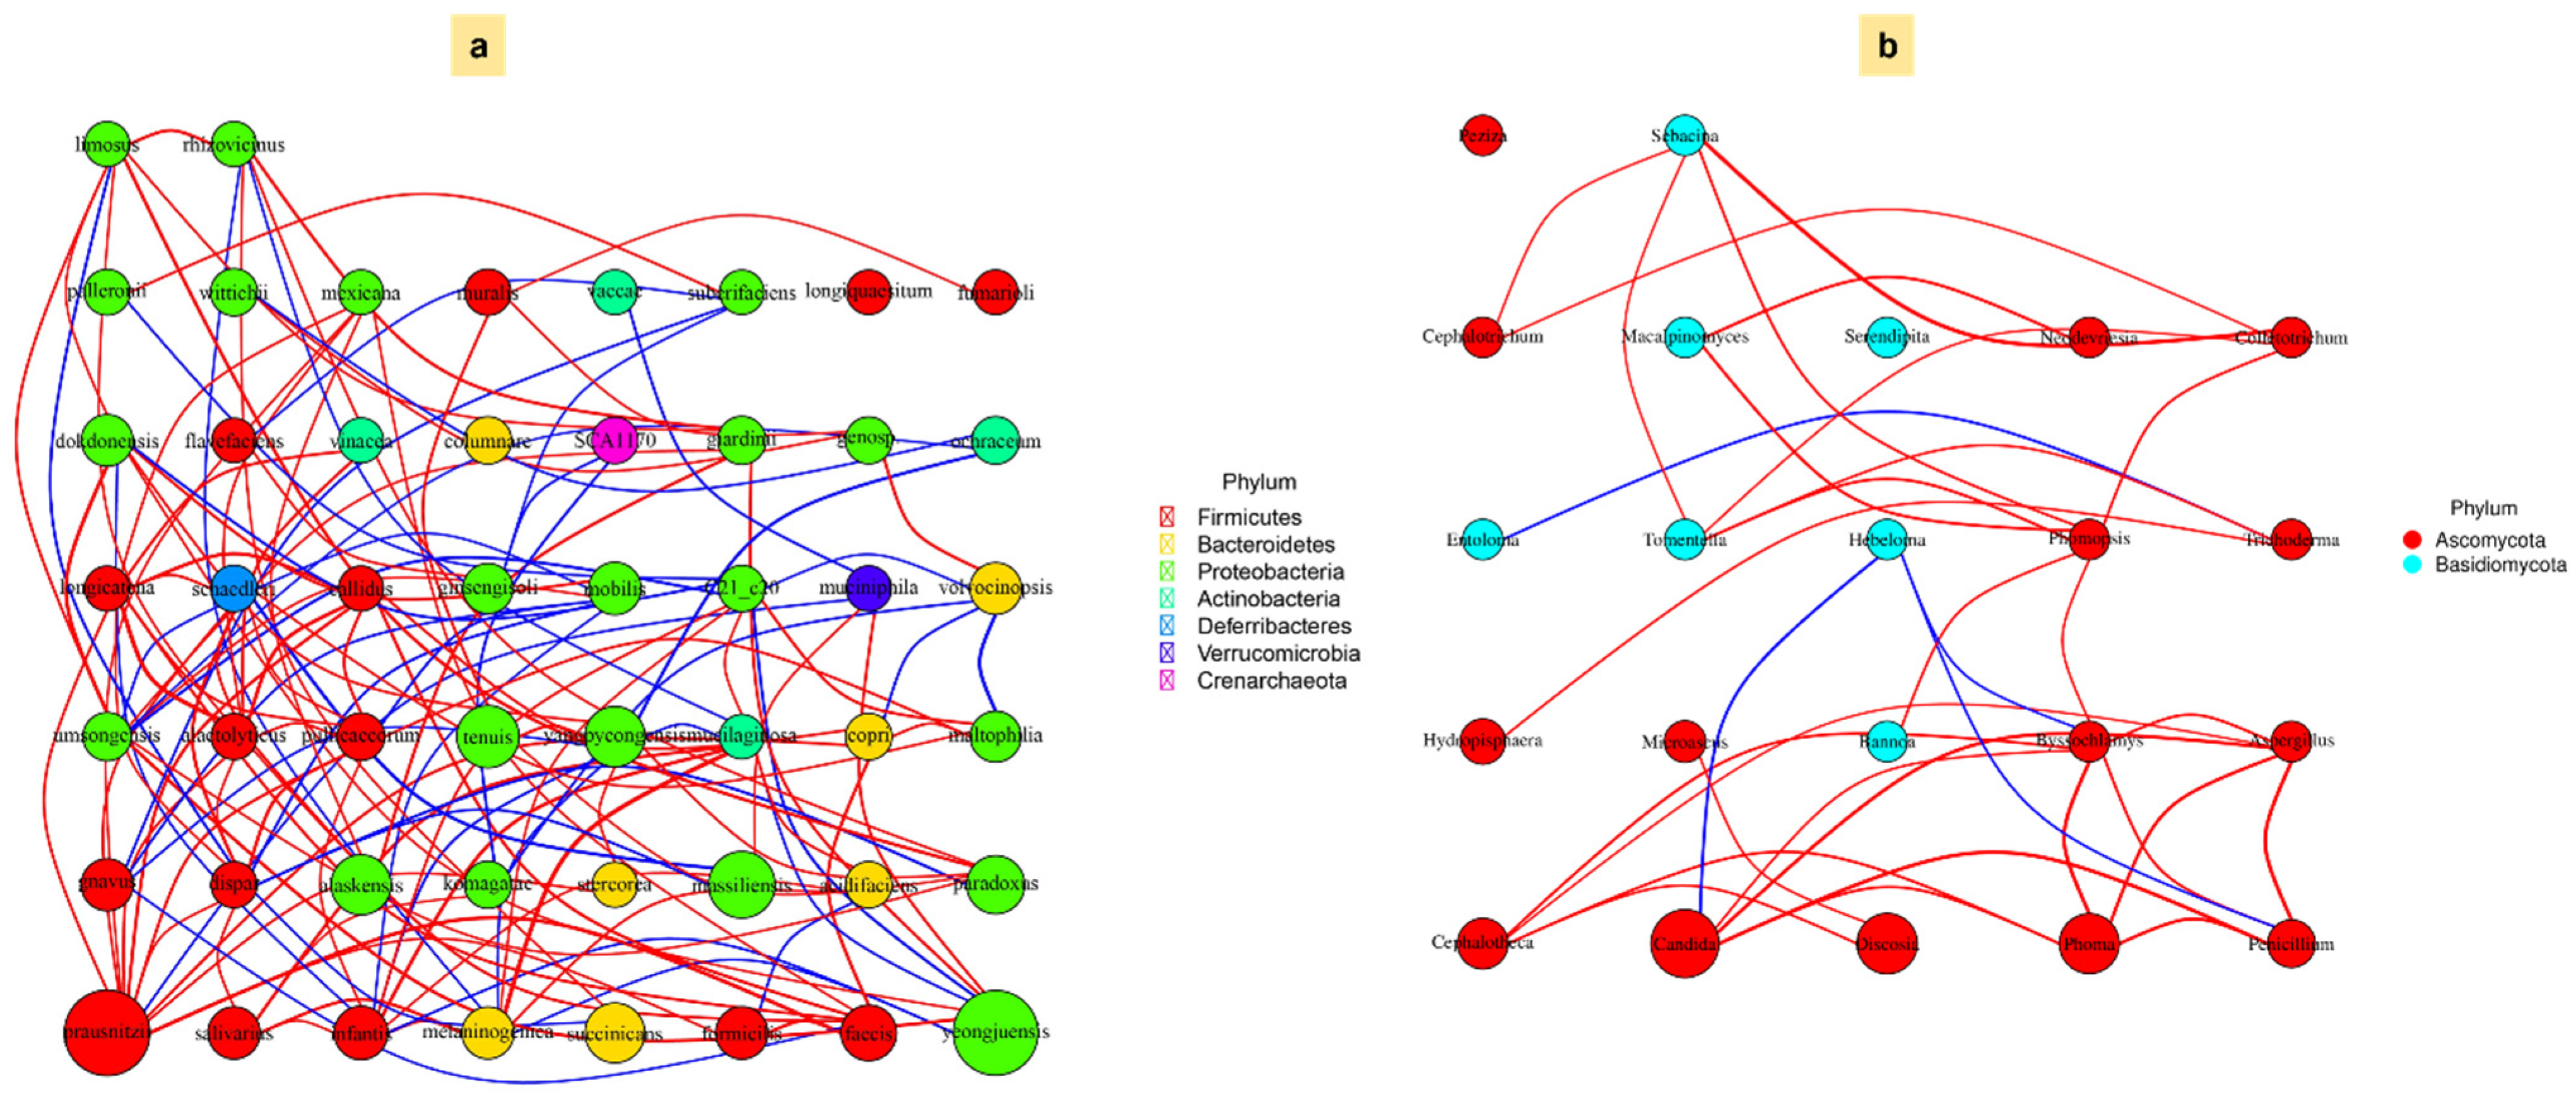
3.6. Association Between Microbial Community and Carbon Fractions Under Mulching Practices

The 3D PCA biplot depicted the relationship between bacterial and fungal communities with soil properties and carbon fractions under different mulching practices. The mulching practices had strong clustering effects on bacterial species and soil properties (Figure 13a; Table S1). In the relationship between bacterial and soil properties, treatments of TB and TG were closely clustered toward the positive side of 3D PCA. These treatments showed the highest contribution to catalase (length = 2.50), urease (2.52), and invertase (2.56) and showed strong correlations with the primary RDA axis (PC1 = 44.67%), indicating that enzymatic activity strongly shapes bacterial community structure (Table S1). Catalase and invertase had particularly high loadings on PC1 (>2.4), suggesting their dominant role in microbial carbon turnover. Soil pH and bulk density pointed in the opposite direction along PC1 (loadings ≈ −2.2), indicating that microbial groups on the negative PC1 side were associated with acidic and compacted soils. The C/N ratio and labile carbon index contributed more strongly to PC2 and PC3, influencing microbial shifts in the orthogonal axes. This gradient reveals distinct ecological strategies among microbial taxa responding to carbon quality versus quantity.
Bacterial community variation was significantly structured across three principal components (PCs) revealing key taxon-specific responses to soil biochemical gradients. Along PC1 (44.67% variance), bacterial assemblages negatively correlated with soil pH (–2.167) and bulk density (–2.219), indicating reduced abundance or diversity under acidic and compacted conditions. PC2 (26.50% variance) distinguished bacterial taxa according to nutrient stoichiometry and labile carbon availability: Gemm_1 (1.435), Gemmatimonadetes (1.263), and RB41 (1.104) were positively associated with high C/N ratios and labile carbon, whereas Kaistobacter (–1.452), Chitinophagaceae (–1.403), and Acidimicrobiales (–1.293) showed negative responses, suggesting suppression in such environments. PC3 (21.46% variance) highlighted nitrogen-driven bacterial shifts with strong positive loadings for other bacteria (2.226), Clostridiales (1.202), and Gemm_1 (0.939), reflecting their enrichment in N-rich soils. Conversely, Lysobacter (–1.410), Thermomonas (–1.155), and Sinobacteraceae (–1.126) were negatively correlated, indicating sensitivity to nitrogen enrichment or competitive exclusion under elevated N conditions. The clustering of TC and TG with soil attributes suggested their role in enhancing bacterial activities associated with the decomposition of maize straw. The treatment TN was distinctively separated from other mulching practices and aligned towards the negative side of 3D PCA, revealing the lowest effect of TN on soil physicochemical properties and carbon fractions. This treatment was clustered with bacterial species, including Kaistobacter, Xanthomonadaceae, Saprospiraceae, Ellin6075, and Thermomonas, which could not interact with soil properties.
The mulching practices were strongly associated with the fungal community (Figure 13b; Table S2). Treatments TG and TW aligned toward the positive side of 3D PCA along with fungal species, including Lasiosphaeriaceae, which were associated with carbon fraction attributes. Treatment TN reduced the fungal community and was separated from carbon fractions. The RDA biplots indicated that fungal community composition was primarily structured by soil enzymatic activities and carbon-related parameters. Invertase showed the highest correlation with PC1 (loading: 2.997), followed closely by dehydrogenase (2.956), total carbon (2.849), and microbial biomass carbon (2.835), underscoring their strong influence on community variation (Table S2). Soil pH (–2.700) and bulk density (–2.449) were negatively correlated with PC1, suggesting that higher values of these factors are associated with reduced fungal diversity along this axis. The second principal component (PC2), explaining 23.54% of the variation, was influenced by the carbon stability index (–1.985) and fungal taxa such as Chaetomiaceae (–1.985), indicating sensitivity to stable carbon conditions. PC3 (18.87%) was shaped by taxa including Agaricales (–2.117) and unspecified fungi (–2.026), which were negatively aligned with this axis, highlighting their association with lower nutrient or enzymatic activity environments. Overall, these results quantitatively demonstrate that soil biochemical properties—particularly enzyme activity and labile carbon pools—play a central role in driving fungal community composition. The fungal species Discosia, Helotiales, Leotiomycetes, Microascus brevicaulis, and Byssochlamys were aligned with the C/N ratio under TC treatment, which could play a role in the decomposition of complex carbon fractions. The PCA analysis through bacterial and fungal community association data with soil attributes is given in Figure 13c,d. The bacterial and soil association explains 49.52% of the variance in PCA1 and 24.61% of variance for PCA2 (Figure 13c), suggesting a robust distribution of bacterial diversity and soil properties across mulching practices. The fungal and soil association had a variance of 21.75% in PCA1 and 19.92% in PCA2, indicating less fungal diversity response than bacterial diversity associated with soil properties (Figure 13d). We observe distinct clustering in different mulching practices, with non-overlapping confidence ellipses demonstrating variations in bacterial and fungal responses related to soil properties. TG, TC, and TB treatments derived distinct bacterial community patterns, which might enhance soil carbon fractions.
Figure 14 illustrates the cluster correlation analysis between bacterial and fungal species and the soil attributes. Among bacterial species, Gemmatimonadetes, Gemm_1, Chitinophagaceae, Syntrophobacteraceae, RB41, and iii1_15 were positively associated with soil carbon fractions attributes (Figure 14a), indicating their significant roles in promoting carbon storage and microbial activity in soil ecosystems. The C/N ratio was positively associated with bacterial taxa RB41, revealing its role in balancing carbon and nitrogen dynamics. Among fungal communities, Lasiosphaeriaceae, Chaetothyriales, and Helotiales were positively associated with soil carbon fractions (Figure 14b), indicating their potential roles in carbon cycling and improving soil fertility. Conversely, multiple fungal taxa were negatively correlated with soil physical properties, including bulk density and soil water content. The associations between bacterial and fungal communities with soil properties reflected complex ecological communications where microbial communities might have influenced carbon fractions and nutrient availability, subjected to soil physicochemical properties. These interactions, in turn, significantly enhanced soil health and promoted crop growth, ultimately leading to increased crop yield (Supplementary Table S4).

4. Discussion

4.1. Mulching Practices Improved Soil Properties and Enzymatic Activities

This study demonstrated a reduction in pH by treatment TC and bulk density by TG, and promotion in soil water content by TB, field capacity by TG, total nitrogen by TC, and C/N ratio by TW. The reduction in soil bulk density and soil pH, and improvement in field capacity and total nitrogen under straw mulching treatments TG and TC, might be due to the accumulation of organic matter as a result of straw decomposition. This accumulated organic matter aggregates soil particles and promotes water-holding capacity and nutrient cycling. The reduced soil pH under straw mulching might be attributed to the release of organic acids during straw decomposition, which releases nutrients in slightly acidic soil. The enhanced C/N ratio under black plastic mulching could be due to slower organic matter turnover in response to reduced microbial activity and carbon over straw mulching. The moisture retention due to black plastic mulching may be a short-term effect, lacking the long-term effects on soil health due to straw mulching. Straw mulching aligns well with enhanced recycling biomass, resulting in improved soil properties and nutrient availability, fostering more resilient agroecosystems. This mulching treatment proved to be a practical implementation for sustainable land management in dryland conditions.
Similar to our findings, Jordan et al. [23] reported improvement in bulk density, soil porosity, aggregate stability, and water contents through straw mulching in no-tillage practices. Straw decomposition may release nitrogen and other nutrients in the soil, as we observed higher total N in the current study due to treatments TG and TC. Similarly, Truong et al. [24] reported increased N availability in soil and its uptake in wheat shoots through mulching with young faba bean straw. They also reported the extended N availability with reduced N through mulching with wheat straw leaching due to its slower decomposition. We observed a reduction in soil pH through maize straw mulching, possibly due to the release of organic acids and CO2 from straw decomposition, which have acidic reactions in the soil. The decomposition of organic matter promotes microbial activity, produces acidic metabolites, and reduces soil pH. Qin et al. [25] reported reduced soil pH through various thicknesses of maize straw mulching, which aligned with our current study. In contrast, plastic film mulching was effective in conserving soil moisture and introduces non-biodegradable waste which hinders nutrient cycling. This treatment does not contribute to organic matter in the soil of this study, which does not contribute to soil structure, nutrient availability, and soil pH. Its application is less compatible with agroecological implications.
In this study, the increase in the C/N ratio observed due to mulch treatment TW might be due to a rise in soil temperature and moisture, which causes a higher decomposition of organic matter. Straw decomposition in straw mulching treatments might be slow, which immobilizes nitrogen. We observed a lower C/N ratio from maize straw mulching treatments TG and TC, which is favorable for promoting N availability to plants. Truong et al. [24] reported increased N availability through mulching with wheat straw and young faba bean straw, which had a significantly lower C/N ratio. In the current study, soil enzymatic activities, including catalase, urease, invertase, and dehydrogenase, were substantially higher under maize straw mulching treatment TG than plastic mulching treatments TB and TW and flat cropping treatment TN. These findings were similar to previous work reported by Xie et al. [26], Zhang et al. [27], and Wen et al. [28]. Straw mulching promotes the microbial population and leads to a higher production of catalase, urease, invertase, and dehydrogenase activities due to the decomposition of organic matter. The increase in these soil enzymatic activities under maize straw mulching might be due to the decomposition of organic matter, which stimulates microbial activities that are involved in the mitigation of hydrogen peroxide accumulation and facilitate the continuous supply of organic substrates, N compounds, and carbohydrates, which further enhance soil enzyme activities. The lack of organic matter in plastic mulch treatment TB and TW might restrict microbial activity and cause a reduction in enzymatic activities, which might be valid for the current study.

4.2. Mulching Practices Regulated Soil Organic Carbon Fractions

Soil carbon fractions are critical indicators of soil health and fertility. In this study, straw mulching treatment TG promoted TC, soil organic carbon, microbial biomass carbon, easily oxidized organic carbon, and particulate organic carbon compared to plastic mulching treatment TB and TW. The increased soil C fractions under straw mulching can be associated with the stimulation of microbial activity due to the input of organic matter. The microbial decomposition of maize straw facilitates labile organic matter, which proliferates microbial activity and promotes enzymatic activity. It raises microbial biomass carbon and transforms organic matter into particulate organic carbon and easily oxidized carbon which are sensitive attributes of active carbon cycling. The build-up of soil organic carbon under straw mulching is stabilized by interacting with microbial byproducts and processes for carbon sequestration. Straw mulching aligns with core agroecological principles of the build-up of soil organic matter and promotes soil fertility. This treatment enriched the soil with carbon, which is critical for moisture retention, nutrient buffering, and microbial survival in dryland climate conditions. Previous studies have consistently shown that organic mulching, such as maize straw, enhances soil organic carbon fractions by providing organic matter, stimulating microbial activity, and improving soil structure [29,30,31]. These findings align with previous studies by Wang et al. [32] and Yang et al. [33], who reported an increase in dissolved organic carbon fraction under plastic mulching due increase in soil moisture and higher temperature, which leads to a higher breakdown of organic matter.
The active C in soil, including microbial biomass carbon, dissolved organic carbon, and easily oxidized organic carbon, is the most dynamic and rapid C cycling component, while labile C is a subset of active C in particulate organic carbon and light fraction organic carbon. This study estimated the active C attributes regarding active carbon fraction and dissolved carbon proportion, which were higher under maize straw mulching treatment TG than the plastic mulching treatments TB and TW. This increase in active C attributes under treatment TG might be due to the continuous input of organic matter, which stimulates microbial activity. Treatment TG may benefit from root exudates from maize seedlings, which is not the case for treatment TC, which lacks root exudates due to the absence of maize seedlings. These root exudates under TG treatment may have stimulated the microbial population to decompose organic matter. Our findings align with previous studies by Zhang et al. [30] and Sun et al. [34], who reported increased active C traits of microbial biomass carbon and easily oxidized organic carbon under straw mulching by stimulating microbial activity and continuous decomposition of organic matter. We observed the highest increase in the labile C attribute, including labile carbon proportion, under the straw mulching treatment TG, and labile carbon index under the plastic mulching treatment TB and TW. Our results are consistent with Huo et al. [35] and Dong et al. [36], who demonstrated increased labile carbon fractions through straw incorporation with plastic film mulch, improving organic matter and soil aggregation. The active carbon fractions play a critical role in carbon stability, soil aggregation, and nutrient availability [37]. Although we observed the highest increase in active carbon fractions under mulching treatment TG, the carbon stability index was relatively higher in mulching treatment TC, which might be due to a lack of roots in maize seedlings. The active C fractions serve as an energy source for the microbial population and contribute to short-term C storage. Still, labile C fractions exhibited intermediate stability and possibly contributed to long-term storage [38]. These active and labile carbon fractions promote microbial C use efficiency (microbial quotient), which we also observed to be higher under straw mulching treatment TG of the current study. These C-efficient microbial populations produce extracellular polysaccharides, which bind soil particles and improve soil structure [39,40]. These C fractions are also involved in nutrient cycling by serving as a reservoir of organic matter [41].

4.3. Soil Microbial Community Structure and Composition Under Mulching Practices

This study revealed a higher abundance and composition of bacterial communities compared to fungal communities, possibly due to the faster growth rate and greater adaptability of bacterial communities to applied mulching treatments. Bacterial communities thrive in soil conditions with readily available organic matter under straw mulching treatments. On the other hand, fungal communities had more specialized complex organic compounds that required slower decomposition processes. Fierer et al. [42] and Strickland and Rousk [43] reported similar findings comparing bacterial and fungal abundance in agricultural soils. They demonstrated bacterial communities’ dominance in nutrient-rich soil environments, which is true in our study, where under straw mulching treatment TG, fungal communities were more recalcitrant. Similar findings were also reported by Wang et al. [44], Tian et al. [45], and Dai et al. [46].
Microbial communities are sensitive to changes in soil microenvironment arising from different mulching practices [44]. The current study observed higher bacterial community diversity and composition in the straw mulching treatment (TG) compared to the plastic mulching treatments (TB and TW). The higher bacterial communities in straw mulching may be attributed to a continuous supply of organic carbon, which is an energy source for bacterial communities, promoting their growth and diversity. Straw mulching enhances soil moisture retention and aeration, providing favorable conditions for developing aerobic bacterial communities. Previously, Liu et al. [47] and Zhang et al. [30] also reported higher bacterial diversity and abundance under straw mulching due to increased soil organic carbon and nutrient availability. In this study, bacterial taxa Kaistobacter, iii1_15, Sinobacteraceae, and Xanthomonadaceae were highly abundant in treatment TG, which possibly might be due to their roles in the decomposition of organic matter. The bacterial species of the phylum Kaistobacter are associated with the turnover of organic matter and the degradation of xenobiotics. The iii1_15 in group Acidobacteria mainly contributed to carbon cycling in deficient conditions and was involved in decomposing recalcitrant organic matter. Sinobacteraceae members are involved in the decomposition of plant residues and the promotion of carbon and nitrogen turnover. Xanthomonadaceae members are well known for their roles in nutrient solubilization, biocontrol, biofilm formation, and plant growth promotion. The dominance of similar taxa was also reported by Janssen [48] and Fierer et al. [49] in soils enriched with organic matter.
We observed fungal communities’ dominance in abundance, diversity, and distribution under black plastic film mulching treatment (TB), which might be due to favorable fungal growth conditions of high humidity and low oxygen. Under plastic mulching, fungal communities had better adaptation to decompose complex organic matter. Li et al. [50] and Bonanomi et al. [51] reported an increase in fungal abundance under plastic mulching due to the dynamics of organic matter and altered soil conditions. This study demonstrated a higher abundance of fungal taxa, including unspecified fungi, Laiosphaeriaceae, and Sordariomycetes, well-known for decomposing plant residues and their involvement in nutrient cycling. The species of Lasiosphaeriaceae are involved in the degradation of complex organic matter, promoting soil aggregation, soil structure, and carbon stabilization. Sordariomycetes members play a key role in the decomposition of organic litter, carbon cycling, and the formation of soil structure by producing lignocellulolytic enzymes. Unspecified fungal taxa may include novel or under-characterized species that contribute to nutrient cycling and plant symbiosis. Previously, Tedersoo et al. [52] and Nguyen et al. [53] reported that these fungal taxa were dominant in soils with high organic matter content. Previous studies have found that plastic film mulching can significantly increase fungal diversity and richness and plays a vital role in microbial community structure [54,55]. Some studies have shown that soil microorganisms are highly responsive to ecological stressors like drought. A certain degree of environmental stress conditions might improve the structure and diversity of the soil bacterial community, and appropriate soil moisture conditions can create good conditions for bacterial growth and reproduction and maintain the structure and diversity of the bacterial community [56].
Microbial diversity has a specific relationship with ecological stability. Low diversity and poor stability are not conducive to sustainable development. Active organic carbon components are more sensitive to environmental changes than other forms of organic carbon [57]. In contrast, non-active organic carbon is often found in the soil due to its longer turnover time [58]. The bioavailability of each active organic carbon component varies, resulting in distinct roles for microorganisms in carbon turnover. Straw returning, whether left on the soil surface or mixed with soil, has been proven to maintain carbon storage, improve soil physical structure stability, maintain soil nutrient levels, and change microbial community composition [59]. Microorganisms are sensitive to environmental changes [57], so different mulching measures may significantly impact microbial diversity and community composition. The response of active carbon components to environmental changes was not consistent. In soils with a higher active organic carbon content, the relative abundance of Bacteroides was higher [60]. Additionally, Bacteroides were associated with organic carbon accumulation [61]. These researchers focus more on changes in organic carbon storage or bacterial abundance than potential linkages between specific bacterial taxa and organic carbon components [62]. However, long-term plastic film mulching results in numerous plastic residues in the soil, harming the soil environment and ultimately restricting agriculture’s sustainable development. The overall composition of soil microbial community structure may vary significantly in different habitats, but the dominant flora is similar [63].

5. Conclusions

This study demonstrated an increase in soil bulk density, field capacity, total nitrogen, and enzymatic activities (catalase, urease, invertase, and dehydrogenase), and a decrease in soil pH under the maize straw mulching treatment TG. This treatment had higher total carbon, soil organic carbon, microbial biomass carbon, and particulate organic carbon, whereas white plastic mulching uniquely influenced dissolved organic carbon and easily oxidizable carbon fractions. Active carbon fraction and microbial quotient were significantly higher by 45% and 34% under TG treatment, highlighting its role in enhancing soil carbon dynamics and microbial activity. Microbial community analysis revealed a higher abundance and diversity of bacterial communities under straw mulching, particularly taxa such as Kaistobacter, iii1_15, Sinobacteraceae, and Xanthomonadaceae. In contrast, fungal communities, including unspecified fungi, Laiosphaeriaceae, and Sordariomycetes, dominated under black plastic mulching due to higher soil water and temperature. The TG treatment is recommended for arid regions as it supports microbial activity and improves soil quality. These findings provide valuable insights into microbial and carbon dynamics under straw mulching in semi-arid maize systems, and future studies across different geographic regions could help determine the broader applicability of these trends. In the future, the researcher needs to investigate the interplay between mulching practices, climate variability, and crop productivity to develop optimized, sustainable agricultural management strategies.

Supplementary Materials

The following supporting information can be downloaded at: https://www.mdpi.com/article/10.3390/agronomy15061412/s1, Figure S1: Weather data of the experimental site in terms of precipitation, maximum temperature, and minimum temperature; Table S1: The 3D PCA reveals the relationship between soil traits and bacterial community based on their loadings; Table S2: The 3D PCA reveals the relationship between soil traits and fungal community based on their loadings; Table S3: Principal component analysis (PCA) factor loadings for bacterial and fungal metabolic functional abundance across treatments; Table S4: The mulching practices improve the maize yield.

Author Contributions

Conceptualization, L.P. and J.L.; Methodology, J.L.; Validation, L.P., H.W., H.Z., X.W., M.Z.M. and Y.Z.; Formal analysis, H.W., H.Z. and X.W.; Investigation, H.W., H.Z. and Y.Z.; Resources, L.P., H.W. and H.Z.; Data curation, L.P. and M.Z.M.; Writing—original draft, L.P.; Writing—review and editing, L.P., J.L., X.W., M.Z.M. and Y.Z.; Visualization, H.W. and H.Z.; Supervision, L.P. and J.L. All authors have read and agreed to the published version of the manuscript.

Funding

This research was funded by the National Natural Science Foundation of China (32160525 and 82160721), Gansu Provincial Natural Science Foundation (20JR5RA034), Industry-University-Research Collaboration Project (GSAU-JSYF-2024-22 and GSAU-JSYF-2024-23), Science and Technology Project of the Gansu Provincial Department of Agriculture and Rural Affairs (GNKJ-2024-58), Natural Science Foundation of Gansu Province (23JRRA1412), and Education Department of Gansu Province: Youth Doctoral Support Project (2024QB-069).

Data Availability Statement

The original contributions presented in this study are included in the article/Supplementary Material. Further inquiries can be directed to the corresponding authors.

Acknowledgments

We appreciate and thank the anonymous reviewers for their helpful comments that led to the overall improvement of the manuscript. We also thank the Journal Editor Board for their help and patience throughout the review process.

Conflicts of Interest

The authors declare no conflicts of interest.

References

  1. Reynolds, J.F.; Smith, D.M.; Lambin, E.F.; Turner, B.L.; Mortimore, M.; Batterbury, S.P.; Downing, T.E.; Dowlatabadi, H.; Fernández, R.J.; Herrick, J.E.; et al. Global desertification: Building a science for dryland development. Science 2007, 316, 847–851. [Google Scholar] [CrossRef] [PubMed]
  2. Peng, Z.; Wang, L.; Xie, J.; Li, L.; Coulter, J.A.; Zhang, R.; Luo, Z.; Cai, L.; Carberry, P.; Whitbread, A. Conservation tillage increases yield and precipitation use efficiency of wheat on the semi-arid Loess Plateau of China. Agric. Water Manag. 2020, 231, 106024. [Google Scholar] [CrossRef]
  3. Balwinder, S.; Eberbach, P.L.; Humphreys, E.; Kukal, S.S. The effect of rice straw mulch on evapotranspiration, transpiration and soil evaporation of irrigated wheat in Punjab, India. Agric. Water Manag. 2011, 98, 1847–1855. [Google Scholar] [CrossRef]
  4. Satishkumar, N.; Tevari, P.; Singh, A. A study on constraints faced by farmers in adapting to climate change in rainfed agriculture. J. Hum. Ecol. 2013, 44, 23–28. [Google Scholar] [CrossRef]
  5. Gan, Y.; Siddique, K.H.; Turner, N.C.; Li, X.G.; Niu, J.Y.; Yang, C.; Liu, L.; Chai, Q. Ridge-furrow mulching systems—An innovative technique for boosting crop productivity in semiarid rain-fed environments. Adv. Agron. 2013, 118, 429–476. [Google Scholar]
  6. Yu, Y.Y.; Turner, N.C.; Gong, Y.H.; Li, F.M.; Fang, C.; Ge, L.J.; Ye, J.S. Benefits and limitations to straw-and plastic-film mulch on maize yield and water use efficiency: A meta-analysis across hydrothermal gradients. Eur. J. Agron. 2018, 99, 138–147. [Google Scholar] [CrossRef]
  7. Lan, X.; Chai, S.; Coulter, J.A.; Cheng, H.; Chang, L.; Huang, C.; Li, R.; Chai, Y.; Li, Y.; Ma, J.; et al. Maize straw strip mulching as a replacement for plastic film mulching in maize production in a semiarid region. Sustainability 2020, 12, 6273. [Google Scholar] [CrossRef]
  8. Zhao, H.; Liu, G.; Dou, Y.; Yang, H.; Wang, T.; Wang, Z.; Khan, A.A. Plastic mulch increases dryland wheat yield and water-use productivity, while straw mulch increases soil water storage. J. Integr. Agric. 2024, 23, 3174–3185. [Google Scholar] [CrossRef]
  9. Fu, X.; Wang, J.; Sainju, U.M.; Zhao, F.; Liu, W. Soil microbial community and carbon and nitrogen fractions responses to mulching under winter wheat. Appl. Soil Ecol. 2019, 139, 64–68. [Google Scholar] [CrossRef]
  10. Bhattacharyya, S.S.; Ros, G.H.; Furtak, K.; Iqbal, H.M.; Parra-Saldívar, R. Soil carbon sequestration–An interplay between soil microbial community and soil organic matter dynamics. Sci. Total Environ. 2022, 815, 152928. [Google Scholar] [CrossRef]
  11. Qin, W.; Niu, L.; You, Y.; Cui, S.; Chen, C.; Li, Z. Effects of conservation tillage and straw mulching on crop yield, water use efficiency, carbon sequestration and economic benefits in the Loess Plateau region of China: A meta-analysis. Soil Tillage Res. 2024, 238, 106025. [Google Scholar] [CrossRef]
  12. Liu, B.; Cheng, X.; He, X.; Bei, Q.; Dai, Y.; Wang, Y.; Zhu, B.; Zhang, K.; Tian, X.; Duan, M.; et al. Effects of bio-mulching on wheat soil microbial community and carbon utilization efficiency in southwest China. Catena 2022, 214, 106260. [Google Scholar] [CrossRef]
  13. Du, Z.; Wang, Y.; Huang, J.; Lu, N.; Liu, X.; Lou, Y.; Zhang, Q. Consecutive Biochar Application Alters Soil Enzyme Activities in the Winter Wheat–Growing Season. Soil Sci. 2014, 179, 75–83. [Google Scholar] [CrossRef]
  14. Li, Y.M.; Duan, Y.; Wang, G.L.; Wang, A.Q.; Shao, G.Z.; Meng, X.H.; Hu, H.Y.; Zhang, D.M. Straw alters the soil organic carbon composition and microbial community under different tillage practices in a meadow soil in Northeast China. Soil Tillage Res. 2021, 208, 104879. [Google Scholar] [CrossRef]
  15. Bai, J.; Huang, Y.; Bai, Y.; Chen, D.; Haider, S.; Song, J.; Moreira, B.R.D.A.; Ren, G.; Yang, G.; Feng, Y.; et al. Impact of straw-biochar amendments on microbial activity and soil carbon dynamics in wheat-maize system. Soil Tillage Res. 2024, 244, 106284. [Google Scholar] [CrossRef]
  16. Blake, G.R. Bulk density. In Methods of Soil Analysis: Part 1 Physical and Mineralogical Properties, Including Statistics of Measurement and Sampling; The American Society of Agronomy, Inc.: Madison, WI, USA, 1965; Volume 9, pp. 374–390. [Google Scholar]
  17. Bao, S.D. Soil Agrochemical Analysis; China Agriculture Press: Beijing, China, 2016; pp. 30–34. [Google Scholar]
  18. Jenkinson, D.S. Determination of microbial biomass carbon and nitrogen in soil. In Advances in Nitrogen Cycling in Agricultural Systems; Wilson, J.R., Ed.; CABI: Wallingford, UK, 1988; pp. 368–386. [Google Scholar]
  19. Cadle, S.H.; Groblicki, P.J. An evaluation of methods for the determination of organic and elemental carbon in particulate samples. In Particulate Carbon: Atmospheric Life Cycle; Springer: Boston, MA, USA, 1982; pp. 89–109. [Google Scholar]
  20. Zhang, Z.; Zha, T.; Yu, Y.; Zhang, X.; Smith, P.; Rodrigo-Comino, J. Evaluating indices of soil organic carbon stability. A case study for forest restoration projects near Beijing, China. Ecol. Indic. 2022, 142, 109222. [Google Scholar] [CrossRef]
  21. Weil, R.R.; Islam, K.R.; Stine, M.A.; Gruver, J.B.; Samson-Liebig, S.E. Estimating active carbon for soil quality assessment: A simplified method for laboratory and field use. Am. J. Altern. Agric. 2003, 18, 3–17. [Google Scholar] [CrossRef]
  22. Anderson, T.H.; Domsch, K.H. Application of eco-physiological quotients (qCO2 and qD) on microbial biomasses from soils of different cropping histories. Soil Biol. Biochem. 1990, 22, 251–255. [Google Scholar] [CrossRef]
  23. Jordán, A.; Zavala, L.M.; Gil, J. Effects of mulching on soil physical properties and runoff under semi-arid conditions in southern Spain. Catena 2010, 81, 77–85. [Google Scholar] [CrossRef]
  24. Truong, T.H.H.; Kristiansen, P.; Marschner, P. Influence of mulch C/N ratio and decomposition stage on plant N uptake and N availability in soil with or without wheat straw. J. Plant Nutr. Soil Sci. 2019, 182, 879–887. [Google Scholar] [CrossRef]
  25. Qin, T.; Wang, L.; Zhao, J.; Zhou, G.; Li, C.; Guo, L.; Jiang, G. Effects of straw mulching thickness on the soil health in a temperate organic vineyard. Agriculture 2022, 12, 1751. [Google Scholar] [CrossRef]
  26. Xie, X.; Pu, L.; Wang, Q.; Zhu, M.; Xu, Y.; Zhang, M. Response of soil physicochemical properties and enzyme activities to long-term reclamation of coastal saline soil, Eastern China. Sci. Total Environ. 2017, 607, 1419–1427. [Google Scholar] [CrossRef] [PubMed]
  27. Zhang, M.; Zhao, G.; Li, Y.; Wang, Q.; Dang, P.; Qin, X.; Zou, Y.; Chen, Y.; Siddique, K.H. Straw incorporation with ridge–furrow plastic film mulch alters soil fungal community and increases maize yield in a semiarid region of China. Appl. Soil Ecol. 2021, 167, 104038. [Google Scholar] [CrossRef]
  28. Wen, L.; Peng, Y.; Zhou, Y.; Cai, G.; Lin, Y.; Li, B. Effects of conservation tillage on soil enzyme activities of global cultivated land: A meta-analysis. J. Environ. Manag. 2023, 345, 118904. [Google Scholar] [CrossRef]
  29. Blanco-Canqui, H.; Lal, R. Soil structure and organic carbon relationships following 10 years of wheat straw management in no-till. Soil Tillage Res. 2007, 95, 240–254. [Google Scholar] [CrossRef]
  30. Zhang, X.; Xin, X.; Zhu, A.; Yang, W.; Zhang, J.; Ding, S.; Mu, L.; Shao, L. Linking macroaggregation to soil microbial community and organic carbon accumulation under different tillage and residue managements. Soil Tillage Res. 2018, 178, 99–107. [Google Scholar] [CrossRef]
  31. Liu, X.; Zhou, F.; Hu, G.; Shao, S.; He, H.; Zhang, W.; Zhang, X.; Li, L. Dynamic contribution of microbial residues to soil organic matter accumulation influenced by maize straw mulching. Geoderma 2019, 333, 35–42. [Google Scholar] [CrossRef]
  32. Wang, X.; Jia, Z.; Liang, L.; Zhao, Y.; Yang, B.; Ding, R.; Wang, J.; Nie, J. Changes in soil characteristics and maize yield under straw returning system in dryland farming. Field Crops Res. 2018, 218, 11–17. [Google Scholar] [CrossRef]
  33. Yang, J.; Qin, R.; Shi, X.; Wei, H.; Sun, G.; Li, F.M.; Zhang, F. The effects of plastic film mulching and straw mulching on licorice root yield and soil organic carbon content in a dryland farming. Sci. Total Environ. 2022, 826, 154113. [Google Scholar] [CrossRef]
  34. Sun, X.; Wang, G.; Ma, Q.; Liao, J.; Wang, D.; Guan, Q.; Jones, D.L. Organic mulching promotes soil organic carbon accumulation to deep soil layer in an urban plantation forest. For. Ecosyst. 2021, 8, 2. [Google Scholar] [CrossRef]
  35. Huo, L.; Pang, H.; Zhao, Y.; Wang, J.; Lu, C.; Li, Y. Buried straw layer plus plastic mulching improves soil organic carbon fractions in an arid saline soil from Northwest China. Soil Tillage Res. 2017, 165, 286–293. [Google Scholar] [CrossRef]
  36. Dong, Q.; Yang, Y.; Yu, K.; Feng, H. Effects of straw mulching and plastic film mulching on improving soil organic carbon and nitrogen fractions, crop yield and water use efficiency in the Loess Plateau, China. Agric. Water Manag. 2018, 201, 133–143. [Google Scholar] [CrossRef]
  37. Ratnayake, R.R.; Roshanthan, T.; Gnanavelrajah, N.; Karunaratne, S.B. Organic carbon fractions, aggregate stability, and available nutrients in soil and their interrelationships in tropical cropping systems: A case study. Eurasian Soil Sci. 2019, 52, 1542–1554. [Google Scholar] [CrossRef]
  38. Li, J.; Wen, Y.; Li, X.; Li, Y.; Yang, X.; Lin, Z.; Song, Z.; Cooper, J.M.; Zhao, B. Soil labile organic carbon fractions and soil organic carbon stocks as affected by long-term organic and mineral fertilization regimes in the North China Plain. Soil Tillage Res. 2018, 175, 281–290. [Google Scholar] [CrossRef]
  39. Jiang, X.; Wright, A.L.; Wang, J.; Li, Z. Long-term tillage effects on the distribution patterns of microbial biomass and activities within soil aggregates. Catena 2011, 87, 276–280. [Google Scholar] [CrossRef]
  40. Rasche, F. Molecular structure of dissolved organic carbon in a sandy soil receiving contrasting quality organic residues. Geoderma 2023, 440, 116720. [Google Scholar]
  41. Olk, D.C. A chemical fractionation for structure–function relations of soil organic matter in nutrient cycling. Soil Sci. Soc. Am. J. 2006, 70, 1013–1022. [Google Scholar] [CrossRef]
  42. Fierer, N.; Bradford, M.A.; Jackson, R.B. Toward an ecological classification of soil bacteria. Ecology 2007, 88, 1354–1364. [Google Scholar] [CrossRef]
  43. Strickland, M.S.; Rousk, J. Considering fungal: Bacterial dominance in soils–methods, controls, and ecosystem implications. Soil Biol. Biochem. 2010, 42, 1385–1395. [Google Scholar] [CrossRef]
  44. Wang, Y.; Liu, L.; Luo, Y.; Awasthi, M.K.; Yang, J.; Duan, Y.; Li, H.; Zhao, Z. Mulching practices alter the bacterial-fungal community and network in favor of soil quality in a semiarid orchard system. Sci. Total Environ. 2020, 725, 138527. [Google Scholar] [CrossRef]
  45. Tian, L.; Yu, S.; Zhang, L.; Dong, K.; Feng, B. Mulching practices manipulate the microbial community diversity and network of root associated compartments in the Loess Plateau. Soil Tillage Res. 2022, 223, 105476. [Google Scholar] [CrossRef]
  46. Dai, Z.; Fan, J.; Fu, W.; Niu, X.; Yang, Q.; Hao, M. Changes in soil microbial community and co-occurrence network after long-term no-tillage and mulching in dryland farming. Plant Soil 2024, 495, 201–220. [Google Scholar] [CrossRef]
  47. Liu, J.; Sui, Y.; Yu, Z.; Shi, Y.U.; Chu, H.; Jin, J.; Liu, X.; Wang, G. High throughput sequencing analysis of biogeographical distribution of bacterial communities in the black soils of northeast China. Soil Biol. Biochem. 2014, 70, 113–122. [Google Scholar] [CrossRef]
  48. Janssen, P.H. Identifying the dominant soil bacterial taxa in libraries of 16S rRNA and 16S rRNA genes. Appl. Environ. Microbiol. 2006, 72, 1719–1728. [Google Scholar] [CrossRef]
  49. Fierer, N.; Lauber, C.L.; Ramirez, K.S.; Zaneveld, J.; Bradford, M.A.; Knight, R. Comparative metagenomic, phylogenetic and physiological analyses of soil microbial communities across nitrogen gradients. ISME J. 2012, 6, 1007–1017. [Google Scholar] [CrossRef]
  50. Li, X.; Rui, J.; Mao, Y.; Yannarell, A.; Mackie, R. Dynamics of the bacterial community structure in the rhizosphere of a maize cultivar. Soil Biol. Biochem. 2014, 68, 392–401. [Google Scholar] [CrossRef]
  51. Bonanomi, G.; Lorito, M.; Vinale, F.; Woo, S.L. Organic amendments, beneficial microbes, and soil microbiota: Toward a unified framework for disease suppression. Annu. Rev. Phytopathol. 2018, 56, 1–20. [Google Scholar] [CrossRef] [PubMed]
  52. Tedersoo, L.; Bahram, M.; Põlme, S.; Kõljalg, U.; Yorou, N.S.; Wijesundera, R.; Ruiz, L.V.; Vas-co-Palacios, A.M.; Thu, P.Q.; Suija, A.; et al. Global diversity and geography of soil fungi. Science 2014, 346, 1256688. [Google Scholar] [CrossRef]
  53. Nguyen, N.H.; Song, Z.; Bates, S.T.; Branco, S.; Tedersoo, L.; Menke, J.; Schilling, J.S.; Ken-nedy, P.G. FUNGuild: An open annotation tool for parsing fungal community datasets by ecological guild. Fungal Ecol. 2016, 20, 241–248. [Google Scholar] [CrossRef]
  54. Dong, W.; Si, P.; Liu, E.; Yan, C.; Zhang, Z.; Zhang, Y. Influence of film mulching on soil microbial community in a rainfed region of northeastern China. Sci. Rep. 2017, 7, 8468. [Google Scholar] [CrossRef]
  55. Yang, Y.; Huang, X.; Li, Y.; Liu, Y.; Zhang, Y.; Zhu, H.; Jiang, T. Characteristics of the soil microbial community structure under long-term chemical fertilizer application in yellow soil paddy fields. Agronomy 2024, 14, 1186. [Google Scholar] [CrossRef]
  56. Zhalnina, K.; Dias, R.; de Quadros, P.D.; Davis-Richardson, A.; Camargo, F.A.; Clark, I.M.; McGrath, S.P.; Hirsch, P.R.; Triplett, E.W. Soil pH determines microbial diversity and composition in the park grass experiment. Microb. Ecol. 2015, 69, 395–406. [Google Scholar] [CrossRef]
  57. Divyadarshan, A.; Naik, S.K.; Dhakar, M.K.; Purakayastha, T.J.; Mahanta, D.; Choudhary, M.; Mali, S.S.; Kumar, R.; Dash, A.K.; Das, A.; et al. Soil Carbon Dynamics and Soil Quality Index Under Different Agricultural Production Systems in Rain-Fed Ecosystems. Land Degrad. Dev. 2025, 36, 3003–3016. [Google Scholar] [CrossRef]
  58. Zhang, Y.-L.; Yao, S.-H.; Cao, X.-Y.; Schmidt-Rohr, K.; Olk, D.C.; Mao, J.-D.; Zhang, B. Structural evidence for soil organic matter turnover following glucose addition and microbial controls over soil carbon change at different horizons of a Mollisol. Soil Biol. Biochem. 2018, 119, 63–73. [Google Scholar] [CrossRef]
  59. Yang, F.; He, B.; Dong, B.; Zhang, G. Film mulched ridge–furrow tillage improves the quality and fertility of dryland agricultural soil by enhancing soil organic carbon and nutrient stratification. Agric. Water Manag. 2024, 292, 108686. [Google Scholar] [CrossRef]
  60. Lian, T.; Jin, J.; Wang, G.; Tang, C.; Yu, Z.; Li, Y.; Liu, J.; Zhang, S.; Liu, X. The fate of soybean residue-carbon links to changes of bacterial community composition in Mollisols differing in soil organic carbon. Soil Biol. Biochem. 2017, 109, 50–58. [Google Scholar] [CrossRef]
  61. Liu, L.; Kong, J.; Cui, H.; Zhang, J.; Wang, F.; Cai, Z.; Huang, X. Relationships of decomposability and C/N ratio in different types of organic matter with suppression of Fusarium oxysporum and microbial communities during reductive soil disinfestation. Biol. Control. 2016, 101, 103–113. [Google Scholar] [CrossRef]
  62. Pu, C.; Kan, Z.-R.; Liu, P.; Qi, J.-Y.; Xin, Z.; Zhang, H.-L. Residue management induced changes in soil organic carbon and total nitrogen under different tillage practices in the North China Plain. J. Integr. Agric. 2019, 18, 1337–1347. [Google Scholar] [CrossRef]
  63. Zhang, F.; Li, H.; Zhu, J.; Si, M.; Fan, B.; Zhou, H.; Li, Y. Precipitation Determines the Spatial Variability of Vegetation and Topsoil Organic Carbon Densities of Alpine Grasslands in the Qinghai-Tibetan Plateau, China. Ecosystems 2025, 28, 12. [Google Scholar] [CrossRef]
Figure 1. Effect of mulching practices on soil pH (a), bulk density (b), soil water content (c), field capacity (d), total nitrogen (e), and C/N ratio (f); alphabetical letters indicate that the difference between different treatments is significant (p < 0.05). BD, bulk density; SWC, soil water content; and C/N ratio, carbon/nitrogen ratio.
Agronomy 15 01412 g001
Figure 2. Effects of mulching practices on soil catalase (a), urease (b), invertase (c), and dehydrogenase (d) activities; alphabetical letters indicate that the difference between treatments is significant (p < 0.05).
Agronomy 15 01412 g002
Figure 3. Effects of mulching practices on total carbon (a), soil organic carbon (b), microbial biomass carbon (c), dissolved organic carbon (d), easily oxidized carbon (e), and particulate organic carbon (f); alphabetical letters indicate that the treatment difference is significant (p < 0.05). C, carbon; SOC, soil organic carbon; MBC, microbial biomass carbon; DOC, dissolved organic carbon; EOC, easily oxidized organic carbon; and POC, particulate organic carbon.
Agronomy 15 01412 g003
Figure 4. The carbon fraction-derived attributes including carbon stability index (a), active carbon fraction (b), labile carbon proportion (c), dissolved carbon proportion (d), labile carbon index (e), and microbial quotient (f) in response to mulching practices; alphabetical letters indicate that the treatment difference is significant (p < 0.05). CSI, carbon stability index; ACF, active carbon fraction; LCF labile carbon proportion; DCP, dissolved carbon proportion; LCI, labile carbon index; and qM, microbial quotient.
Agronomy 15 01412 g004
Figure 5. Venn diagram of bacterial community (a) and fungal community (b) under different mulching practices.
Agronomy 15 01412 g005
Figure 6. The α-diversity of the microbial community is in the form of the Chao1 and Shannon index under different mulching practices. The bacterial α-diversity is presented in the Chao1 index (a) and Shannon index (b) under mulching practices; the fungal α-diversity is presented in the form of the Chao1 index (c) and Shannon index (d) under different mulching practices.
Agronomy 15 01412 g006
Figure 7. β-diversity in the form of 3D PCA of bacterial diversity (a) and fungal diversity (b) and NMDS of bacterial diversity (c) and fungal diversity (d).
Agronomy 15 01412 g007
Figure 8. The relative distribution of bacterial species (a) and fungal species (b) under different mulching practices; the ordinate represents the ratio of the number of sequences annotated to the total annotated data, and the top-down color sequence of the histogram corresponds to the color sequence of the right-hand legend.
Agronomy 15 01412 g008
Figure 9. The heatmap of the top 20 bacterial species (a) and fungal species (b) under different mulching practices; the top-down color sequence of the histogram corresponds to the color sequence of the right-hand legend.
Agronomy 15 01412 g009
Figure 10. The distribution of bacterial genera (a) and fungal genera (b) under different mulching practices: The left side of Figure 9a,b contains an evolutionary tree of bacterial and fungal phylum, and branches of different colors represent different bacterial and fungal genera; each branch at the end represents an OTU, and the end is annotated with the genus classification corresponding to the OTU. The right side of Figure 9a,b contains a heatmap of the normalized abundance; the more significant the value, the higher the relative abundance.
Agronomy 15 01412 g010
Figure 11. The co-occurrence network of bacterial phyla (a) and fungal phyla (b) under different mulching practices. Nodes represent individual operational taxonomic units; the margin represents a significant Spearman correlation; different colors represent the distribution of bacterial and fungal phyla; and the size of each node is proportional to the abundance of bacterial and fungal genera.
Agronomy 15 01412 g011
Figure 12. The microbial functional metabolic pathway abundance and PCA analysis under different mulching practices. The top 20 pathways of the bacterial and fungal community under different mulching practices are listed in panels (a,b); more than 20 pathways were grouped into others presenting less abundant pathways. The PCAs of bacterial metabolites and fungal metabolites under different mulching practices are given in panels (c,d); these PCA results revealed the clustering of mulching practices indicating similarities in their bacterial and fungal metabolic functions.
Agronomy 15 01412 g012
Figure 13. The 3D PCA biplot reveals the association of bacterial communities (a) and fungal communities with soil attributes. The PCA cluster plot demonstrated the clustering of different mulching practices with overlapping confidence ellipses variations in the bacterial community (c) and fungal community (d) association with soil attributes. The biplots (a,b) represent the soil attributes and microbial communities; the vector length represents the magnitude of each variable’s influence on microbial community structure. The higher length indicates stronger contributions to variation in community composition; the direction of correlation with each principal axis is indicated by the positive and negative sides of PCA1, PCA2, and PCA3.
Agronomy 15 01412 g013
Figure 14. The cluster heatmap of correlations between bacterial communities (a) and fungal communities (b) with soil properties and carbon fractions attributes. These clustered heatmaps illustrated the correlations between microbial communities on the y-axis with soil properties on the x-axis using a color-coded scheme; the positive correlations are indicated in red shades while negative correlations are presented in green shades with the intensity indicating correlation strength. Microbial communities are clustered based on their phylogenetic relationships with annotations of their respective phyla indicating their functional similarities and ecological preferences according to soil conditions.
Agronomy 15 01412 g014
Table 1. The results of assumption testing and the non-parametric test of soil traits.
Soil TraitsShapiro–Wilk Test *Levene Test **Non-Parametric Test ***
Wp-ValueFp-ValueFp-Value
Soil pH0.80010.00372.6890.0932.750.0886
Soil water content0.95260.56703.6780.0436.060.0097
Bulk density0.98790.99795.0880.0172.210.1410
Field capacity0.95180.55302.5280.1071.230.3583
Catalase activity0.82220.00728.5750.00327.50.0000
Urease activity0.86130.02521.9050.1863.060.0692
Invertase activity0.97150.87980.4870.74516.90.0002
Sucrase activity0.91640.16992.2360.1385.290.0149
Total carbon0.88990.06687.4030.0059.850.0017
Total nitrogen0.92470.22712.9090.0781.680.2296
C/N ratio0.97230.88992.3710.1224.950.0184
Soil organic carbon0.93550.32950.1910.93825.90.0000
Dissolved organic carbon0.95420.59360.3220.8578.210.0033
Microbial biomass carbon0.95680.63720.6090.66527.50.0000
Easily oxidizable carbon0.89150.07071.0190.44333.70.0000
Particulate organic carbon0.91280.14970.2740.88843.20.0000
Active carbon fraction0.96900.84280.2250.93633.70.0000
Carbon stability index0.94140.40060.2140.92543.20.0000
Dissolved carbon proportion0.91020.13660.2620.92916.60.0002
Labile carbon index0.92790.25340.2050.91743.20.0000
Labile carbon proportion0.98030.97170.2060.92923.10.0000
Microbial quotient0.97650.94000.2330.93612.90.0006
* In the Shapiro–Wilk test, W means how “normal” the data are numerically, while the p-value means whether that deviation from normality is statistically significant. ** In the Levene test, F is the degree of variance inequality across groups; the p-value demonstrates whether the inequality is statistically significant. p > 0.05 means failure to reject the null hypothesis, and p ≤ 0.05 means rejection of the null hypothesis. *** In the non-parametric Kruskal–Wallis test, F is the ratio of variation between groups to variation within groups, while the p-value indicates whether that variation is statistically significant. The df of the ANOVA test was four.
Table 2. Results of single-factor PERMANOVA analysis showing the effects of groupings on microbial traits.
Microbial TraitsSSMSF. ModelR2Pr (>F)
Bacterial Abundance0.5091220.1272801.4339110.3645000.001
Fungal Abundance0.9018390.2254591.8397100.4239240.030
Bacterial Functions0.0374350.0093581.6152830.3925080.078
Fungal Functions0.0349900.0087471.7308440.4091010.121
PERMANOVA (permutational multivariate analysis of variance) was conducted to assess the effect of groupings on microbial traits. SS = sum of squares; MS = mean square; F. Model = F-value of the model; R2 = proportion of variance explained; and Pr(>F) = p-value based on 999 permutations. Statistically significant results are considered at p < 0.05.
Disclaimer/Publisher’s Note: The statements, opinions and data contained in all publications are solely those of the individual author(s) and contributor(s) and not of MDPI and/or the editor(s). MDPI and/or the editor(s) disclaim responsibility for any injury to people or property resulting from any ideas, methods, instructions or products referred to in the content.

